Article

Success Factors of Startups in the EU—A Comparative Study

by
Eulalia Skawińska
* and
Romuald I. Zalewski
Department of Economy and Management, University of Zielona Góra; 65-417 Zielona Góra, Poland
*
Author to whom correspondence should be addressed.
Sustainability 2020, 12(19), 8200; https://doi.org/10.3390/su12198200
Submission received: 13 August 2020 / Revised: 23 September 2020 / Accepted: 1 October 2020 / Published: 5 October 2020
(This article belongs to the Section Economic and Business Aspects of Sustainability)

Abstract

:
The paper focuses on key success factors of startups in the European Union. Startup companies have a massive potential to boost the level of innovation and competitiveness of national economies. They are also uniquely equipped to provide extremely effective and flexible ways of meeting both existing and emerging market needs. However, the development of these microventures differs from country to country. Hence, we put forth a hypothesis that strategic success factors in the development of startups vary in highly developed and catching-up countries. Our main goal was to determine the key success factors of startups in the EU, and to classify the gap between developed and lagging Member States. For this purpose, we applied the method of component analysis on startup data available for selected the EU states. We managed to isolate 5 components explaining 72% of data variability, all of which can be linked to human capital as well as to formal and informal economic institutions. The results confirmed the validity of our hypothesis. We established that more developed countries offer an institutional competitive advantage to startups, while the gap in success factors between highly developed and catching-up countries can be attributed to human capital and to institutions. Based on our findings, we offer suggestions how to reduce this gap by improving formal and informal institutions via innovative public policy and by supporting education.

1. Introduction

The origin of startups can be traced back to the 1970s. This is when in developed countries small, agile, and highly innovative companies started to emerge, revolutionizing the traditional market of goods and services and the management of organizations [1]. Back then, the term “startup” referred to a few emerging high-tech microcompanies, active mainly in the field of electronics and computer technologies. These companies were challenging the hitherto theories on company and society development [2,3]. They also became the first highly specialized chain link in the development of well-known business network clusters of advanced technologies, such as IT in the Silicon Valley [4,5,6], biotech in the San Francisco Bay Area [7] and New Anglia [8], nanotech in NanoMat, Germany [9,10], or photonics in the Scottish Photonic Glen [11,12] and in the German Bayern Photonics [13]. Nowadays, there are thousands of such centers in the world, active in numerous areas of technology. Their development rate is closely tied to the progress of information and communication technologies (ICT), the Internet (e.g., 5G), the international trade in intellectual property rights, and the industrial revolution (Industry 4.0). Startups also trigger the boost of economic and social growth of states, especially after an economic [14], environmental, or epidemic COVID-19 crisis [15]. The key insight on startups in Europe and the world comes from reports issued by consulting companies (e.g., [16,17,18,19]), as well as by the European Commission [20], and individual states, e.g., Germany [21], Israel [22], Australia [23,24], India [25], Poland [26,27], or groups of states such as the Visegrád Four [28]. Such reports seek to identify the structural and quantitative development of startups. However, they are all heterogeneous in terms of determinants, theoretical and geographical scope, and methodology, making direct comparison of data impossible.
The European Union acknowledged the economic significance of startups, and in 2014 launched the Startup Europe (SE) Initiative [29] under the EU Research and Innovation Program, Horizon 2020. Its aim was to improve and expand the European entrepreneurial ecosystem through improvement of institutions and infrastructure, as well as systemic conditions relating to social capital, networks, talent, and leadership. The results achieved in this program have been published lately [30] and deliver a brief outline of the European startup landscape: “A typical SE beneficiary is an early stage, financially constrained venture that operates in the digital domain and comes from a country with limited private investments in young firms” (ibid., p. 38). The majority of companies benefitting from the SE Initiative were also found to operate on the domestic market exclusively, presumably due to the lack of know-how necessary to pursue international business strategies. As it is believed that “improving the ecosystem for startups and scale-ups in Europe will have a direct beneficial effect on jobs and growth in the EU” [31]; in 2016, the European Commission adopted another program to improve the economic and regulatory situation for startups. In total, 46 different policy actions were proposed in order to make the European policy more supportive for young enterprises, i.e., companies that had been recently created or were in the early years of their existence [31].
The existing differentiation between individual countries related not only to the business of startups but also their rate of growth, functions, sources of finance, etc. leads to the following question as a research problem: what factors shape and differentiate the qualitative development of startups, contributing to their success, reduced development, or decline in the EU? We looked for key success factors using a criterion or relying on the type of competitive advantage, its sources among many intangible exposed and presented in resource management theory. The aforementioned scientific problem has not been yet approached or identified at the research level. This paper puts forth the following study hypotheses: 1) success drivers which are strategic for the development of startups in the EU are different in highly developed countries than in the so-called catching-up or lagging countries and 2) restrictions on the development of startups in catching-up countries mainly have an institutional dimension.
The purpose of this paper is to determine key but hidden drivers behind the development of startups in EU states, examine differences and gaps related to startup development drivers, and identify the gap in these drivers in lagging states in comparison to highly developed ones. This is important for showing ways how to bridge the gap in startup development in catching-up countries, as it boosts the innovativeness of these companies, leading to an increase in the innovativeness of economies and enabling startups to gain a better position in a competitive global market. Moreover, by generating innovations for the economy, startups have an indirect influence on social development as they satisfy the needs of consumers and entrepreneurs and create new business solutions. A discussion on the presented research problem and the choice of the paper’s purpose is justified in the light of the continued existence of diversified economic structures in EU Member States and differences in labor productivity, as well as other economic efficiency measures [32]. Startups can play an important role in the improvement of the above in catching-up countries [20]. In the rationale for addressing this problem one should also stress that the state of knowledge related to startups is still low, and in particular, there is no uniform scientific taxonomy.
The authors’ contribution to scientific literature consists in the presentation of the results of pilot studies carried out using the principal component analysis and classification methods on key startup development drivers that are decisive for the success of startup businesses in European countries, with an indication of the differences between developed and catching-up countries. The recent literature did not use similar approach. Next, identification of European startups’ success factors and limitations based on eight types of competitive advantages as sources of success factors which were conceptualized (selected) from intangible resources. These results lay foundations for further in-depth research. The second part of the paper is static in nature (based on data from 2015), limited to 13 countries [33], and should be seen as a first step toward a better understanding of startup differentiation among European countries.

2. Literature Review on Startups—The Concept of Startups and Their Development

Following an analysis of literature, authors conclude that there exist a large variety of definitions given by authors and by national and international organizations, which makes it difficult to perform an in-depth analysis of success factors and business barriers for startups for a large set of the latter. Generally, one can assume that the concept of a startup appears:
  • in the area of science—primarily as a “new,” “novice,” “young,” and “temporary” company with limited own financial funds and human resources at the start, in subsequent development stages increasingly using external funds, both domestic and foreign [27,34,35];
  • in the area of management practice—most often as a business model based on innovation, breaking ground, scalability, and high rate of growth [36,37].
Detailed definitions of the startup concept also include the scope of activity of such entities, covering the type of activity in the economic and noneconomic sphere, e.g., banking, social, and public sphere (medicine, culture, education, insurance, etc.), which presently constitutes a criterion differentiating authors’ definitions. Selected concepts of this category, with key constituent elements and goals, existing in approaches of different authors and international organizations, are presented in Table 1. For explicatory purposes, we included both general/broad definitions and narrow ones, i.e., referring to specific or niche startups.
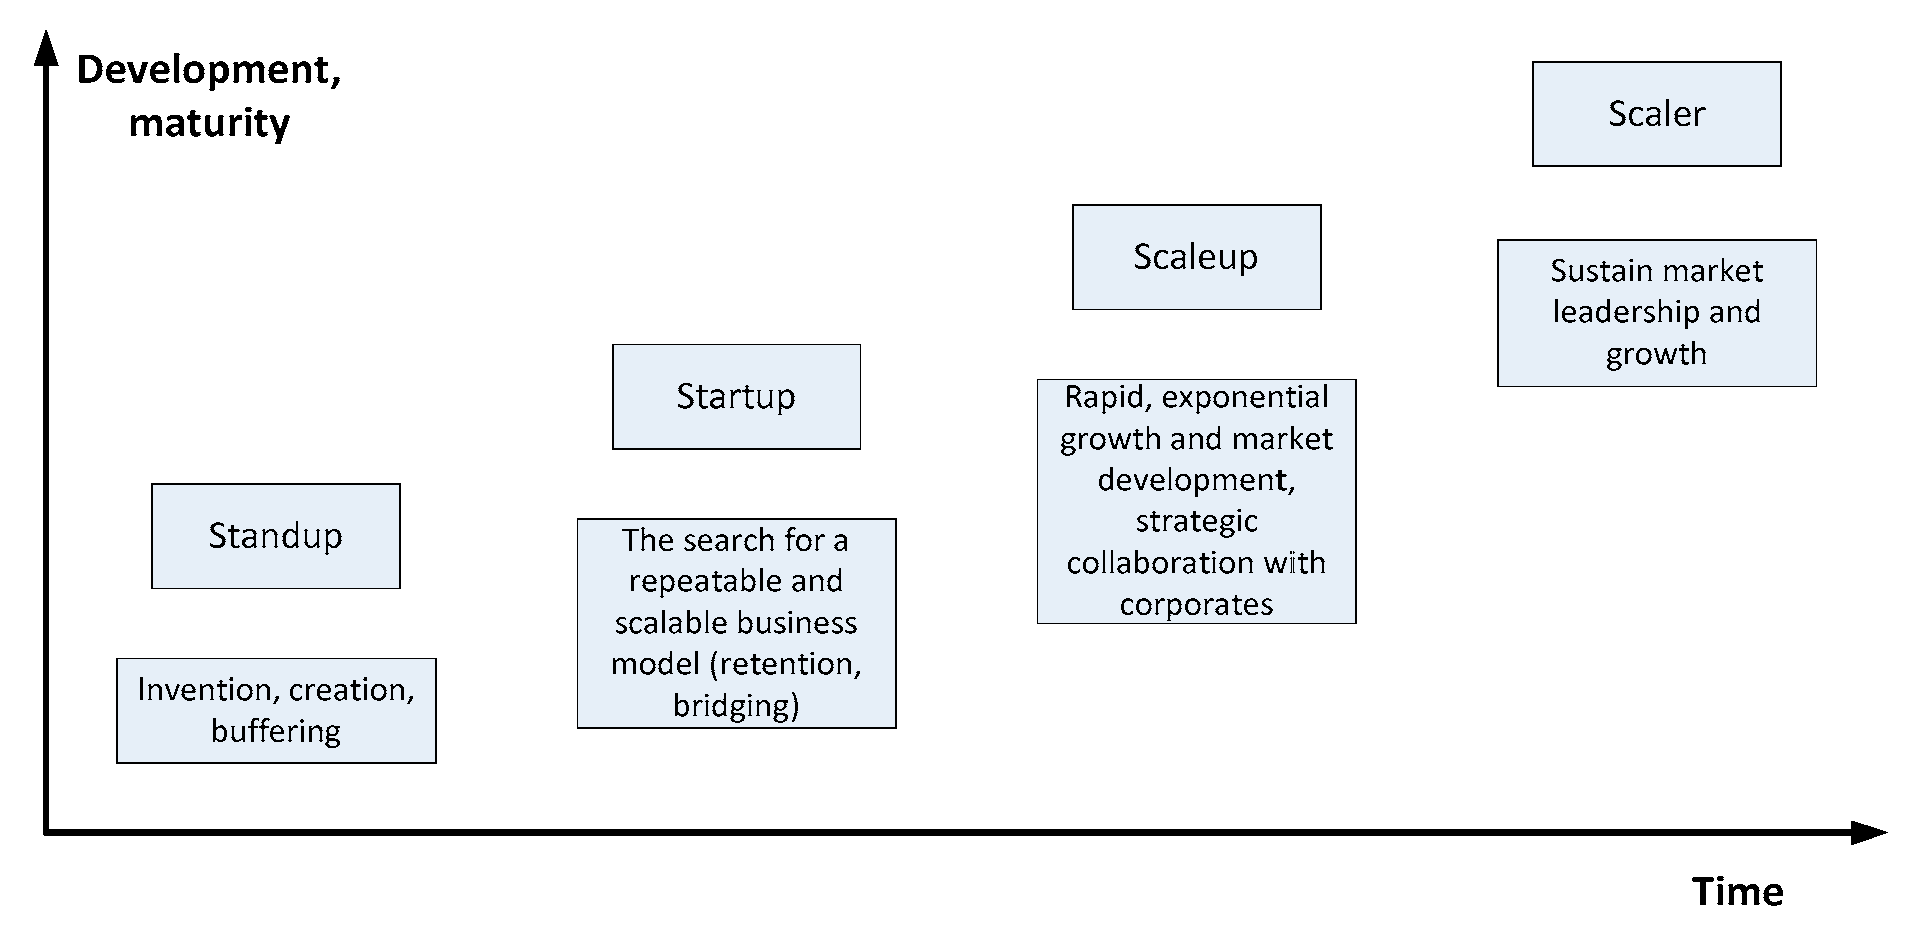
It is also important to distinguish the two different approaches to the term “startup.” Sometimes the expression is used to describe an innovative microventure from its very beginning (seed phase) up to its market maturity, encompassing the entirety of the entrepreneurial development process. At other times, it refers only to a specific development phase of ventures, occurring between other stages, as shown in Figure 1. The life-cycle of startups consists of several periods, which allow us to identify at least three categories, namely, standup, startup, and scaleup. Additionally, there is a separate category of the unicorn (scaler), with revenues exceeding EUR 1 billion [44].
Companies belonging to the standup type are created by people fascinated by the concept of discovery, an idea of closing a perceived or identified gap related to fulfilling needs of companies or consumers, or related to the streamlining of processes, e.g., “through platform-based circular innovations pursued by circular startups (CSUs), pursuing sharing/trading business models built around B2B (Busines-to-Busines), B2C (Busines-to-Customers), C2C (Customers-to-Customers) marketplaces” [46]. Possessing their own creative potential and some financial resources, these people seek personal satisfaction from creating, implementing, or commercializing innovations. Managing their company as owners, they are fully committed to making their goals come true and, at the same time, improving the well-being of others (e.g., CallPage, Apple). They are characterized by being relatively young, well educated, having a high level of social capital, and often significant experience gained in other companies [55]. Despite that, however, their ventures not always end in success, understood as high level of accomplishment of predefined goals. Studies [56] show that it depends on the type of leadership (transformational, transactional, or laissez-faire) and startup size. This is because in pursuing the business goal, startups encounter different barriers: internal (e.g., related to the financial, human, or relational capital) and external (related to markets, institutions, and other parts of their ecosystem). Especially, as they try to solve new problems in uncertain conditions. Most often this is an unidentified market, i.e., the demand and the competitive forces are unknown. However, sources of finance, the macroenvironment, as well as the capacity and skills of the company team to flexibly adapt to change, are not known [57].
The next stage of company development is the startup—a microventure, based on perfecting and selling of the previously created innovations. A startup’s overriding goal is to organize as a company and to grow company value by driving sales of new products (goods or services) through the creation and application of innovative technologies leading to a growth in productivity and increase in domestic and global market share [44].
Some startups, as a result of rapid, exponential headcount, and revenue growth transform into, so-called scale-ups [54,58,59] as illustrated in Figure 1. Further, some authors suggest [56,60] that leadership should change when a startup develops into a scale-up. Table 2 presents several illustrative definitions of such entities.
Based on the aforementioned sources, we adopted the following definition: a startup is a young, small, independent enterprise, which is creative, innovative, conducting research and development activity (R&D) to solve actual problems, and proposing prospective solutions, striving for talented employees, and sales growth, with an attractive business model. This paper also assumes a predominant, generalized view that startups are organizations based on knowledge, with a rapid revenue growth, whose subject of activity is focused on different innovations. In the EU, startups are usually managed by their founders, with only a small share being publicly listed. This share, however, is much higher in other regions. For example, in the United States, more than 45% undergo the IPO (Initial Public Offering) process [66]. In addition, for the purpose of this study, and in order to be aligned with data sources, the authors assumed that the concept of startup shall comprise all stages of company development, from its establishment up to maturity inclusively [33].
Since there is no consistency in the methodologies used to conduct research generating data and the data available is mainly narrow in scope and time reference, the knowledge on startups is still fragmentary. It should be stated that there is a research gap in literature related to key factors of success of startup development in EU national regions. In order to provide more insight into the competitiveness of startups in the EU, and at least to some extent close that gap, we used a multivariate statistical analysis of data characterizing startup features available for a set of EU countries. The empirical study used data from 2015 for 12 EU Member States, and for Israel, a country associated with the EU with a very significant qualitative and quantitative development of startups, mainly hi-tech [33], from the European Startup Monitor (ESM 2015). The research process used the following order:
  • preparation of a general characterization of companies’ competitive advantages and their sources in the light of resource-based theory,
  • usage of the concept of sources of competitive advantage to identify startup key success factors, against the backdrop of contemporary management paradigms,
  • application of a multivariate statistical analysis performed on data sets on various startup features in 13 countries from the European Startup Monitor 2015 [33],
  • interpretation of startup competitive advantage and success factors in European countries and gap in this advantage in catching-up countries, in comparison to highly developed ones,
  • presentation of ways of bridging the gap in institutional factors and in human capital in catching-up EU countries, explaining the barriers for startup development.
In conclusion, the structure of the article is a consequence of five chapters according to the analysis of logical thinking. It contains a theoretical and practical part.

3. Startup Key Success Factors

In order to reduce the research and cognitive gap on factors contributing to the emergence and development of startups, the authors applied a methodology approach that that uses literature and a typological method recommended in it. The authors assumed (after Grunert and Ellegard) [67] key success factors should be sought for among types of startups selected on the basis of a specific criterion, due to their diversity in different areas of activity. Similar approaches are proposed [67,68] with respect to startup business models, due to them being very diversified and not very specific. The achievement of company goals must be supported by success factors, which in turn must be aligned with the goals. Furthermore, the investigated definitions mention more than 15 attributes and features.
A company’s measurement of success is competitive advantage, which means that for the company to develop it needs to succeed. Consequently, it was assumed that types of companies will be categorized using as the criterion their competitive advantage and its source. In the resource-based view of strategic management theories, competitive advantage stems from key tangible and nontangible factors. However, since 1990s, attention to cost and quality is a commonly prevailing requirement [69], pp. 89–90, for companies participating in the competition process, as is their drive to obtain a competitive advantage related to cost and quality. These advantages come mainly from tangible factors, which do not explain the phenomenon of the development of startups and their success in the competition process. Startups use mainly intangible factors already in the first stage of operations. Hence, below, we highlight company competitive advantages and their sources among intangible factors, pointed up by resource-based theories [70] (pp. 99–120) [71,72], including the advantages of competence [73] and distinctive capabilities [74], p. 185. In the 21st century, from this perspective, competitive advantage in the market is achieved by companies mainly through the possession and application of distinctive and unique intangible resources and skills to satisfy market needs faster and in a better way than competitors.
The effectiveness of a startup’s initial operations and its success depends on the idea for a product, its quick creation, checking response of the potential target group, measuring quality, drawing conclusions to streamline the product, and transition into the next development phase [75]. The sequence of these actions is modeled after Deming’s PDCA (Plan–Do–Check–Act) cycle [76] and should be reiterated until a high-quality product is obtained, by continuous improvement of quality and usability and reduction in errors and waste in production and supply chain. This remark applies not only to the initial but also to all life-cycle phases of startups. This rapid iteration allows teams to discover a feasible path towards the product/market fit and to continue optimizing and refining the business model after reaching the initial product/market fit [75]. This is supported by several studies showing gradual change “through serendipitous events” [77] or legitimized and embraced through a gradual change process culminating in radical innovation [78,79].
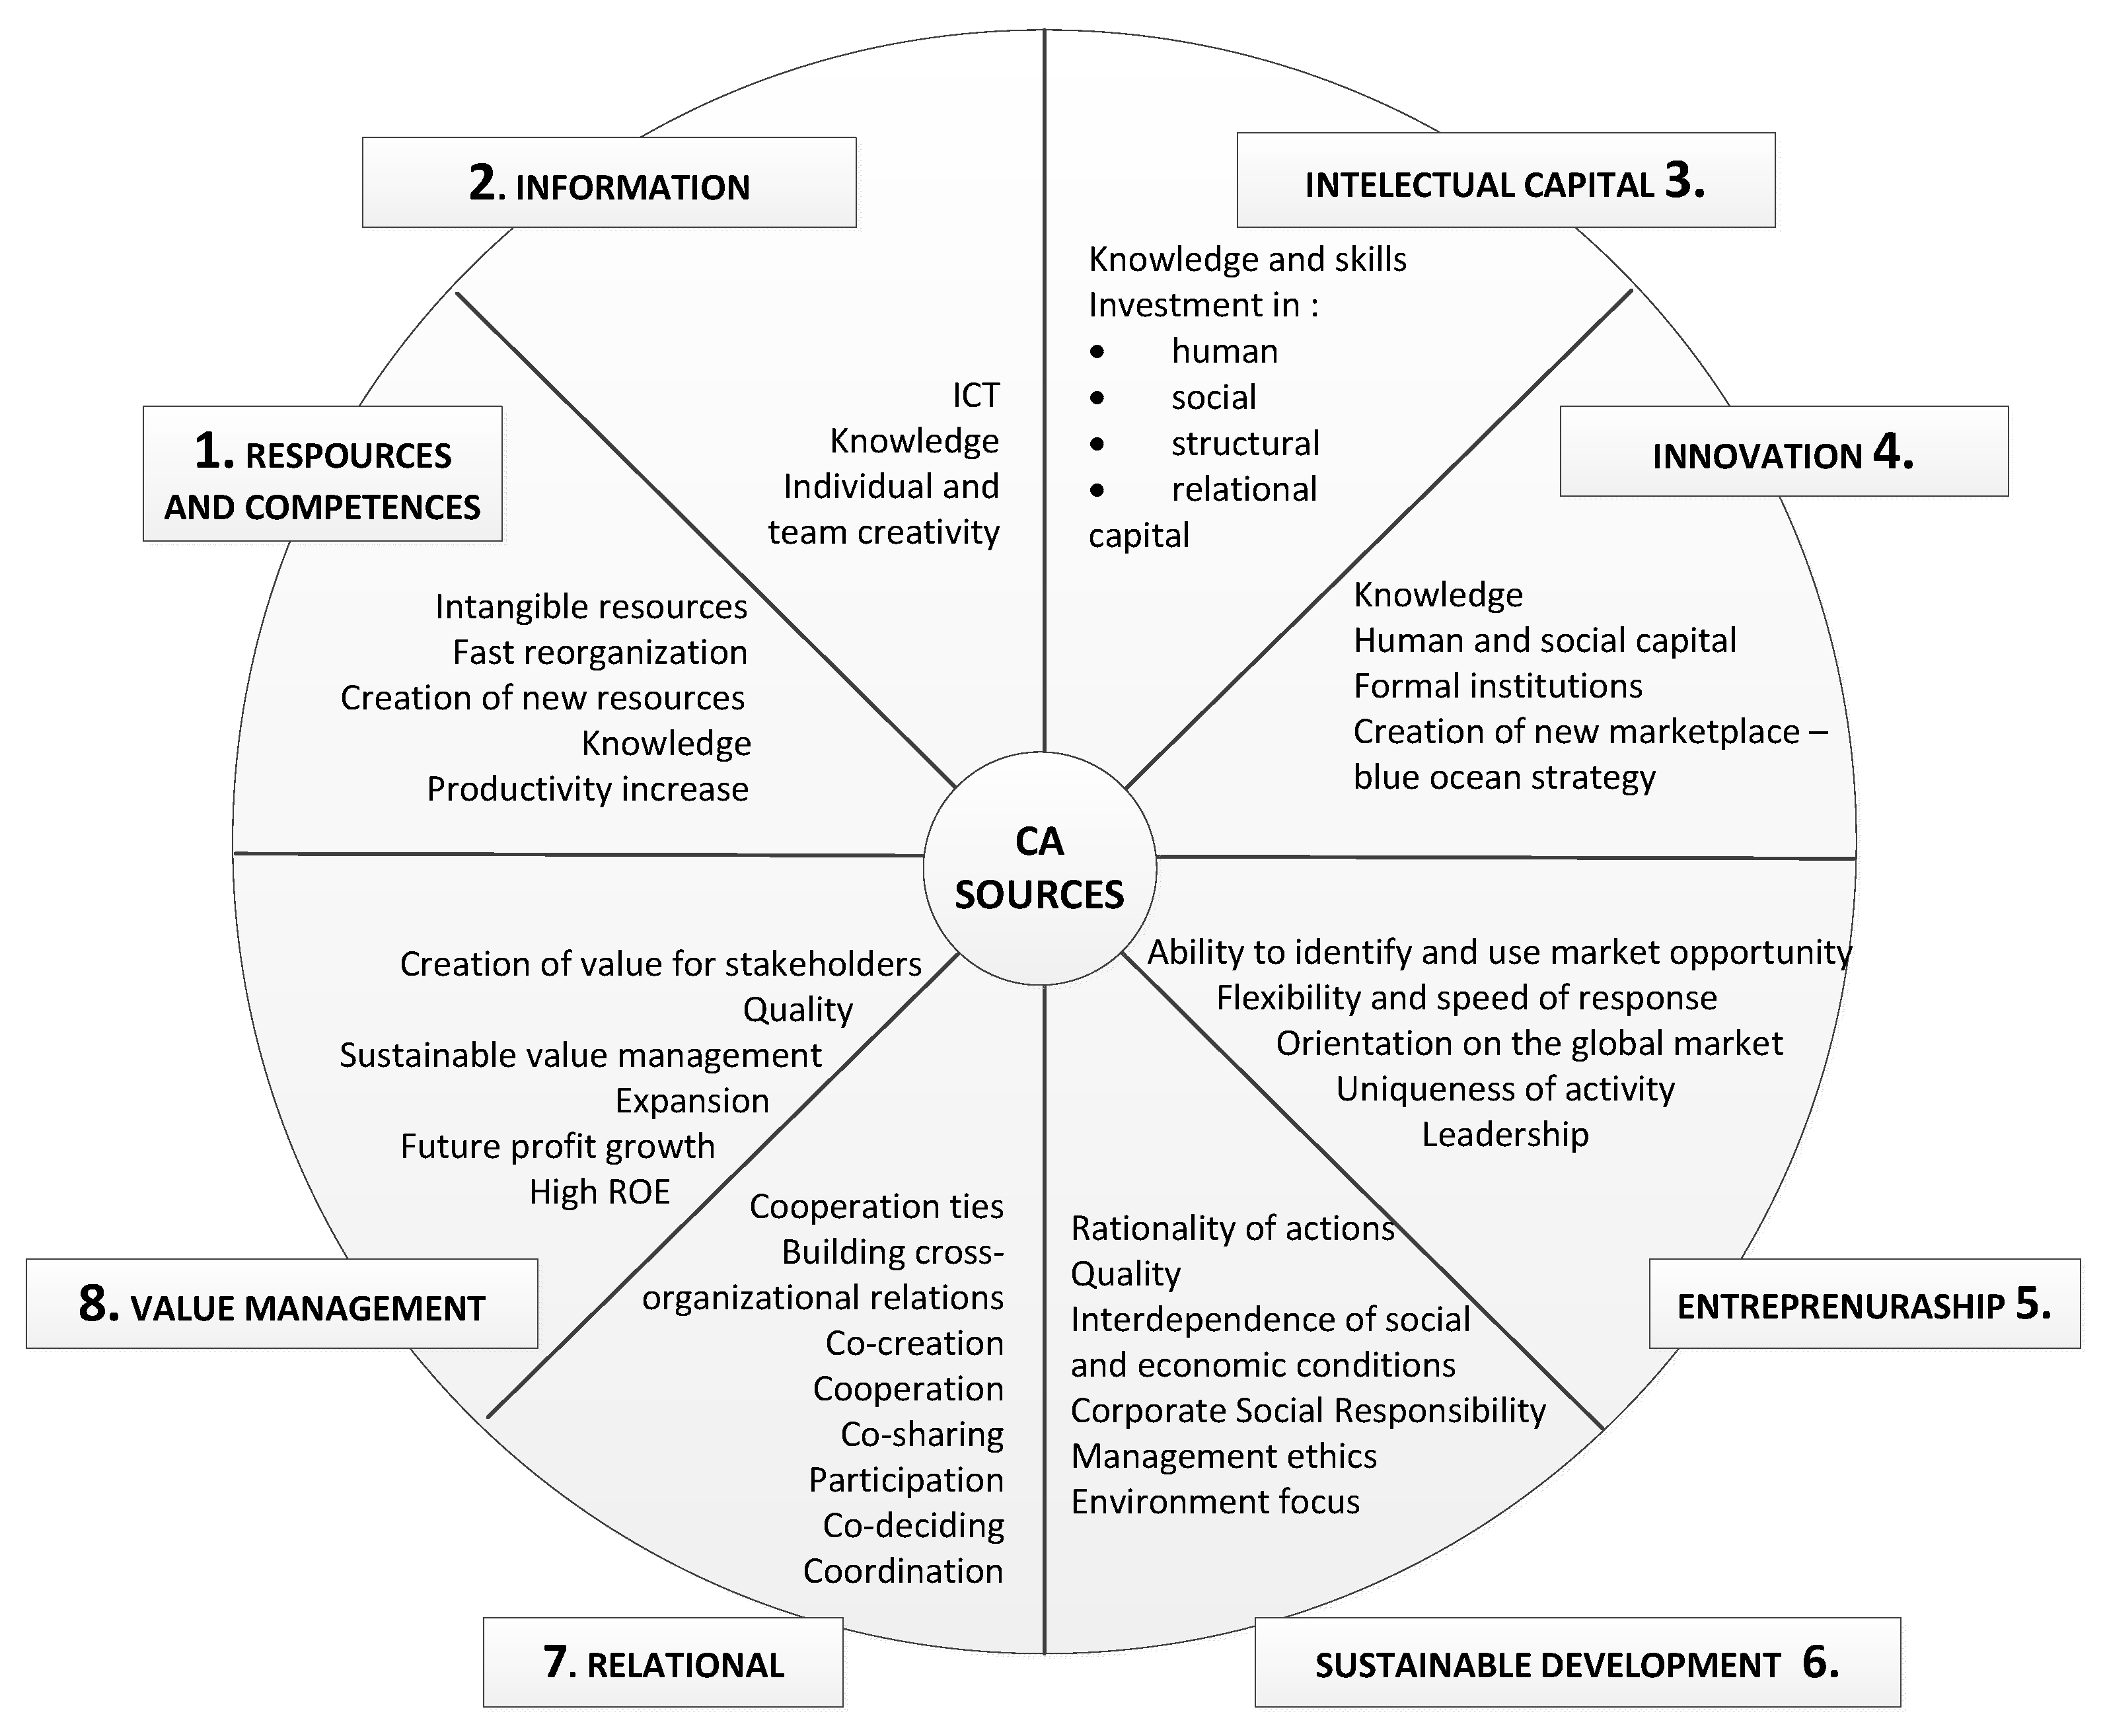
In the absence of a uniform scientific theory on the sources of startup competitive advantages, our first step was taking stock of competitive advantages (CA) of contemporary companies as worded in scientific works and identification of key sources used in the creation of such advantages. Following that, on the basis of collected definitions of startups and literature, we singled out key sources of these companies’ competitive advantages. The results of this analysis are shown in Figure 2. It shows eight types of startups by types of competitive advantages and their key sources as success factors resulting from intangible resources. The following are the advantages: innovation [80,81], entrepreneurship [82,83,84], resource and competence [85,86,87], intellectual capital [88,89,90,91], sustainable development [92], relationships [86,93,94], value management [95], and information [96,97].
The quoted literature mentions the authors of these advantages. However, the sources that create them evolve and their identification over a specific time requires representative empirical research. The success factors presented in Figure 2 are extracted from the basic scientific literature cited on page 7. Its task is to identify the most important groups of factors and give them “labels”—in this case, eight.
It was not our intention to make meta-analysis of literature, as it is a separate task. It is clear that the list of success factors of different intensity (weight) will be much wider.
Figure 2 shows that contemporary sources of competitive advantages are rooted in both startup ecosystem. Some sources of competitive advantages exist in all eight types, forming the basis for market success. They include, in accordance with endogenous growth economics, knowledge, human capital, and technological progress, as factors largely dependent on firms. This highlights the overriding role of intellectual capital. Among external independent factors are listed public policy institutions of the EU and individual states that lay down the economic, innovation, internationalization, and social conditions for startups. The interaction of internal and external sources leads to the creation of a key advantage among many competitive advantages. The authors sought confirmation of conclusions from the theoretical analysis in the next part of this paper (parts 5 and 6) by performing pilot studies.

4. Data Set on EU Startups

As we have mentioned before, there is no systematic data on startups for all European countries. Presently, the most comprehensive data sets are included in the European Startup Monitor (ESM), periodically gathered by research institutions on behalf of the EU. In the following empirical analysis, we used data from the 2015 European Startup Monitor [33], as the most recent available source of raw data. ESM 2015 is based on information from 2365 startups located in the European Union and Israel. It includes only startups younger than 10 years, using innovative technologies and/or business models and having or striving for a significant employee and/or sales growth. Unfortunately, in some countries, the number of responding startups was small which prevents the creation of a sufficiently large sample. For that reason, we limited our analysis to data from 13 countries: Germany, France, Italy, Poland, Spain, Romania, Austria, the Netherlands, Belgium, the Czech Republic, Sweden, the United Kingdom, and Israel (as an associated country). The mean values for the abovementioned countries were available as well. The survey consists of six chapters, which are highlighted in Table 3. Each chapter contains several questions, which we used as variables. To evaluate them, three scales were used: average (e.g., the average age of a startup or the average number of founders), the percentage of fractions (e.g., current markets on which startups generate revenue, e.g., the country of origin, European countries, or worldwide), and a ranking of 1–6 (1–very bad and 6–very good). Table 3 presents the symbols of 33 variables selected from the data source and their full description as used in this paper. For reasons of simplicity, for two-variant variables (e.g., woman/man), we used only one of them (e.g., M). For n-variant variables (e.g., age range and current business situation) n−1 variants were used (with the last value omitted to avoid redundancy). In the case of a few variables, boundary variants were combined. Variables were put in order of their appearance in the European Startup Monitor.
The data for 13 countries (including Israel) and the average for the EU (ESM) and 33 selected variables form a data matrix of 14 rows (for countries) and 33 columns (for selected variables). The variables are expressed in different units and have different mean values and standard deviations. Thus a normalization to a common scale was required before further analysis. For each variable X from 1 to n = 33, we used the standardization
( X 1 n   X 1 n ,   m e a n ) / s t d 1 n ,
which converts the real values of the variables to a common scale with the mean equal to zero. In this way, we can bring exceptional behavior to light, i.e., an above-average performance of a given indicator yields higher scores than consistent average scores across all indicators.

5. Results

5.1. Principal Component Analysis (PCA)

For years, PCA has been applied in various sciences to extract the dominant patterns in a data matrix in terms of a complementary set of scores (in our case characterizing the countries) and loadings (in our case for variables) [98,99]. In this paper, a standardized data matrix was used with a Varimax normalized rotation in the Statistica 13 software (TIBCO, Palo Alto, CA, USA). Five components contributing to total data variability of 72.43% were selected for further analysis (Table 4). The remaining, less pronounced nine components, were omitted in further analysis, because each added less than 5% to the explanation of the variability.
Mutual correlations between 5 extracted components are shown in Table 5. There are weak correlations between components 1 and 4 (r = 0.3850) as well as between 3 and 5 (r = 0.3760). The remaining components show negligible relationships.
Score values for three independent components for all selected countries are shown in Table 6. Presented data will be used further while discussing classification. Component loadings of five most important components for all variables are shown in Table 7. As commonly used in practice [98,99], values >|0.7500| were used for further analysis and were printed in bold italics for better visibility in the body of the table. This procedure makes it easier to follow the discussion below on the nature of these components.
The first component loading values fulfill the desired magnitude of <|0.750| in the following variables: founder resident (3–FR) and employee residents (16–EC%) with a negative sign, founder number from EU countries (17–FEU), number of employed students (18–STU), and social advisory support variable (23–SAS) with a positive sign. The first component explains 23.27% of the total variability in the data set. In our opinion, the first component loading characterizes access to, and the value of, human capital. We can observe a fairly good linear relationship (correlation coefficient R = −0.73) of the first component scores values for individual countries (see Figure 3) with the data on access to human capital (HC) subindex in the Scale-up Index developed by Van Roy and Napelski [100], p. 30. This index is composed of seven subindices: culture and institutions, access to human capital, creation of knowledge and networking, market conditions, access to finance, tax and regulations, and infrastructure. A somewhat similar index has been developed for startup ecosystems in large European cities [101,102]. These constituents reflect the conditions at a national level, which provide fertile ground for the growth of entrepreneurial and startup activity in Europe. Figure 3a shows that Central Eastern European countries (Romania, Poland, and the Czech Republic) and Southern European countries (Italy and Spain) are positioned relatively close to each other, having lower levels of the human capital Index (HC). Very similar relationships were observed for different scales of human capital [103,104] or human resources (H RES) [105]—presented in Figure 3b This means that there is a high potential for growth in the catching-up countries via the improvement in variables 16, 17, 18, and 23 (compare Table 6B), which constitute the first component.
In addition, a relatively high component value of 0.62 for variable 21 (“business situation good”) suggests that the business situation is promising and supports the supposition of great account of human capital on startup development.
The second component F2 is a composition of five variables: the world market (11–WW), evaluation of national governments (27–EG), politicians (28–SP), universities (29–UNIV), and school systems (30–ESS), with all positive loadings of a high magnitude close to 0.9000. This factor explains 16.11% of the variability of the data. In our opinion, the second factor reflects the quality of formal institutions, e.g., governmental or regional, and the impact of formal education. This opinion was verified by a fairly linear relationship with the Scale-up Index T–R (tax and regulation) developed by Van Roy and Napelski [100] Figure 16, p. 35 (Figure 4). As we established, trust and confidence of startups’ founders and employees in national governments increase startups potential on the market. This can be also said about trust in the legal system [106] or trust in the political system [107]. Figure 4b shows the relationship between F2 and the indicator “trust in the legal system” (TLS).
Two variables dominate the third component and explain 14.99% of total data variability. Both variables are connected with operations on the domestic market (9–HC), with a positive component value loading, and on the European market (10–EC), with a negative one. The component shows clearly that many startups in countries with larger populations focus primarily on their strong domestic markets. In contrast, startups in smaller countries tend to focus on external markets, either European or overseas markets. We observe (Figure 5) a fairly good linear relationship of the third-component scores values for the individual countries with the MC (market condition) in the Scale-up Index [100] (p. 29). Negative values of both F3 loadings and MC parameters dismiss Romania from remaining countries as an outlier. Figure 5 illustrates that Central Eastern and Southern European countries have worse market conditions than others; however, their competitive power described, resulting from variables 9 and 10, is comparable to British or French startups.
The fourth component explains 9.41% of the data variability and is composed of two variables with high loadings of opposite signs. The positive one was found for variable 5-FW3 concerning mature founders aged between 35 and 54. We interpret this result with experience, prudence, and business knowledge being very valuable assets for the evolution and development of startups. This explanation is supported by the negative sign of the variable 4–FW2, concerning younger founders aged between 25 and 34 with a loading of −0.63. The variable 1–A (the average age of a startup), with a loading of 0.66, adds to the argument that more experience is gained from long-lasting startups. Scientific literature provides solid evidence that the failure rate of startups, attributed to lack of experience of founders and staff, is as high as 75–90% e.g., [108,109,110,111]. Negative loading for the business to business variable (8–B2B) may indicate that many startups serve other businesses as co-operating firms. Loading for the business to customer variable (7–B2C) amounts to 0.62 and is lower than 0.75, however, may indicate the trend of serving individual customers.
Unfortunately, all loadings in the fifth component are below 0.7500. However, loadings of a magnitude between 0.50 and 0.60 for certain variables can still offer some valuable information. For example, the loading of the variable 26–SS (social support expectations) and 24–PRB (political regulation, bureaucracy) indicates some problems occurring in person-to-person or person-to-authority relationships. Moderate values of loadings for variables 12–IP (internationalization planned) and 20–NEC (no external capital planned) indicate the intention to use internal financial resources for the development of the startup. In addition, moderate and positive values of loading variables 13–EN (employees’ average number), 14–EF (employees’ average number with founders), and 15–EP (employees’ number planned) indicate a tendency for the startup growth in the direction of scale-ups based on more experienced staff and higher headcount.

5.2. Classification of Countries

In the cluster analysis of countries, we applied the standardized data matrix used in the factor analysis (point 3) described above. Ward’s nearest neighbor chain algorithm has been used based on the Euclidean distance in a multidimensional space. Figure 7 presents the results in the form of a diagram tree. Most countries join together, forming five neighbor pairs at a distance range of 3 to 5.5 in multifactorial space. These pairs of neighbor countries find their next neighbor (e.g., single country) and form a triple structure at a longer distance. Alternatively, two couples or groups rather close in the space join together. The smaller the distance of a pairing, the stronger the similarity of the paired countries. Finally, we can observe that two groups of countries join together at the distance of 8.2. (Figure 6).
We can observe that the structure of German startups (D) is most similar to the European Startups Mean (ESM). Spanish (SP) and Italian (IT) startups form a pair and join next with a pair of French (FR) and Polish (PL) ventures. At a longer distance to this group of countries, we can observe the connection of Israel (IL) and, finally, of Romania (RO). Israeli startups differ from German, Spanish, Italian, French, and Polish startups as well as from the ESM. Romanian startups differ dramatically from all the others. In a similar way, we can analyze the pattern of clustering for the remaining countries in the second group of nations.
In addition, we can observe the proximity of countries in the space created by three score values S1, S2, and S3 (Table 6A) extracted from the PCA. The three-dimensional Figure 7 presents the distribution of all countries in the sample. Here, we can distinguish two groups of countries: A and B. In each of them, we can find startups from more developed countries and those from catching-up ones. Again, a high proximity of countries means a higher similarity in the nature of a startup and in its activity. Countries which form the group A have higher S3 values distributed obliquely between Germany (DE) with S3 as high as 4.99 and Romania (RO) with S3 value as low as −1.18. Countries of group B have scattered distribution on the surface SS1–S2 forming ellipse and having similar values of S3. The third component in Figure 3 divides the countries into two subgroups and denominates outliers. The high value of the first component separates Romania from the other countries in group A, whereas the high value of the second component separates the Czech Republic in group B.
The above analysis proves that institutions and human capital form a significant factor differentiating startup development. Therefore, to provide an explanation for the gap in startup development in economically weaker EU countries, we present an assessment of institutional factors for the analyzed countries in the light of neoinstitutional economics.

6. Gap in the Quality of Institutional Factors and Human Capital between EU States

Many economists stress the importance of institution analysis in the processes of developing the competitiveness of companies [112,113,114]. A growth in the number of competing companies, like startups, requires the establishment of new institutions and a continuous improvement of existing ones [113] in a direction that will drive startup competitive capabilities. Assuming after D.C. North [115] that institutions are divided into formal (codified) and informal (soft) ones, what follows is the state of institutions in analyzed countries.
Institutions, being an external factor of startup development, can be a source of their competitive advantage or a barrier in different European countries. This is determined by the quality of such institutions [116]. For example, Woodside et al. [117] point to the significant role of such institutions as the government, education, R&D, corporations, community, and foundations. On the other hand, others underline the significance of institutions as being regulatory, normative, and cognitive [118,119]. Still others enumerate in detail different formal institutions within legal and administrative frameworks and within informal social institutions, which highlight culture and social capital [120]. Institutions shape rules of social behavior as rules of economic game of business entities and sociopolitical interactions [115]. In the case of formal institutions, it relates, e.g., to ownership, financial market, and labor market regulation mechanisms, i.e., monetary, fiscal, and insurance policy. According to G.C. North [115], what plays a significant role here is the constitution, resolutions, acts of law, directives, decisions, guidelines, regulations, and codes. Transparent and stable formal institutions help close the gap of social and economic development between catching-up countries and highly developed ones by reducing uncertainty in making decisions and by decreasing transactional costs of individual companies [121,122]. The condition for the effectiveness of these institutions is their flexible adaptation to changes in the environment, transparency, common acceptance, and adherence to their rules [123].
The quality of such institutions by country can be evaluated indirectly, e.g., on the basis of the following indicators: ease of doing business (EDB) [124], Corruption Perception Index (CPI) [125], and Index of Economic Freedom (IEF) [126]. The indicators given in Table 8 are the average of 10 subindicators having the same weight, on a scale of 1 to 100 (highest level). They clearly show a higher quality of these institutions in highly developed countries (the United Kingdom, Sweden, Germany, Austria, and the Netherlands), in comparison with catching-up states (Romania, Poland, Czech Republic, and Italy). Consequently, the institutions create there a better base (context) for startup ecosystem development understood by Porter [127] and Isenberg [128] as business environmental conditions. The first indicator—the ease of doing business—improved in the studied period of 5 years in all 12 European countries and in Israel, however, to different degrees, and stayed flat only in Germany. The second one—CPI (lack of corruption)—increased in Austria, Italy, Spain, and in the Czech Republic, deteriorating in all other countries. This means that despite the fight with corruption in public and economic life, there has been a deterioration in its effectiveness in EU countries in question. The third one–IEF (index of economic freedom)–declined only in Spain, improving in all other countries.
The above observations show that the formal institutions’ quality gap reflected by the above indicators between more developed and catching-up EU states is maintained, which in turn does not improve the ecosystem of startups in the latter ones. Developing common policy for innovation growth, both on the national and EU level, requires coordination, in order to secure that each member country is in the same situation, e.g., regarding taxes. The creation of innovations and their use depends on the state’s innovation policy that uses instruments of direct and indirect influence. In the first case, these include loans and outlays on R&D, whereas in the second case, these are instruments, which aim at institutions of the business environment (ecosystem), help in the commercialization of results of innovations, and cooperate with the sector of science (e.g., subsidies, grants, programs, innovation vouchers, etc.). This ecosystem provides training, consultancy, and information services for startups. However, the stability of the ranking positions of European countries on the European Innovation Scoreboard between 2010 and 2019 shows that in less developed countries, innovation policy has been ineffective and probably implemented too narrowly. Suggestions for efficient innovation policy actions regarding regional aspects has been offered by Camagni and Capello [129]. They believe that “Regional innovation paths strongly depend on territorial elements rooted in the local society, its history, its culture, and its typical learning processes” [129], p. 362. “The territorial innovation patterns concept stresses complex interplays between phases of the innovation process and the territorial context” [129], p. 368. This means that the innovation policy-makers in the lagging countries have to consider the national and regional predispositions. Although, generally, it should be intensified and broadened by incentives boosting the role of innovation instruments (e.g., technology relief, employment of creative, high-salaried employees, assistance in obtaining grants, support of so-called business accelerators etc.), the most effective policy actions might vary from country to country [130].
The institutional gap that continues to prevail in catching-up countries is closing, albeit slowly, which is due to small but progressing changes related to:
  • facilitation in running a company (obtaining permissions, access to loans, investor protection, reduction in the risk in obtaining resources, etc.),
  • labor market (more staff using flexible forms of employment and increase in minimum wage),
  • ownership (protection against eviction, loss, etc.),
  • freedom of trade (lower government interventions).
These results are partially confirmed by other authors’ studies, who write: “we observe a weak positive trend regarding social trust as well as subjective well-being over time, but no significant change in institutional trust. However, trends are far from homogeneous across countries” [131].
A similar conclusion can be drawn with regard to the connection between startup development and human and social capital. Both these capitals are complementary in nature [132]. They can stimulate or restrict technological and organizational progress in a given country. The influence of these capitals on investment growth, professional activity, entrepreneurship, and company innovation is well documented in literature, e.g., [133,134,135]. We assume the concept of social capital in two forms: individual (personal) and collective (group based on relations). In the shaping of both forms of this capital, one can see the influence of human capital understood as the body of knowledge, skills, competencies, experiences, and motivation determining people’s capacity to work [136]. Social capital, on the other hand, according to Ostrom is collective knowledge, understanding, norm, rules, and expectations with regard to interaction models, which are contributed by groups of individuals to a recurring activity [137]. According to the World Bank, an important role in social capital is played by its dimensions, e.g., trust, credibility, cooperation, and values [120].
Conversely, De Vaan et al. [138] find “…that social capital defined as a regional characteristic, discourages entrepreneurship in a new and contested industry.” The argument follows the logic that high levels of social capital reinforce conformity in values and ideas, and inhibit deviant entrepreneurial activity. Once an industry becomes more legitimized—as a result of an increase in the number of firms present in a region—social capital becomes less restrictive on entrepreneurship and can even have a positive effect on the subsequent number of firms founded in a region.” However, for social capital to be able to effectively deliver economic functions, it must represent a specific level. The state of this capital in researched countries, including human capital, is presented in Table 9, in the context of indicators and formal institutions.
In the case of social and human capital institutions, as evident from the data in the table above, there is also a gap between developing and highly developed countries. This points to the necessity of changes in the catching-up countries in these formal institutions, which can bridge this gap. These changes refer to quality improvement of legislation towards greater political pluralism, civic participation, freedom of speech, economic freedom, independence, and social trust. The legal system can be seen as a tool for building relations between people in a given country, shaping their value systems, and fostering market institutions (agreements). Legal regulations created by the state, as well as the effectiveness of the government [141], political stability, and quality of the regulatory sphere [142] all have impact on social trust to the state and influence the development of cooperation ties or lack thereof [143,144]. This opinion is supported by research results made by Seunghwan Myeong and Hyungjun Seo [145], who studied, in particular, relations between bridging and bonding capital and trust.
Furthermore, Ponzetto and Troiano [146] point out that “social capital increases economic growth by raising government investment in human capital. Countries with higher social capital spend a higher share of output on public education.” Consequently, the state has influence on the education system. Education plays an important role in the creation and development of such social capital designates as empathy, trust, solidarity, self-discipline, and cooperation [147]. The results of a meta-analysis [148], p. 454, “lend support to the argument that education plays a crucial role in the generation of social capital. Further analysis confirms the existence of a relative effect of education on social participation, and of a reciprocal mechanism between the dimensions of social capital.” Having influence on the organization of general and university schooling, the state shapes the quality and level of education, e.g., [149,150], as well as dimensions and attributes of social capital. According to global research, a low level of social capital is prone to produce corruption and nepotism at the meeting point of power and business, which also leads to a deficit in morality, low levels of trust to state organizations, and depreciation of other social capital attributes [117,151]. Thus, the last authors draw the following research conclusion: “(…) Entrepreneur strategy implications include the observation that actions nurturing firm startups by nations low in entrepreneurship will unlikely to be successful without reducing such nations’ high levels of corruption.”
Consequently, the state has an important role to play in the shaping of startup ecosystems. The shortcomings in social capital and other informal institutions leading to no noteworthy competitive advantages in catching-up countries is a factor limiting the development of startup firms. The current state of the institutional system in these countries is not very attractive for innovative companies. This stems from an excessive number of regulations governing businesses, bureaucracy, low level of trust, and a slowdown in structural changes in such economies. This opinion is supported by the results of Paolo Pasimeni’s [152] analysis. In his research, he included “formal institutions through the concept of good governance, whereas informal institutions are included through the concept of social capital as a trust.” Similar opinions were expressed by other authors [153,154].

7. Conclusions and Outlook

In order to determine the development of startup competitive potential one needs to identify not only the characteristic features of startup businesses but also, first and foremost, their key success factors.
This paper discusses startups from the perspective of the competitive advantage criterion. In the resource-based view of strategic management theories, it is assumed that this advantage results from key tangible and nontangible resources (factors). On the basis of literature analysis and recognized definitions of startups, eight types of competitive advantages were systematized as success factors, namely, innovation, entrepreneurship, resource, competence, intellectual capital, sustainable development, content management, and information advantages. It was also assumed that there are differences in the situation in catching-up and better developed EU Member States.
In order to investigate the key success factors of startups in the EU, we analyzed data from the 2015 European Startup Monitor, selecting 13 countries with a sufficient number of respondents. A limitation of the analysis is the number of countries included in the 2015 ESM set. Studies conducted in later years (ESM 2018) included a larger number of European countries, but the number and variation of variables (variables) were significantly limited in substance and incomparable. In our opinion, startup organizations at European level should develop a single and stable research tool. It will make it easier to compare progress and diversification across countries. It can be useful in the development by the European institutions of startup development program aimed at countries and/or economic sectors (e.g., circular economy, green-, bio-, nanotechnology, and ecology).
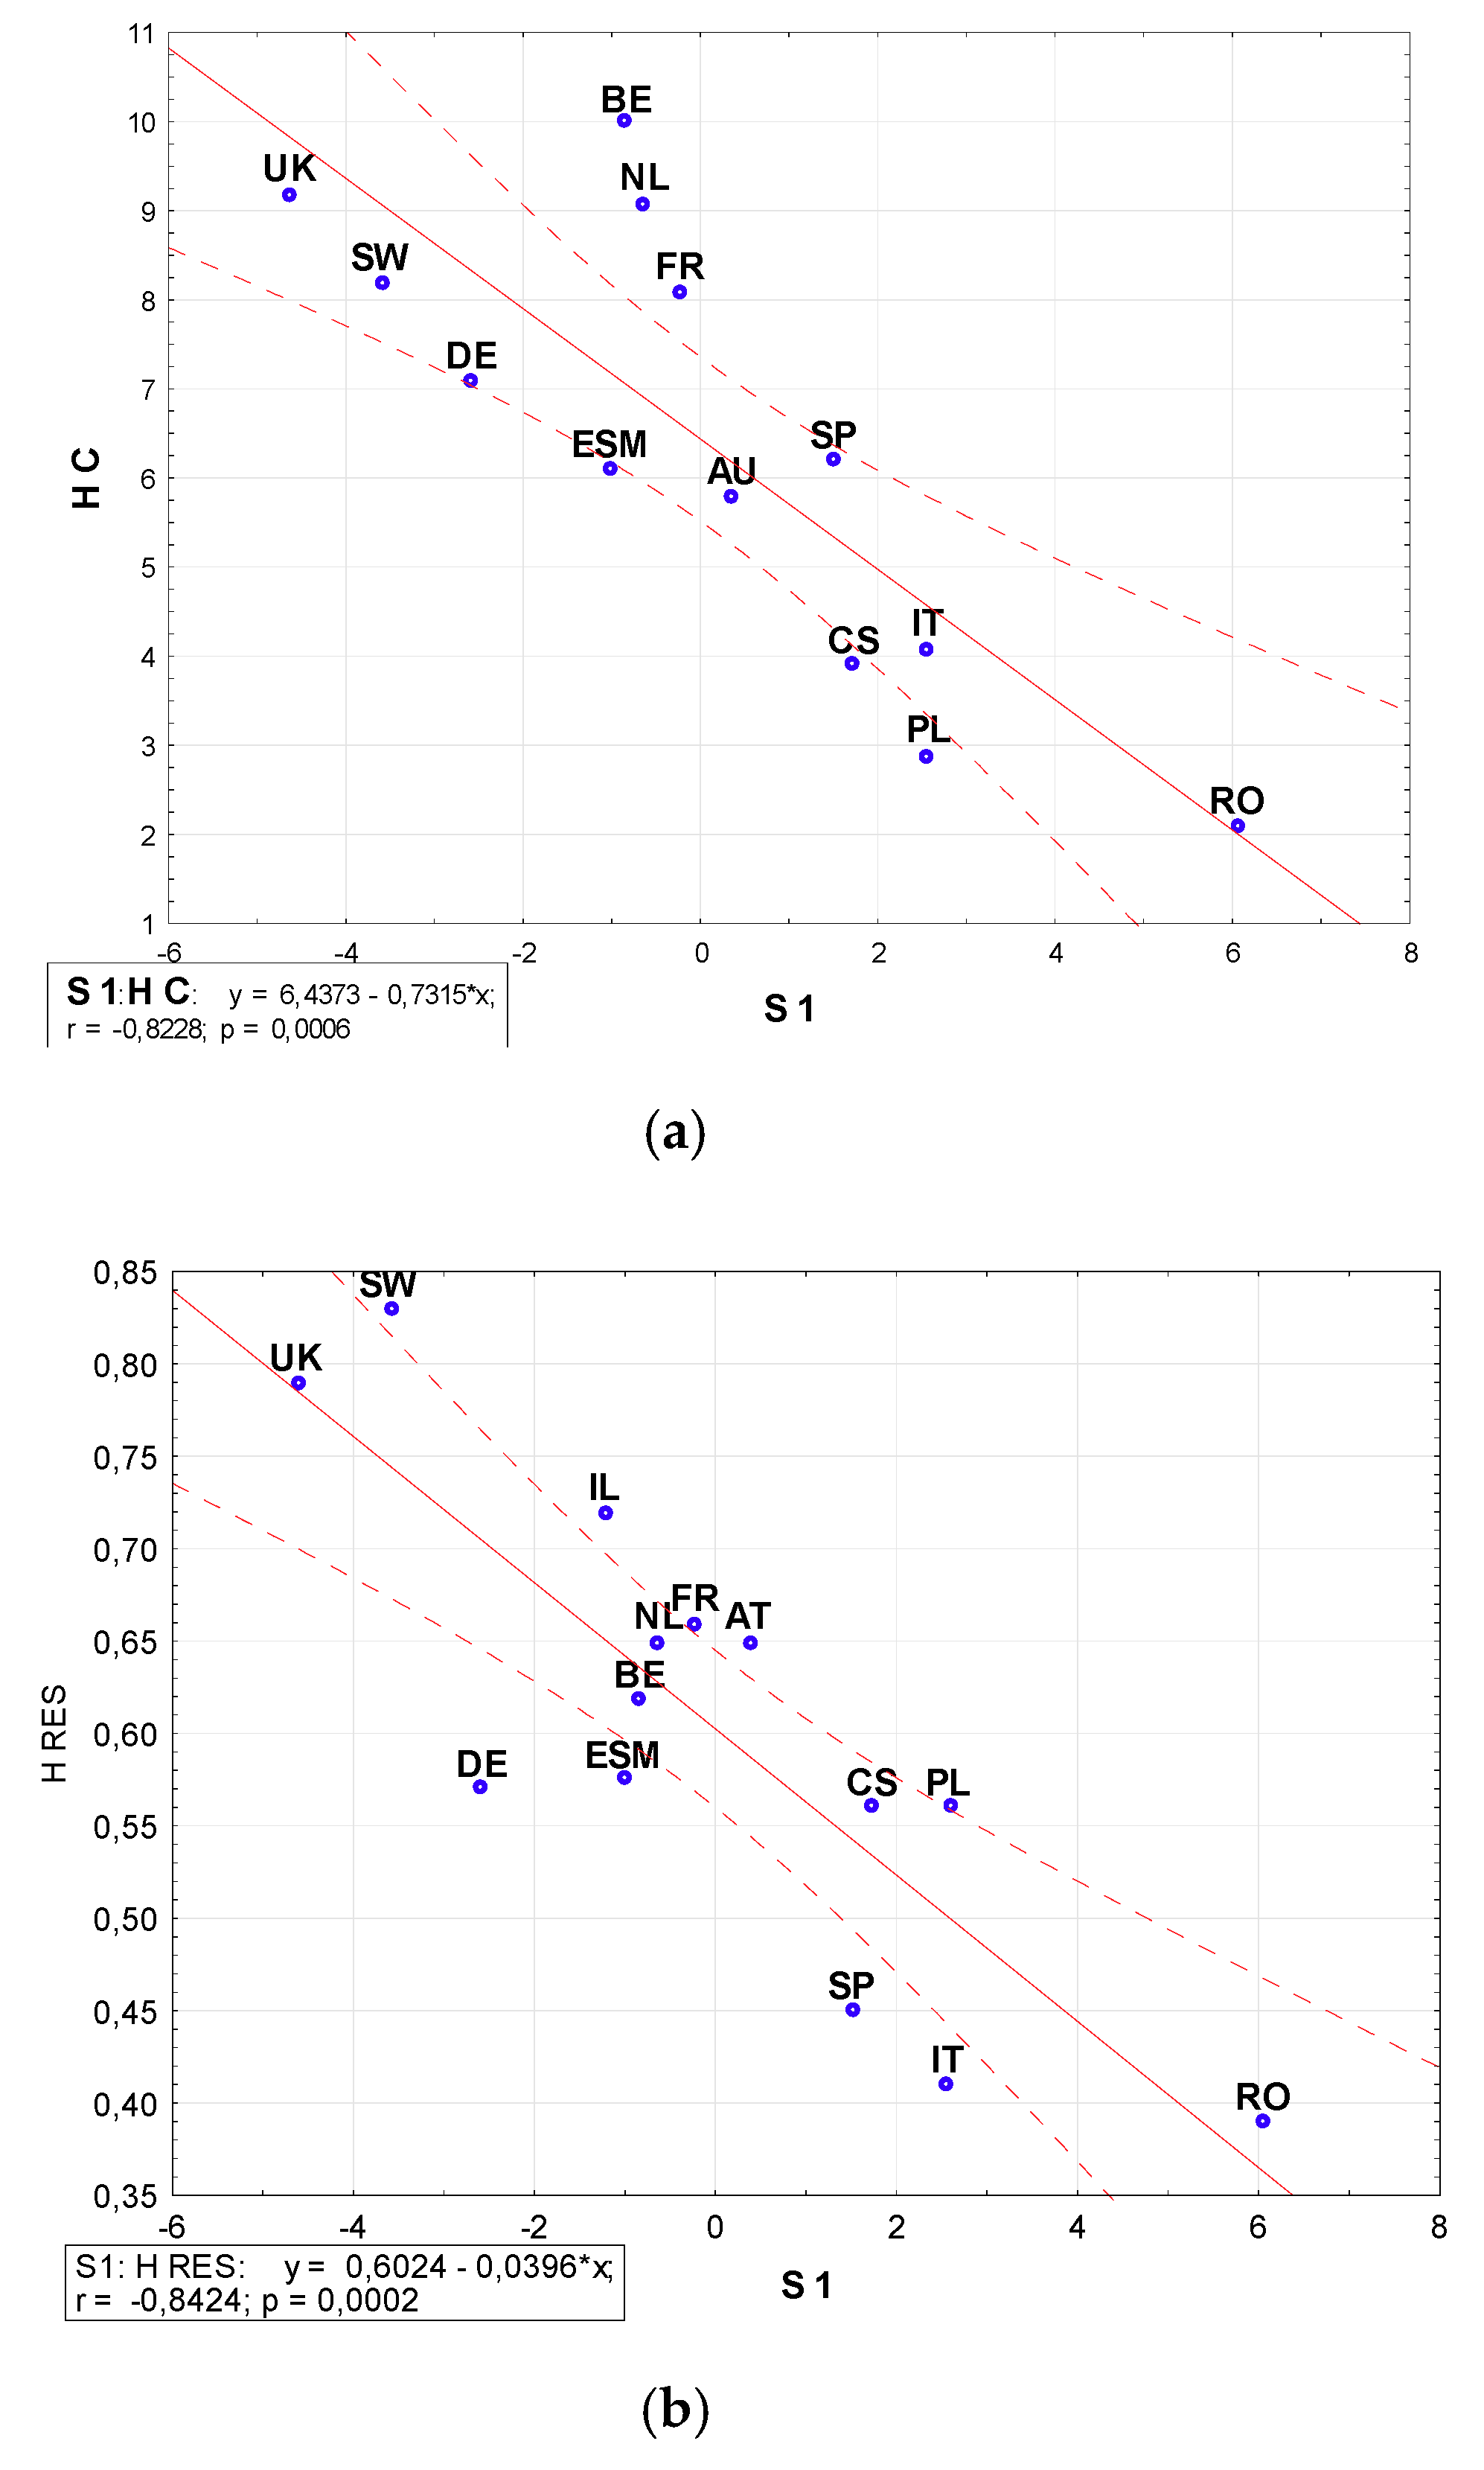
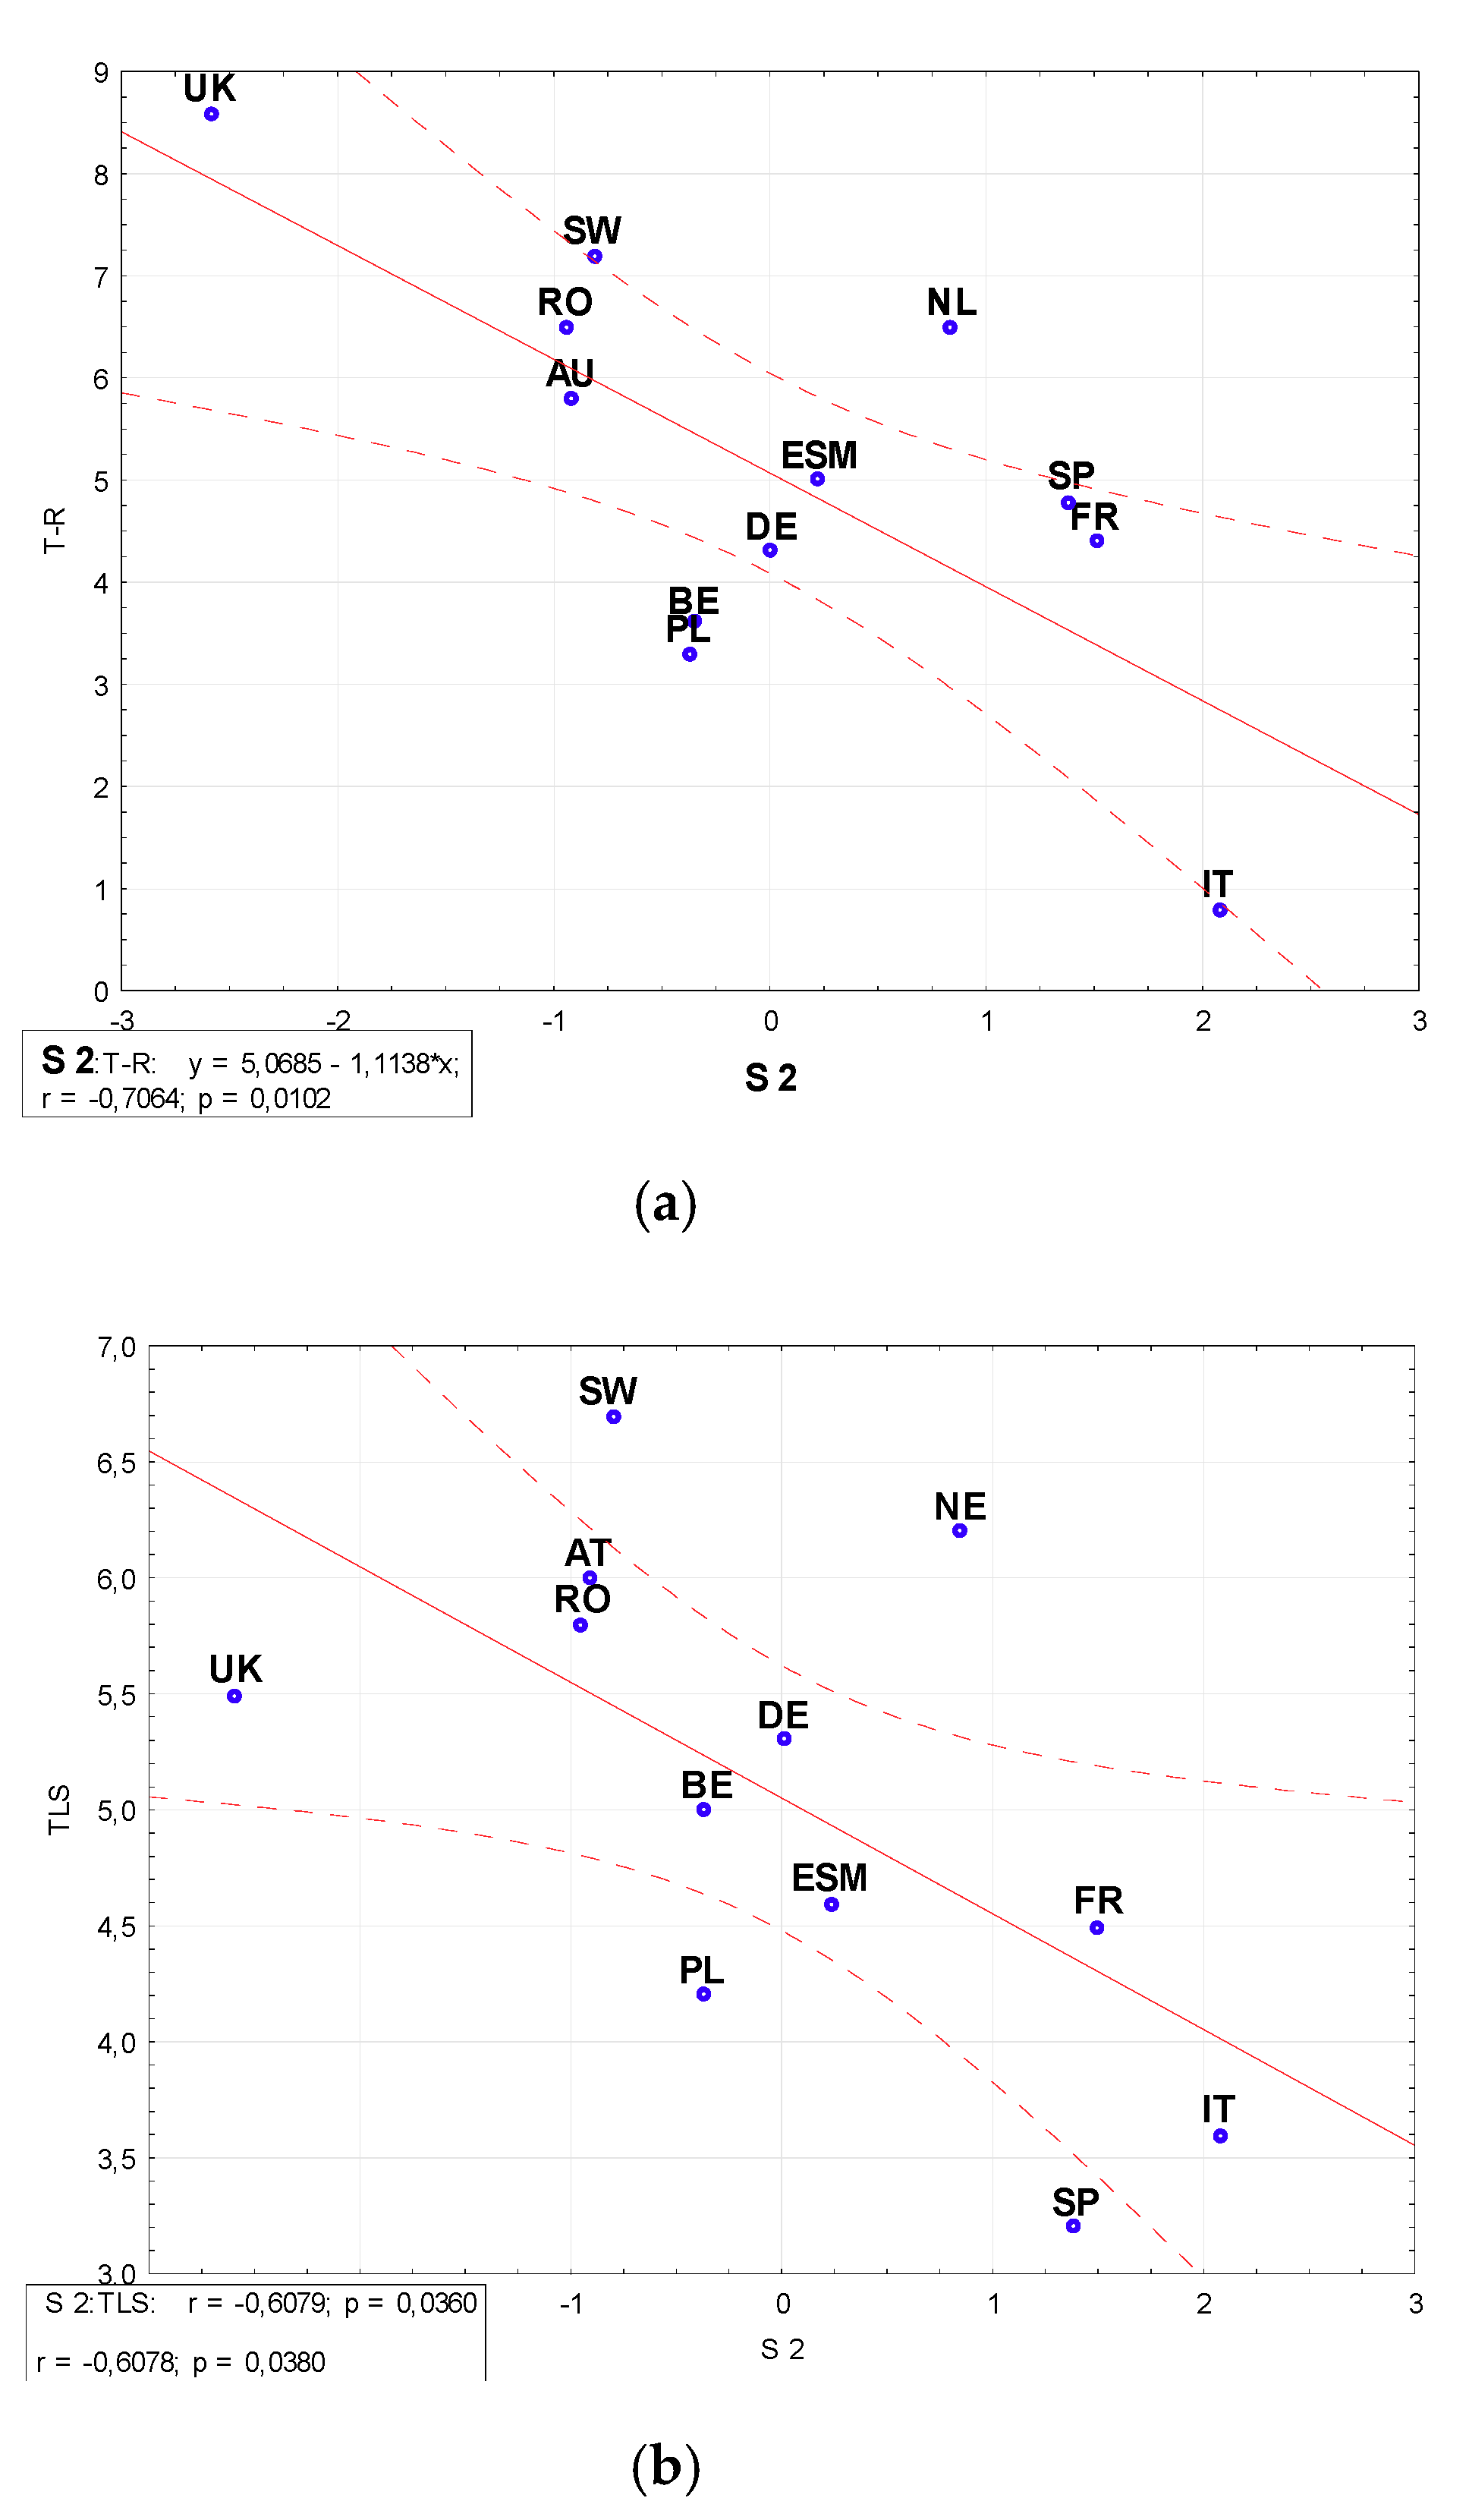
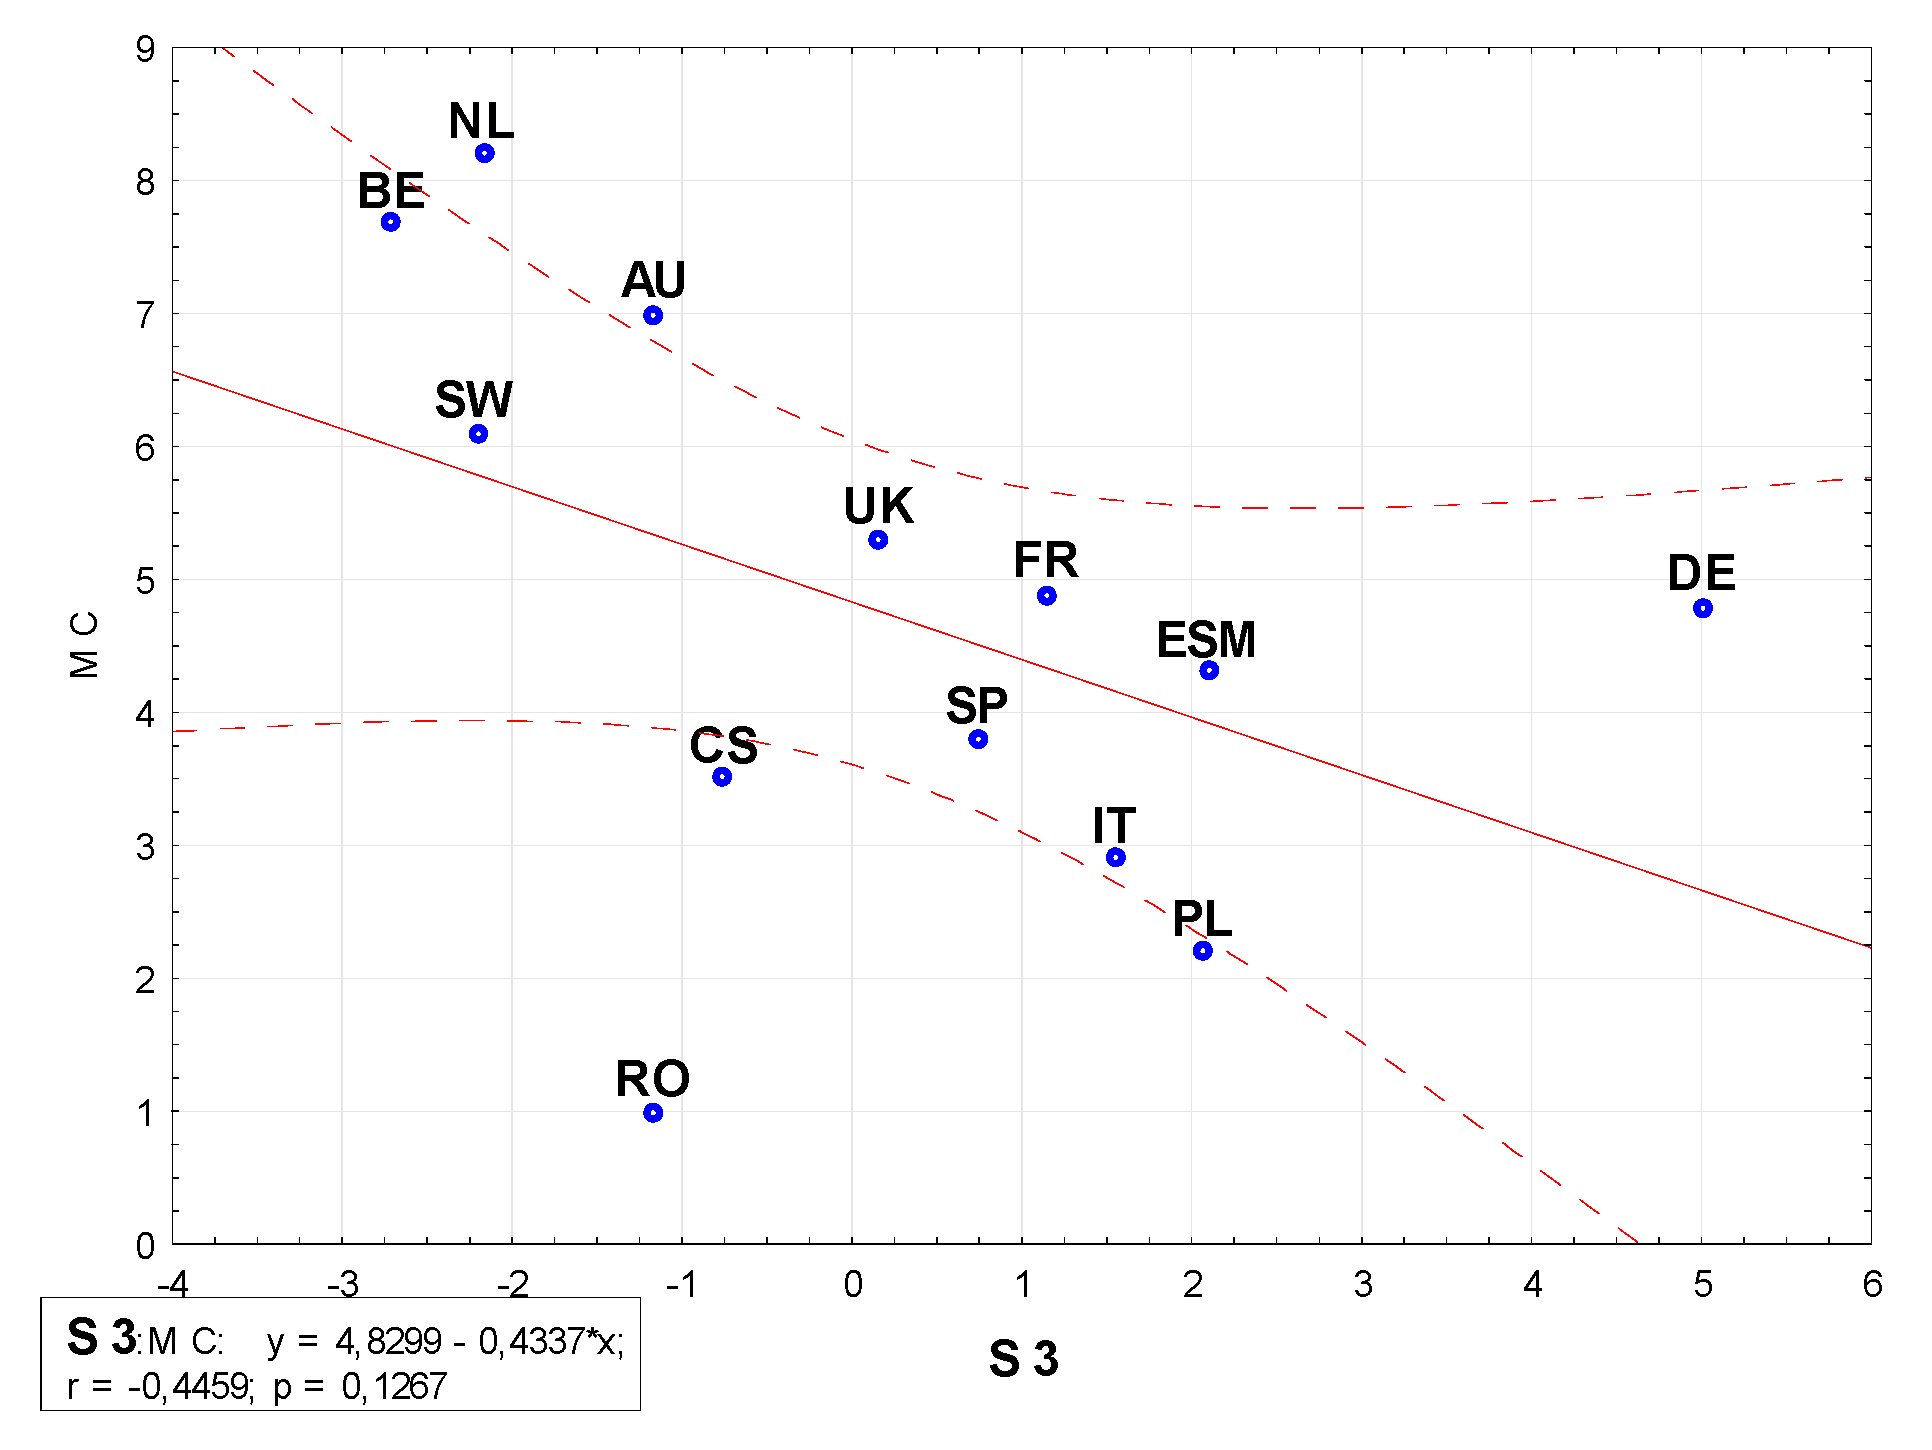
Using the method of multivariate statistical analysis, we determined five components explaining 72.4% of total data variability. We interpret these five key success factors as follows: 1. access to human capital, 2. quality and outcomes of institutions and business relations, 3. focus on market situation, 4. business experience, and 5. development potential. Components 1–3 were explained using appropriate and independent scales, with fairly good linear correlation. The linear relationships shown in Figure 3, Figure 4, and Figure 5 point to deficit of: first, human capital and human resources; second, the trust to standards, regulations, legal system; and third, to the deficit of market regulation. This deficit is particularly evident in central and southern European countries. This information can be useful for authorities and startup managers. The meaning of component 4 is connected to experience, prudence, and business knowledge of founders and staff. Some loadings in the 5th component are of a magnitude below the validity level (|0.7500|). However, they offer valuable information indicating problems in person-to-person or person-to-authority relationships, intention of a startup to expand towards international markets with its own financial resources, and a tendency for startup growth in the direction of scale-ups based on more experienced staff and higher headcount.
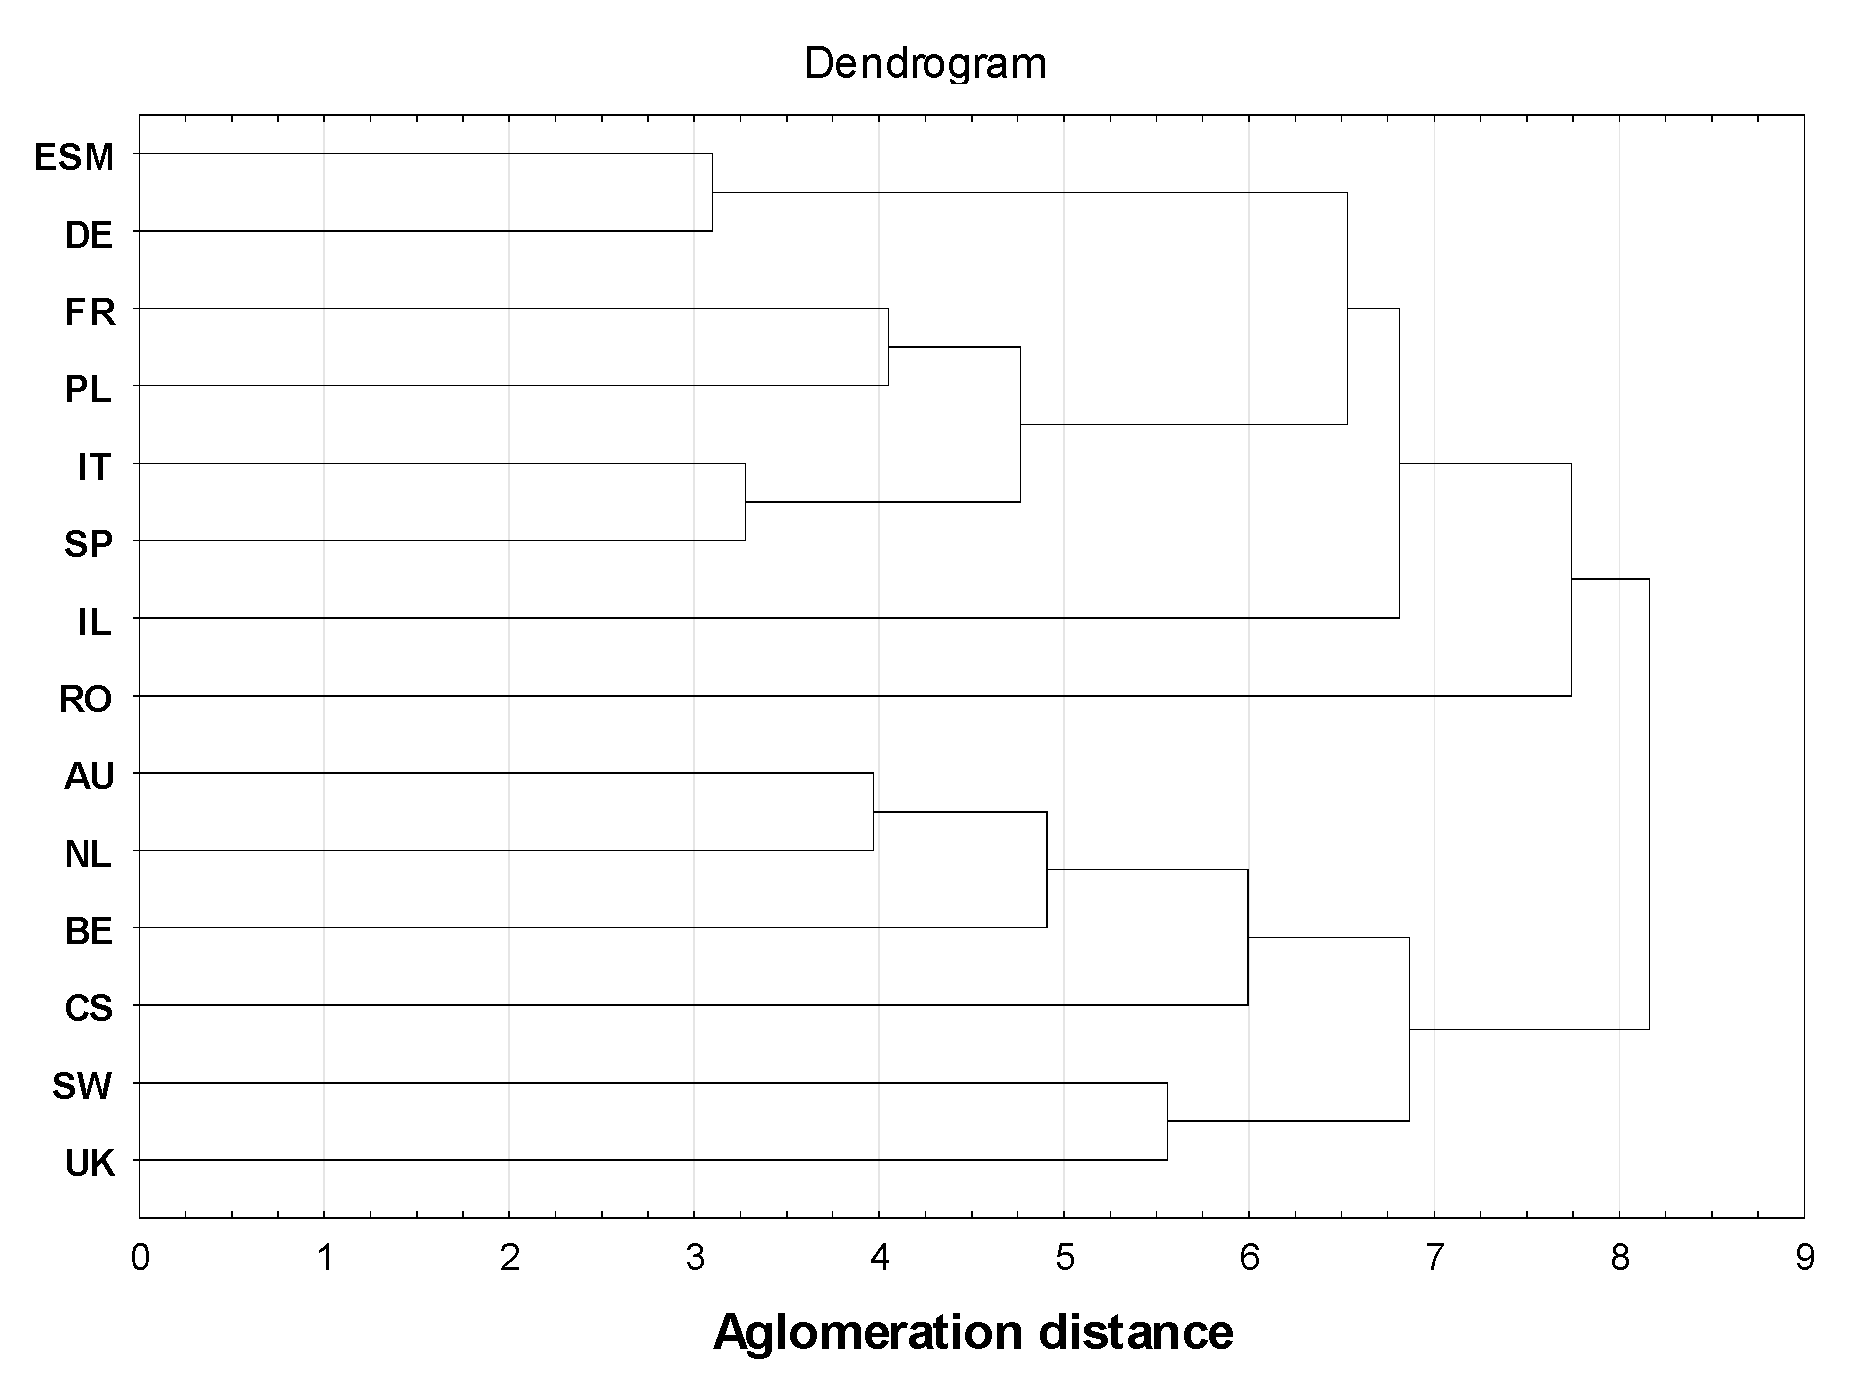
In order to confirm the existing gap between the sampled countries, score values for countries from PCA analysis have been used in the Ward method cluster analysis. The results show two groups of countries with higher, as well as lower, levels of economic and social development. A similar clustering emerged in a three-dimensional picture of three components scores (Figure 7). We found that the most crucial factor splitting countries into two groups is factor 3 (see Table 7). The significant value of factor 1 for Romanian and of factor 2 for Czech startups positions them as outliers.
The performed analysis determined that institutions, human capital, and dimensions of social capital form a significant factor differentiating startup development. Therefore, to provide an explanation for the gap in startup development, we included an assessment of institutional factors in the light of neoinstitutional economics. Additionally, we analyzed leading indicators and scales of formal institutions. We conclude that in catching-up European countries, the economic factors of institutional competitiveness, both formal and informal, need to be improved in terms of their quality and level, to boost startup development. In particular, this applies to the efficiency of the judiciary, higher outlays on R&D, and easier access to financial capital.
The analysis verified our hypothesis and the achievement of objectives set out in our research. The results bring new insights about the functioning and development of startups in the European Union and can be used to determine the prerequisites for shaping macroeconomic and innovation policies in relation to startups in the catching-up EU countries.
To conclude, we call for the responsible activity of policymakers towards the development of programs and actions fostering startups. We do not suggest, however, that all Member States should follow the path of the top-ranked countries. In this respect, the European Startup Monitor and our analysis serve as a supportive tool to help outline and define the future challenges of entrepreneurship policies in Europe and EU Member States. In the nearest future, in order to remain competitive, the economies of EU Member States must meet the need for increasing entrepreneurship and innovation potential. They need to create a higher level of international technological competitiveness, especially in IT. However, some opinions suggest that the development of Industry 4.0, based on digitalization, can deepen social changes, environmental impact, and conservation needs in the EU [155]. As such, startups need to be considered as a factor impacting sustainability [156]. In our opinion, the prevailing interest of startups in certain sectors (e.g., IT, ICT, and e-commerce) can be moderated by some additional mechanisms, including financial support from the EU or governmental agencies. The European Union is introducing a new strategy for the future, e.g., European Green Deal, launching 11 programs [157]. It is expected accelerating and navigating the necessary transitions, deploying, demonstrating and de-risking solutions, and engaging citizens in social innovation. There is no doubt that "…Startup offers an important advance to help companies design business models for novelty and impact…" [77]. They can also serve as "social proof of viability or possibility associated with belief, hypothesis, and theory of a future reality” [158]. We could mention here the need for innovative solutions for food-, green-, and biotechnological; organic, nano- and medical products; new packaging materials; recycling; the sharing economy; and many other branches. This could strengthen the efficiency of EU’s sustainability policy and, at the same time, improve the startup ecosystem in the catching-up EU countries.

Author Contributions

Conceptualization: E.S. and R.I.Z.; methodology: E.S. and R.I.Z.; validation: E.S.; formal analysis: E.S. and R.I.Z.; investigation: E.S. and R.I.Z.; resources: E.S.; writing—original draft preparation: E.S. and R.I.Z.; writing: E.S. and R.I.Z.; review and editing: E.S. and R.I.Z.; visualization: R.I.Z.; supervision: E.S.; project administration: E.S. All authors have read and agreed to the published version of the manuscript.

Funding

This research received no external funding.

Conflicts of Interest

The authors declare no conflict of interest.

References

  1. Chesborough, H. Open innovation. In The New Imperative for Creating and Profiting from Technology; Harvard Business School Press: Boston, MA, USA, 2003. [Google Scholar]
  2. Enright, M.J. Regional clusters and firm strategy. In The Dynamic Firm; Chandler, A.D.J., Hagstrom, P., Solvell, O., Eds.; Oxford University Press: Oxford, UK, 1998. [Google Scholar]
  3. Florida, M. The Rise of the Creative Class: And How It’s Transforming Works, Leisure, Community and Everyday Life; Basic Books: New York, NY, USA, 2002. [Google Scholar]
  4. Bania, N.; Eberts, R.W.; Fogarty, M.S. Universities and the startup of new companies: Can we generalize from Route 128 and Silicon Valley? Rev. Econ. Stat. 1993, 75, 761–766. [Google Scholar] [CrossRef]
  5. Hamel, G. Bringing Silicon Valley Inside. Harv. Bus. Rev. 1999, 77, 71. [Google Scholar]
  6. Kenney, M. Understanding Silicon Valley: The Anatomy of the Enreprenourial Region; Stanford University Press: Stanford, CA, USA, 2020. [Google Scholar]
  7. Casper, S. The University of California and the Evolution of Biotechnology Industry in San Diego and the San Francisco Bay Area. In Public Universities and Regional Growth: Insight from University of California; Kenneye, M., Mowery, D.C., Eds.; Stanford Business Book: Stanford, CA, USA, 2004; pp. 66–97. [Google Scholar]
  8. Ernst&Young. Beyond Borders, Global Biotechnology Report 2011. Available online: https://www.ibbnetzwerk–gmbh.com/uploads/media/E_Y_-_Global_Biotech_report_2011_03.pdf (accessed on 15 July 2020).
  9. NanoMat, Karlsruhe Institute of Technology. Available online: https://www.nanomat.de/english/partners.php (accessed on 2 February 2020).
  10. Truman, R.; Locke, C.J. Gazelles, unicorns, and dragons battle cancer through the Nanotechnology Startup Challenge. Cancer Nanotechnol. 2016, 7, 4. [Google Scholar] [CrossRef] [PubMed] [Green Version]
  11. Photonics Scotland. Available online: https://www.technologyscotland.scot/wp-content/uploads/2019/04/scottishphotonics-paper-final.pdf (accessed on 3 March 2020).
  12. Photonics21–Photonics PPP Annual Activity Report. 2018. Available online: https://www.photonics21.org/download/ppp-services/photonics-downloads/Annual-Activity-Report-2018.pdf (accessed on 3 March 2020).
  13. Bavarian Biotechnology. Biotech in Bavaria. Report on the Bavarian Biotechnology Industry, 2011/2012, Munich. Available online: https://www.yumpu.com/en/document/read/50821942/bavarian-biotech-report-2011-2012-7mb-bio-m (accessed on 20 June 2020).
  14. Andreessen, M. Why software is eating the World. Wall Street J. 2011, 20, C2. [Google Scholar]
  15. Sifted. Available online: https://sifted.eu/articles/startup-initiatives-coronavirus/ (accessed on 4 August 2020).
  16. Deloitte. 2016. Available online: https://www2.deloitte.com/content/dam/Deloitte/pl/Documents/Reports/pl_Deloitte_raport_startupy.pdf (accessed on 15 August 2018).
  17. KPMG. Startup Trend Index. 2019. Available online: http://startuptrendsindex.kpmg.com/ (accessed on 26 August 2019).
  18. GEM 2016. GEM Global Report, Global Entrepreneurship Monitor. Available online: http//gemconsortium.org/report (accessed on 16 August 2019).
  19. GEM 2018–2019. GEM Global Report, Global Entrepreneurship Monitor. Available online: http://gem-2018-2019-global-report (accessed on 27 August 2019).
  20. European Commission 2014. Shaping Europe’s Digital Future Policy. Available online: https://ec.europa.eu/digital-single-market/en/startup-europe (accessed on 7 March 2020).
  21. German Startup Association. Available online: https://www.crunchbase.com/organization/german-startups-association-2 (accessed on 16 August 2018).
  22. Yuklea, H.; Cukier, D.; Melo, C.; Hazzan, O. A Panorama of the Israeli Software Startup Ecosystem, WP, SSRN. Electr. J. 2014. [Google Scholar] [CrossRef]
  23. Sua-gatwey. 2018. Available online: https://sua-gateway-files.s3-ap-southeast-2.amazonaws.com/Crossroadspdf.AWSAccessKeyld (accessed on 14 September 2019).
  24. Australia. The Startup Economy: How to support Tech startups and accelerate Australian innovation 2013. Pricewaterhouse Coopers, Sydney. Available online: https://www.digitalpulse.pwc.com.au/wp-content/uploads/2013/04/PwC-Google-The-startup-economy-2013.pdf (accessed on 27 August 2019).
  25. India 2019. InnoVen Capital India: Startup Outlook Report–2019. Available online: https://www.innovencapital.com/wp-content/uploads/2019/02/Startup-Outlook-Report-2019_InnoVenCapital.pdf (accessed on 10 October 2019).
  26. Beauchamp, M.; Krzysztofiak-Szopa, J.; Skala, A. Polskie Startupy. Raport 2018; Foundation Startup Poland: Warsaw, Poland, 2018. [Google Scholar]
  27. Skala, A. Digital Startups in Transition Economy; Springer International Publishing: Cham, Switzerland, 2019. [Google Scholar]
  28. Beauchamp, M.; Skala, A. Visegrad Startup Report 2016/2017; Foundation Startup: Poland, Warsaw, 2017. [Google Scholar]
  29. Digital Single Market. 2014. Available online: https://ec.europa.eu/digital-single-market/en/policies/shaping-digital-single-market (accessed on 5 June 2020).
  30. Rossetti, F.; Nepelski, D.; Cardona, M. The Startup Europe Ecosystem. Analysis of the Startup Europe Projects and of Their Beneficiaries. Available online: https://publications.jrc.ec.europa.eu/repository/bitstream/JRC110945/jrc110945_jrc110945_the_startup_europe_ecosystem.pdf (accessed on 5 July 2020).
  31. European Commission 2016. Europe’s Next Leaders: The Start-Up and Scale-Up Initiative Published on: 22/11/2016. Available online: https://eur-lex.europa.eu/legal-content/EN/TXT/?uri=COM:2016:733:FIN (accessed on 7 March 2020).
  32. EUROSTAT 2019. Labour Productivity per Person Employed and Hour Worked. Available online: https://ec.europa.eu/eurostat/databrowser/view/tesem160/default/table?lang=en (accessed on 7 March 2020).
  33. Kollmann, T.; Stöckmann, C.; Linstaedt, J.; Kensbock, J. European Startup Monitor 2015. Available online: https://europeanstartupmonitor.com/fileadmin/presse/download/esm_2015.pdf (accessed on 10 November 2018).
  34. IMD Geneva. 2018. Available online: www.startupticker.ch/en/awards/imd-start-up-competition (accessed on 20 November 2019).
  35. The World Bank 2018. Tech Startup Ecosystem in West Bank and Gaza. Findings and Recommendation. Available online: http://documents.worldbank.org/curated/en/715581526049753145/Tech-startup-ecosystem-in-West-Bank-and-Gaza-findings-and-recommendations (accessed on 20 July 2019).
  36. Blank, S. Why the Lean Startup Changes Everything. Available online: https://hbr.org/2013/05/why-the-lean-start-up-changes-everything (accessed on 8 November 2018).
  37. Ries, S. The Lean Startup. How Today’s Entrepreneur Use Continous to Create Radically Successful Business; Crawn Business: New York, NY, USA, 2011. [Google Scholar]
  38. Christiensen, C.M. The Innovator’s Dillema; When New Technologies Cause Great Firms to Fail; Harvard Business School Press: Boston, MA, USA, 2003. [Google Scholar]
  39. Damodaran, A. Valuing Young Start-Up and Growth Companies: Estimation Issues and Valuation Challenges; Stern School of Business New York University: New York, NY, USA, 2009. [Google Scholar]
  40. Thiel, P.; Masters, B. Zero to One: Notes on Startup or How to Build the Future; Crown Publishing Group: New York, NY, USA, 2014. [Google Scholar]
  41. Wassermann, N. The Founder’s Dillemmas: Anticipating and Avoiding the Pittfalls that Can Sink a Startup; Princeton University Press: New Jersey, NJ, USA, 2012. [Google Scholar]
  42. Breschi, S.J.; Lassebie, C.; Menon, C. A Portrait of Innovative Startups across Countries, OECD Science, Technology and Industry Working Papers, No. 2018/02; OECD Publishing: Paris, France, 2018. [Google Scholar]
  43. Fairlie, R.W.; Morelix, A.; Reedy, E.J.; Russel, J.; The Kauffman Index 2015. Startup Activity, National Trends. Available online: https://ssrn.com/abstract=2613479 (accessed on 5 May 2019).
  44. Errko Autio. Entrepreneurship Support in Europe: Trends and Challenges for EU Policy. Report Prepared for EU DG Growth. 2016. Available online: https://www.researchgate.net/profile/Erkko_Autio/publication/304659214 (accessed on 2 April 2020).
  45. Bergset, L.; Fichter, K. Green start-ups–a new typology for sustainable entrepreneurship and innovation research. JIM 2015, 3, 118–144. [Google Scholar] [CrossRef]
  46. Henry, M.; Bauwens, T.; Hekkert, M.; Kiechherr, J. A typology of circular start-ups: An analysis of 128 circular business models. J. Clean. Prod. 2020, 245, 118528. [Google Scholar] [CrossRef]
  47. Kuckertz, A.; Berger, E.S.C.; Gaudig, A. Responding to the greatest challenges? Value creation in ecologicalstartup. J. Clean. Prod. 2019, 230, 1138–1147. [Google Scholar] [CrossRef]
  48. Kim, B.; Kim, H.; Jeon, Y. Critical success factors of a design startup business. Sustainability 2018, 10, 2981. [Google Scholar]
  49. Song, M.; Podoitsyna, K.; van Der Bij, H.; Halman, J.I.M. Success factors in new ventures: A meta analysis. J. Prod. Innov. Manag. 2007, 25, 1. [Google Scholar]
  50. Melegati, J.F. Early-stage software startups: Main challenges and possible answers. In Fundamentals of Software Startups; Springer Nature: Cham, Switzerland, 2020; pp. 129–143. [Google Scholar]
  51. Santisteban, J.; Mauricio, D. Systematic literature review of critical success factors of information technology startups. AEJ 2017, 23, 1. [Google Scholar]
  52. Brattstroem, A. Working with startups? These are three things you ough to know about startup teams. J. Innov. Technol. Manag. 2019, 9, 5–14. [Google Scholar] [CrossRef]
  53. Groenwegen, G.; de Langen, F. Critical success factors of the survival of start-ups with radical innovation. JAEB 2012, 2, 155–171. [Google Scholar]
  54. Rocket Space. 2020. Available online: www.rocketspace.com/tech-startups (accessed on 5 January 2020).
  55. Dvalidze, N.; Markopulos, E. Understanding the Nature of Entrepreneurial Leadership in the Startups Across the Stages of the Startup Lifecycle. In Advances in Human Factors, Business Management and Leadership; Kantola, J., Nazir, S., Eds.; AHFE 2019. Advances in Intelligent Systems and Computing; Springer: Cham, Switzerland, 2020; Volume 961, pp. 281–292. [Google Scholar]
  56. Zaech, S.; Baldegger, U. Lidership in start-ups. Int. Small Bus. J. 2017, 35, 157–177. [Google Scholar] [CrossRef]
  57. Tehseen, S.; Ramayah, T. Entrepreneurial competencies and SMEs business success–The contingent role of external integration. Mediterr. J. Soc. Sci. 2015, 6, 50. [Google Scholar] [CrossRef] [Green Version]
  58. Picken, J.C. From startup to scalable enterprise: Laying the foundation. Bus Horiz. 2017, 60, 587–595. [Google Scholar] [CrossRef]
  59. Isenberg, D. Focus Entrepreneurship Policy on Scale-Up, Not Start-Up. Available online: https://hbr.org/2012/11/focus-entrepreneurship-policy/ (accessed on 8 November 2018).
  60. Hull, J.W. How Your Leadership Has to Change as Your Startup Scales. Available online: https://hbr.org/2016/05/how-your-leadership-has-to-change-as-your-startup-scales/ (accessed on 5 November 2018).
  61. Onetti, A. How to Measure Scaleup Performance. Available online: https://startupeuropepartnership.eu/scaleups-when-does-a-startup-turn-into-a-scaleup/ (accessed on 2 December 2019).
  62. Program Operacyjny Inteligentny Rozwój (PAED) 2016. Available online: https://poir.parp.gov.pl/attachments/article/37225/pytania-i-odpowiedzi-scaleup_POIR-sierpien.pdf (accessed on 10 December 2018).
  63. Franchini, L. Available online: https://en.wikipedia.org/wiki/Scaleup_company (accessed on 23 July 2020).
  64. OECD. Technology and Innovation in the Insurance Sector. 2017. Available online: https://www.oecd.org/pensions/Technology-and-innovation-in-the-insurance-sector.pdf (accessed on 11 October 2019).
  65. Launchvic. Available online: https://scaleup.launchvic.org/scale-ups-vs-startups/ (accessed on 22 July 2020).
  66. Mind The Bridge. Tech Scaleup Europe. SEP Monitor. Available online: https://mindthebridge.com/scaleup-europe-monitor2017 (accessed on 25 July 2020).
  67. Grunert, K.; Ellegaard, C. The Concept of Key Success Factors: Theory and Method. In Perspectives on Marketing Management, 3rd ed.; Baker, M.J., Ed.; Wiley: Chichester, UK, 1993. [Google Scholar]
  68. Massa, L.; Tucci, C.L.; Afuah, A. A critical assessment of business model research. Acad Manag Ann. 2017, 11, 73–104. [Google Scholar] [CrossRef]
  69. Kaplan, R.S.; Norton, D.P. The Balanced Scorecard; Harvard Business School Press: Boston, MA, USA, 2011. [Google Scholar]
  70. Barney, J.B. Firm resources and sustained competitive advantage. J. Manag. 1991, 1, 99–120. [Google Scholar]
  71. Petera, M.A.; Barney, J.B. Unreveling the resource-based tangle. Manag. Decis. Econ. 2003, 24, 309–323. [Google Scholar] [CrossRef]
  72. Morgan, R.E.; Strong, C.A.; McGuinness, T. Product-market positioning and prospector strategy. Eur. J. Mark. 2003, 11, 1. [Google Scholar] [CrossRef]
  73. Prahalad, C.K.; Hamel, G. Competing for the Future; Harvard Business School Press: Boston, MA, USA, 1994. [Google Scholar]
  74. Kay, J. Foundation of Corporate Success: How Business Strategies Add Value; Oxford University Press: Oxford, UK, 1995. [Google Scholar]
  75. Maurya, A. Running Lean: Iterate from Plan A to a Plan that Works. The Lean Series; O’Reilly: Sebastopol, CA, USA, 2012. [Google Scholar]
  76. Deming, W.E. Out of the Crisis; Center for Advanced Engineering Study, Massachusetts Institute of Technology: Cambridge, MA, USA, 1986; p. 88. [Google Scholar]
  77. Bocken, N.; Snihur, Y. Lean startup and the business model: Experimenting for novelty. Long Range Plan. 2020, 53, 101963. [Google Scholar] [CrossRef]
  78. Berends, H.; Smits, A.; Reymen, I.; Polinitsyna, K. Learning while (re)configurating: Business model innovation process in established firms. Strateg. Organ. 2016, 14, 181–219. [Google Scholar] [CrossRef] [PubMed] [Green Version]
  79. Girod, S.J.G.; Whittington, R. Change process and complex adaptive system: From incremental reconfiguration to discontinuous restructuring. Organ. Sci. 2015, 26, 1520–1535. [Google Scholar] [CrossRef] [Green Version]
  80. Romer, P.M. Increasing returns and long-run growth. J. Polit. Econ. 1986, 94, 1002–1037. [Google Scholar] [CrossRef] [Green Version]
  81. Schumpeter, J. The Theory of Economic Development; Harvard University Press: Cambridge, MA, USA, 1936. [Google Scholar]
  82. Knight, F.H. Risk, Uncertainty and Profit; Houghton Mifflin: Boston, MA, USA, 1921. [Google Scholar]
  83. Kirzner, I.M. Competition and Entrepreneurship; Chicago University Press: Chicago, LA, USA, 1973. [Google Scholar]
  84. Stevenson, H.H.; Sahlman, W.A. Introduction to the Entrepreneurial Venture; Harvard Business School Press: Boston, MA, USA, 1991. [Google Scholar]
  85. Penrose, E.T. The Theory of the Growth of the Firm; Oxford University Press: Oxford, UK, 1995. [Google Scholar]
  86. Porter, M.E. Competitive Advantage–Creating and Sustaining Superior Performance; The Free Press: London, UK, 2004. [Google Scholar]
  87. Hamel, G.; Prahalad, C.K. Competing for the Future; Harvard Business School Press: Brighton, MA, USA, 1996. [Google Scholar]
  88. Hudson, W.J. Intelectual Capital. How to Build it, Enhance it, Use i; John Wiley&Sons Publishing: Toronto, ON, Canada, 1993. [Google Scholar]
  89. Edvinsson, L.; Malone, M. Intellectual Capital: Realizing Your Company’s True Value by Finding Its Hidden Brainpower; Harper Business: New York, NY, USA, 1997. [Google Scholar]
  90. Kitts, B.; Edvinsson, L.; Beding, T. Intellectual capital: From intangible assets to fitness landscapes. Expert Syst. Appl. 2001, 20, 35–50. [Google Scholar]
  91. Youndt, M.A.; Subramaniam, M.; Snell, S.A. Intellectual capital profiles: An examination of investments and returns. J. Manag. Stud. 2004, 41, 335–362. [Google Scholar]
  92. Agenda 2030. Available online: https://www.un.org/sustainabledevelopment/sustainable–development-goals/ (accessed on 25 June 2020).
  93. Borgatti, S.; Foster, P. The network paradigm in organizational research: A review and typology. J. Manag. Stud. 2003, 29, 991–1013. [Google Scholar]
  94. Inkpen, A.; Tsang, E. Social capital, networks and knowledge transfer. Acad. Manag. Rev. 2005, 30, 146–165. [Google Scholar] [CrossRef] [Green Version]
  95. Porter, M.E.; Kramer, M.R. The Big Idea: Creating Shared Value. Available online: https://hbr.org/2011/01/the-big-idea-creating-shared-value/ (accessed on 21 March 2020).
  96. Porter, M.E.; Millar, V.E. How Information Gives You Competitive Advantage. Available online: https://hbr.org/1985/07/how-information-gives-you-competitive-advantage/ (accessed on 21 March 2020).
  97. Mata, F.J.; Fuerst, W.L.; Barney, J.B. Information technology and sustainable competitive advantage. Strateg. Manag. J. 1997, 19, 5. [Google Scholar]
  98. Krzanowski, M. Principles of Multivariate Analysis: A User’s Perspective; Oxford University Press: Oxford, UK, 2000. [Google Scholar]
  99. Wold, S.; Erbensen, K.; Geladi, P. Principal component Analysis. Chemometr. Intell. Lab. Syst. 1987, 2, 37–52. [Google Scholar] [CrossRef]
  100. Van Roy, V.; Nepelski, D.; Assessment of Framework Conditions for the Creation and Growth of Firms in Europe. Joint Research Centre, JRC Working Papers JRC103350. Available online: https://ideas.repec.org/p/ipt/iptwpa/jrc103350.html/ (accessed on 20 November 2019).
  101. Audretsch, D.B.; Belitski, M. Entrepreneurial ecosystems in cities: Establishing the framework conditions. J. Technol. Transf. 2016, 2, 1–22. [Google Scholar] [CrossRef]
  102. OECD 2013. Entrepreneurship at a Glance 2013. Available online: http://dx.doi.org/10.1787/entrepreneur_aag-2013-en (accessed on 11 October 2019).
  103. WEF HCI 2017. Available online: https://weforum.org/docs/WEF_Human_Capital_Report_2017.pdf (accessed on 3 March 2020).
  104. World Bank HC Index. Available online: https://datacatalog.worldbank.org/dataset/human-capital-index, (accessed on 3 March 2020).
  105. EIS 2016. European Innovation Scoreboard 2016 ANNEX G. p. 95. Available online: https://op.europa.eu/en/publication-detail/-/publication/6e1bc53d-de12-11e6-ad7c-01aa75ed71a1 (accessed on 22 March 2020).
  106. ESS R6. European Social Survey 6. Available online: https://www.europeansocialsurvey.org/data/download.html?r=8 (accessed on 5 June 2020).
  107. Appso. 2012. Available online: http://appsso.eurostat.ec.europa.eu/nui/show.do?dataset=ilc_di12 (accessed on 22 June 2020).
  108. Cusumano, M.A. Evaluating a startup venture considering the key elements of successful startups. Commun. ACM 2013, 56, 26–29. [Google Scholar]
  109. Kumbhat, A.; Sushil. Ingredients of Startup Success, Conference: GLOGIFT 17. Available online: https://www.researchgate.net/publication/321850108-Ingredients_of_Startup_Success (accessed on 7 March 2020).
  110. Geibel, R.C.; Manickam, M. Comparison of selected startup ecosystems in Germany and in the USA, GSTF. J. Bus. Rev. 2016, 4, 66–71. [Google Scholar]
  111. Cantanessa, M.; Gatteschi, V.; Perboli, G.; Rosane, M. Startups’ road to failure. Sustainability 2018, 10, 2346. [Google Scholar] [CrossRef] [Green Version]
  112. Kohler, W. The “Lisbon Goal” of the EU: Rhetoric or Substance. J. Ind. Compet. Trade 2006, 6, 85–113. [Google Scholar] [CrossRef]
  113. Pedersen, O.K. Institutional Competitiveness: How Nations Came to Compete. In The Oxford Handbook of Comparative Institutional Analysis; Pedersen, O.K., Morgan, G., Campbell, J.L., Crouch, C., Whitley, R., Eds.; The Oxford University Press: Oxford, UK, 2010; pp. 625–658. [Google Scholar]
  114. Porter, M.E. Attitudes, values, beliefs, and the microeconomics of prosperity. In Culture Matters: How Values Shape Human; Progress Basic Books: New York, NY, USA, 2000; pp. 14–28. [Google Scholar]
  115. North, D.C. Institutions, Institutional Change and Economic Performance; Cambridge University Press: New York, NY, USA, 1990. [Google Scholar]
  116. Schwab, K.; Sala-i-Martin, X. The Global Competitiveness Report 2015–2016. Available online: http://www3.weforum.org/docs/gcr/2015-2016/Global_Competitiveness_Report_2015-2016.pdf (accessed on 5 July 2019).
  117. Woodside, A.G.; Mir Bernal, P.; Coduras, A. The general theory of culture, entrepreneurship, innovation, and quality-of-life: Comparing nurturing versus thwarting enterprise start-ups in BRIC, Denmark, Germany, and the United States. Ind. Market Manag. 2015, 53, 136–159. [Google Scholar] [CrossRef]
  118. Bruton, G.D.; Ahlstrom, D.; Singh, K. The impact of the institutional environment on the venture capital industry in Singapore. VCJ 2002, 4, 197–218. [Google Scholar]
  119. Salimath Manjula, S.; Cullen, J.B. Formal and informal institutional effects on entrepreneurship: A synthesis of nation. Int. J. Organ. Anal. 2010, 18, 358–385. [Google Scholar] [CrossRef]
  120. World Bank World Development Report 2002. Building Institutions for Markets, Washington. Available online: https://openknowledge.worldbank.org/handle/10986/5984 (accessed on 10 July 2019).
  121. Coase, R. The new institutional economics. Am. Econ. Rev. 1998, 88, 72–74. [Google Scholar]
  122. Williamson, O.E. The Economic Institutions of Capitalism: Firms, Markets, Relational Contracting; New York University Press: New York, NY, USA, 1985. [Google Scholar]
  123. van den Bergh, J.C.; Gowdy, J.M. Evolutionary Theories in Environmental and Resource Economics: Approaches and Applications. Environ. Resour. Econ. 2000, 17, 37–57. [Google Scholar] [CrossRef]
  124. Ease of Doing Business, World Bank. Available online: https://www.doingbusiness.org/en/reports/global-reports/doing-business-2020) (accessed on 25 June 2020).
  125. Corruption Perception Index. Available online: https://transparency.org/eu/cpi); (accessed on 25 June 2020).
  126. Index of Economic Freedom. Available online: https://www.heritage.org/index/pdf/2015/book/index_2015.pdf (accessed on 25 June 2020).
  127. Porter, M.E. The Competitive Advantage of Nations; Macmillan: London, UK, 1998. [Google Scholar]
  128. Isenberg, D. How to start an Entrepreneurial Revolution. Harv. Bus. Rev. 2010, 88, 40–50. [Google Scholar]
  129. Camagni, R.; Capello, R. Regional innovation patterns and the EU regional policy reform: Toward smart innovation policies. Growth Chang. 2013, 44, 355–389. [Google Scholar] [CrossRef] [Green Version]
  130. Fact Sheets on the European Union. Available online: https://www.europarl.europa.eu/at-your-service/en/stay-informed/factsheets-on-the-european-union (accessed on 7 March 2020).
  131. Glatz, C.; Eder, A. Patterns of Trust and Subjective Well-Being Across Europe: New Insights from Repeated Cross-Sectional Analyses Based on the European Social Survey 2002–2016. Soc. Indic. Res. 2020, 148, 417–439. [Google Scholar] [CrossRef] [Green Version]
  132. Coleman, J.S. Fundation of Social Theory; Harvard University Press: New York, NY, USA, 1994. [Google Scholar]
  133. Dallago, B.; Guri, G.; McGowan, J. A Global Perspective on the European Economic Crisis; Routledge: London, UK, 2016. [Google Scholar]
  134. Subramaniam, M.; Youndt, M.A. The influence of intellectual capital on the types of innovative capabilities. AMJ 2005, 3, 450–463. [Google Scholar] [CrossRef] [Green Version]
  135. Wang, W.-Y.; Chang, C. Intellectual capital and performance in causal models. J. Intellect. Cap. 2005, 6, 1469–1930. [Google Scholar]
  136. Begg, D.K.H.; Fischer, S.; Dornbusch, R. Economics, 9th ed.; Mc-Graw Hill Publishing Co.: London, UK, 2002. [Google Scholar]
  137. Ostrom, E. Social Capital: A Fad or Fundamental Concept? In Social Capital: A Multifaced Perspective; Dasgupta, P., Serageldin, I., Eds.; The World Bank: Washington, DC, USA, 2000; p. 176. [Google Scholar]
  138. De Vaan, M.; Frenken, K.; Boschma, R. The downside of social capital in new industry. Econ. Geogr. 2019, 95, 315–340. [Google Scholar] [CrossRef] [Green Version]
  139. Legatum Prosperity Index 2019. Available online: https://www.prosperity.com/rankings, (accessed on 26 June 2020).
  140. World Governance Indicator. Available online: https://info.worldbank.org/governance/wgi/ (accessed on 26 June 2020).
  141. Kaufmann, D.; Kraay, A.; Mastruzzi, M. Governance matters VII Aggregate and Individual Governance Indicators 1996–2008. Policy Research Working Paper. p. 6. Available online: http://documents1.worldbank.org/curated/en/598851468149673121/pdf/WPS4978.pdf (accessed on 3 October 2020).
  142. Brunett, F. Regulatory quality and competitiveness in recent European Union member states. L’Europe en Formation 2012, 364, 59–90. [Google Scholar] [CrossRef]
  143. Ketels, C. Review of Competitiveness Frameworks; National Competitiveness Council: Dublin, Ireland, 2016. [Google Scholar]
  144. Sztompka, P. Trust: A Sociological Theory; Cambridge University Press: Cambridge, UK, 1999. [Google Scholar]
  145. Myeong, S.; Seo, H. Which Type of Social Capital Matters for Building Trust in Government? Looking for a New Type of Social Capital in the Governance Era. Sustainability 2016, 8, 322. [Google Scholar] [CrossRef] [Green Version]
  146. Ponzetto, G.A.M.; Troiano, U. Social Capital, Government Expenditures and Growth. NBER Working Paper No.w24533. 2018. Available online: https://papers.ssrn.com/sol3/papers.cfm?abstract_id=3167047 (accessed on 4 April 2020).
  147. Temple, J. Growth effects of education and social capital in the OECD countries. Hist. Soc. Res. 2002, 27, 5–46. [Google Scholar] [CrossRef] [Green Version]
  148. Huang, J.; Massenvandenbrink, H.; Grot, W. A Meta-Analysis of the Effect of Education on Social Capital. Econ. Educ. Rev. 2009, 28, 454–464. [Google Scholar] [CrossRef]
  149. Reichert, S. The Role of Universities in Regional Innovation Ecosystems. Available online: https://eua.eu/resources/publications/819:the-role-of-universities-in-regional-innovation-ecosystems.html/ (accessed on 30 March 2020).
  150. Del Bosco, B.; Mazzucchelli, A.; Chierici, R.; Di Gregorio, A. Innovative startup creation: The effect of local factors and demographic characteristics of entrepreneurs. Int. Entrep. Manag. J 2019, 241, 1–20. [Google Scholar] [CrossRef]
  151. Ulman, S.R. Corruption and National Competitiveness in Different Stages of Country Development. Procedia Econ. Financ. 2013, 6, 150–160. [Google Scholar] [CrossRef] [Green Version]
  152. Pasimeni, P. Assessing the Europe 2020 Strategy. In A Global Perspective on the European Economic Crisis; Delgado, B., Guri, G., McGowan, J., Eds.; Routledge: London, UK, 2016. [Google Scholar]
  153. Dixit, A. Governance, institutions and economic activity. Am. Econ Rev. 2009, 99, 1–3. [Google Scholar] [CrossRef] [Green Version]
  154. Manzahynski, S.; Figge, F.; Hassel, L. Sustainable value creation in nine countries of the Baltic region. Value, changes and drivers. J. Clean. Prod. 2015, 108, 637–646. [Google Scholar] [CrossRef]
  155. Industry 4.0. Study for the ITRE Committee. Available online: https://www.europarl.europa.eu/RegData/etudes/STUD/2016/570007/IPOL_STU(2016)-570007_EN.pdf (accessed on 15 July 2020).
  156. Voinea, C.L.; Logger, M.; Rauf, F.; Roijakkers, N. Drivers of sustainable business models in start-ups: Multiple case studies. Sustainability 2019, 11, 6884. [Google Scholar] [CrossRef] [Green Version]
  157. European Green Deal. Available online: https://ec.europa.eu/info/research-and-innovation/strategy/european-green-deal_en (accessed on 14 September 2020).
  158. Felin, T.; Gambardella, A.; Stern, S.; Zenger, T. Lean startup and the business model: Experimentation revisited. Long Range Plan. 2020, 53, 101889. [Google Scholar] [CrossRef]
Figure 1. Startup development stages (phases).
Sustainability 12 08200 g001
Figure 2. Company competitive advantages and their main sources in contemporary management theories.
Sustainability 12 08200 g002
Figure 3. (a) Linear relationship between the first component scores values S1 and the human capital indicator H C from the Scale-up Index for European countries [100] (Figure 16, p. 30); (b) Linear relationship between the first component scores values (S1) and the human resources value (H RES) [105].
Sustainability 12 08200 g003
Figure 4. (a) Linear relationship between second component scores S2 and T–R from [100] Figure 16, p. 35. Czech Republic was removed from the figure as a tremendous outlier; (b)Linear relationship between second component scores (S2) and TLS (Trust in the Legal System) for European countries [106].
Sustainability 12 08200 g004
Figure 5. Linear relationship between component scores 3 (S3) and the Market Conditions Index [100], (Figure 18, p. 29).
Sustainability 12 08200 g005
Figure 6. Cluster analysis of countries.
Sustainability 12 08200 g006
Figure 7. Position of countries in three-dimensional space of component scores values; A—countries that have higher S3 values; B—scattered distribution on the surface SS1–S2.
Sustainability 12 08200 g007
Table 1. Examples of startup concepts in literature.
Author/SourceMain Constituents of the Concept/Features
Christensen [38]Create disruptive innovation
Damodaran [39]High growth potential, early stage without history, low survivability
Blank [36]Seek a repeatable and scalable business, looking for a business model
Ries [37]Create a new product or service in risky and uncertain conditions
Thiel and Masters [40]Create new solutions
Wassermann [41]Looking for market opportunities regardless of their resources
Skala [27]Initial phase, limited resources, identifies a market problem, recognizes demand, and verifies the solution it proposes; in the expansion stage
The World Bank [35]Newly founded, first phase of activity
Breschi et al. [42]Innovative, technological company, undertaking the most difficult civilizational challenges (energy sources, social exclusion, sustainable development)
European Commission [20]Technological entrepreneurship, digital market, services in the field of websites and ICT
IMD* [34]At the initial stage, having market potential, having a team of people, having founders
GEM [18]Enterprise or organization at the stage of preparation, managed by founders alone
Fairlie et al. [43]Innovation oriented, small staff
Kollmann et al. [33]Younger than 10 years, generating highly innovative technologies and/or business models, having, or striving for a significant employee growth, striving for sales growth
Erko Autio [44]Firm up to 6 years old, strongly growth-oriented, spends at least 15% of its operating expenses on R&D
Bergset and Fichter [45]Visionary, inventive, entrepreneurial, unintentionally green, involves customer-focused technologies
Henry et al. [46]Based on design, material, and waste minimization, process efficiency, adopting circular economy rules
Henry et al. [46]Based on value creation, extraction from external waste streams
Kuckertz et al. [47]Realizes the basic implementation of sustainability concerns and fulfills the minimum requirements of applicable sustainability laws and regulations.
Boyoung Kim et al. [48]Commercialization, continuous investment, market orientation, goal orientation, competency
Song et al. [49]Disruptive innovation: supply chain integration, market orientation, experience, patent protection, low survival
Melegati and Kon [50]High failure rate of software startups, unique value, serving single customer first, develop what is needed
Santisteban and Mauricio [51]IT startups: 21 success factors: organizational (6), personal (10), environmental (5)
Brattstroe [52]Employee positive: homogeneity, flexibility, trust, dependence; employee negative: lower vigilance, adaptation difficulties, split in the face of difficulties
Groenwegen and de Langen [53]Radical innovation, business plan, customer approach, seed capital, social capital experience
Rocket Space [54]In the early stages of determining product-market fit, experimenting with customer segmentation, working toward a positive contribution margin
* Institute for Management Development, Lausanne.
Table 2. Illustrative definitions of scale-ups.
SourceMain Constituents of the Definition
Onetti [61]Development-stage business, high-technology markets, looking to grow in terms of market access, revenues, and number of employees, adding value by identifying and realizing win-win opportunities for collaboration with established companies
PAED * [62]acceleration of startup development
Franchini [63]1 million euros in turnover in the past 12 months, 1 million users per month, at least 20% of turnover from foreign clients, at least +10% growth month on month and +100% year on year
OECD [64]At least 10 employees, company growth by at least 20% per year over a 3-year period, looking to grow in terms of market access, revenues, and number of employees
Skala [27]In the expansion stage, growing radically (double digit rate per month), in the maturity stage
Erkko Autio [44]Entrepreneurial firm, up to 10 years old, strongly growth oriented, attracted €1 M or more of venture capital funding
Launchvic [65]Growth of the business model while maintaining operational control, business solidification, and scaling market position, joining forces with established collaborators and identifying opportunities for ongoing expansion, external investment is still key, but the initial question of “will this work?” has been ticked off
Rocket Space [54]A company that has already validated its product within the marketplace and has proven that the unit economics are sustainable
* Polish Agency for Enterprise Development.
Table 3. List of variables used in calculations.
No.SymbolExplanationMeasure
Age
1AAverage age of startupsYear
Founders and teams
2MMale founders%
3FRFounders residents%
4FW2Founders 25–34 years fraction%
5FW3Founders 35–54 years fraction%
6LFFounders average numberNumber
Industry, customers, and markets
7B2CB2C–mainly customers %
8B2BB2B–mainly customers%
9HCHome country market%
10ECEU country markets%
11WWWorld market%
12IPInternationalization planned%
Employment
13ENEmployees average numberNumber
14EFEmployees average number including foundersNumber
15EPEmployees number plannedNumber
16EC%Employees residents %
17FEUFounders residents from EU%
18STUAverage number of student employees Number
Financing
19FOSFinancing with own savings %
20NECNo external capital (planned)%
Economic situation, challenges, and expectations
21BSGBusiness situation good%
22BSSBusiness situation satisfactory%
23SAS aSocial/advisory support expectation%
24PRB aPolitical regulation, bureaucracy%
25FS aFinancial support expectation%
26SS aSocial support expectation%
27EGEvaluation of national governmentRange = 1–6
28SPEvaluation of politiciansRange = 1–6
29UNIVEvaluation of universitiesRange = 1–6
30ESSEvaluation of school systemRange = 1–6
31ECOMEvaluation of companiesRange = 1–6
32OPTOptimism in case of failure%
33PMITrust in good and satisfying future situation%
a –%SAS + %PRB + %FS + % SS = 100%.
Table 4. Component eigenvalues.
Component NumberComponent EigenvalueCumulated EigenvaluesPercentage of Component in Total EigenvaluesPercentage of Cumulated Eigenvalues
1st7.687.6823.2723.27
2nd5.3213.0016.1139.38
3rd4.9517.9514.9954.37
4th3.1121.069.4163.78
5th2.8623.928.6572.43
Table 5. Correlation coefficients between five factors; bold values in the table represent weak correlations.
Component NumberComponent Number
1st2nd3rd4th5th
1st1.0000.06370.17000.3849−0.0380
2nd 1.0000.15310.18660.1746
3rd 1.0000.04330.3764
4th 1.0000.0070
5th 1.000
Table 6. Principal score values for components S1–S3 by country.
CountrySymbolS1S2S3
Mean for all countries ESM−1.020.232.09
AustriaAT0.36−0.92−1.16
BelgiumBE−0.85−0.36−2.72
Czech RepublicCS1.72−4.87−0.76
FranceFR−0.231.51.14
GermanyDE−2.590.04.99
IsraelIL−1.235.14−2.49
ItalyIT2.562.071.54
The NetherlandsNE−0.630.84−2.18
PolandPL2.57−0.382.06
RomaniaRO6.04−0.95−1.18
SpainSP1.491.390.73
SwedenSW−3.58−0.81−2.21
United KingdomUK−4.63−2.590.16
Table 7. Principal loadings for components S1–S5 for 33 variables.
Component Values (Varimax Normalized)
(Values > 0.75000 are Printed Bold Italics)
No.Variable12345
Age
1A0.1504820.3362570.0771900.655860−0.074693
Founders and team
2M−0.0412890.1952840.3201210.5550550.288977
3FR−0.8759780.0596280.165669−0.1489590.072650
4FW2−0.414737−0.217854−0.255779−0.6322800.269339
5FW30.1962100.049990−0.2144930.8109130.053921
6LF−0.3673490.0704910.5980610.065273−0.235935
Industry, customers, and markets
7B2C0.0357700.102703−0.5412780.621660−0.432019
8B2B0.004963−0.1051940.261739−0.814179−0.390038
9HC−0.168135−0.3320430.859848−0.0381910.151255
10EC0.123962−0.327871−0.8442680.1256290.116148
11WW0.0692330.809884−0.106358−0.099097−0.329362
12IP0.0481840.4581600.2837330.0281730.587241
Employment
13EN0.479323−0.0247490.596443−0.0105710.594300
14EF0.448652−0.0006170.645718−0.0053790.571337
15EP−0.156556−0.0384200.3165040.4041730.533869
16EC %−0.910586−0.0468000.067749−0.011064−0.276772
17FEU0.831303−0.015389−0.221018−0.0866690.159731
18STU0.8586770.1022060.1910500.208840−0.168516
Financing
19FOS−0.227376−0.534437−0.666381−0.193184−0.141358
20NEC0.112446−0.050913−0.0234460.0708220.688925
Economic situation, challenges, and expectations
21BSG0.6183800.333873−0.0425010.3418110.271394
22BSS−0.3617800.376775−0.282246−0.4951090.053928
23SAS0.784364−0.0397500.0763470.077673−0.165300
24PRB−0.388706−0.2570220.0815890.0108150.588348
25FS−0.4179800.456201−0.278109−0.3136510.072249
26SS−0.034232−0.4288280.2684880.411333−0.560313
27EG0.3485600.8691030.0627460.1949340.025350
28SP0.0905390.8560800.0726000.1595960.173665
29UNIV0.0385480.9087350.0570990.180853−0.009188
30ESS−0.0802130.8830890.1297190.167295−0.254928
31ECOM−0.2190880.6573810.2050680.0623340.260518
32OPT−0.147990−0.100265−0.560664−0.010828−0.168335
33PMI0.4557360.0935600.3222450.117027−0.007683
Table 8. Formal institution indicators in studied European countries *.
CountryEase of Doing
Business [124]
CPI [125]IEF [126]
201520202016201920152020
AT77.4278.70757771.273.3
BE71.1175.00777568.868.9
CS70.9576.30555672.574.8
FR73.8876.80696962.566.0
DE79.7379.70818073.873.5
IL71.2576.70646070.574.0
IT68.4872.90475361.763.8
NE75.0176.10838273.777.0
PL73.5676.40625868.669.1
RO70.2273.70484466.669.7
SP73.1677.90586267.666.9
SW80.6082.00888572.774.9
UK80.9683.50817775.879.3
* Higher values mean that EDB and IEF are improving while CPI is declining (less).
Table 9. Index of social capital, institutional indicators in 2019, and human capital in 2017 in researched countries *.
CountrySocial Capital [139]Government Effectiveness [140]Political Stability [140]Rule of Law [140]Regulatory Quality [140]Human Capital Index [103]
AT67.7290.8780.9597.6091.3573.29
BE55.0183.6559.9588.4686.0672.48
CS47.1078.3787.1481.7387.0271.41
FR56.0290.7751.9088.9483.6569.94
DE67.1593.2766.6791.7594.7174.30
IL53.1186.0615.2480.7786.5471.75
IT55.3068.2757.6261.5464.4267.23
NE73.2896.6378.1096.1599.0473.07
PL47.1375.0165.7166.8378.3769.91
RO46.8243.2748.5763.4667.3166.12
SP58.6579.3355.2480.2980.2165.60
SW70.5996.1580.4898.5697.6073.95
UK66.5887.9848.1091.8396.1571.13
* Scale from 0 (lowest level) to 100 (highest level).

