Article

Constructing an Environmental Friendly Low-Carbon-Emission Intelligent Transportation System Based on Big Data and Machine Learning Methods

School of Computer Science and Technology, Beijing Institute of Technology, Beijing 100081, China
*
Author to whom correspondence should be addressed.
Sustainability 2020, 12(19), 8118; https://doi.org/10.3390/su12198118
Submission received: 4 September 2020 / Revised: 25 September 2020 / Accepted: 26 September 2020 / Published: 1 October 2020

Abstract

:
The sustainable development of mankind is a matter of concern to the whole world. Environmental pollution and haze diffusion have greatly affected the sustainable development of mankind. According to previous research, vehicle exhaust emissions are an important source of environmental pollution and haze diffusion. The sharp increase in the number of cars has also made the supply of energy increasingly tight. In this paper, we have explored the use of intelligent navigation technology based on data analysis to reduce the overall carbon emissions of vehicles on road networks. We have implemented a traffic flow prediction method using a genetic algorithm and particle-swarm-optimization-enhanced support vector regression, constructed a model for predicting vehicle exhaust emissions based on predicted road conditions and vehicle fuel consumption, and built our low-carbon-emission-oriented navigation algorithm based on a spatially optimized dynamic path planning algorithm. The results show that our method could help to significantly reduce the overall carbon emissions of vehicles on the road network, which means that our method could contribute to the construction of low-carbon-emission intelligent transportation systems and smart cities.

1. Introduction

The sustainable development of mankind is a matter of concern to the whole world. Environmental pollution and haze diffusion have greatly affected the sustainable development of mankind. Environmental protection has become one of the most relevant topics in the world. More and more effort has been delivered for the construction of smart cities in order to improve people’s lives and to make the world an ever better place [1,2,3,4].
One of the most important research topics in the construction of a smart city is dealing with the traffic problems in modern cities [5]. For decades, the development of cities has led to a rapid increase in vehicles. When the rapid increase of vehicles meets the relatively imbalanced development of urban road traffic facilities, traffic congestion becomes a common thing. The huge traffic volume and frequent traffic congestions lead to more vehicle exhaust emissions, which means more environmental pollution [6,7,8].
The development of the Internet of Cars and Intelligent Traffic System (ITS) makes it possible to handle traffic issues in modern cities through big data technologies. Based on traffic forecasting technology and intelligent navigation technology, we could implement a sustainable ITS focused on preventing environmental pollution. In this paper, we propose a sustainable intelligent navigation algorithm that considers fuel consumption and vehicle exhaust emissions based on big data technologies and machine learning methods. The contributions of our work are: (1) a novel genetic algorithm and particle-swarm-optimization-enhanced support vector regression (SVR) method for traffic flow prediction; (2) a vehicle exhaust emission model based on predicted road conditions and vehicle fuel consumption; (3) an environmentally friendly and sustainable intelligent navigation algorithm that considers fuel consumption and vehicle exhaust emissions based on a spatially optimized dynamic path planning algorithm.
The following are organized as follows. Related works are discussed in Section 2; our motivation for designing a sustainable intelligent navigation algorithm is introduced in Section 3. The vehicle emission model is presented in Section 4. Details of our traffic flow prediction method are described in Section 5. The low-carbon-emission-oriented navigation method is discussed in Section 6. Section 7 gives the experimental framework and a discussion of the results. Finally, the conclusion is drawn in Section 8.

2. Related Works

The study of vehicle navigation technology has a long history. In the early days, navigation technology was mainly physics-based. A milestone was the Honda Electro Gyrocator, which was the first commercially available automotive navigation technology in the world. Without the support of GPS (Global Positioning System) satellites, it used gyroscope sensing to determine the vehicle’s travel direction, and different sophisticated map cards were used to show roads [9,10].
In recent years, with the popularization of GPS technology and the development of mobile computing devices, navigation technologies have become more and more data-driven. In 2012, James Bicego [11] proposed a navigation system based on notifying about traffic incidents. The system consists of a large number of sensors, base stations, and communication systems. It is claimed to be able to effectively provide drivers with navigation routes that avoid going through traffic accidents. Bicego’s idea is interesting, but to identify a route as negative or positive by simply considering whether there are any traffic incidents could not be comprehensive enough. Traffic incidents would affect roads’ status and, thus, affect the road priorities for navigation, but in order to fully evaluate the influence on road networks, the networks need to be reflected in the terms of real-time traffic flow.
The shortest path algorithm, which selects the optimal route simply based on the evaluation of the physical lengths of different routes in the static road network, had been widely used in many car navigation systems, such as Google Maps or Baidu Maps. In recent years, short-term traffic flow forecasting has become a hot topic in the field of intelligent traffic navigation. Plenty of applications based on short-term traffic flow forecasting have come up online. They are either implemented based on traditional mathematical methods or artificial intelligence methods.
Short-term traffic flow forecasting methods based on traditional mathematical methods are usually built based on a conjecture that there is a law of traffic flow trends [12,13]. Once the trend of traffic flow is depicted by statistical calculations based on a mathematical model (for example, the kinematic theory model), the short-term future traffic flow changes can be inferred. Those methods, such as the linear regression model, autoregressive moving average model, and Kalman filter algorithm, are commonly used. However, these methods can only predict the temporary changes in traffic flow under normal conditions, but cannot reflect the change of traffic flow parameters in real time, let alone predict large-scale data with high accuracy.
Therefore, plenty of researchers turned to more complex machine learning methods or neural network methods with the purpose of depicting the real-time traffic flow more precisely in order to implement better prediction methods [14,15]. E.S. Yu implemented a feedforward back-propagation neural network algorithm to analyze the linear and non-linear changes in traffic flow [16]. Yu’s experiments confirmed that the short-term traffic flow prediction method based on neural networks is more robust against noise data than traditional mathematical methods. N. Messai’s research [17] presented a feedforward neural network approach for short-term traffic flow prediction on freeways. The accuracy of the approach was verified by the results of their experiments [17]. Lopez-Garcia et al. presented a method of optimizing the elements of a hierarchy of fuzzy-rule-based systems (FRBSs), which was a hybridization of a genetic algorithm and the cross-entropy (CE) method. It was used to predict congestion in a 9-km-long stretch of the I5 freeway in California, with time horizons of 5, 15, and 30 min [18]. Feng et al. proposed a short-term traffic flow prediction algorithm based on an adaptive multi-kernel support vector machine (AMSVM) with spatial–temporal correlation [19]. Linchao Li et al. proposed a deep feature learning approach to predict short-term traffic flow [20]. They implemented a deep belief network with several Restricted Boltzmann Machines to extract complex features of traffic flow.
One possible solution that serves navigation systems is the optimal path algorithm. In addition to navigation, optimal path planning technology could be used in many other applications, such as planet exploration, landmine detection, etc. [21]. The goal of an optimal path planning algorithm is to find the optimal path from the source point to the destination point in a given road network, with the restriction that the cost function gets a minimum value. Dijkstra’s algorithm and the A* search algorithm are the most common and classical ones in optimal path planning. Plenty of navigation systems are developed based on them. Many other methods, such as genetic algorithms, ant colony algorithms, and other intelligent algorithms have also been involved to solve optimal path planning problems. Lorraine McGinty et al. were the first to put forward the notion of “route quality”. They presented the idea that the route quality should be considered when choosing the optimal path [22]. In addition, Nie Y. suggested that the chosen path should consist of “reliable routes”, which are routes that ensure that the vehicle can arrive on time [23].
An important point in the smart city paradigm is the possible use of traffic detectors. Matt Grote et al. [24] developed their road traffic emission model based on readily available data generated by inductive loop detectors installed as parts of urban traffic control systems. Silvio Nocera et al. [25] provided their method for handling imperfect information in order to obtain a more accurate quantification of C O 2 emissions. Zhiwen Yang et al. [26] demonstrated their work of evaluating the benefits of using a speed-guided ITS based on real-world measurements.
According to our investigation of the literature, currently, there is little reporting about designing an optimal path planning algorithm that directly targets minimum vehicle exhaust emissions. Environmental protection and sustainable development are the keys to future construction of smart cities, which demand the restriction of overall vehicle exhaust emissions [2,4]. So, the designing of a sustainable intelligent navigation algorithm targeting the reduction of the overall carbon emissions of vehicles on road networks is necessary and important.

3. Motivation

The invention of vehicles has greatly facilitated people’s lives. However, the huge number of vehicles and the frequent traffic jams in modern cities have been deemed as the main cause of environmental pollution and haze diffusion. The sustainable development of humankind demands the protection of the environment. Thus, in this paper, we aim to build a sustainable intelligent navigation algorithm taking into account both the enhancement of the traveling efficiency of individual vehicles and the reduction of the carbon emissions of overall vehicles on the road network.
Traditionally, a navigation algorithm is used to find the shortest path or the path with the least traveling time. Either way, an evaluation constraint is defined to help make the decision [27,28].
In order to build a sustainable intelligent navigation algorithm, we need to define an evaluation constraint. In this paper, we use the vehicle exhaust emissions associated with a path as the evaluation constraint of our navigation algorithm. The exhaust emission of a vehicle is correlated with a lot of factors, including the specific situation of that vehicle, the specific situation of the road network, the traffic condition of the road network, the running speed of that vehicle, the traveling time of that vehicle, the traveling distance of that vehicle, and so on [29]. More traveling distances or more traveling time would mean more fuel consumption of a vehicle, which would further lead to more exhaust emissions. More traffic jams would suggest more traveling time of a vehicle, leading to more fuel consumption and, thus, more exhaust emissions.
Therefore, our sustainable intelligent navigation algorithm consists of three main modules: (1) the vehicle emission model, (2) traffic flow prediction method, and (3) low-carbon-emission-oriented navigation method. We will discuss them in detail in the following sections.

4. Vehicle Emission Model

There are many kinds of vehicle emission models in the literature. The most common models are the instantaneous fuel consumption model [30], four-mode elemental fuel consumption model [30], running speed fuel consumption model [30,31], comprehensive modal emission model [32,33], and so on. The comprehensive modal emission model is attractive by virtue of its key features: universality to all kinds of vehicles and observation of almost every factor affecting emissions [34]. Considering the scenario in this paper, we decided to deduce the required simplified vehicle emission model based on the comprehensive modal emission model. As a matter of fact, we designed it to calculate the second-by-second speed profile as the cent unit for forecasting, and the integral of emission during the overall period is used to measure the emission amount.
According to the comprehensive modal emission model, the instantaneous emission rate E (g/s) of greenhouse gases during engine start-up is directly related to the fuel consumption rate F (g/s). Here, E = δ 1 F + δ 2 . F can be calculated as:
F ξ ( K N V + P / η ) / κ ,
where ξ is the fuel-to-air mass ratio, κ is the fuel calorific value, η is the efficiency parameter of the engine, K represents the engine friction factor, N represents the engine speed in RPM (revolutions per minute), and V represents the engine displacement. Generally, the engine friction factor is 0.2, and the engine displacement varies from 1.0 to 6.0 L. Here, P represents the total power of the vehicle when running:
P = P t r a c t / η t f + P a c c ,
where η t f represents the efficiency of the mechanical transmission.
In this paper, it is assumed in the calculation that the additional energy consumption power P a c c of the engine is 0. Combining those two formulas, the energy consumption of a certain distance can be obtained as follows:
F ( V ) ξ K N V d / v + ξ P t r a c t γ d / v ,
where P t r a c t represents the power the vehicle wheels can finally get after all kinds of mechanical transmission. It can be calculated as:
P t r a c t = ( M a + M g s i n θ + 0.5 C d ρ A v 2 + M g C r c o s θ ) v / 1000 ,
where M is the total weight (kg), a is the instantaneous acceleration of the vehicle (m/s 2 ), v is the speed of the vehicle (m/s), and θ is the road slope angle, while g represents the gravity acceleration (m/s 2 ), ρ represents the air density (kg/m 3 ), A represents the frontal surface area of the vehicle (m 2 ), C d represents the coefficient of aerodynamic drag, and C r represents the coefficient of rolling resistance of the vehicle.
Here, let α = g s i n θ + g C r c o s θ , β = 0.5 C d ρ A . Obviously, both α and β are correlated to road circumstance instead of the vehicle, so the P t r a c t can be concisely formulated as:
P t r a c t = ( M v α + β v 3 ) / 1000 .
Assume that, for each vehicle, all the parameters except the speed are stable when driving on a r o a d ( i , j ) . Then, set d i j as the length of the road, set θ i j as the road slope angle, and set v i j as the average speed of the vehicle on this road. Next, split the total weight M into two parts, the vehicle’s net weight m and the load weight m 0 . Finally, the energy consumption on this r o a d ( i , j ) can be calculated as:
F i j ( m + m 0 , v i j , d i j ) = λ ( k N V + ( m + m 0 ) γ α i j v i j + β γ v 3 ) d i j / v i j ,
where λ and γ are constants, since λ = ξ / κ ψ and γ = 1 / ( 1000 η t f η ) , and ψ is the energy conversion value from g/s to L/s.
During the calculation of Equation (6), the vehicle data will be loaded from the vehicle feature database. In addition, historical traffic data would continuously flow through the traffic flow prediction algorithm described in Section 5 to provide information needed about the road network.
In this work, we adopted the research data from [35], and the values of all concerned parameters are collated in Table 1. As for the vehicle model, we chose the Volkswagen Passat 280TSI, which is one of the most popular types of civilian vehicles nowadays. The related parameters are collated in Table 2. Is it was impractical to gather all the relevant data of the slope and friction of every road, we temporarily do not consider the impact of different road conditions on the calculation, but assume that all the roads have the same slopes with the same friction. For the same reason, in this work, we assume that the vehicles’ mechanical performance is stable and their situations only depend on traffic circumstances without any weather changes and without depending on the driver’s emotional interests. Then, the calculation can be divided into three parts depending on the vehicle’s situation: acceleration or deceleration, cruising, idling.

4.1. Acceleration or Deceleration

Based on the above assumptions, traffic circumstances can lead vehicles to alternate between cruising and idling via short processes of uniform acceleration or uniform deceleration. The average speed is approximately equal to half of the vehicle’s cruise speed. Therefore, after loading data from Table 1 and Table 2, the fuel consumption during this time can be calculated as:
F ( d i j , v i j ) = 0.0000315 d i j ( 18.414 / v i j + 0.4892 + 0.0008 v i j 2 ) .
The additional time consumption is:
t b = 2 2 d i j / v i j .

4.2. Cruising

When the vehicle is cruising, the fuel consumption can be estimated using:
F ( d i j , v i j ) = 0.0000315 d i j ( 9.207 / v i j + 0.4892 + 0.0032 v i j 2 ) .
The time consumption is:
t a = d i j / v .

4.3. Idling

While the vehicle is idling or under the speed of 5 km/h, the following can be used to calculate the fuel consumption [35]:
F i = α t i .
Combining the above data, the fuel consumption rate can be inferred to be approximately α 0.000278 L/s. Meanwhile, the time consumption depends on the congestion time.

5. Traffic Flow Prediction Method

The prediction of traffic flow is essential for improving navigation efficiency. Traffic flow is influenced by the complex and changeable behavior of traffic participants. Consequently, traffic flows have stochastic properties. Traffic flow prediction involves finding patterns in the historical data and, thus, predicting the traffic flow situation in the future.
There are basically two kinds of traffic flow prediction: long-term prediction and short-term prediction. Long-term prediction refers to a period of over 30 min, and short-term prediction refers to less than 5 min [20,36,37]. Short-term traffic flow prediction models need to meet the following requirements:
  • Accuracy: Accuracy is the most basic requirement. Accurate prediction of future traffic conditions is the basis for accurate navigation.
  • Real-time: Real-time is the precondition of the application. The process of training, solving, and prediction of the model needs to have high efficiency. As the traffic flow varies greatly in a short time, once the predicted result loses its timeliness, it loses its significance.
  • Adaptability: Adaptability is essential to guarantee the stability of the whole system. The traffic flow will be disturbed by many factors in a short time. The prediction model needs to be able to change flexibly and deal with different conditions through simple adjustment of parameters to ensure the stability of the system.
In this paper, we have implemented a short-term traffic flow prediction model using support vector regression (SVR). We have combined the genetic algorithm (GA) and particle swarm optimization (PSO) to choose parameters for SVR. The provided GA and PSO (GAPSO)-SVR achieves accurate prediction results of traffic flow as well as fast convergence speed.

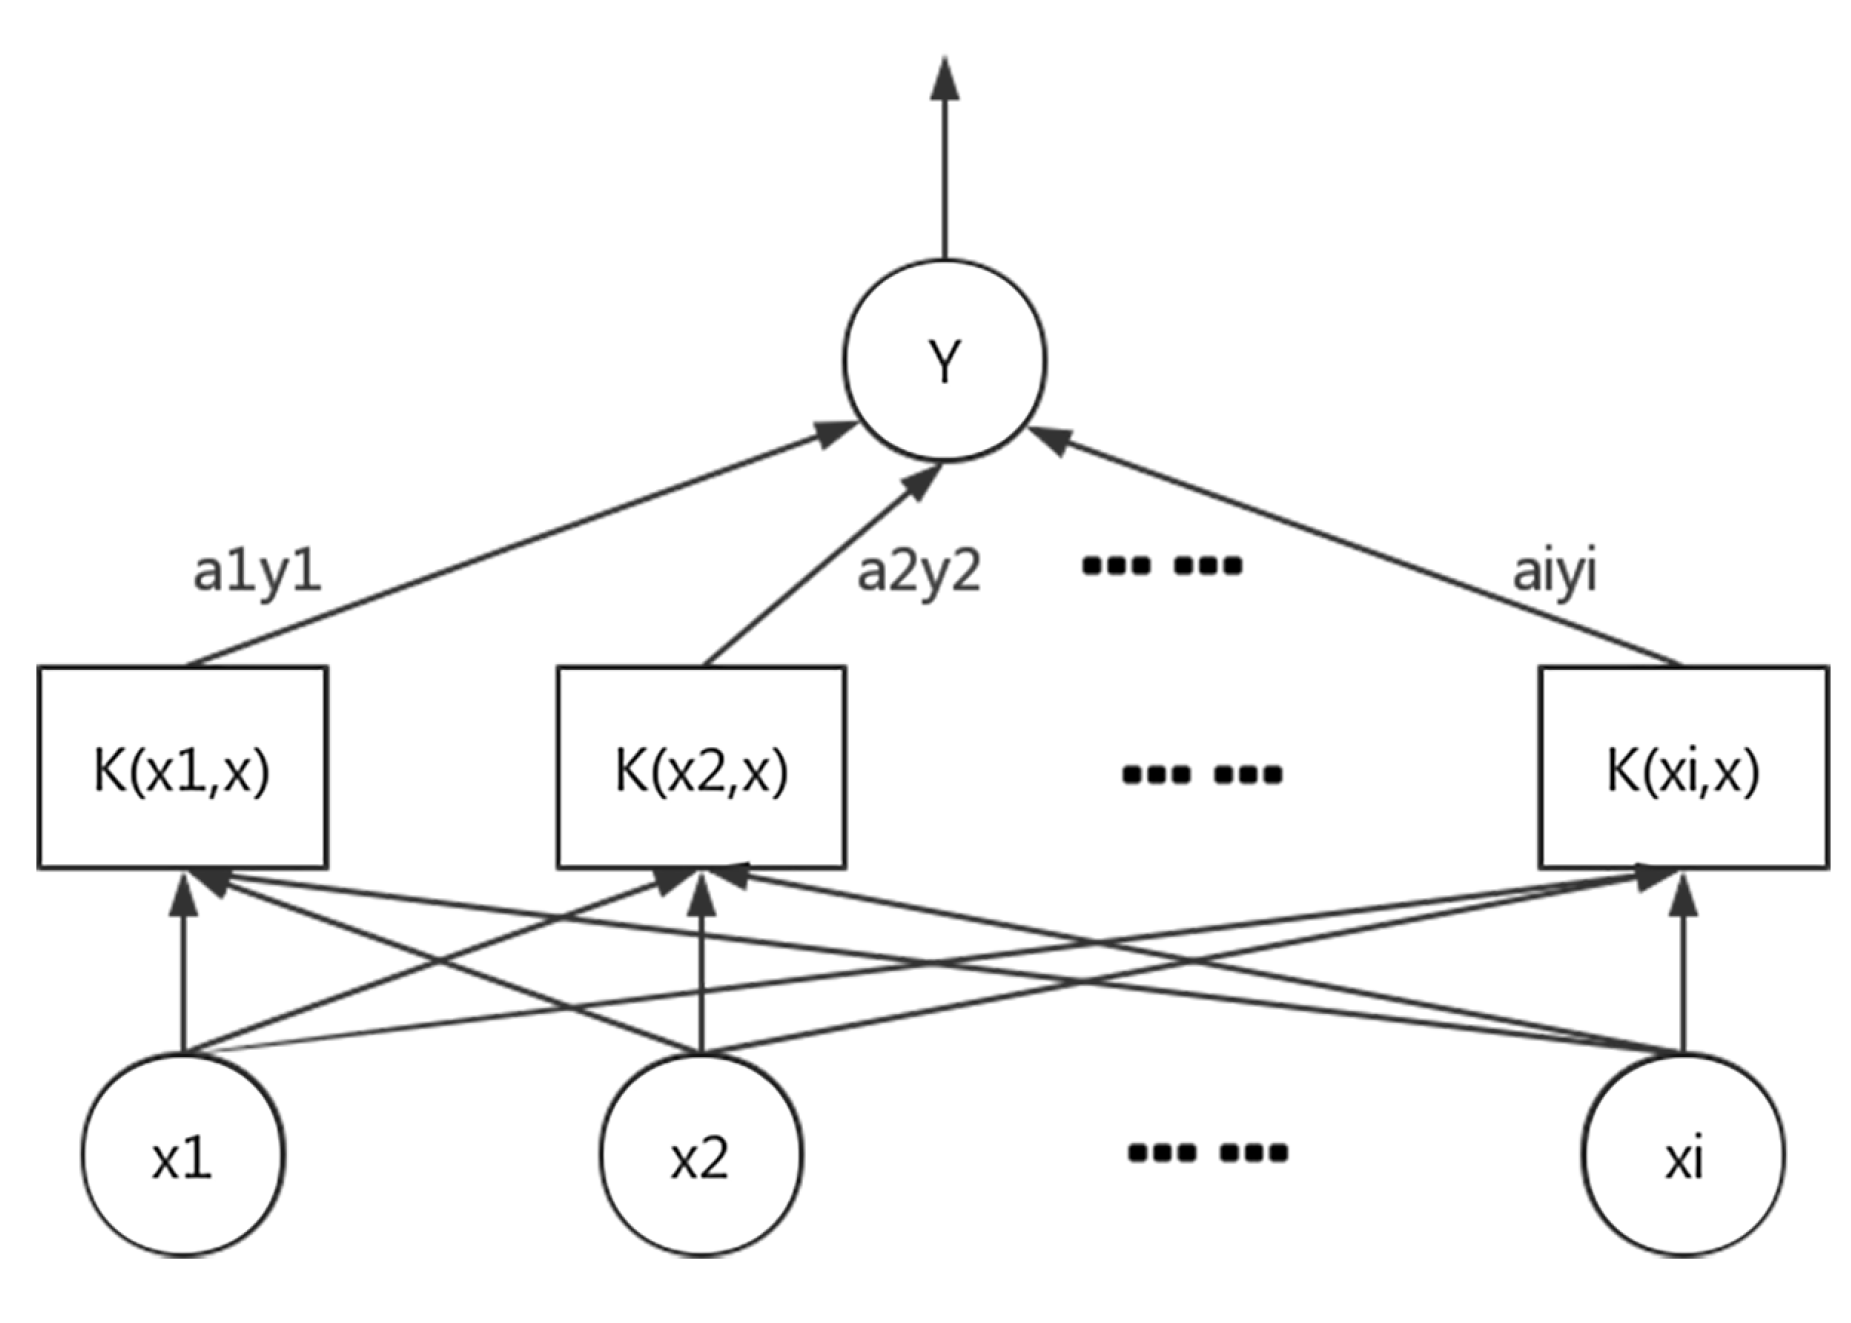
5.1. Traffic Flow Prediction Based on Support Vector Regression

SVR is a regression prediction algorithm based on the support vector machine (SVM) theory. It is a supervised machine learning algorithm used to deal with classification problems. In dealing with small samples, high dimensions, and nonlinear problems, SVR has a strong ability. It has been widely used in the related fields of stock forecasting, wind forecasting, traffic flow forecasting, and so on.
The structure of an SVM can be divided into the input layer, intermediate node layer, and output layer. A general structure of an SVM is shown in Figure 1. By introducing an insensitive loss function and corresponding kernel functions, an SVM can be extended and applied to regression estimation problems, that is, SVR [38].
The most important thing for traffic flow prediction is to minimize the prediction error of the future traffic flow. In this paper, we chose the average of squared residuals (ASR) to be the objective function, considering that the ASR is preferable in massive data calculation. The smaller the ASR is, the fewer discrepancies there would be. Thus, the objective function is designed as:
E r r o r = 1 N i = 1 N ( y i m ( y i ) ) 2 ,
where N represents the number of samples, y i represents the actual traffic flow value, m ( y i ) represents the predicted traffic flow value, and E r r o r represents the prediction error. The goal of traffic flow prediction is to minimize the E r r o r .
The main steps of establishing the traffic flow prediction model based on SVR are as follows:
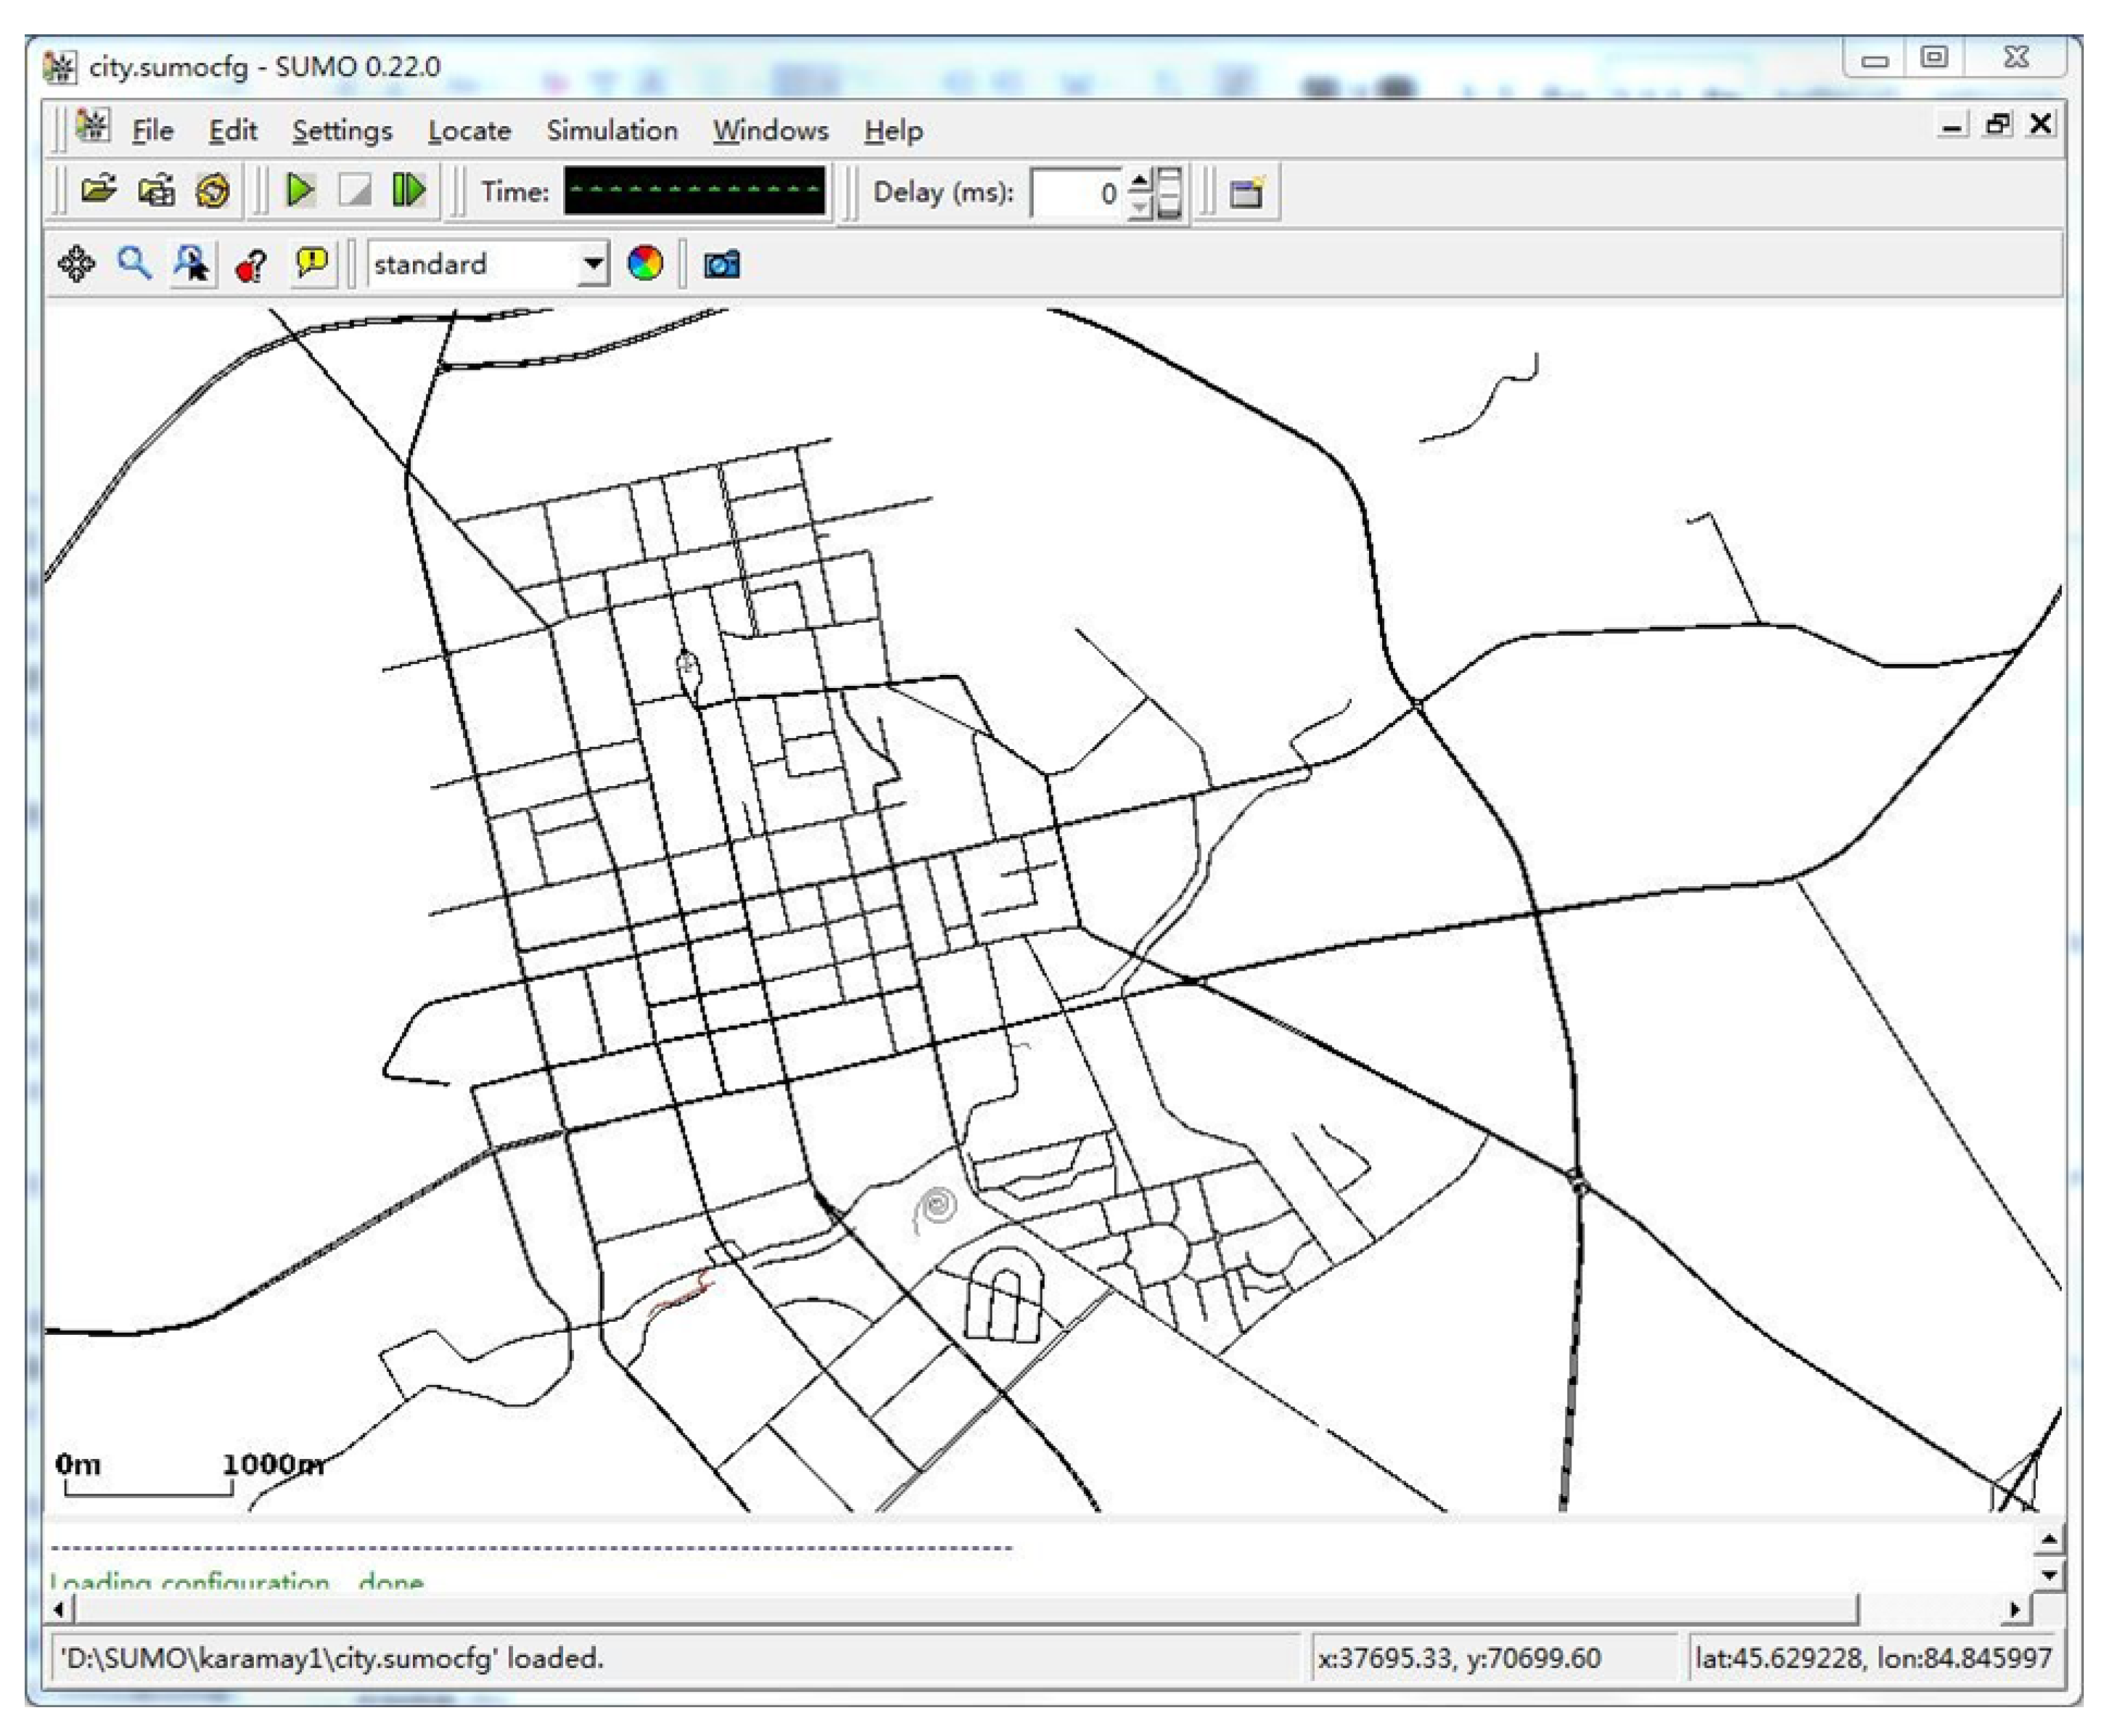
  • Data Preparation: Extract historical data from the database. Construct a road map, calibrate coordinates, and transform historical data into traffic flow data. Normalize the data and divide them into a training set and a test set.
  • Data Analysis: Analyze the characteristics of the data, choose parameters of SVR, and obtain the decision function.
  • Model Construction: Build the SVR model with the training set. Evaluate the forecasting results using the test set. Finally, apply the model to real-time traffic flow data for real-time forecasting.
There are three kinds of parameters that are important for the SVR prediction model:
  • Penalty coefficient C: It adjusts the proportion between empirical risk and expected risk so as to make the model get the best generalization ability.
  • Insensitivity coefficient ϵ : It affects the number of support vectors, thus affecting the generalization ability of the model.
  • Kernel function parameters σ : It influences the distribution of input samples in the feature space and the correlation between support vectors.
Some existing studies set those coefficients by experience, C = 0.01 , ϵ = 0.8 , σ = ( 2 ) 2 . However, this method is not adaptive because using the same parameters can not guarantee to achieve the best training effect for different types of problems and different data characteristics.

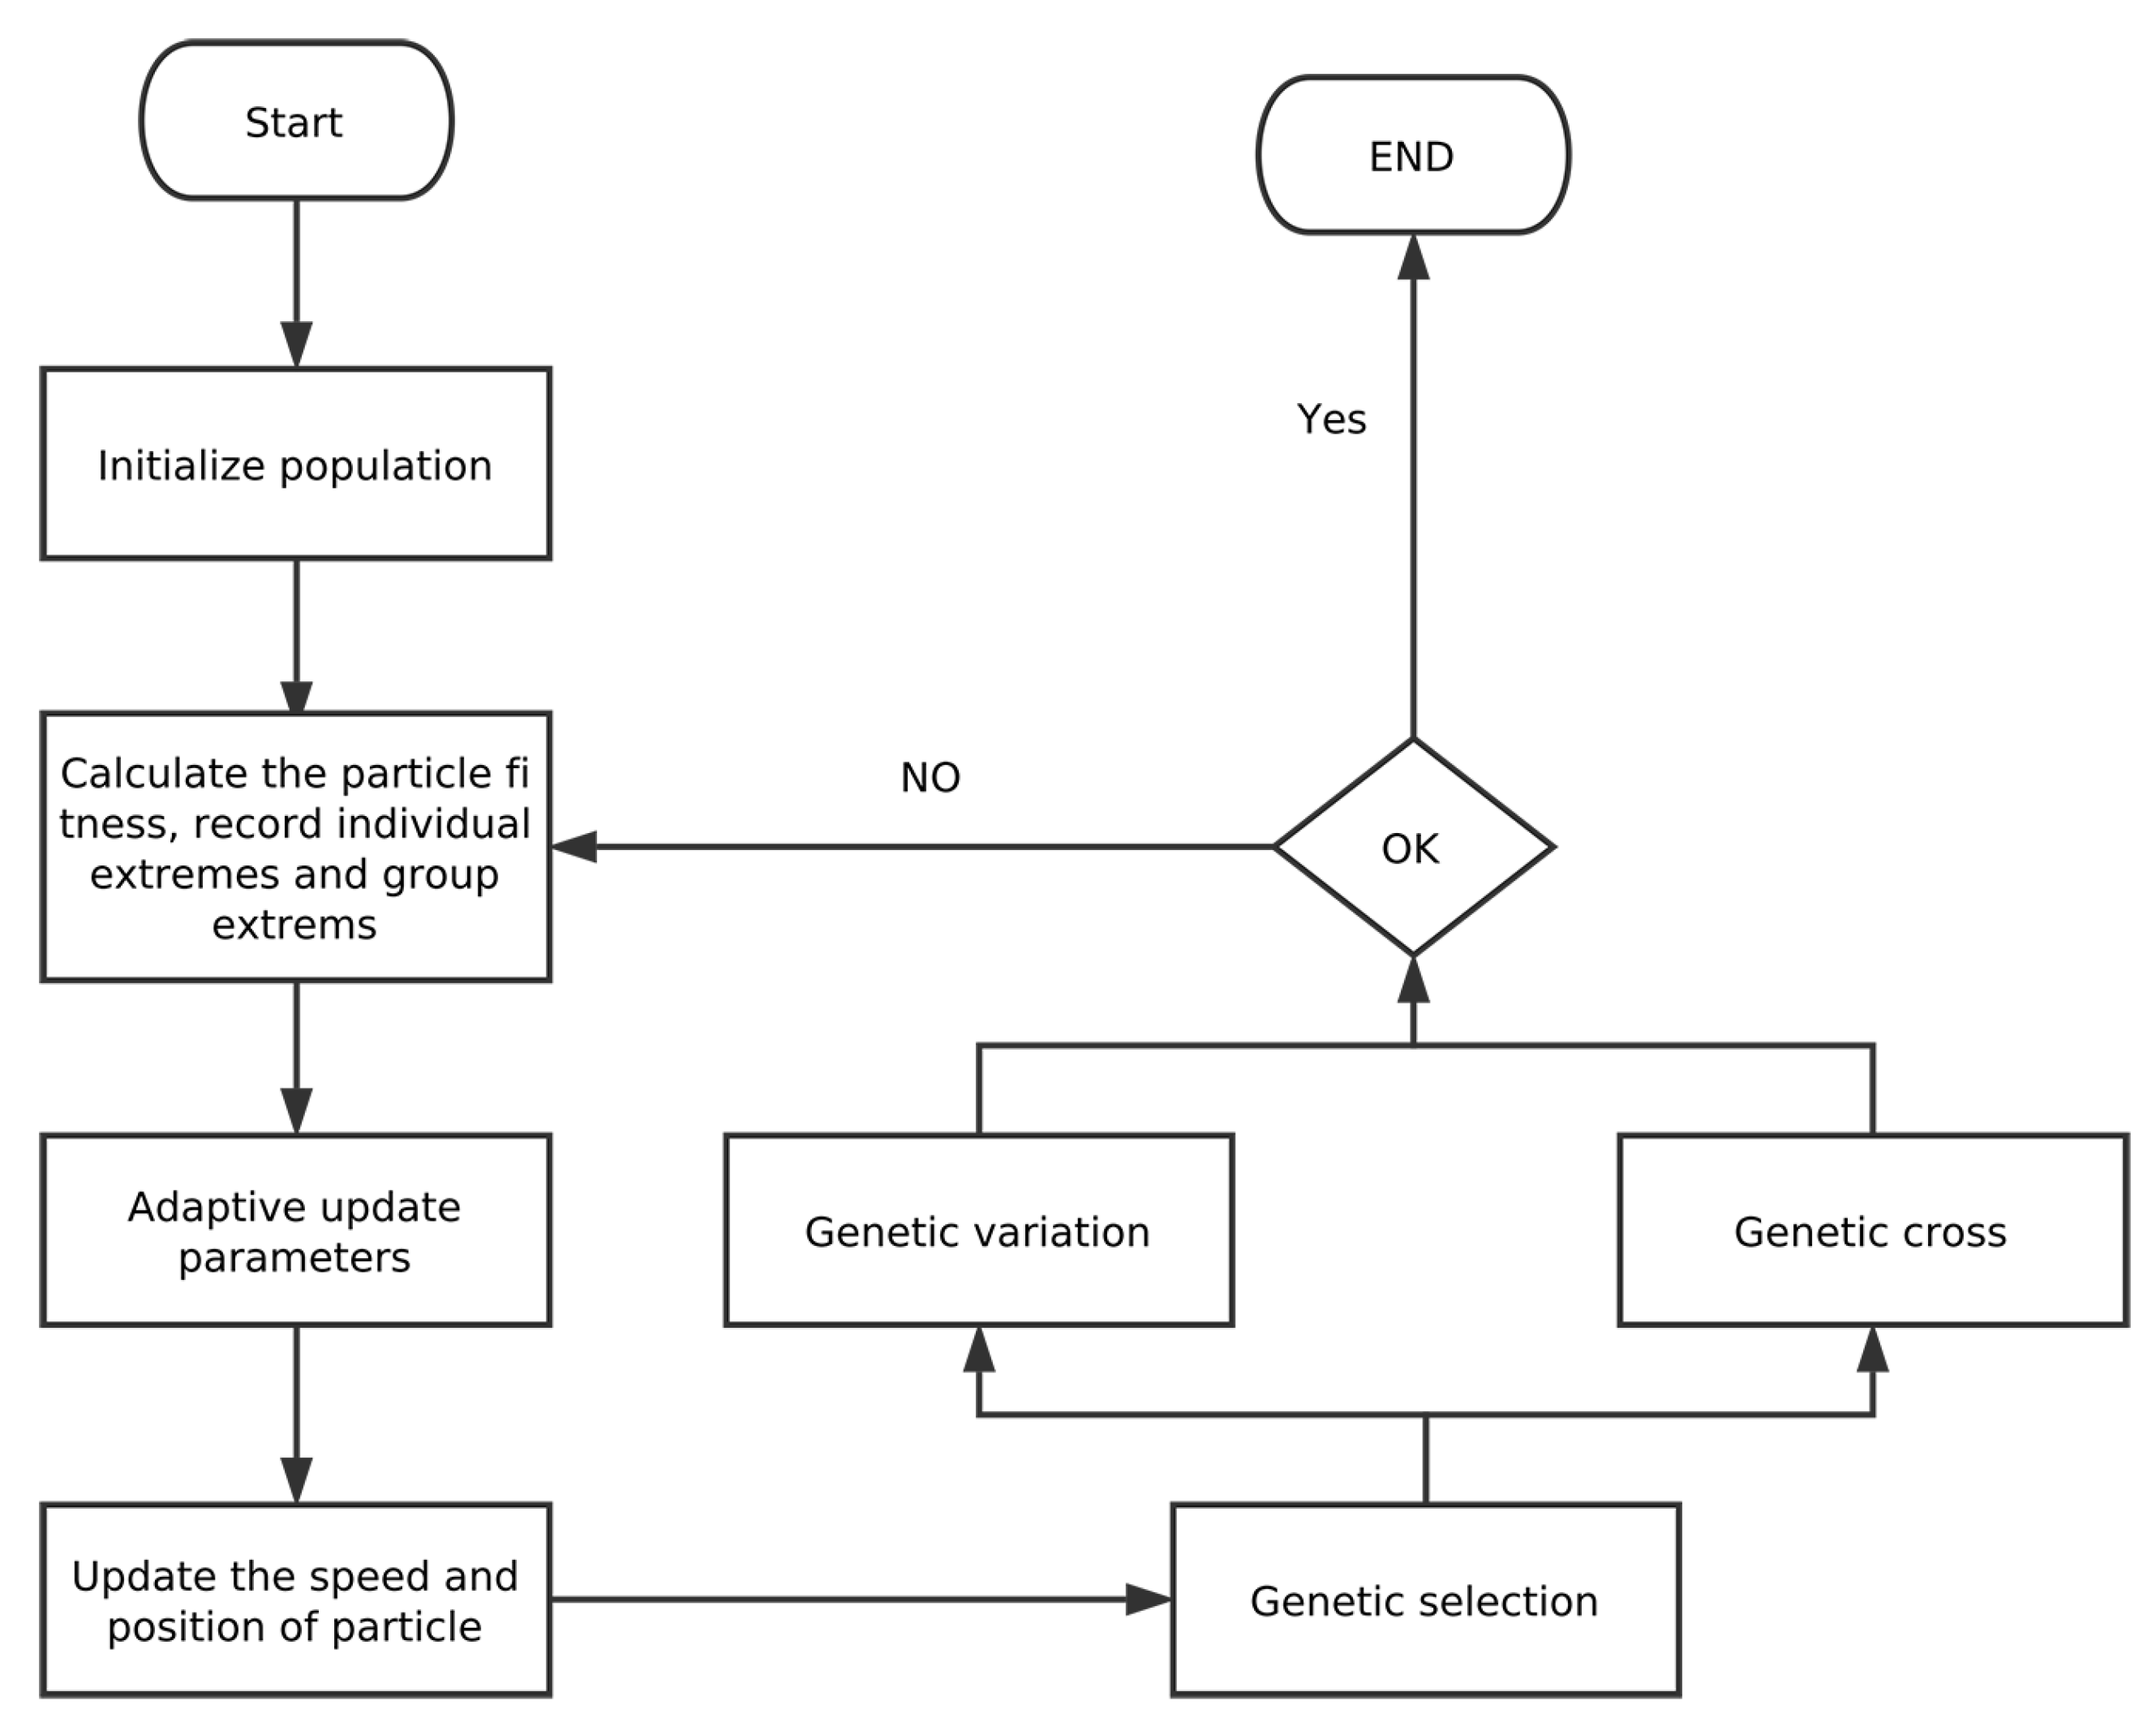
5.2. GAPSO-Enhanced SVR

As we said before, the penalty coefficient, insensitivity coefficient, and kernel function parameters have a decisive impact on the prediction results. We need to find a way to optimize those parameters for SVR.
The PSO algorithm has the advantages of fast convergence speed, simple operation process, and easy implementation. However, the PSO algorithm cannot be guaranteed to get the optimal value. While the GA has strong global optimization ability, its implementation process is more complicated and the convergence speed is slow. Therefore, if the two can be combined, we can achieve a better model.
The decision variables of the PSO algorithm are inertial weight ω and learning factors c 1 , c 2 . The details of the setting of those parameters are discussion below.
(1) Inertial weight: Inertial weight ω controls the effect of the previous state on the current state. ω can balance the global search ability and local search ability of the algorithm. The inertial weight ω affects the searching ability of the algorithm. The bigger the ω is, the stronger the global optimization ability is, but the convergence would be slower. The smaller the ω is, the faster the convergence process is, but this would also narrow the scope of the optimization. In this paper, the linear recursive method is used to update the ω so that the algorithm has strong global searchability in the early stage. In the later period, a fine search can be carried out locally. The ω updating formula is as follows:
ω ( k ) = ω s t a r t ( ω s t a r t ω e n d ) k / k m a x ,
where k m a x represents the maximum number of iterations of the algorithm and k represents the current iteration number. ω s t a r t = 0.9 represents the starting value, and ω e n d = 0.4 represents the ending value.
(2) Learning factor: The learning factor is used to adjust the proportion of individual particle experience and group experience in its flight. Learning factors c 1 , c 2 also affect the searchability of the algorithm. Smaller learning factors will let the particles wander in the range away from the target area, while larger learning factors will fly particles as soon as possible to the target area to converge [39]. In this paper, the non-linear symmetry method is used to update the learning factors c 1 , c 2 . The formula is as follows:
c 1 = c 1 s + ( c 1 e c 1 s ) k / k m a x
c 2 = c 2 s + ( c 2 e c 2 s ) k / k m a x ,
where c 1 s and c 1 e represent the starting and ending values of c 1 , and c 2 s and c 2 e represent the starting and ending values of c 2 . The range of variation of c 1 is [2.5,1] and the range of c 2 is [2.75, 1.5].
The decision variables of the GA algorithm are crossover probability p c and mutation probability p m . We apply the following steps to obtain the genetic evolution of particles. The genetic evolution of the particles mainly includes the selection, crossover, and mutation operations.
(1) Selection: We use the best reservation and the worst elimination mechanism. First, the particles are sorted according to their fitness. The best particle enters the next generation directly with their genes. The worst particles are unconditionally mutated.
(2) Crossover: The probability of crossover is p c . In an engineering implementation, the general range of crossover probability is [0.45, 0.99]. We assume that the particles to be crossed are x i , x j . The particles’ location updating formulas are:
x i k + 1 = α 1 x i k + ( 1 α 1 ) x j k
x j k + 1 = ( 1 α 1 ) x i k + α 1 x j k
The speed updating formulas are:
v i k + 1 = α 2 v i k + ( 1 α 2 ) v j k
v j k + 1 = ( 1 α 2 ) v i k + α 2 v j k ,
where α 1 , α 2 are two random numbers with the range [0, 1]. We propose an adaptive crossover probability formula:
p c = ( p c 1 p c 2 ) ( f m a x f ) f m a x f a v g , | f f a v g p c 1 , | f < f a v g ,
where p c 1 and p c 2 are constant values, which are set to 0.9 and 0.6, respectively, according to our evaluation. f is the fitness value of the two individuals under the crossover operation. f a v g is the fitness value of the whole particle group, and f m a x represents the optimal fitness in the current particle swarm.
(3) Mutation: In order to make the direction of mutation beneficial to the evolution of the particle swarm, we choose to mutate the position of the selected particle under probability p m . In an engineering implementation, the general range of mutation probability is [0.001, 0.5]. Suppose that the d t h dimension of p i is p i d . p i d is applied by the strategy of random perturbation. The perturbation β obeys the normal distribution, whose mean value is 0, and the variance is 1. The formula is as follows:
p i d = p i d ( 1 + 0.5 β ) .
The probability of mutation also has an important influence on the effect of the algorithm. If p m is too small, the ability to generate new individuals will become weak. If p m is too large, then the search algorithm is not conducive to convergence. Therefore, this paper presents an adaptive mutation probability formula as follows:
p m = ( p m 1 p m 2 ) ( f m a x f ) f m a x f a v g , | f f a v g p m 1 , | f < f a v g ,
where p m 1 and p m 2 are constant values, which are set to 0.1 and 0.001, respectively, according to our evaluation. f is the fitness value of the particle under mutation. It can be seen from the formula that the probability of mutation will be dynamically adjusted with respect to the current particle and the particle swarm’s optimizing situation. Figure 2 illustrates the flow of the GAPSO algorithm. The termination condition of our algorithm is that the maximum iteration number is reached.
Finally, we apply GAPSO to optimize the parameters of SVR and obtain the SVR model for traffic flow prediction.

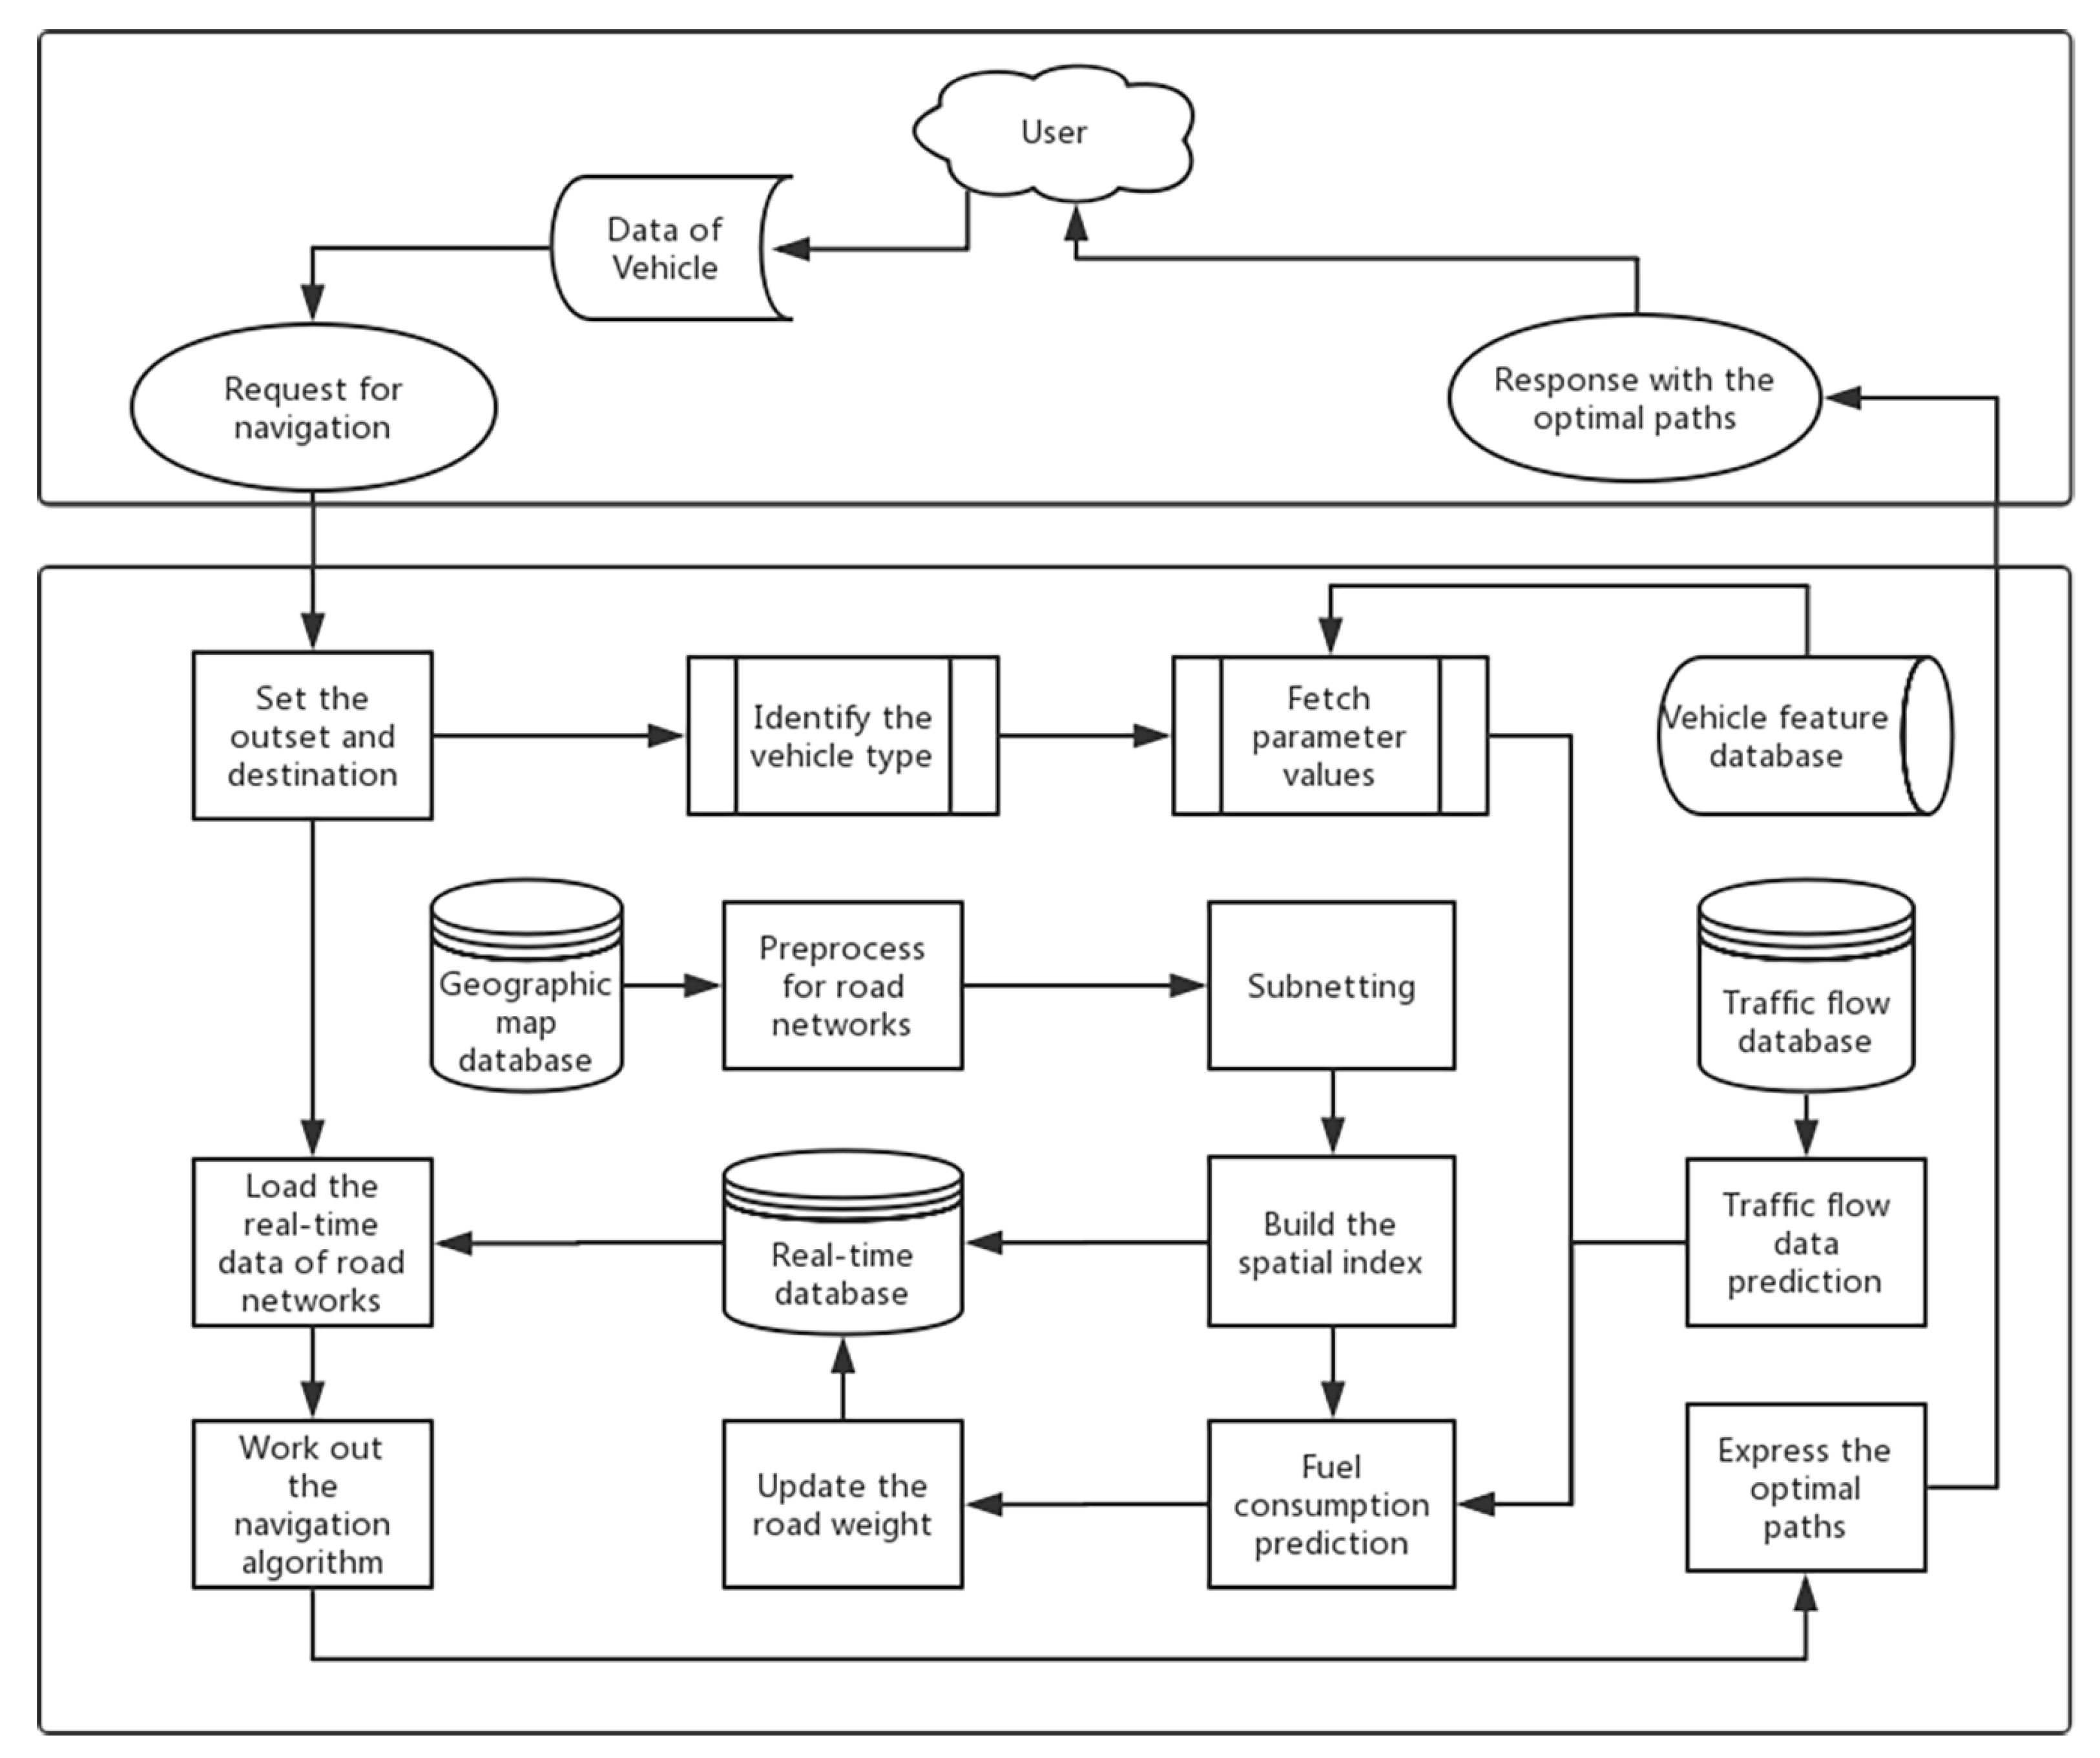
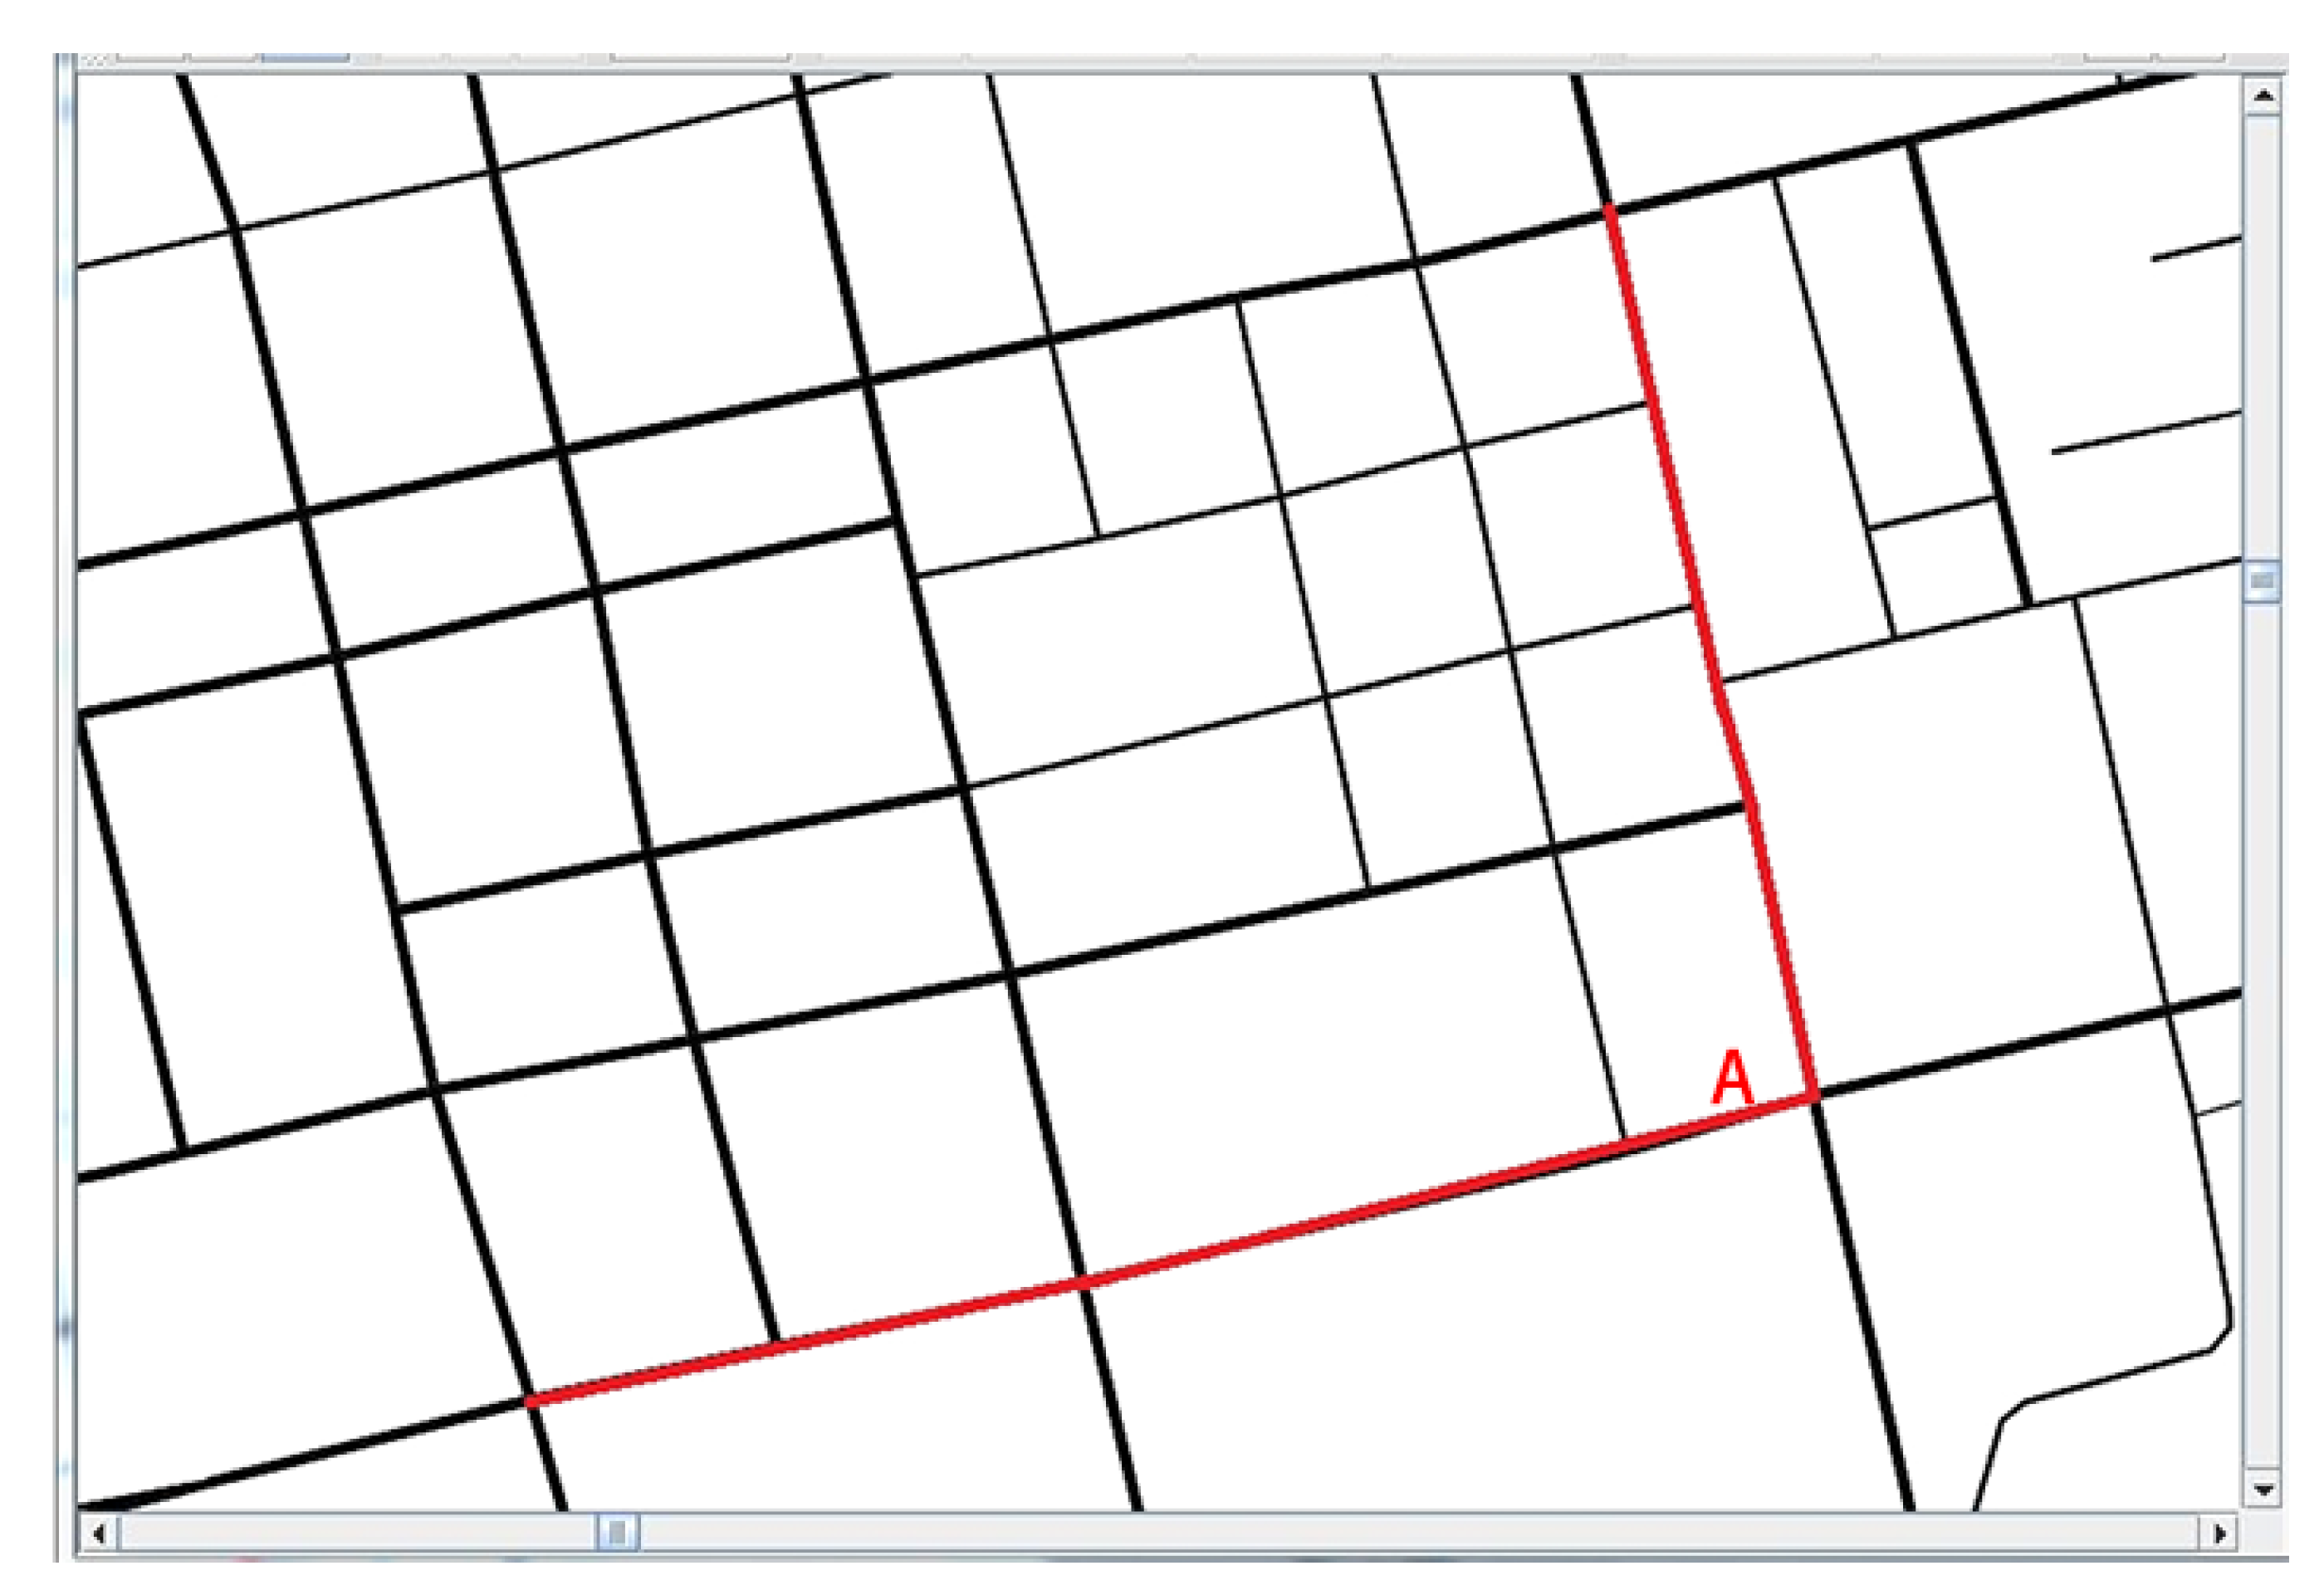
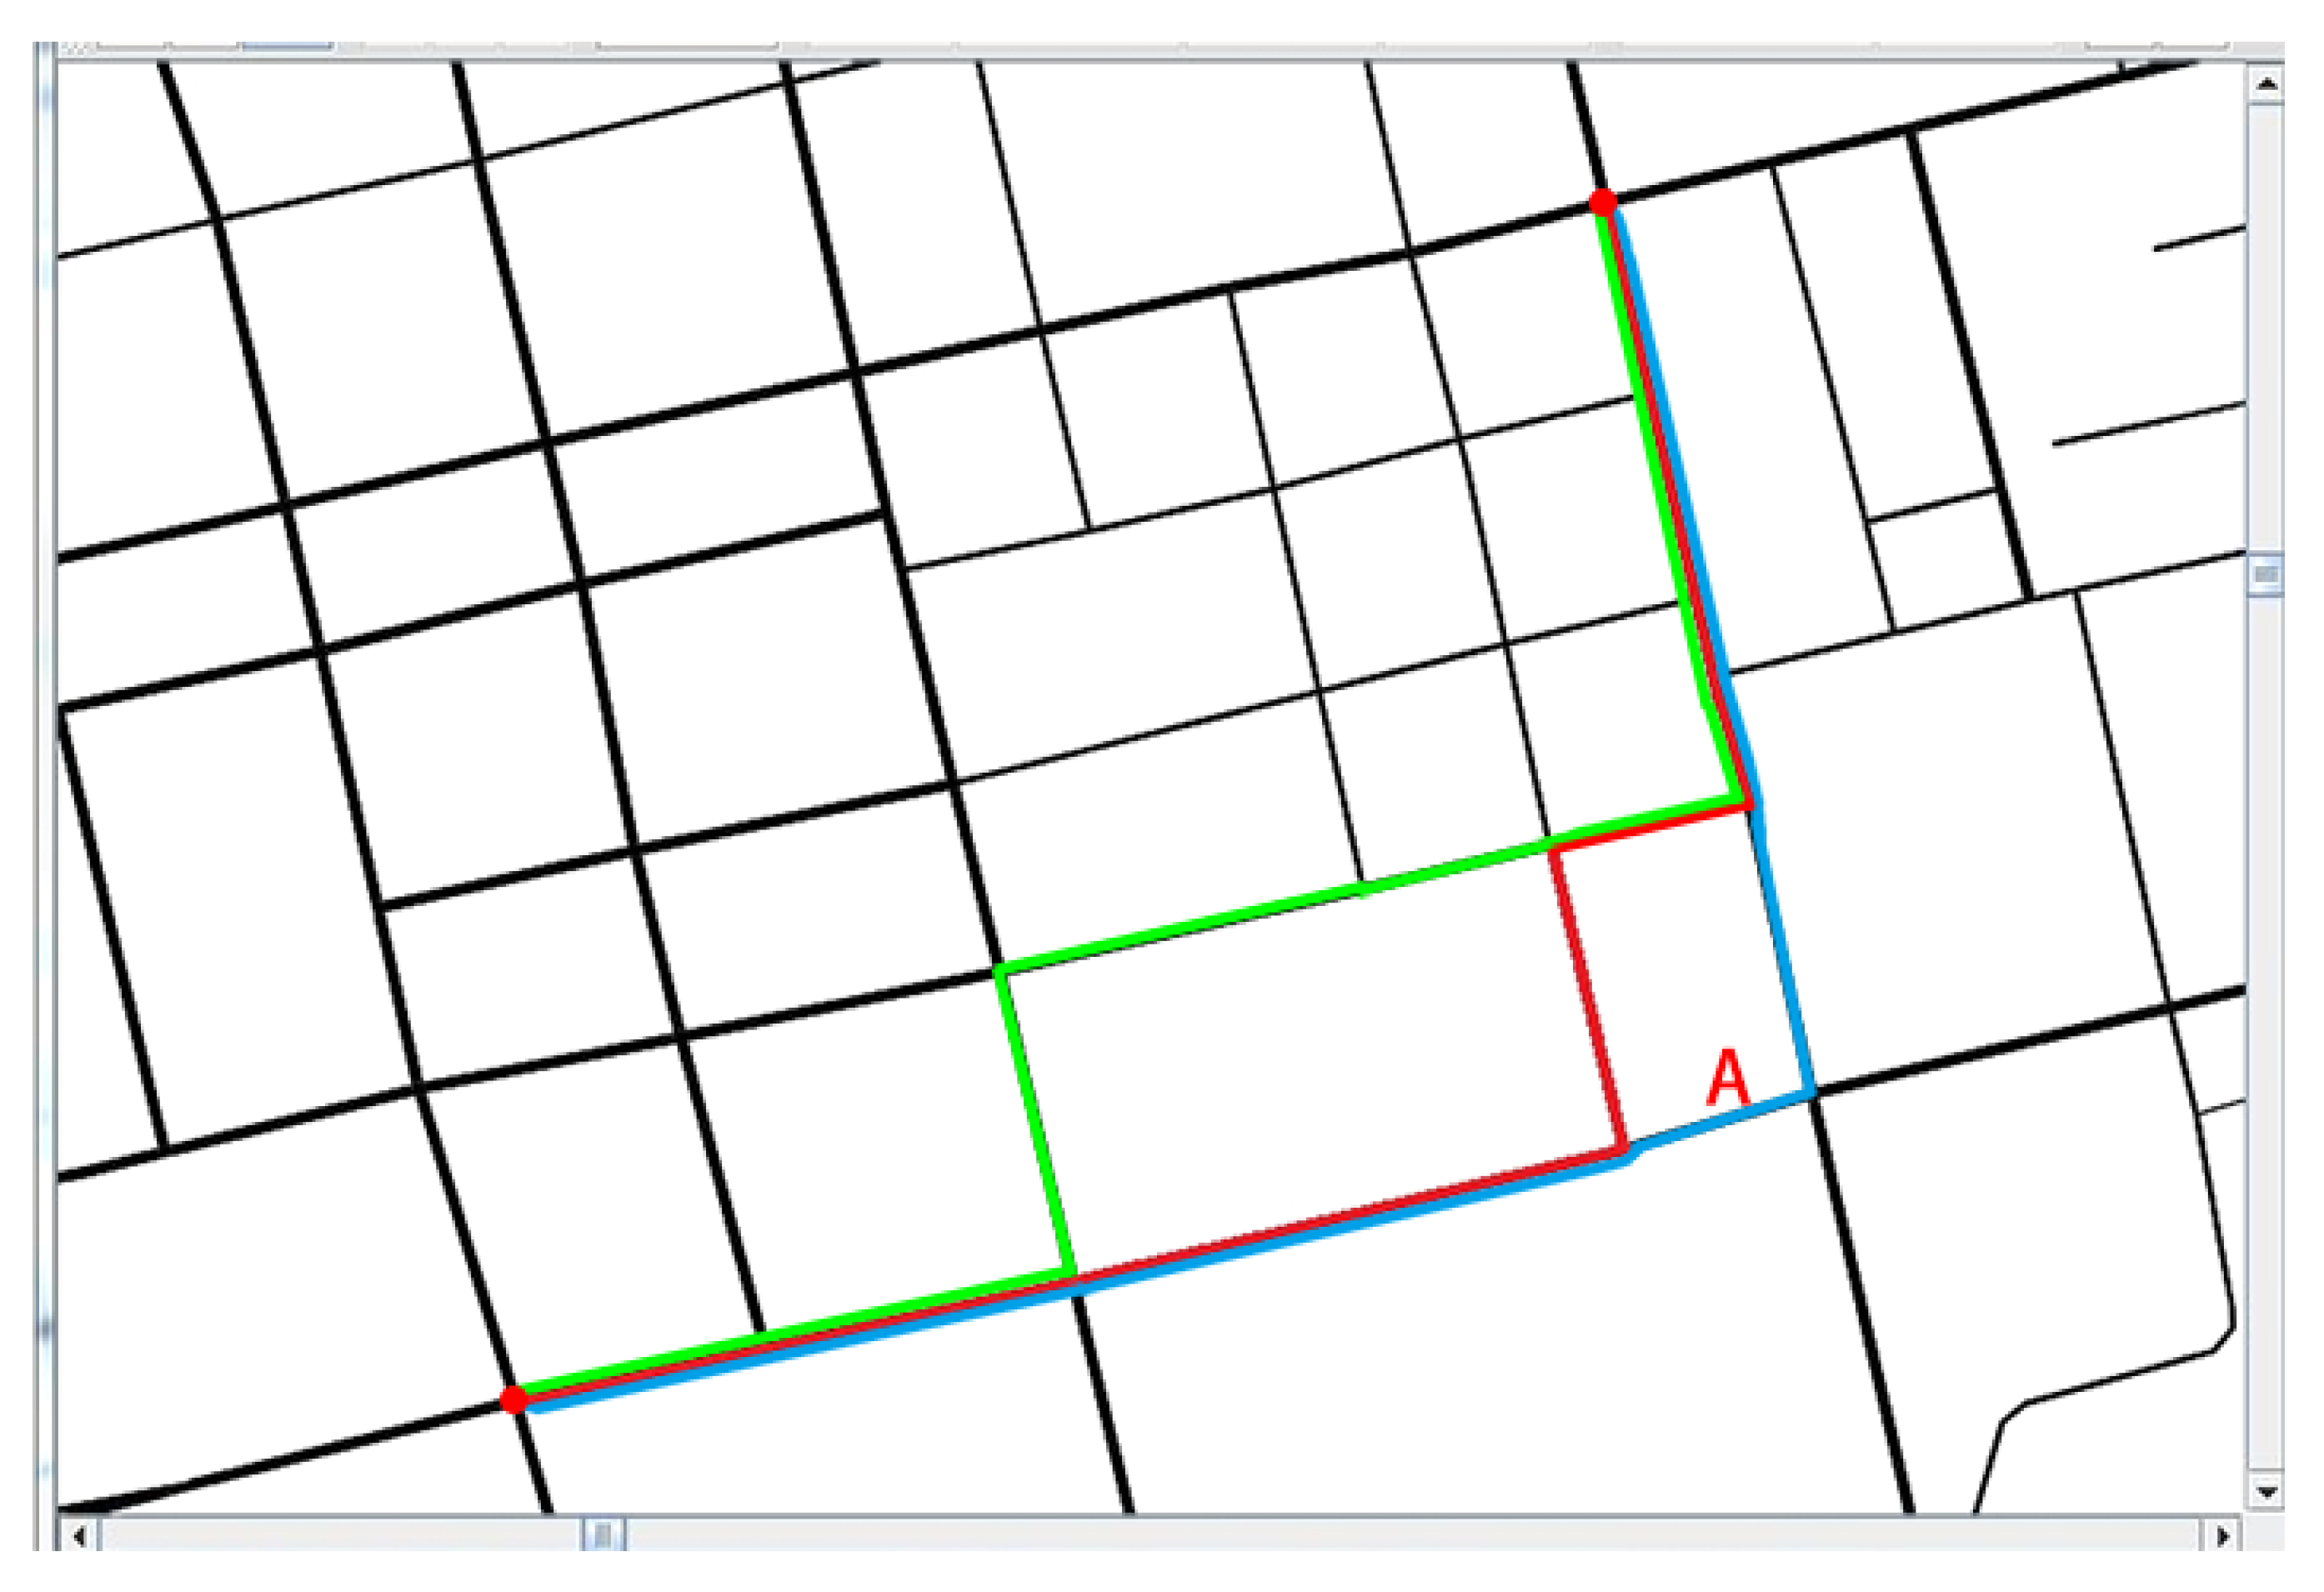
6. Low-Carbon-Emission-Oriented Navigation Method

There are two key factors that determine the effect of real-time navigation technology. One is the processing speed of real-time traffic flow, and the other one is the time complexity of path planning algorithms [40]. Details of our traffic flow prediction method can be found in Section 5. Following the specific models and formulas, for each road in the road network, the road congestion level as well as the estimated vehicle speed can be predicted [41]. So long as the vehicle speed is estimated, with the algorithms in Section 4, the potential vehicle carbon emissions become measurable. Then, we can get a map of roads, for which each road mapping has an estimated carbon emission amount.
In this paper, we chose to apply an optimized dynamic path planning algorithm based on the A* search algorithm to take care of the path planning jobs, which is a contribution from our previous research. The performance and other details of the algorithm are demonstrated in [42].
The A* search algorithm’s cost function is defined as:
f ( n ) = g ( n ) + h ( n ) ,
where g ( n ) represents the exact cost (the actual fuel consumption) from the outset to the current point, and h ( n ) represents the heuristic estimated cost from the current point to the destination. In order to reduce the time complexity, we optimized the algorithm in two ways:
(1) Controlling the scale of the search space: Rather than directly using the A* algorithm to search in the whole road network, we decompose the road network into different sub-nets first, then select the appropriate one to be the search space. This can not only reduce the time consumption in A* searching, but also scale down the real-time data, which need to be updated from the whole road network to smaller sub-nets.
(2) Restricting the search direction: We also take into consideration of the directions of roads to speed up the converging process. It has been experimentally proven that the closer the direction is to the destination, the more likely it has smaller costs. So, this can help to reduce the searching time consumption as well.
By virtue of the contributions of Mingbin Zeng and Xu Yang in [42], this paper is not intended for further discussion of the above two approaches. As a result, the following is used to calculate the heuristic estimated cost h ( n ) :
h ( n ) = λ ( 1 c o s α ) / 2 F e ,
where α represents the angle between the road direction and the destination direction, and F e represents the estimated fuel consumption from the current point to the destination. The λ is designed here to provide additional leverage to ensure the balance between road directions and fuel consumption. Generally, we set this constant to 1 so that it does not really matter in the calculation.

7. Experimental Results

7.1. Experimental Framework

The navigation system mainly consists of the following modules: data collection and preprocessing, road network topology construction and optimization, real-time traffic flow data analysis, road network weight calculation, and low-carbon navigation algorithm solution. The overall structure is depicted in Figure 3.
As shown in the figure, three pivotal databases work for navigation: the geographic map database, the traffic flow database, and the real-time database. The geographic map database is the overall storage for coordinates of all roads and the intersections among them. The traffic flow database guarantees the supply of sufficient data for our GAPSO-SVR prediction model, which demands both speed and accuracy. The real-time database stores the data generated by the preprocess of subnetting road networks and building the spatial index. It is a high-speed database in which road networks and road weights are stored. There is another database that stores data of vehicle parameters, since different types and models of vehicles have different features. For each navigation request, the system will set the outset and destination, and figures out the vehicle’s feature values, then loads real-time data from the real-time database, which consists of road networks and different weights on different road segments. The data of road weights would be generated by another process, which starts from the traffic flow data prediction. Traffic flow data prediction would be carried out to bring the essential messages of road congestion levels and estimated vehicle speed. Then, the fuel consumption could be successfully predicted with these data. Then, as discussed in Section 6, the system follows the procedure to figure out the heuristic estimated costs and to update the corresponding road weights in the real-time database. Finally, all conditions become ripe, and an optimized dynamic path planning algorithm based on the A* search algorithm is used to pick the optimal paths, as already discussed in Section 6. The process returns the optimal paths in response to the initial navigation request from users.
As for basic operation interfaces, we chose Simulation of Urban Mobility (SUMO) to simulate road networks, load real-world traffic data, simulate traffic situations, etc. SUMO is an open-source traffic simulation platform, which can simulate the process of moving vehicles with specified demands in a given road network. In this paper, some scripts were used to deliver the output data from algorithms to the XML dataset used for the SUMO simulation. Meanwhile, we also desired to develop an easier-to-use and better-looking mobile app that combines the visualization advantages of SUMO with the performance of our algorithms. That part of the work is already on the schedule, but is beyond the scope of this paper.

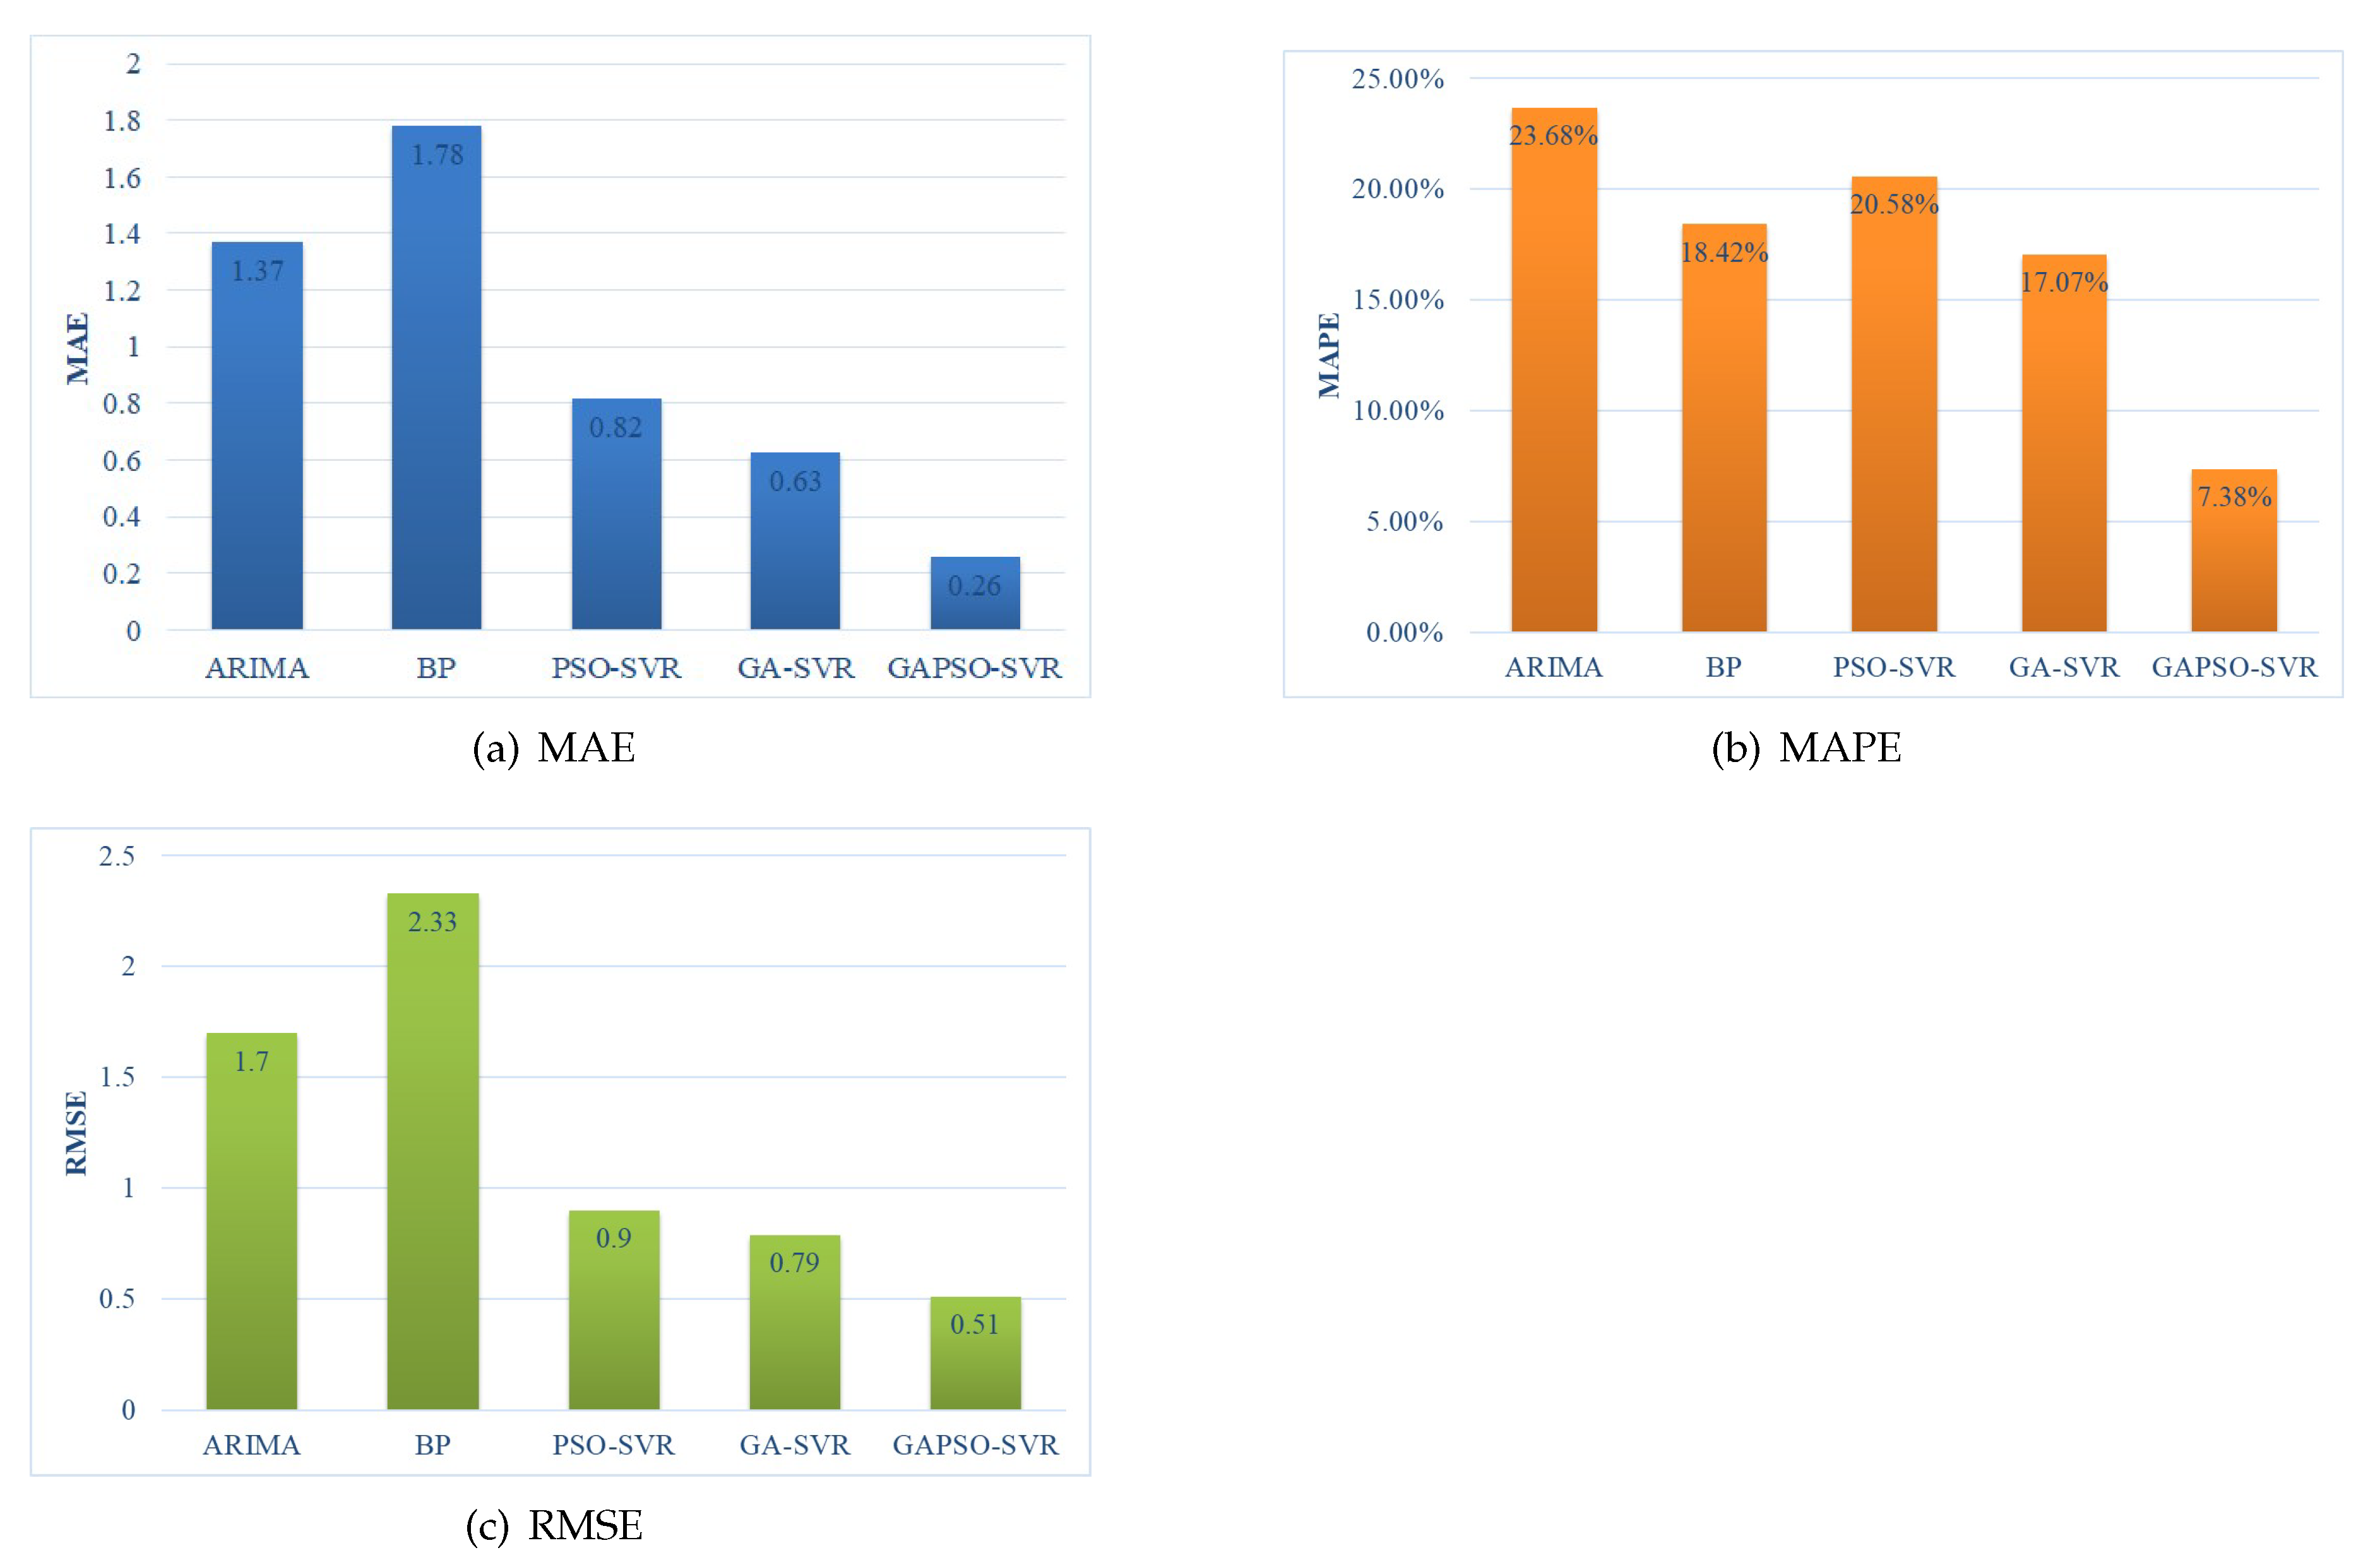
7.2. Evaluation of the Traffic Flow Prediction Model

We used real traffic flow data from Cologne, Germany as experimental data here; an example is shown in Table 3.
We used mean absolute error ( M A E ), mean absolute error percentage ( M A P E ), and root mean square error ( R M S E ) to measure the quality of traffic flow prediction. M A E stands for mean absolute error:
M A E = 1 T t = 1 T | X ^ ( t ) X ( t ) | ,
where X ^ ( t ) is the predicted value, and X ( t ) is real value. M A P E stands for mean absolute error percentage:
M A P E = 1 T t = 1 T | X ^ ( t ) X ( t ) | X ( t ) × 100 % .
R M S E stands for root mean square error:
R M S E = 1 T t = 1 T | X ^ ( t ) X ( t ) | 2 .
The baseline methods we chose to compare with our method were ARIMA (Auto Regessive Integrated Moving Average), BP (Back-Propagation) Neural Network (BP), PSO-optimized SVR (PSO-SVR), and GA-optimized SVR (GA-SVR). Our method is denoted as GAPSO-SVR. The comparison results of different methods are shown in Figure 4. The comparison results of the convergence times for the three kinds of SVR-based methods are shown in Figure 5. According to those comparisons, we could conclude that, among all three SVR-based methods, the GAPSO-SVR could generate the best prediction results while maintaining the lowest necessary convergence time.

7.3. Evaluation of the Low-Carbon-Emission-Oriented Navigation Algorithm

We used SUMO to simulate road networks in Karamay, as demonstrated in Figure 6. We used SUMO to generate the traffic flow simulation of Karamay.
Suppose that there is a car going from node 1942418153 to node 445359828, and assume that at the beginning, every road is clear without any traffic jams. Our program finally works out the path, as depicted in Figure 7. Table 4 demonstrates the road network weights and time consumptions on each road of the path.
We picked the shortest path planning method and the minimum time consumption planning method to compare with our method. Under this scenario, the three methods would generate the same optimal path, as depicted in Figure 7. This is consistent with our life experience; if we choose the path with the shortest length while all roads are unimpeded, it would take the shortest time to reach the destination and achieve the best fuel efficiency.
Now let us assume that, suddenly, a traffic accident occurs at node A, which almost chokes the traffic flow nearby. We used SUMO to simulate this situation. Our program automatically updates the data, as shown in Table 5.
Figure 8 shows the results of the three methods under this scenario. Our program flexibly responds to the changes in circumstances. The optimal path selected by our algorithm changes because of potential changes in fuel consumption. The new path is depicted with a red line in Figure 8, and the road weights are recorded in Table 6. Compared with the previous path, it is obvious that the new path bypassed the congested segments and turned towards segments with much lower carbon emissions.
The blue line represents the result of the shortest path planning method. If we insist on obeying the shortest path planning, the total fuel consumption would increase by 15% and the time consumption by 32.5%. This indicates that traffic congestion can greatly affect the operation of vehicles, resulting in unnecessary fuel consumption and more exhaust emissions.
The green line represents the result of the minimum time consumption path planning method. It would also adjust the picked path according to changes in the traffic conditions, benefiting from the output of the traffic flow prediction model. Compared with the red path case, if we choose the green path, the fuel consumption would be 1 % more, while time consumption would be 1.6 % less. In other words, we can take the cost of six seconds—in this case, 2.6 km travel—to save one percent of the fuel energy. This may not seem to have much impact, but once it is multiplied by the number of vehicles running on our mother Earth, it cannot be denied that this is a considerable reduction in carbon emissions and fuel consumption.

8. Conclusions

In this paper, we have implemented a sustainable intelligent navigation algorithm, which consists of three modules: a simplified vehicle emission model, a traffic flow prediction method, and a low-carbon-emission navigation method. Unlike traditional navigation systems, which are commonly based on static urban road networks without real-time analysis of changes in traffic networks or are focused on reducing the traveling time or traveling distance, our method put all our effort into enhancing the result by using big data technologies and focusing on the issue of reducing carbon emission. It especially deserves to be mentioned that we have optimized the cost function for better time complexity by controlling the scale of search spaces and restricting the search directions. The accuracy and reliability of our program have been validated in the road networks of Karamay.
In this paper, we have simulated a complete navigation process. Using our algorithm to navigate for traveling a distance of about 2.6 km, we could achieve less fuel consumption and fewer exhaust emissions than by using other currently popular algorithms. However, it is worth mentioning that in this case, our algorithm navigates to a route six seconds longer than the route with the optimal time consumption. If this is used for long-distance travel, the extra time consumption may be greater. So, we conclude that in some extreme situations, such as medical rescues, firefighting, or even catching flights, there is no doubt that we should give priority to time. However, in daily life, we may be able to weigh both time and fuel consumption and find a balance of both. This involves some further research work; we will continue the study this in the future.
On account of that, the program requires a large amount of work, such as on traffic flow prediction, carbon emission calculation, and path planning options—things can become extremely complicated in actual daily use. Our research still needs to be further improved; we will also arrange tests and make improvements based on large-scale datasets in the future.
The history of vehicle transportation has been around for hundreds of years and will continue to grow with the development of human society. Internal combustion engine powered vehicles are still the mainstay of transportation; they not only consume large amounts of energy, but also bring air pollution. Smart cities demand sustainable development and environmental friendliness while improving transportation efficiency [43]. However, current research on how to reduce vehicle emissions always considers the vehicles themselves. This paper investigated the relationship between vehicle navigation and emissions and proposed a real-time navigation technology that directly targets the reduction of vehicle carbon emissions. The experiments showed that our work can help reduce vehicle emissions while providing upgrades for smarter transportation, which will be beneficial for constructing a low-carbon-emission intelligent transportation system and, thus, for further promoting the development of smart cities. Low-carbon navigation technology deserves in-depth study and should be strongly promoted. Once it is broadly adopted by vehicles all around the world, countless carbon emissions can be reduced. In the future, we will continue to conduct in-depth research to bring more specific and intelligent transportation solutions.

Author Contributions

Conceptualization, Z.X. and T.P.; methodology, Y.L.; software, Z.X.; validation, Y.L.; formal analysis, T.P.; investigation, X.Y.; resources, X.Y.; data curation, Z.X.; writing—original draft preparation, T.P.; visualization, Y.L.; supervision, X.Y.; project administration, X.Y.; funding acquisition, X.Y. All authors have read and agreed to the published version of the manuscript.

Funding

This work is supported by the National Natural Science Foundation of China under Grant No. 91846303.

Conflicts of Interest

The authors declare no conflict of interest. The funders had no role in the design of the study; in the collection, analyses, or interpretation of data; in the writing of the manuscript, or in the decision to publish the results.

References

  1. Alkhammash, E.H.; Jussila, J.; Lytras, M.D.; Visvizi, A. Annotation of smart cities Twitter micro-contents for enhanced citizen engagement. IEEE Access 2019, 7, 116267–116276. [Google Scholar] [CrossRef]
  2. Lytras, M.D.; Visvizi, A.; Sarirete, A. Clustering smart city services: Perceptions, expectations, responses. Sustainability 2019, 11, 1669. [Google Scholar] [CrossRef] [Green Version]
  3. Visvizi, A.; Lytras, M.D.; Damiani, E.; Mathkour, H. Policy making for smart cities: Innovation and social inclusive economic growth for sustainability. J. Sci. Technol. Policy Manag. 2018, 9, 126–133. [Google Scholar] [CrossRef] [Green Version]
  4. Visvizi, A.; Lytras, M.D. Rescaling and refocusing smart cities research: From mega cities to smart villages. J. Sci. Technol. Policy Manag. 2018, 9, 134–145. [Google Scholar] [CrossRef]
  5. Lytras, M.D.; Visvizi, A. Who uses smart city services and what to make of it: Toward interdisciplinary smart cities research. Sustainability 2018, 10, 1998. [Google Scholar] [CrossRef] [Green Version]
  6. Liang, Z.; Wakahara, Y. City traffic prediction based on real-time traffic information for intelligent transport systems. In Proceedings of the 2013 13th International Conference on ITS Telecommunications (ITST), Tampere, Finland, 5–7 November 2013; IEEE: Piscataway, NJ, USA, 2013; pp. 378–383. [Google Scholar]
  7. Deng, R.; Liang, H. Whether to charge an electric vehicle or not? A near-optimal online approach. In Proceedings of the 2016 IEEE Power and Energy Society General Meeting (PESGM), Boston, MA, USA, 17–21 July 2016; IEEE: Piscataway, NJ, USA, 2016; pp. 1–5. [Google Scholar]
  8. Wang, X.; Ning, Z.; Wang, L. Offloading in Internet of vehicles: A fog-enabled real-time traffic management system. IEEE Trans. Ind. Inform. 2018, 14, 4568–4578. [Google Scholar] [CrossRef]
  9. Tagami, K.; Takahashi, T.; Takahashi, F. “Electro Gyro-Cator” New Inertial Navigation System for Use in Automobiles; Society of Automotive Engineers: Warrendale, PA, USA, 1983; pp. 1103–1114. [Google Scholar]
  10. Arai, M.; Nakamura, Y.; Shirakawa, I. History of development of map-based automotive navigation system ‘honda electro gyrocator’. In Proceedings of the 2015 ICOHTEC/IEEE International History of High-Technologies and Their Socio-Cultural Contexts Conference (HISTELCON), Tel-Aviv, Israel, 18–19 August 2015; IEEE: Piscataway, NJ, USA, 2015; pp. 1–4. [Google Scholar]
  11. Bicego, J. Method and System for Automatically Updating Traffic Incident Data for In-Vehicle Navigation. U.S. Patent 8,155,865, 10 April 2012. [Google Scholar]
  12. Kumar, S.V. Traffic flow prediction using Kalman filtering technique. Procedia Eng. 2017, 187, 582–587. [Google Scholar] [CrossRef]
  13. Zhao, J.; Sun, S. High-order Gaussian process dynamical models for traffic flow prediction. IEEE Trans. Intell. Transp. Syst. 2016, 17, 2014–2019. [Google Scholar] [CrossRef]
  14. Yang, B.; Sun, S.; Li, J.; Lin, X.; Tian, Y. Traffic flow prediction using LSTM with feature enhancement. Neurocomputing 2019, 332, 320–327. [Google Scholar] [CrossRef]
  15. Luo, X.; Li, D.; Zhang, S. Traffic flow prediction during the holidays based on DFT and SVR. J. Sens. 2019, 2019, 1–10. [Google Scholar] [CrossRef] [Green Version]
  16. Yu, E.S.; Chen, C.Y.R. Traffic prediction using neural networks. In Proceedings of the GLOBECOM’93, IEEE Global Telecommunications Conference, Houston, TX, USA, 29 November–2 December 1993; IEEE: Piscataway, NJ, USA, 1993; pp. 991–995. [Google Scholar]
  17. Messai, N.; Thomas, P.; Lefebvre, D.; El Moudni, A. A neural network approach for freeway traffic flow prediction. In Proceedings of the International Conference on Control Applications, Glasgow, UK, 18–20 September 2002; IEEE: Piscataway, NJ, USA, 2002; Volume 2, pp. 984–989. [Google Scholar]
  18. Lopez-Garcia, P.; Onieva, E.; Osaba, E.; Masegosa, A.D.; Perallos, A. A Hybrid Method for Short-Term Traffic Congestion Forecasting Using Genetic Algorithms and Cross Entropy. IEEE Trans. Intell. Transp. Syst. 2016, 17, 557–569. [Google Scholar] [CrossRef] [Green Version]
  19. Feng, X.; Ling, X.; Zheng, H.; Chen, Z.; Xu, Y. Adaptive Multi-Kernel SVM With Spatial-Temporal Correlation for Short-Term Traffic Flow Prediction. IEEE Trans. Intell. Transp. Syst. 2019, 20, 2001–2013. [Google Scholar] [CrossRef]
  20. Li, L.; Qin, L.; Qu, X.; Zhang, J.; Wang, Y.; Ran, B. Day-ahead traffic flow forecasting based on a deep belief network optimized by the multi-objective particle swarm algorithm. Knowl. Based Syst. 2019, 172, 1–14. [Google Scholar] [CrossRef]
  21. Raja, P.; Pugazhenthi, S. Optimal path planning of mobile robots: A review. Int. J. Phys. Sci. 2012, 7, 1314–1320. [Google Scholar] [CrossRef]
  22. McGinty, L.; Smyth, B. Personalised route planning: A case-based approach. In Proceedings of the European Workshop on Advances in Case-Based Reasoning, Trento, Italy, 6–9 September 2000; Springer: Berlin/Heidelberg, Germany, 2000; pp. 431–443. [Google Scholar]
  23. Nie, Y.M.; Wu, X. Shortest path problem considering on-time arrival probability. Transp. Res. Part Methodol. 2009, 43, 597–613. [Google Scholar] [CrossRef]
  24. Grote, M.; Williams, I.; Preston, J.; Kemp, S. A practical model for predicting road traffic carbon dioxide emissions using Inductive Loop Detector data. Transp. Res. Part Transp. Environ. 2018, 63, 809–825. [Google Scholar] [CrossRef]
  25. Nocera, S.; Ruiz-Alarcn-Quintero, C.; Cavallaro, F. Assessing carbon emissions from road transport through traffic flow estimators. Transp. Res. Part Emerg. Technol. 2018, 95, 125–148. [Google Scholar] [CrossRef]
  26. Yang, Z.; Peng, J.; Wu, L.; Ma, C.; Zou, C.; Wei, N.; Zhang, Y.; Liu, Y.; Andre, M.; Li, D.; et al. Speed-guided intelligent transportation system helps achieve low-carbon and green traffic: Evidence from real-world measurements. J. Clean. Prod. 2020, 268, 122230. [Google Scholar] [CrossRef]
  27. Deng, Y.; Chen, Y.; Zhang, Y.; Mahadevan, S. Fuzzy Dijkstra algorithm for shortest path problem under uncertain environment. Appl. Soft Comput. 2012, 12, 1231–1237. [Google Scholar] [CrossRef]
  28. Pan, J.; Popa, I.S.; Zeitouni, K.; Borcea, C. Proactive vehicular traffic rerouting for lower travel time. IEEE Trans. Veh. Technol. 2013, 62, 3551–3568. [Google Scholar] [CrossRef] [Green Version]
  29. Xiao, Y.; Zhao, Q.; Kaku, I.; Xu, Y. Development of a fuel consumption optimization model for the capacitated vehicle routing problem. Comput. Oper. Res. 2012, 39, 1419–1431. [Google Scholar] [CrossRef]
  30. Bowyer, D.P.; Akcelik, R.; Biggs, D.C. Fuel Consumption Analyses for Urban Trafic Management. ITE J. 1986, 56, 31–34. [Google Scholar]
  31. Hammarstrom, U.; Eriksson, J.; Karlsson, R.; Yahya, M.R. Rolling resistance model, fuel consumption model and the traffic energy saving potential from changed road surface conditions. Vti Rapp. 2012, 8, 14–16. [Google Scholar]
  32. Barth, M.; An, F.; Younglove, T.; Scora, G.; Levine, C.; Ross, M.; Wenzel, T. The Development of a Comprehensive Modal Emissions Model; NCHRP Web-Only Documents; NCHRP: Washington, DC, USA, 2000; Volume 122.
  33. Barth, M.; Boriboonsomsin, K. Real-world carbon dioxide impacts of traffic congestion. Transp. Res. Rec. 2008, 2058, 163–171. [Google Scholar] [CrossRef] [Green Version]
  34. Demir, E.; Bektas, T.; Laporte, G. A comparative analysis of several vehicle emission models for road freight transportation. Transp. Res. Part Transp. Environ. 2011, 16, 347–357. [Google Scholar] [CrossRef]
  35. Demir, E.; Bektash, T.; Laporte, G. An adaptive large neighborhood search heuristic for the pollution-routing problem. Eur. J. Oper. Res. 2012, 223, 346–359. [Google Scholar] [CrossRef]
  36. Li, H.; Wang, Y.; Xu, X.; Qin, L.; Zhang, H. Short-term passenger flow prediction under passenger flow control using a dynamic radial basis function network. Appl. Soft Comput. 2019, 83, 105620. [Google Scholar] [CrossRef]
  37. Gu, Y.; Lu, W.; Xu, X.; Qin, L.; Shao, Z.; Zhang, H. An Improved Bayesian Combination Model for Short-Term Traffic Prediction With Deep Learning. IEEE Trans. Intell. Transp. Syst. 2019, 21, 1332–1342. [Google Scholar] [CrossRef]
  38. Bi, J.; Bennett, K.P. A geometric approach to support vector regression. Neurocomputing 2003, 55, 79–108. [Google Scholar] [CrossRef]
  39. Wang, M.; Wang, L.; Xu, X.; Qin, Y.; Qin, L. Genetic Algorithm-Based Particle Swarm Optimization Approach to Reschedule High-Speed Railway Timetables: A Case Study in China. J. Adv. Transp. 2019. [Google Scholar] [CrossRef] [Green Version]
  40. Mainali, M.K.; Mabu, S.; Yu, S.; Eto, S.; Hirasawa, K. Dynamic optimal route search algorithm for car navigation systems with preferences by dynamic programming. IEEJ Trans. Electr. Electron. Eng. 2011, 6, 14–22. [Google Scholar] [CrossRef]
  41. Yang, X.; Luo, S.; Gao, K.; Qiao, T.; Chen, X. Application of Data Science Technologies in Intelligent Prediction of Traffic Congestion. J. Adv. Transp. 2019, 2019, 2915369. [Google Scholar] [CrossRef] [Green Version]
  42. Zeng, M.; Yang, X.; Wang, M.; Xu, B. Application of Angle Related Cost Function Optimization for Dynamic Path Planning Algorithm. Algorithms 2018, 11, 127. [Google Scholar] [CrossRef] [Green Version]
  43. Lv, B.; Xu, H.; Wu, J.; Tian, Y.; Zhang, Y.; Zheng, Y.; Yuan, C.; Tian, S. LiDAR-enhanced connected infrastructures sensing and broadcasting high-resolution traffic information serving smart cities. IEEE Access 2019, 7, 79895–79907. [Google Scholar] [CrossRef]
Figure 1. General structure of a support vector machine (SVM) model.
Sustainability 12 08118 g001
Figure 2. Flow of the genetic algorithm (GA) and particle swarm optimization (PSO) algorithm.
Sustainability 12 08118 g002
Figure 3. Overall structure of the navigation system.
Sustainability 12 08118 g003
Figure 4. Results of comparisons with other methods.
Sustainability 12 08118 g004
Figure 5. Convergence time comparison results.
Sustainability 12 08118 g005
Figure 6. An illustration of road networks in Karamay.
Sustainability 12 08118 g006
Figure 7. The optimal path before congestion.
Sustainability 12 08118 g007
Figure 8. Different path solutions during congestion.
Sustainability 12 08118 g008
Table 1. Reference parameter list.
ParameterInterpretationValue
ξ fuel-to-air mass ratio1
Kengine friction factor0.2
ggravity acceleration9.81
C d coefficient of aerodynamic drag0.7
ρ air density1.2041
C r coefficient of rolling resistance0.01
η t f efficiency of mechanical transmission0.4
η efficiency of the engine0.9
θ road slope angle0
ψ energy conversion value737
Table 2. Related parameters of the Passat 280TSI.
ParameterInterpretationValue
mvehicle net weight1495 kg
m 0 load weight300 kg
Nengine speed33 rpm
Vengine displacement1.395 L
Athe frontal surface area2.721 m 2
κ fuel calorific value43
Table 3. Cologne’s real traffic flow data sample.
ItemGermany Cologne
Longitude and latitude6.762104, 50.772113, 7.223816, 51.127596
SUMO boarders0.00, 0.00, 32765.27, 34478.96
Traffic flow time line6:00–8:00 a.m.
Node number30,354
Road number68,642
Road connection number190,630
Table 4. Weights before congestion.
Route IDHeadTailWeightTime Consumption
238549234#3194241815319424835520.020137.98
238549234#419424835524453594970.025449.10
238549234#544535949719961821970.041361.41
238549234#619961821974453598060.016532.43
188982766#14453598064453602000.023240.39
188982766#244536020019424182740.012126.65
188982766#3194241827419961822560.009824.87
188982766#4199618225626136991650.017635.99
188982766#526136991654453598280.016534.09
Table 5. Weights during congestion.
Route IDHeadTailWeightTime Consumption
… the same as Table 4
238549234#619961821974453598060.0451142.73
… the same as Table 4
Table 6. Weights during congestion.
Route IDHeadTailWeightTime Consumption
238549234#3194241815319424835520.020137.98
238549234#419424835524453594970.025449.10
238549234#544535949719961821970.041361.41
-188982779#419961821974453598060.027063.79
37932733#104453598064453602000.017033.22
188982766#244536020019424182740.012126.65
188982766#3194241827419961822560.009824.87
188982766#4199618225626136991650.017635.99
188982766#526136991654453598280.016534.09

