Article

Impacts of River Engineering on Multi-Decadal Water Discharge of the Mega-Changjiang River

1
State Key Laboratory of Estuarine and Coastal Research, East China Normal University, Shanghai 200241, China
2
Department of Earth and Environment, Boston University, Boston, MA 02215, USA
3
Laboratory for Marine Geology, Qingdao National Laboratory for Marine Science and Technology, Qingdao 266061, China
*
Author to whom correspondence should be addressed.
Sustainability 2020, 12(19), 8060; https://doi.org/10.3390/su12198060
Submission received: 2 September 2020 / Revised: 24 September 2020 / Accepted: 24 September 2020 / Published: 30 September 2020

Abstract

:
Knowledge of river engineering impacts on water discharge is significant to flow guidelines and sustainable water resource managements for balancing human consumption and the natural environment. In this study, based on the collected multi-decadal discharge data at Yichang, Hankou, and Datong stations, we determined that in October, Three Gorges Dam contributed 34.4%, 24.5%, and 18.7% to the discharge decrease in the upper, middle, and lower reach, respectively, while Gezhouba Dam contributed 14.5%, 10.7%, and 10%. Danjiangkou Reservoir caused the discharge ratio of Hanjiang to Changjiang to decline from 7.2% during 1954–1973 to 6.3% during 1973–2014. Owing to growing water withdrawal and consumption, we suggest that the distribution of water diversion and consumption should be regulated to prevent the probable occurrence of the severe issue of salt water intrusion in the Changjiang Estuary in 2028.

1. Introduction

The water discharge of large rivers plays an important role in the economic development of drainage basins and the balance between continental freshwater and oceanic saltwater [1,2,3]. However, river engineering—such as dam construction and flow diversion, which have been carried out to control floods and meet the water, energy, and transportation needs of cities—has extensively altered mainstream discharge and caused changes in water resources all over the world [4,5,6,7,8]. Accordingly, it is of vital importance to determine how water discharge responds to the impacts of river engineering.
Since the beginning of the Anthropocene, intensive human activities, especially a series of river projects, have exerted profound impacts on water discharge. Nilsson et al. [4] showed that over half of the large rivers worldwide (mean annual discharge anywhere in the catchment ≥350 m3/s) were affected by dams so that the river systems were constrained and fragmented. Grill et al. [9] noted that only 37% of large rivers worldwide remain free-flowing without engineering interference and that 23% flow to the ocean uninterrupted. In the Eurasian Arctic, McClelland et al. [10] found that the dams of the six largest rivers dramatically changed the seasonality of the discharge but were irrelevant to the annual increase in discharge. Botter et al. [11] found a notable decrease in water discharge in response to the operation of the dam in the Piave River in Italy. In North America, Burke et al. [12] found that the minimum discharge increased and the duration of the dry season changed clearly under the impact of the operation of the Libby Dam in the Kootenai River. Mix et al. [13] concluded that building reservoirs in the upper Colorado River basin, Texas, USA, reduced the streamflow notably and exacerbated downstream hydrological droughts. In Southern Africa, agricultural water use accounts for nearly 33% of the water used from the Orange-Senqu River, which is much larger than the amount of water consumed through evaporation and riverine vegetation [14]. Although previous studies have paid attention to the impacts of dams or water use on discharge [13,14,15,16], few have conducted a comprehensive analysis of discharge variation in response to integrated river engineering involving dams, irrigation, water diversion projects, etc.
The Changjiang River is the longest river on the Asian continent and the third longest river in the world, and it receives substantial runoff at 905.5 billion m3 [4,17]. It originates from the Qinghai-Tibet Plateau at an elevation of 6600 m, flowing into the East China Sea with a catchment area of 1.8 × 10⁶ km2 [18,19] (Figure 1). By convention, the Changjiang River is divided into three subsections: the upper section (from the source to Yichang), the middle section (from Yichang to Hankou), and the lower section (from Hankou to Datong) [16,20]. As Datong is the upstream limit of tidal influence, the section from Datong to the river mouth is defined as the estuary reach [21]. In China, nowhere has the impact of river engineering been more significant than the Changjiang River because almost half of the world’s large dams—of which the vertical depths are higher than 15 m—have been built here since 1950 [16]. In particular, the Changjiang River basin, where there are more than 400 million inhabitants, has the world’s largest dam, Three Gorges Dam (TGD), and large flow diversions, such as the South-to-North Water Diversion Project (SNWDP) (Figure 1).
In addition to the TGD, the Gezhouba Dam (GD) and the Danjiangkou Reservoir (DR) were constructed in the upper and middle reaches, respectively [16]. The expected capacity of these reservoirs is 300 billion m3 by 2030 [22]. In addition, various types of water usage are noticeably increasing through intensive pumping in the Changjiang Basin [15]. With the operation of these large projects, the original pattern of Changjiang River water resources in the flood or dry season and different months has already changed [16,19,23,24,25,26,27]. Therefore, a holistic analysis of the impacts of river engineering on the water discharge of Changjiang is urgently required. Based on the available collected data, the aims of this research are (1) to examine the decadal water discharge variation in the Changjiang watershed, (2) to determine how river engineering influences the characteristics of discharge, and (3) to determine the variation trend in Changjiang water discharge in the future.

2. Data and Methods

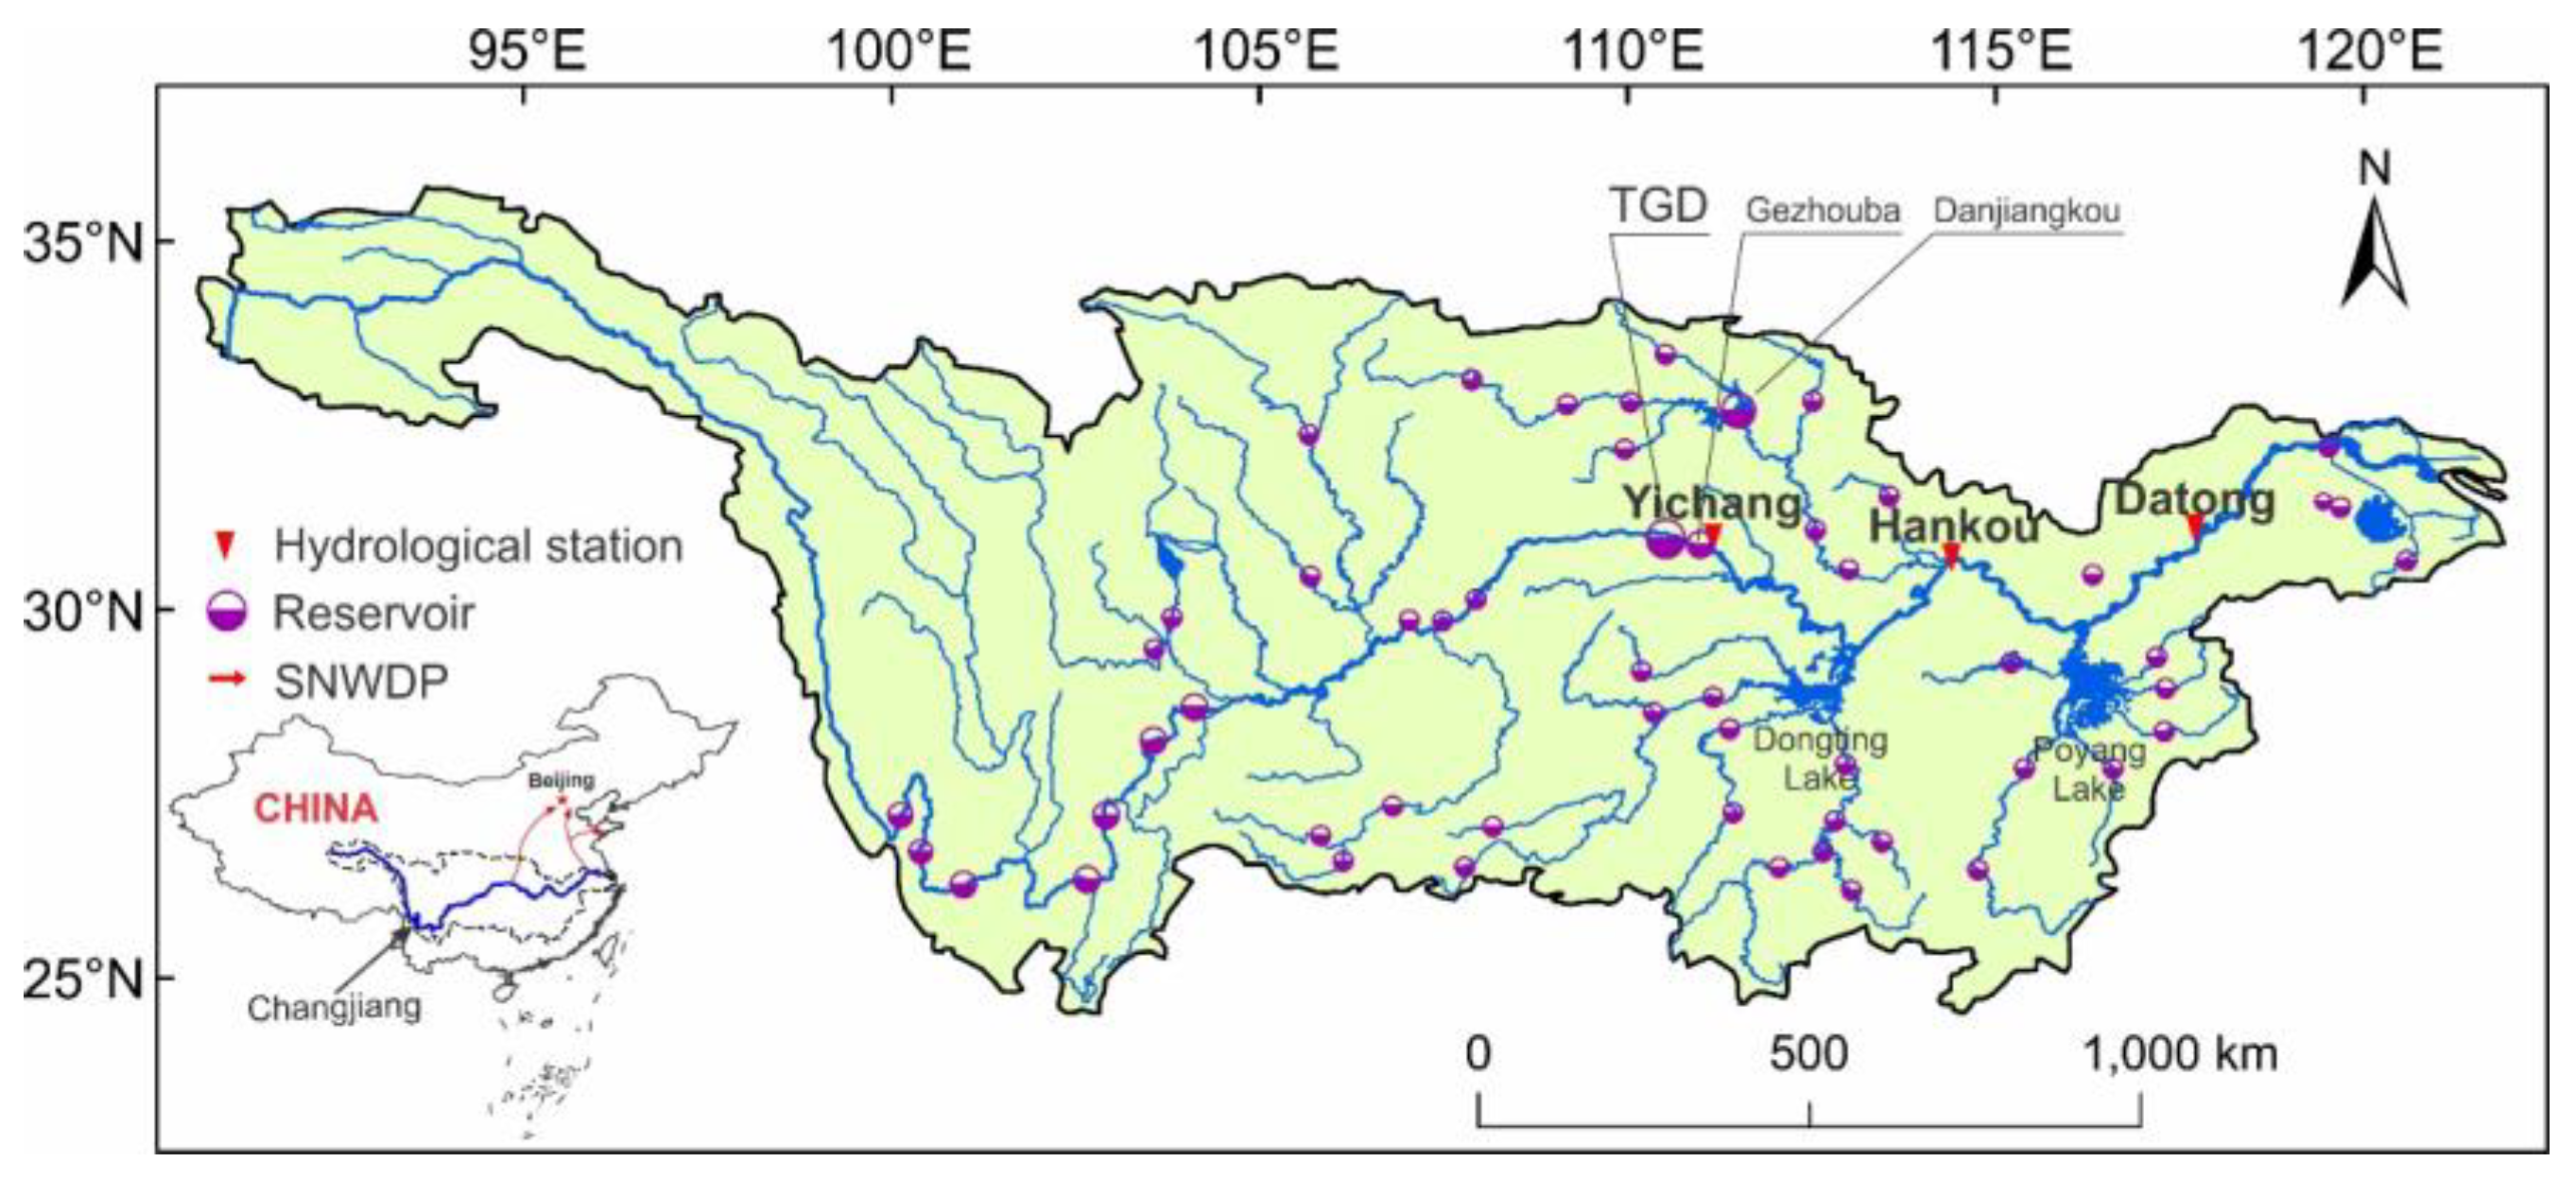
2.1. Data Collection

The hydrological data were monitored daily from 1954 to 2014 at the Yichang, Hankou, and Datong gauging stations and were collected from the Changjiang Water Resources Commission (CWRC) (http://www.cjh.com.cn) (Figure 1 and Table 1). The distance between Yichang station and the TGD is approximately 39 km, and the runoff through Yichang station represents the upstream discharge. Hankou station, 660 km downstream from Yichang station, controls the discharge in the middle reach of the Changjiang River. Discharge at Datong, which is 460 km away from Hankou, indicates discharge into the estuary [27]. Moreover, the DR is located in the Hanjiang River, which is the longest tributary of the Changjiang River. Huangzhuang station records the discharge from the Hangjiang River into the Changjiang River (Figure 1). We also collected the water usage data basin-wide in Changjiang from the Ministry of Water Resources of the People’s Republic of China (http://www.mwr.gov.cn/sj/tjgb/szygb/). Data with different collection frequencies and durations at each station are shown in Table 1.

2.2. Methods

Linear regression, which is a linear approach to modelling the relationship between two variables, is a straightforward and applicable method that is used to process long, serial water discharge data [19,28]. In this research, yearly and monthly discharge data were linearly fitted by the least square method to find the trend in discharge variation.
Wavelet analysis is a mathematical technique that can decompose a signal into multiple lower resolution levels. To detect multiple-scale fluctuations in discharge variation, the wavelet technique [29,30] was applied to analyze the periodicities in the monthly flow data from 1956 to 2014 at the three reference gauging stations. Here, the continuous wavelet transform was expressed as follows:
W ( a , b ) = x ( t ) ,   φ a , b ( t ) = + x ( t ) φ a , b * ( t ) d t = 1 a + x ( t ) φ * ( t b a ) d t   a , b R , a 0
where a is a scaling (dilation) parameter, b is a position (translation) parameter, x(t) is the flow variation at each station for 1956–2014, φ(t) is the wavelet basis function, φ*(t) is the complex conjugate of the wavelet coefficient, and a and t are the scale and time parameters, respectively. Then, we selected the complex Morlet wavelet as the basis wavelet function:
φ ( t ) = 1 π f b e i 2 π f c t ( t 2 / f b )
where fc is the central frequency of the mother wavelet and fb is the bandwidth.
In addition, the Mann−Kendall (MK) test, which is a common trend detection method, was used to analyze the trends and abrupt changes in river flows each month at the three stations. The calculation procedure of this method was explained in detail by Smith and Xu [31,32]. As a significance level (p = 0.05) was assumed, an increasing trend was statistically significant when the MK statistic Z > 1.96, and when the MK statistic Z < −1.96, a decreasing trend was statistically significant. Thus, the progressive series and the retrograde series were calculated [33]. Then, we found abrupt changes when the two series intersected within the threshold from −1.96 to 1.96 at the significance level of p < 0.05.

3. Results

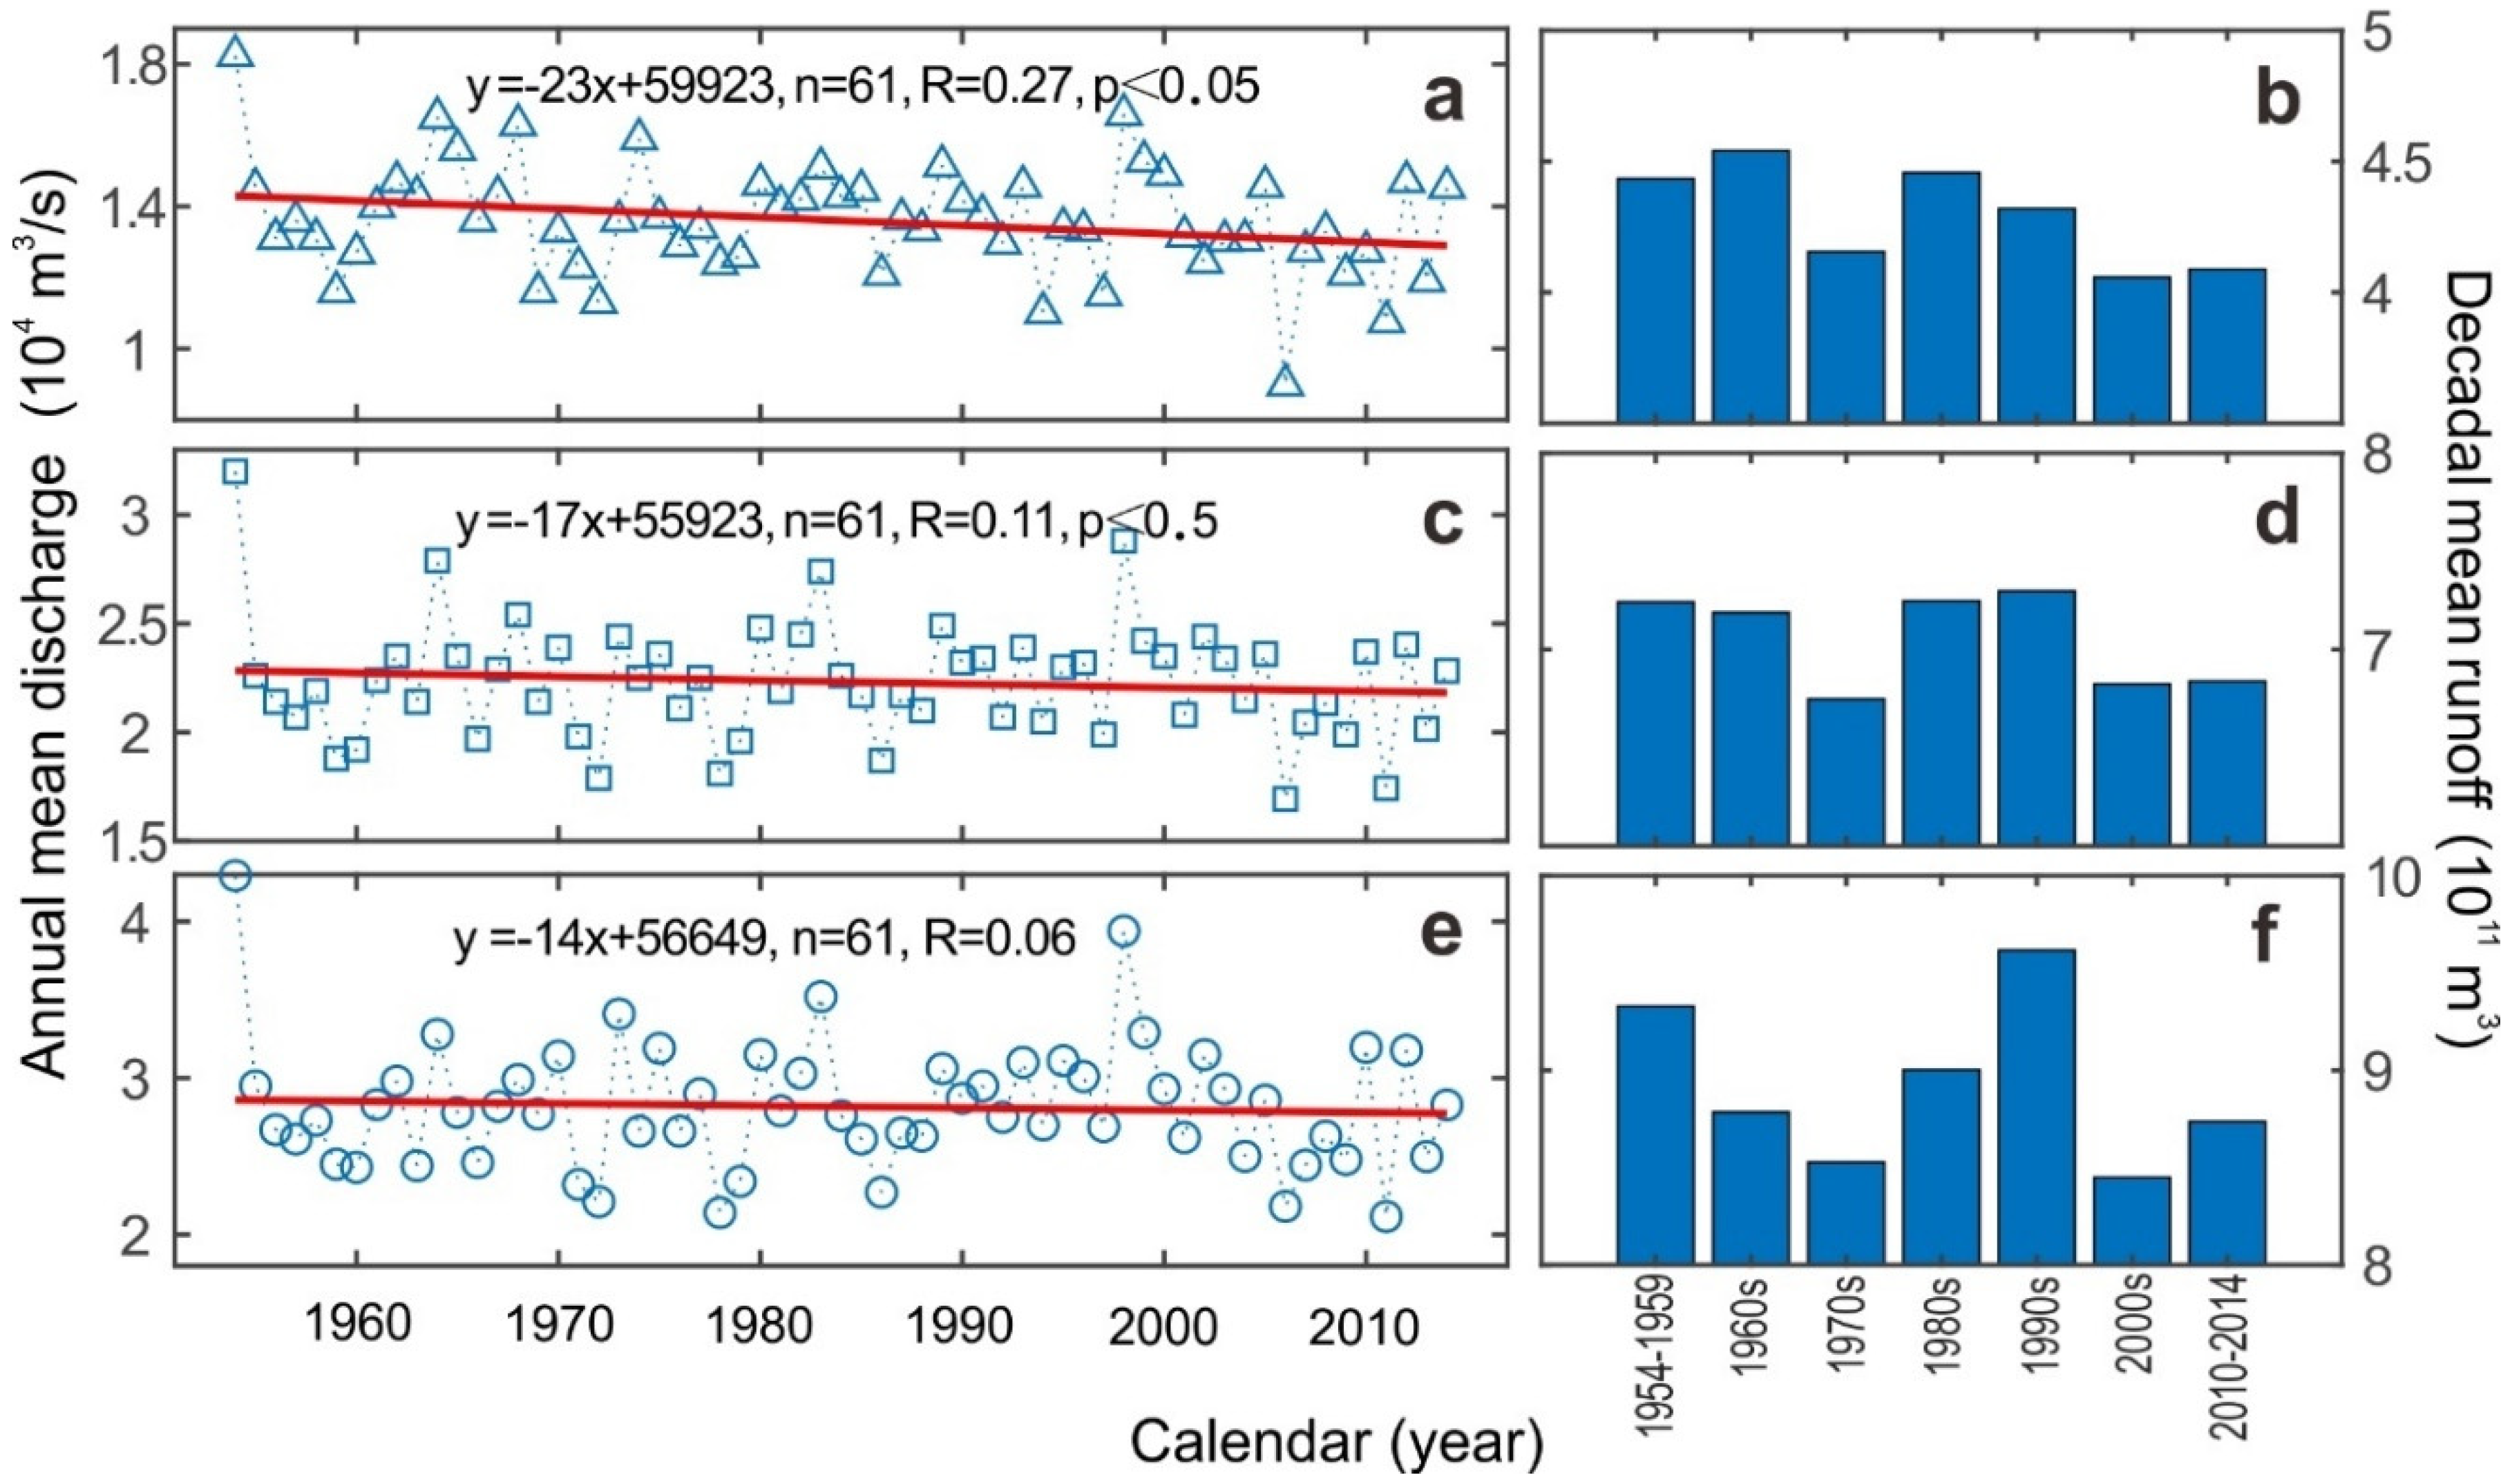
3.1. Decadal Characteristics of Changjiang Water Discharge

Yearly water discharges at the three gauging stations along Changjiang were calculated by averaging the monthly flow during 1954 to 2014 (Figure 2). Figure 2a,c,e shows that the yearly water discharge curves in Yichang, Hankou, and Datong from 1954 to 2014 had different variation characteristics. According to the regression equation at Yichang station (Figure 2a), the annual discharge decreased by 23 m3/s between 1954 and 2014, at a significance level of p < 0.05, indicating that there was a slight declining trend in the annual discharge at Yichang station. At the Hankou and Datong stations, the variation trends were not significant. In addition, it was notable that the discharge decreased sharply by 38% at Yichang station from 2005 to 2006, and at Hankou and Datong, the discharge decreased by 28% and 23%, respectively (Figure 2a,c,e).
Furthermore, the mean decadal river discharges at the three stations were compared. Figure 2b,d,f shows that the ten-year mean annual runoff presented a clearly decreasing trend at Yichang station. Specifically, the mean annual runoff was 454 billion m3 in the 1960s, declined to 406 billion m3 in the 2000s, and then increased to 408 billion m3 in the 2010s, with a total decrease of approximately 10% (Figure 2b), and there were similar trends at the Hankou and Datong stations (Figure 2d,f). Moreover, there were notable decreasing trends from the 1960s to 1970s and from the 1990s to 2000s at all three stations, while the mean annual runoff in the 1990s was clearly greater than in other decades.

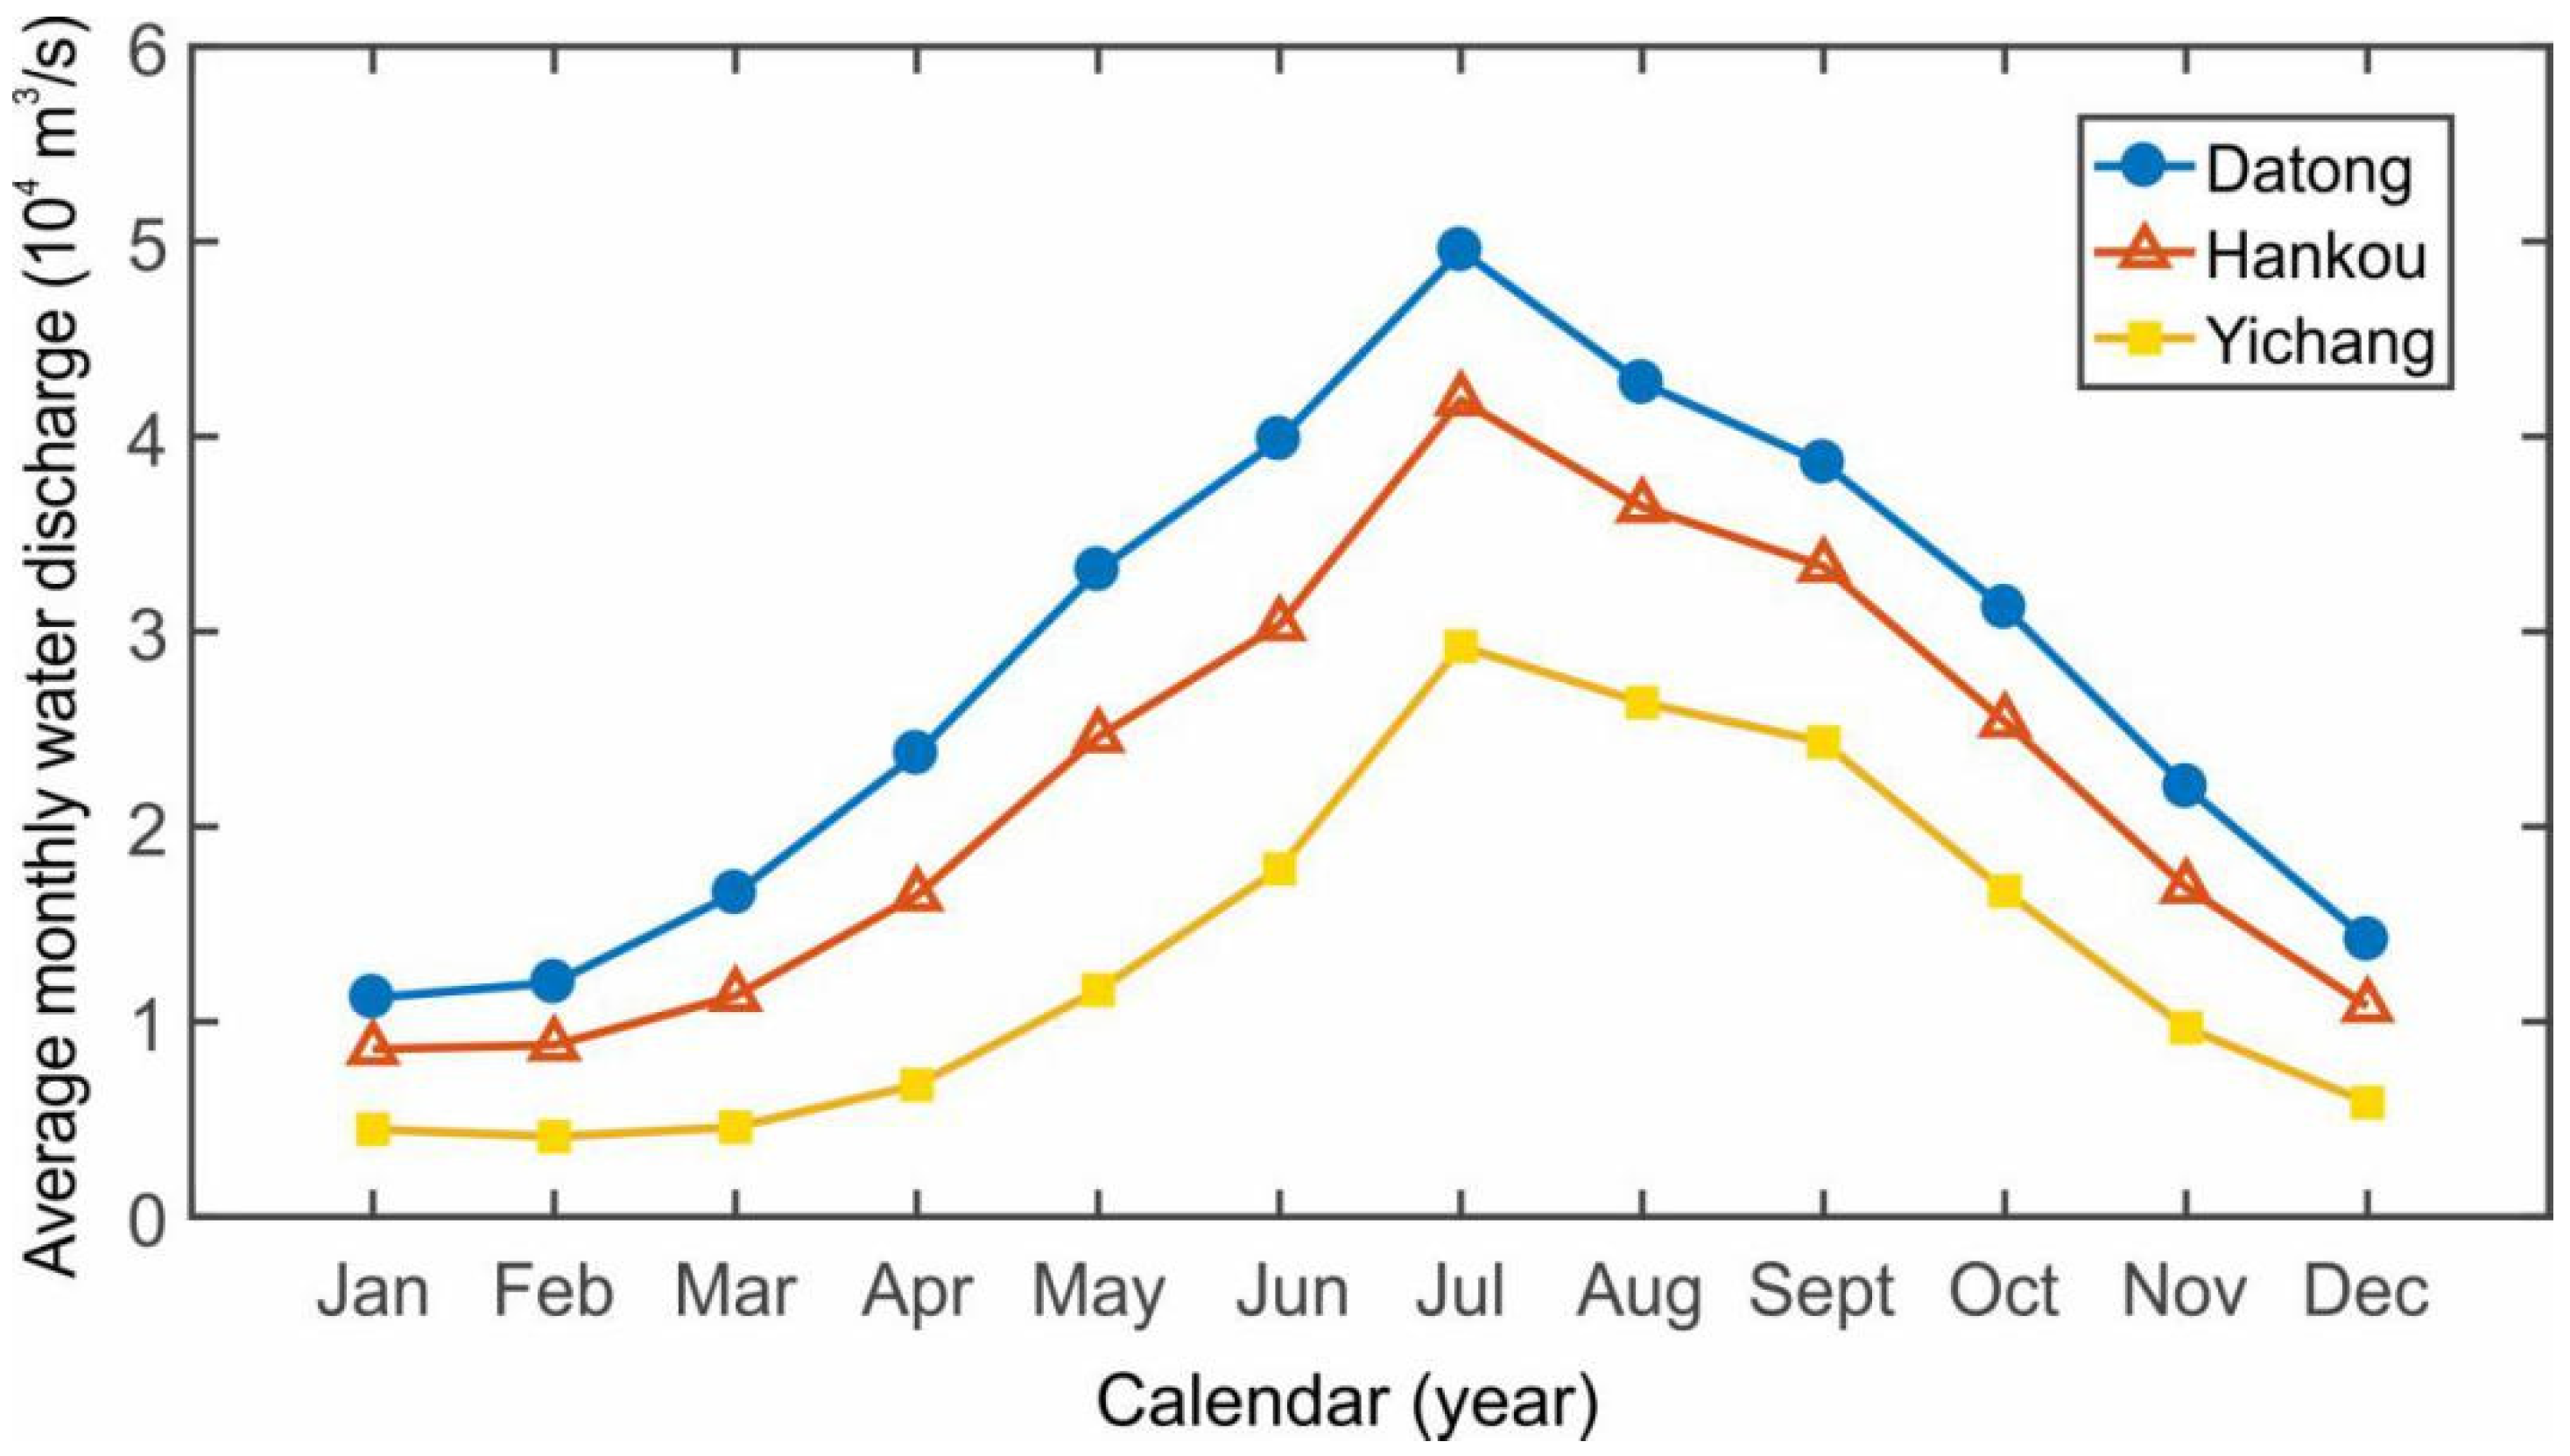
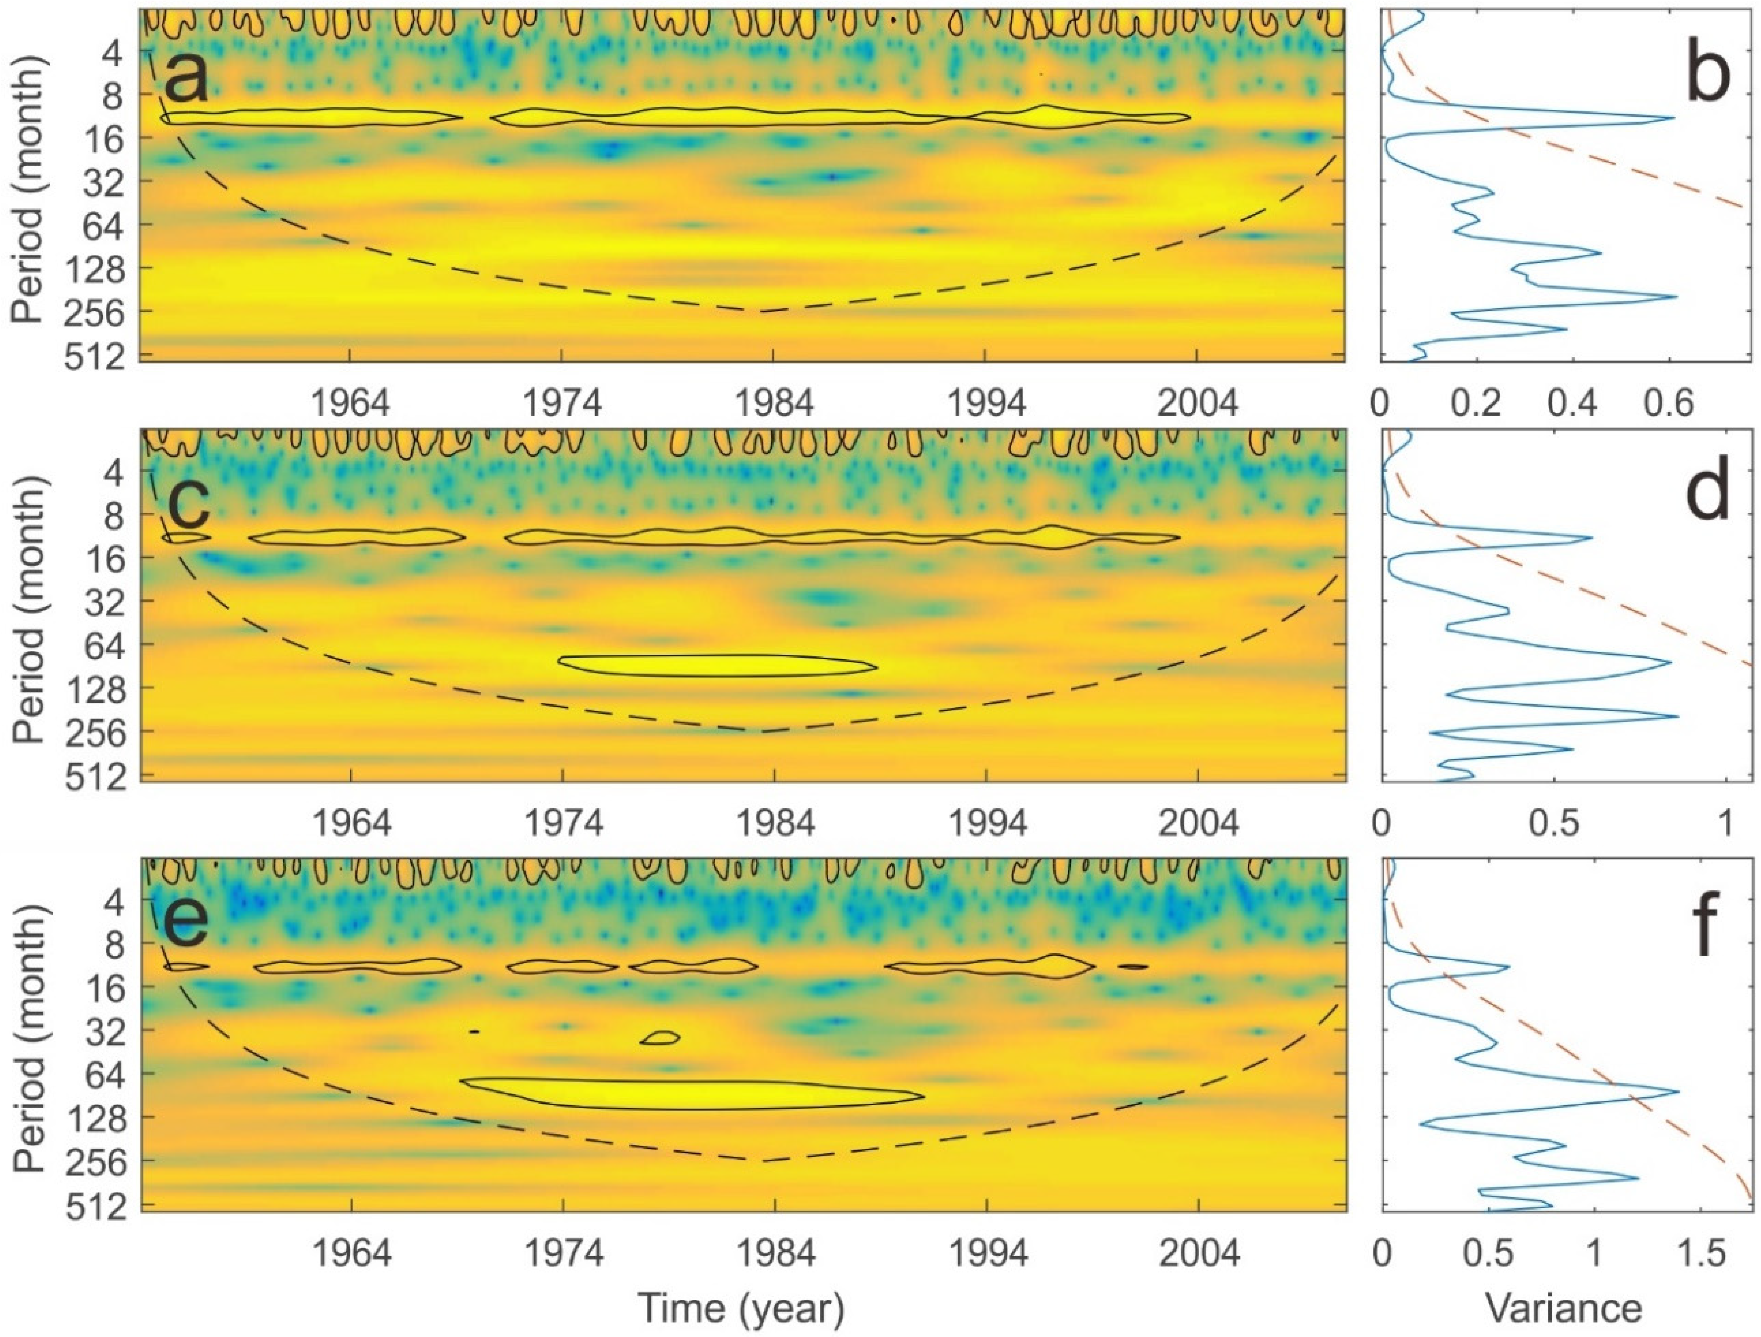
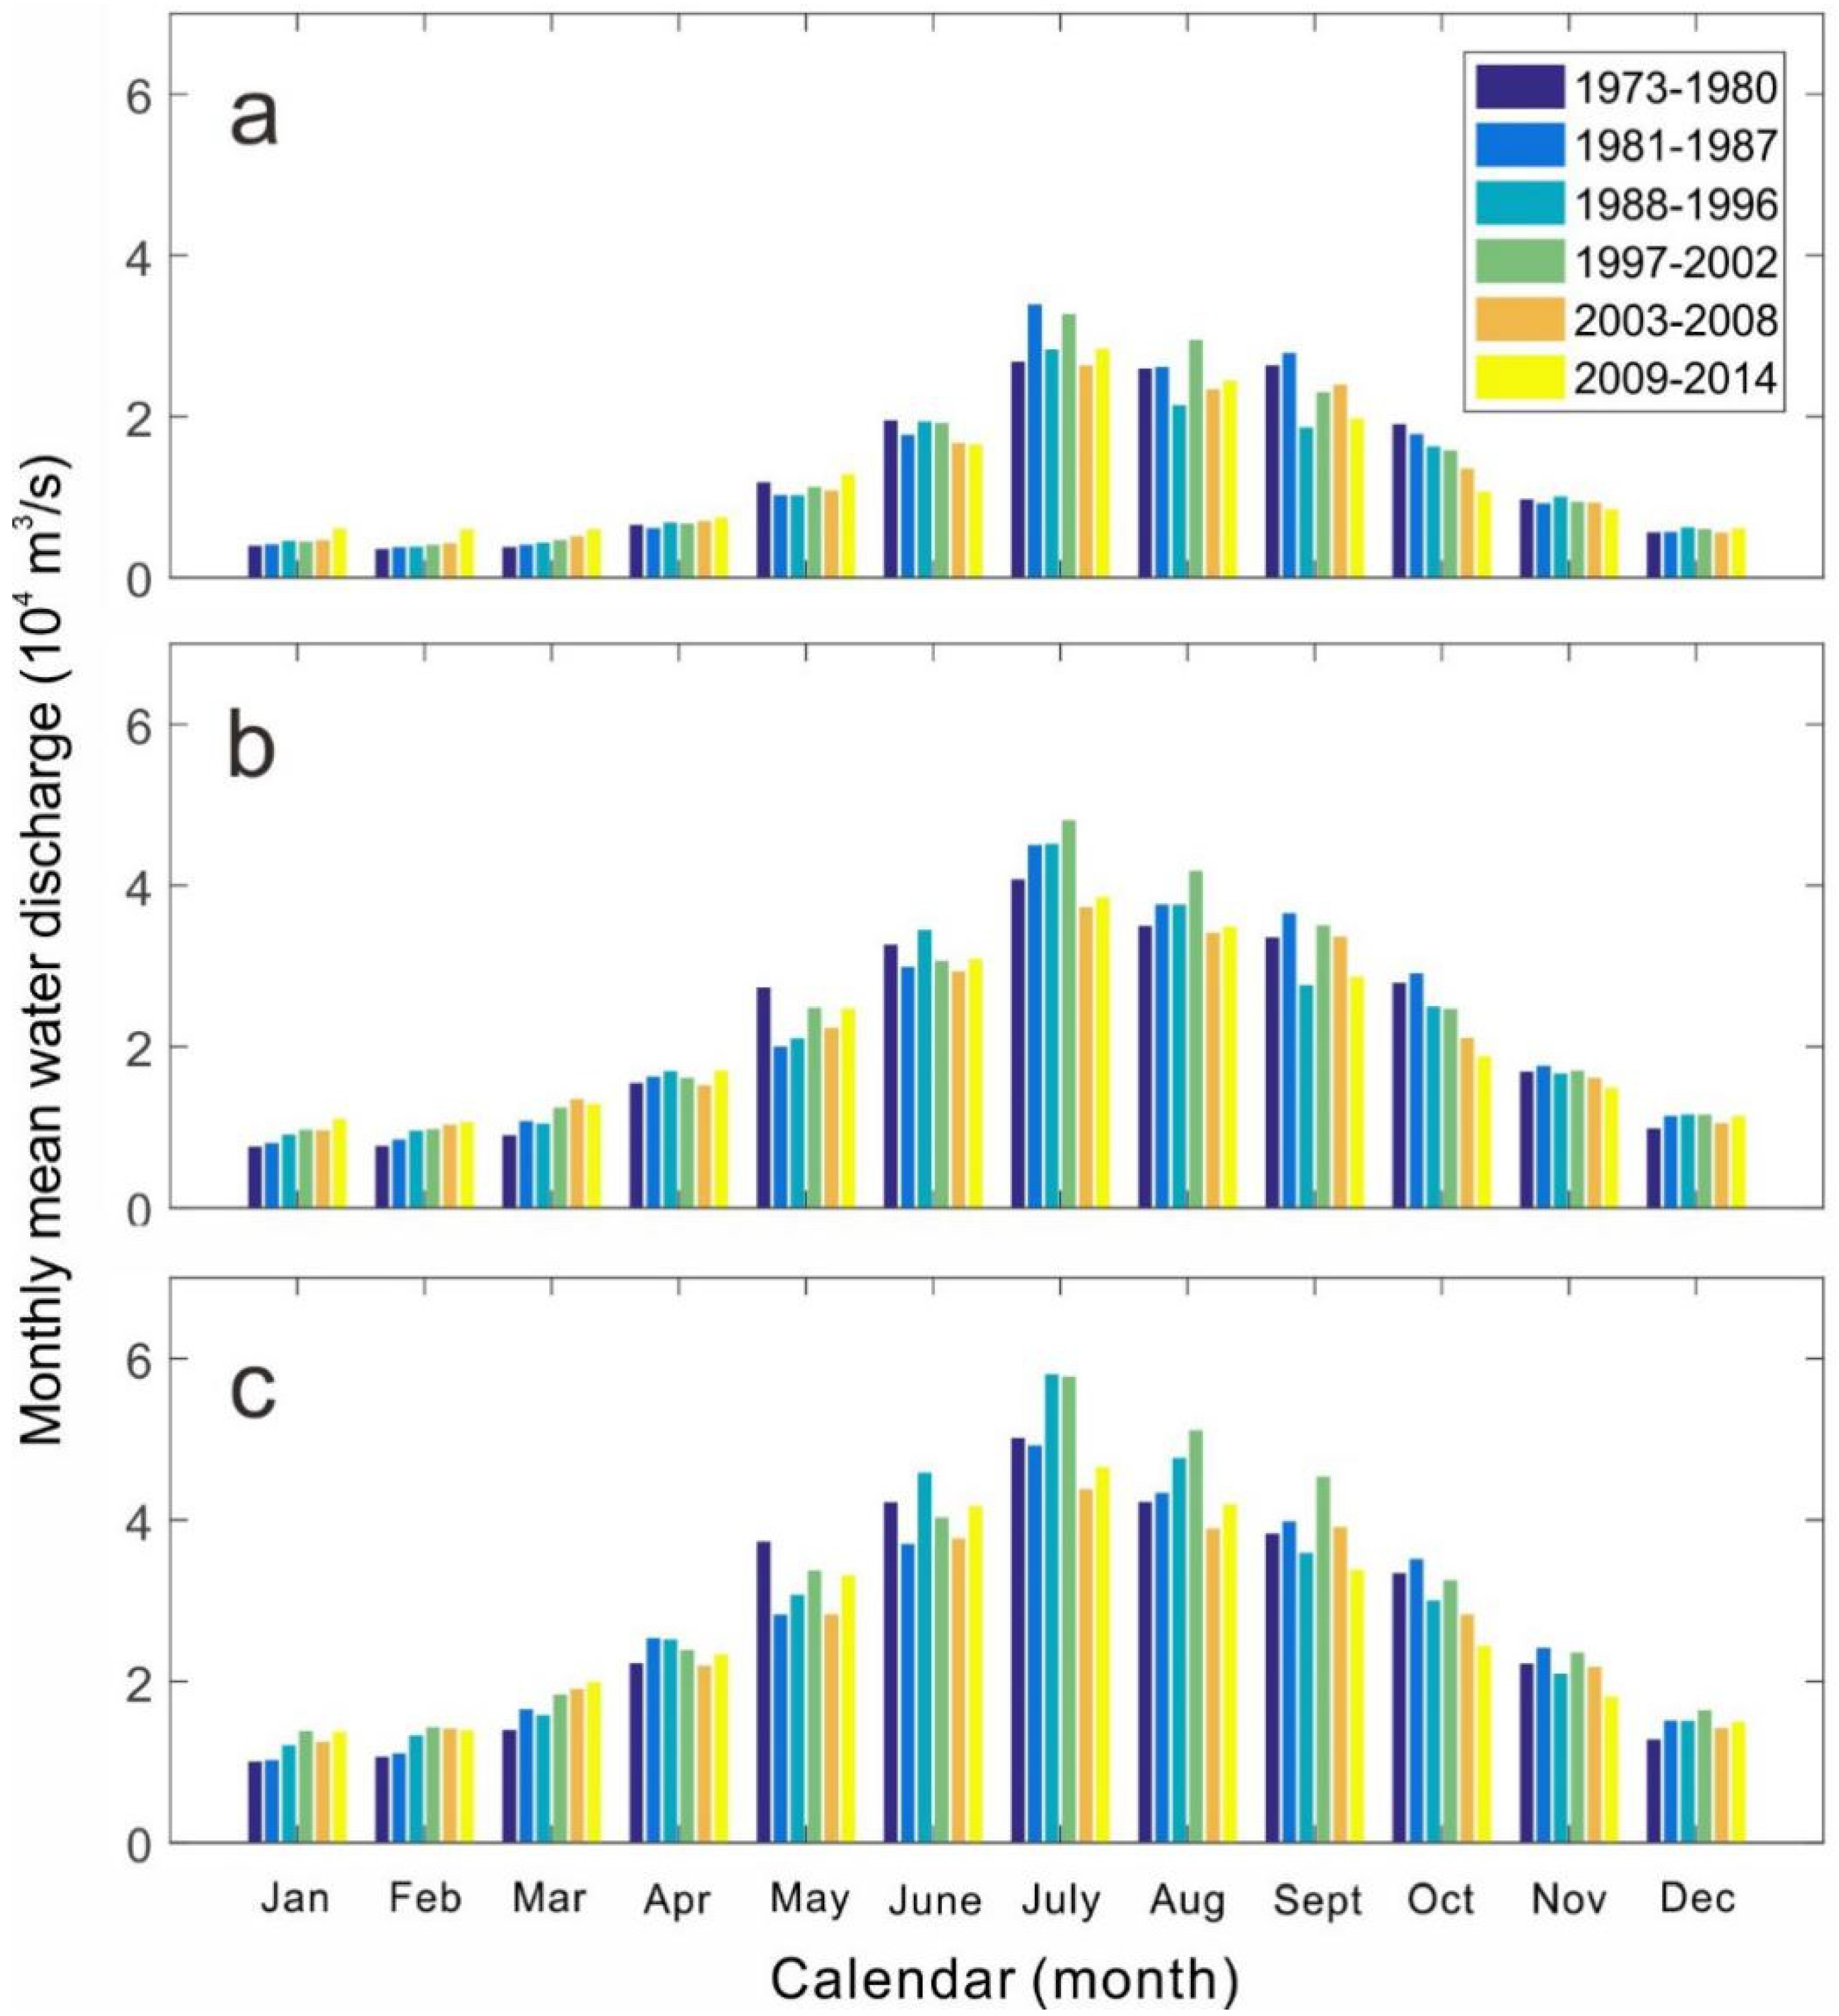
3.2. Pattern of Seasonal Water Discharge Variability

Figure 3 shows that the average monthly water discharge at the three stations from 1954 to 2014 was strongly seasonal. It is notable that the discharges from May to October were all larger than those from November to April. This was consistent with the flood season (from May to October) and dry season (from November to April), which were defined by previous researchers in Changjiang Basin [18,24]. In addition, the average monthly flows at the three stations all peaked in July and reached a minimum value in January (Figure 3).
The mean discharges of the flood season and dry season and the discharge ratio of the flood season to the dry season at the three stations are plotted in Figure 4. The maximum mean discharges in the flood season during 1956–2014 were in 1998 at the three stations; however, the times of their maximum mean discharges in the dry season were different (Figure 4a–c). The maximum value of the dry season peaked in 2014, which was not a flood year, at Yichang station, and peaked in 1964 and 1998 at Hankou and Datong stations, respectively. On the other hand, the minimum mean discharges in the flood season and dry season were concentrated in 2006 and 1979, respectively, at the three stations. Moreover, the mean discharges of the dry season from 2003 to 2014 at Yichang showed a clearly increasing trend.
In addition, the maximum discharge ratios of the flood season to the dry season at Yichang and Datong from 1956 to 2014 both appeared in 1998, while that at Hankou was in 1979. The minimum flood/dry season discharge ratios at the three stations all occurred in 2006 (Figure 4d–f). In addition, the discharge ratios of the flood season to the dry season at the three stations all presented decreasing trends, with Yichang station exhibiting the most remarkable decrease. The mean value of the flood/dry season discharge ratio decreased from 3.8 in the 1960s to 2.7 in the 2010s at Yichang, from 2.6 to 2.1 at Hankou, and from 2.3 to 1.9 at Datong, indicating a weakened seasonality of mega-Changjiang discharge.

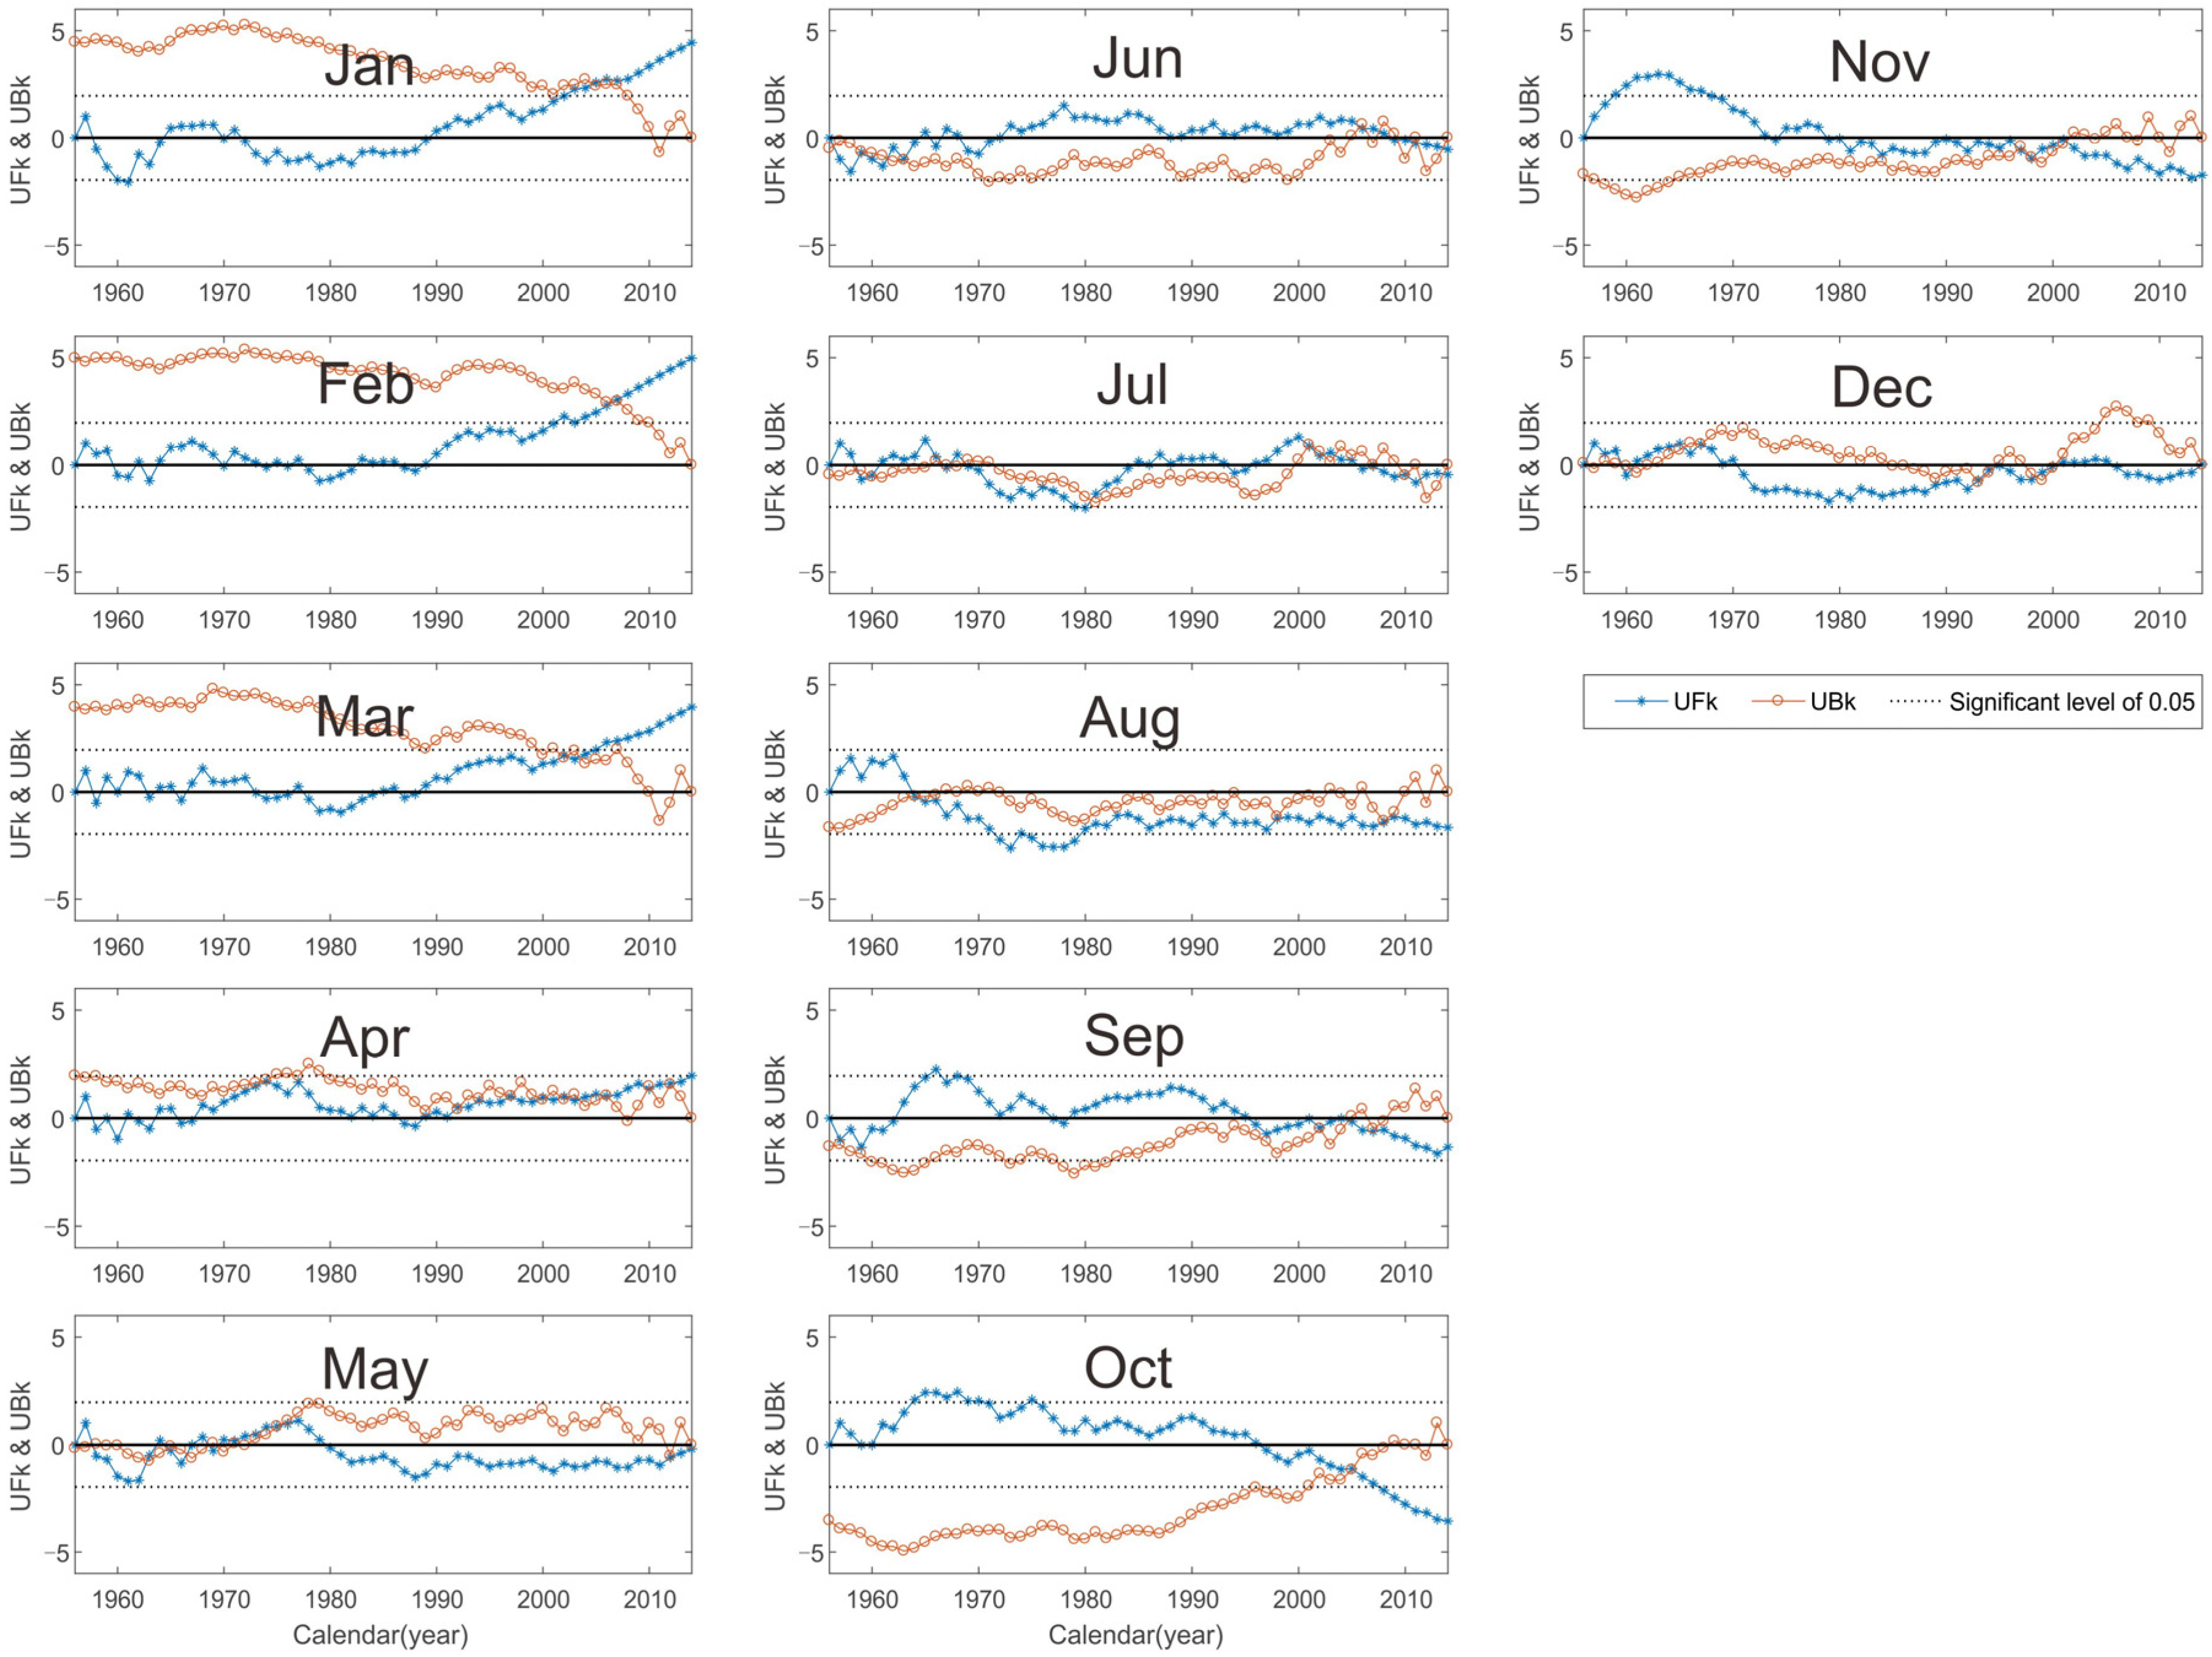
3.3. Trends in Monthly Water Discharge Variability

Monthly water discharges from 1956 to 2014 were extracted to conduct MK trend analyses. Table 2 shows the Z scores of the discharges in different months at the three gauging stations, and Z > 0 (Z < 0) indicated an increasing (decreasing) trend. In some months, the increasing/decreasing trends were especially significant (p < 0.001). The Z scores at Yichang peaked at a value of 9.96 in February, while those at Hankou and Datong peaked at values of 10.45 and 9.68 in January, respectively, which indicated that the water discharges in these months from 1956 to 2014 increased dramatically. There were similar trends in February and March. In contrast, the minimum Z scores were −7.08 at Yichang, −5.44 at Hankou, and −3.41 at Datong in October, indicating that the water discharge in October from 1956 to 2014 decreased dramatically. The declining trend was also notable from August to November at the Yichang station. In addition, the trends in the flood season in June and July were not statistically significant at the three stations, with the Z scores ranging between −1.02 and 0.6.
In addition, a wavelet analysis was conducted on the monthly discharge at the three stations for 1956–2014 (Figure 5). According to the wavelet power spectrum and global wavelet spectrum, the discharges showed significant periodic behaviors. The enclosed regions within the thick black contour indicated that there were strongly periodic components over 12 months at all three stations (p < 0.05). In addition, at the Hankou and Datong stations, there was a clear period of approximately 84–120 months at a significance level of 0.05. These periodicities indicated that the flow discharges of Changjiang were characterized by multiple time-scale oscillations.

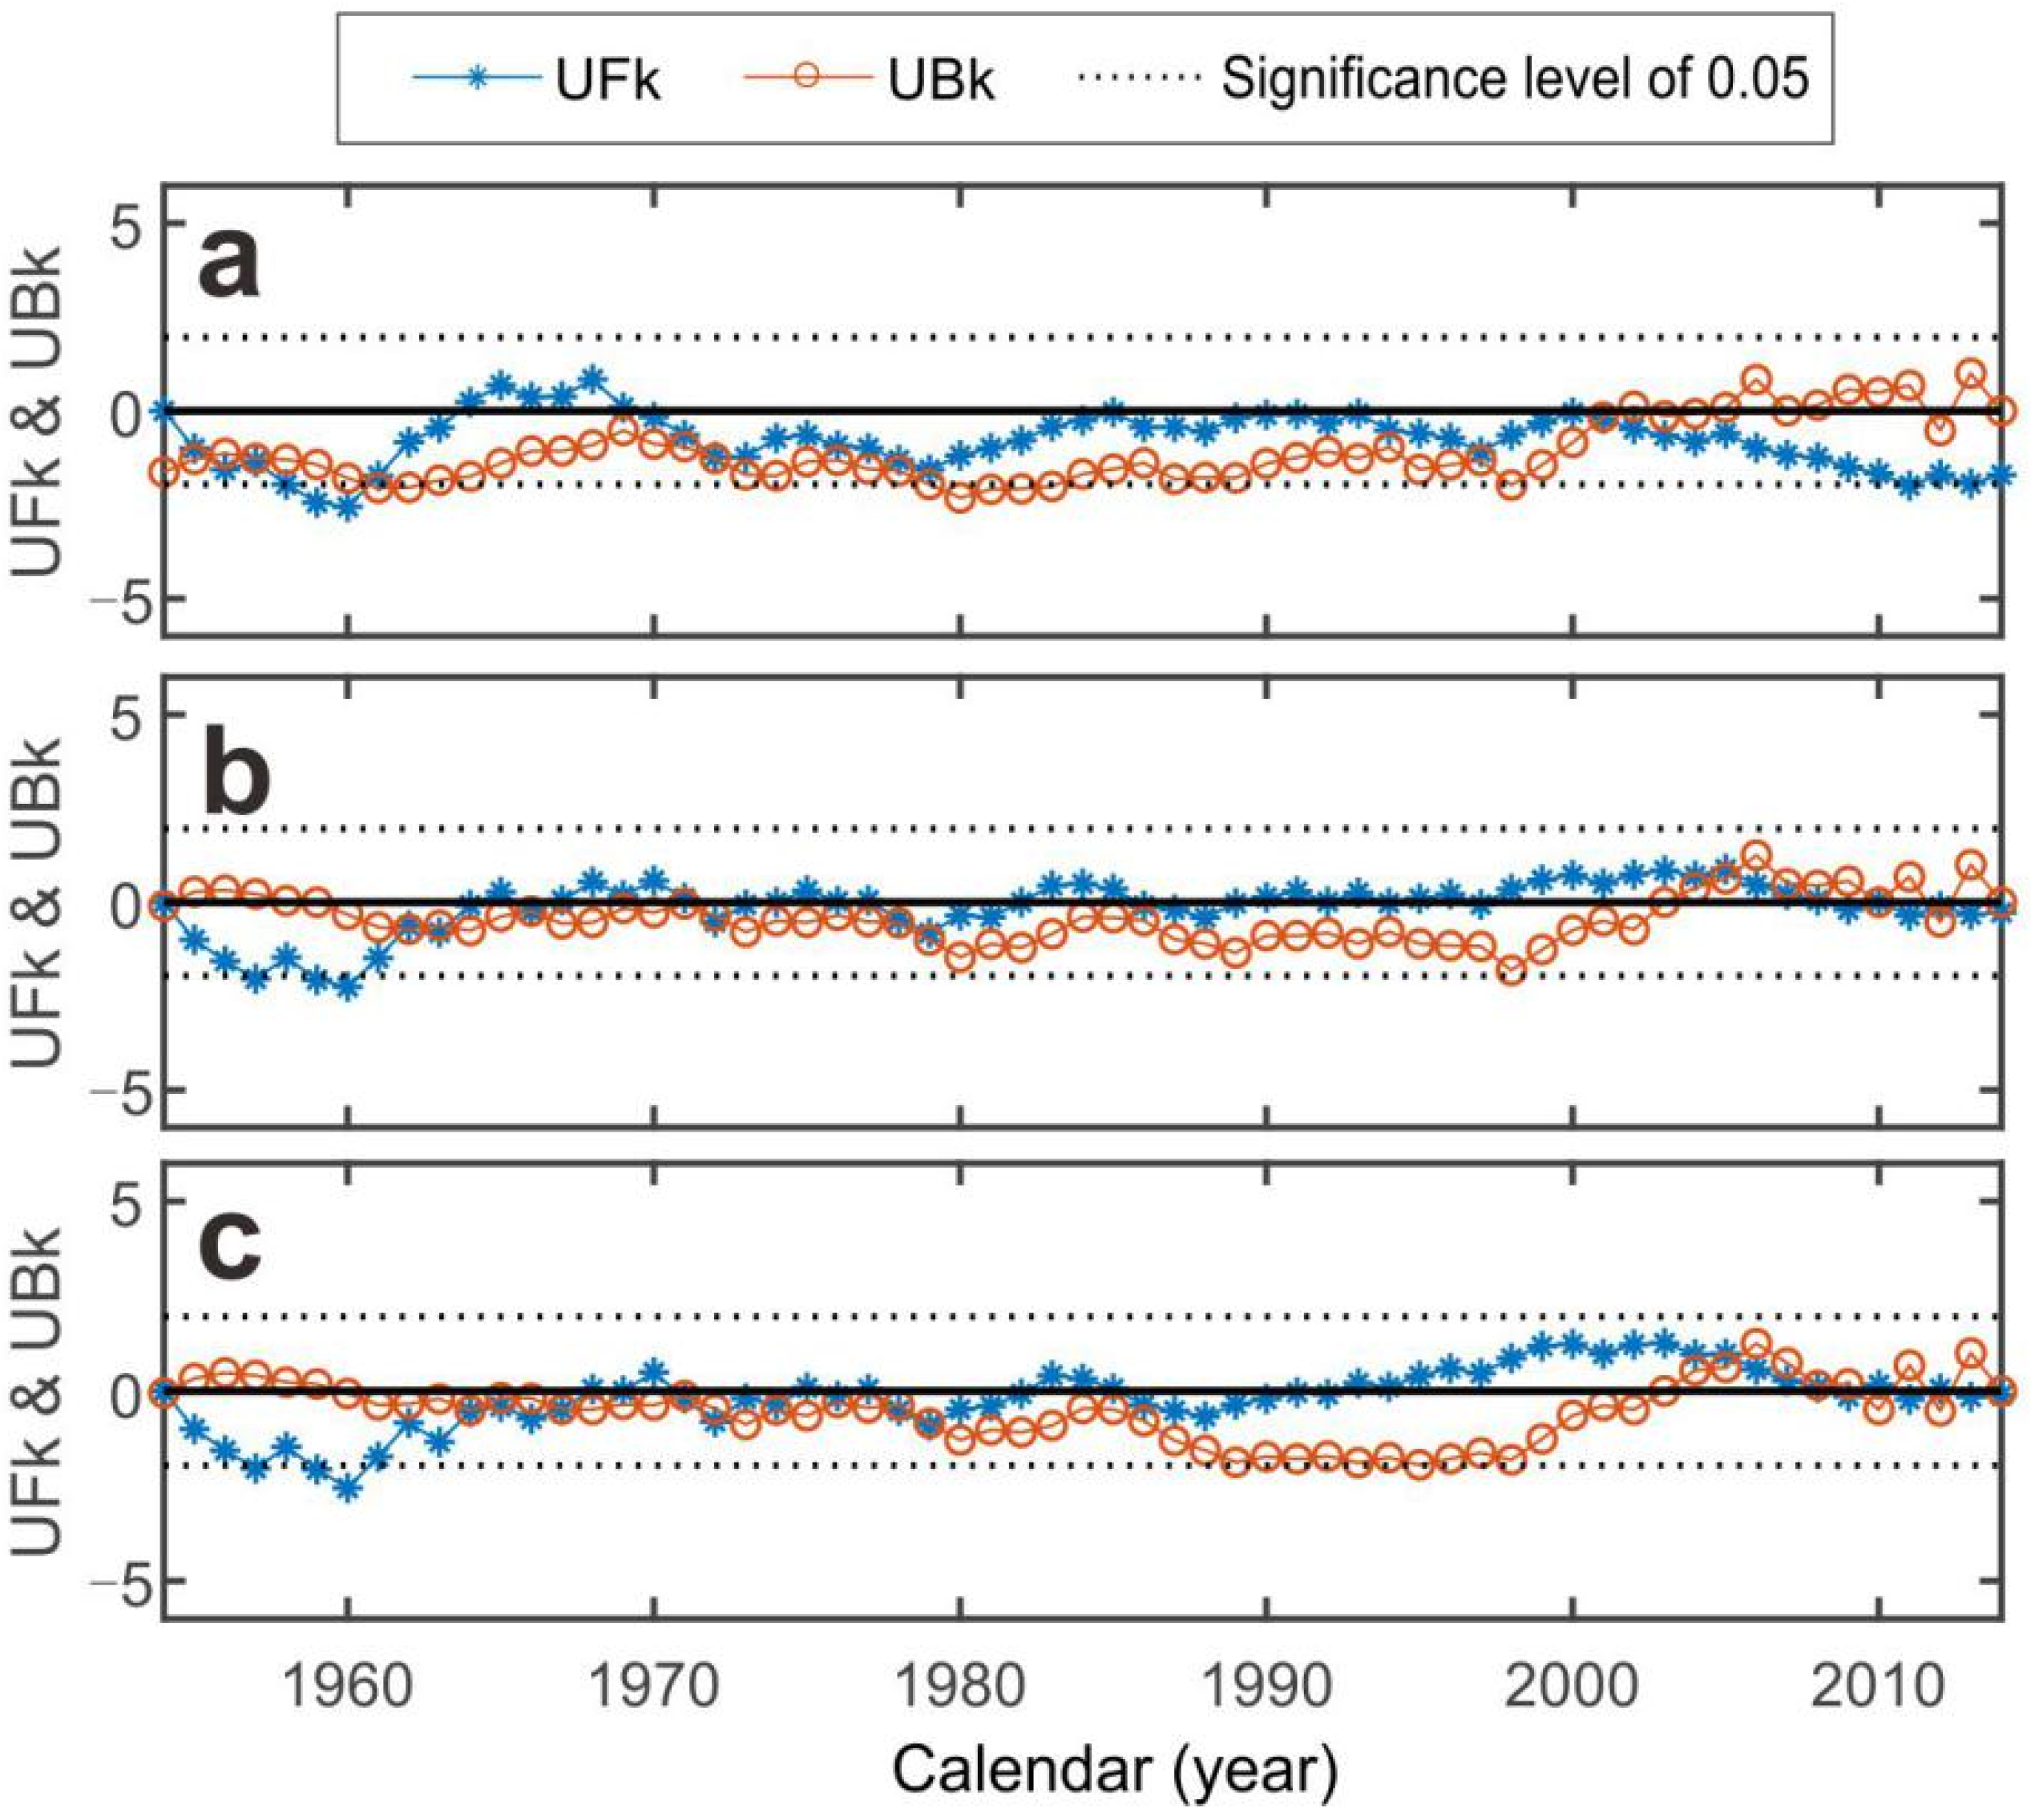
3.4. Abrupt Changes in Water Discharges

The statistics of the annual water discharge during 1956–2014 were determined by the MK test (Figure 6). At Yichang station, the MK test showed that abrupt changes took place in 1955, 1961, 1973, and 2001 within a certain range between −1.96 and 1.96. A similar pattern of the MK test appeared at both Hankou and Datong station. Abrupt changes occurred simultaneously in 1954, 2006, and during the period from 1960 to 1980 at the two stations.
Additionally, the sequential MK test of the monthly mean water discharge series during 1956–2014 was also implemented. The MK statistical values of the monthly discharges at Yichang, Hankou, and Datong station are presented in Figure 7, Figure 8 and Figure 9, respectively. Figure 7 shows that significant abrupt changes occurred in March, July, September, and October, 2003, at Yichang, while a number of abrupt changes were detected in April in the 1990s, in May, 1970, in June and August, 2009, and in December, 2014. Similarly, abrupt changes were detected in October, 2003, and from April to August in the 2010s at Hankou and Datong station (Figure 8 and Figure 9). Furthermore, there were serious abrupt changes at Datong station during 1956–2014 in August within a certain range between −1.96 and 1.96.

4. Discussion

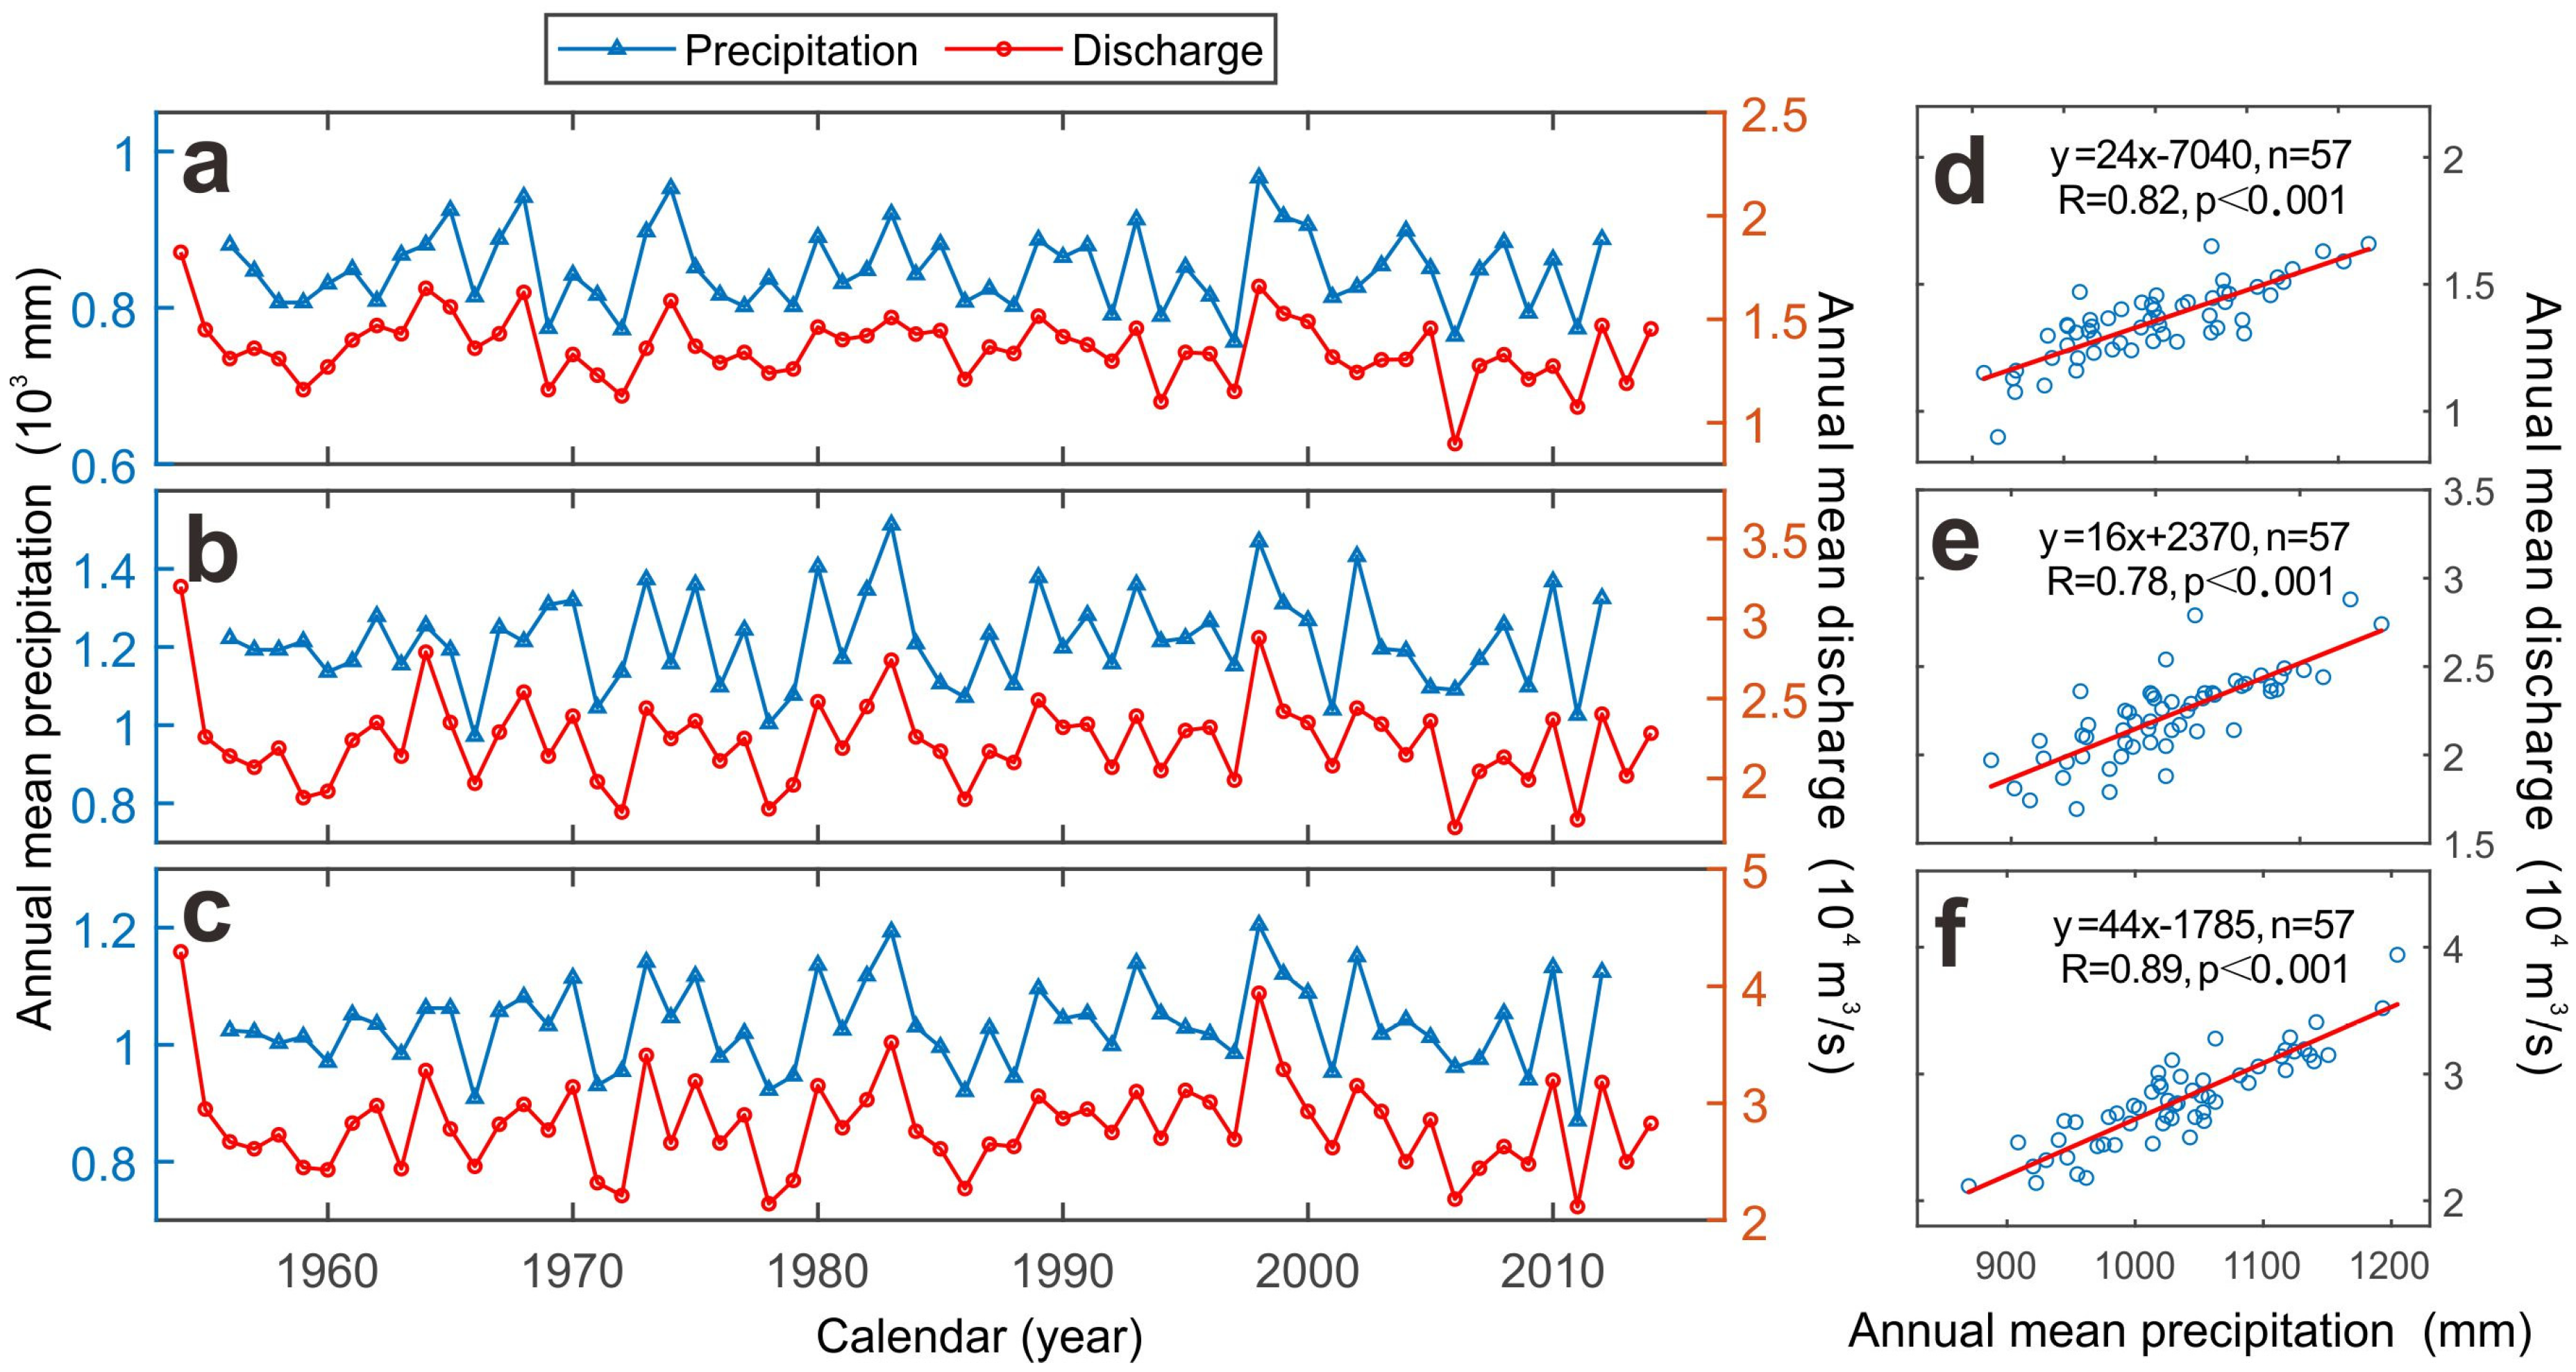
4.1. Influence of Precipitation

Precipitation is the primary source of water in mega-Changjiang [23]. Precipitation also dominates the total discharge that runs into the East China Sea [19]. Figure 10 shows the annual mean precipitation over the upper, middle, and lower catchments of the Changjiang River, indicating that there were neither decreasing nor increasing trends from 1956 to 2014 (Figure 10a–c). There were statistically positive correlations between precipitation over the upper, middle, and lower catchments and the corresponding discharge at the Yichang, Hankou, and Datong gauging stations, with significance levels of p < 0.001 (Figure 10d–f). In addition, the low precipitation levels in the 1970s corresponded with low discharges at the three stations (Figure 2b,d,f), and the high values of precipitation in the 1990s were consistent with the high runoff amounts, especially in 1998 (Figure 10a–c). Therefore, these results suggested that precipitation is the primary influencing factor controlling the annual discharge from the Changjiang River to the sea.
In addition, the wavelet analysis of annual discharge at the three stations from 1954 to 2014 showed common periods of 1 and 7–11 years at a significance level of 0.05 (Figure 5). Such periodic variations were unlikely to be caused by anthropogenic influences, and previous studies have suggested natural influences as the dominant factors [8]. Viles and Goudie [34] once demonstrated that there were multiple time-scale periodicities that were closely correlated to the climatic variability across the world. For example, the intra-annual fluctuations in water discharge were related to the annual monsoon influences. Interannual-, decadal-, and multidecadal-scale intervals of water discharge were most likely caused by a 7-year periodicity of El Niño and Southern Oscillation (ENSO) [35] and an 11-year periodicity of sunspot activity [8]. Therefore, the Changjiang River discharge was influenced by precipitation over the catchment, which was dominated by the East Asian monsoon [28]. In addition, the years of extreme flood and drought events were strongly correlated with the intensity of ENSO and the East Asian monsoon [36].

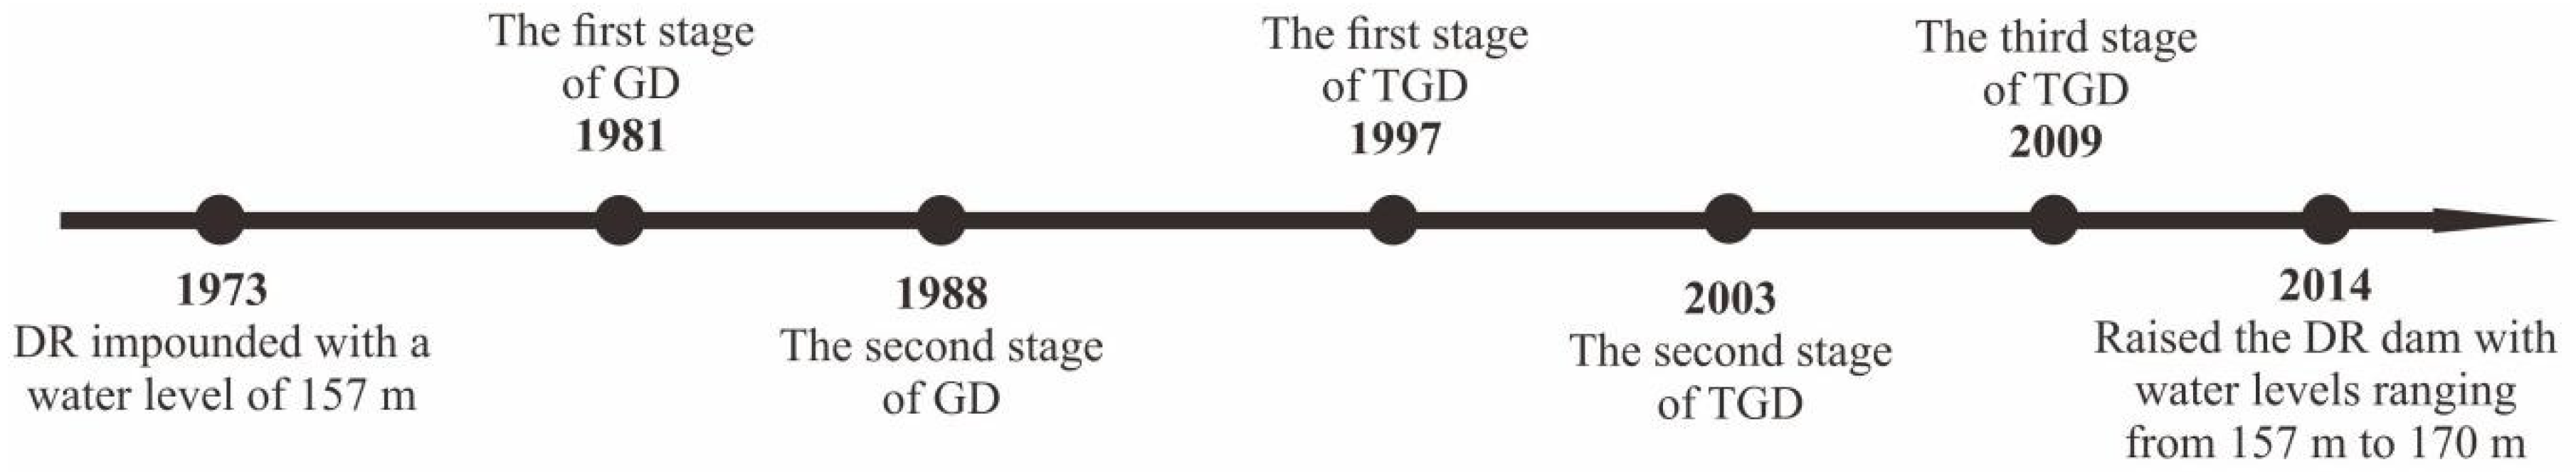
4.2. Influence of the Dams

While precipitation was responsible for the variations in and periodicity of the total water discharge of the Changjiang River, dams also profoundly impacted the pattern of discharge distribution [19]. As shown in Figure 1, the TGD and GD were constructed in the mainstream of the Changjiang River, and the DR was built in the mainstream of Hanjiang River, which is the largest tributary of the Changjiang River, contributing 7% to runoff through the middle stream [37]. Here, we mainly analyze the influence of the above three large dams.
The Danjiangkou Reservoir water control project began in 1958 and was originally designed for flood control, irrigation, and power generation. In 1973, it was completed and started to impound with a maximum water level of 157 m, which was one of the large reservoirs built in China. Then, the GD project was constructed, with the first and second stages completed in 1981 and 1988, respectively. The GD was the first dam built on the Changjiang River, which was an important part of the TGD project [38]. Thereafter, to enhance the power generation and flood control of the Changjiang River, the TGD project was formally started. In 1997, the first stage of the TGD was completed, achieving river closure. The reservoir began to impound water and generate electricity in 2003, showing that the second stage of the TGD was completed. Finally, the TGD was put into operation at full capacity in 2009. Then, in 2014, the Danjiangkou Dam was heightened, and the water level was increased from 157 m to 170 m to meet the water resource demand of the SNWDP (middle line) (Figure 11).
Located downstream of the Hanjiang River, the Huangzhuang gauging station records the water discharge from the Hangjiang River to the Changjiang River. Before 1973, the mean discharge ratio of the Hanjiang River to the Changjiang River was 7.2%, which decreased to 6.3% during 1973–2014, since the DR was put into operation, suggesting that the Danjiangkou reservoir dominated the discharge pattern of the middle Changjiang River catchment at a multidecadal scale (Figure 12).
Thereafter, we divided the monthly mean discharge at the three stations into the aforementioned six stages (Figure 13). It was evident that water discharge significantly decreased at Yichang station in October, when each engineering project had been completed, and the discharge remained steady in November and December; then, the discharge increased from January to March. Similar variations also occurred at the Hankou and Datong stations. According to this trend, in October, TGD accounted for 34.4%, 24.5%, and 18.7% of the decreases in discharge in the upper, middle, and lower Changjiang catchment, respectively, and GD accounted for 14.5%, 10.7%, and 10% of the decreases. From January to March, 42.5%, 26.4%, and 21.2% of the increases in discharge in the upper, middle, and lower Changjiang catchment were caused by TGD, and the 16%, 12.4%, and 11.6% increases were caused by GD, respectively (Figure 13). These results occurred because the reservoirs usually began to impound in October and then were continuously replenished from January to March. The variations were highly consistent with the pattern of monthly water discharge variability (Table 2, Figures S1–S3, in the Supplementary Materials).
In addition, based on the monthly water discharge variation, the seasonal pattern of water discharge also clearly changed. The mean water discharge in the flood season decreased evidently from 1956 to 2014, while that in the dry season increased during this period, with the discharge ratio of the flood season to the dry season declining significantly (Figure 4). This phenomenon was especially notable at Yichang station and was induced by the great impact of the TGD operation. The results supported the pattern of “no flood in the flood season and no drought in the drought season,” as reported by Dai et al. (2008) in the extreme drought year of 2006. It can be expected that this trend will continue in the future following the regulation of various dam projects.
Furthermore, abrupt changes in the annual mean discharge at the three stations based on the MK test all coincided with the year the reservoirs were completed or when an extreme flood or drought occurred (Figure 6). Abrupt changes in the monthly discharge series showed a strong correlation with the time when impoundment and replenishment were carried out at the reservoirs, which was especially notable in October, 2003, when the first stage of the TGD was completed and the impoundment was implemented (Figure 7, Figure 8 and Figure 9).

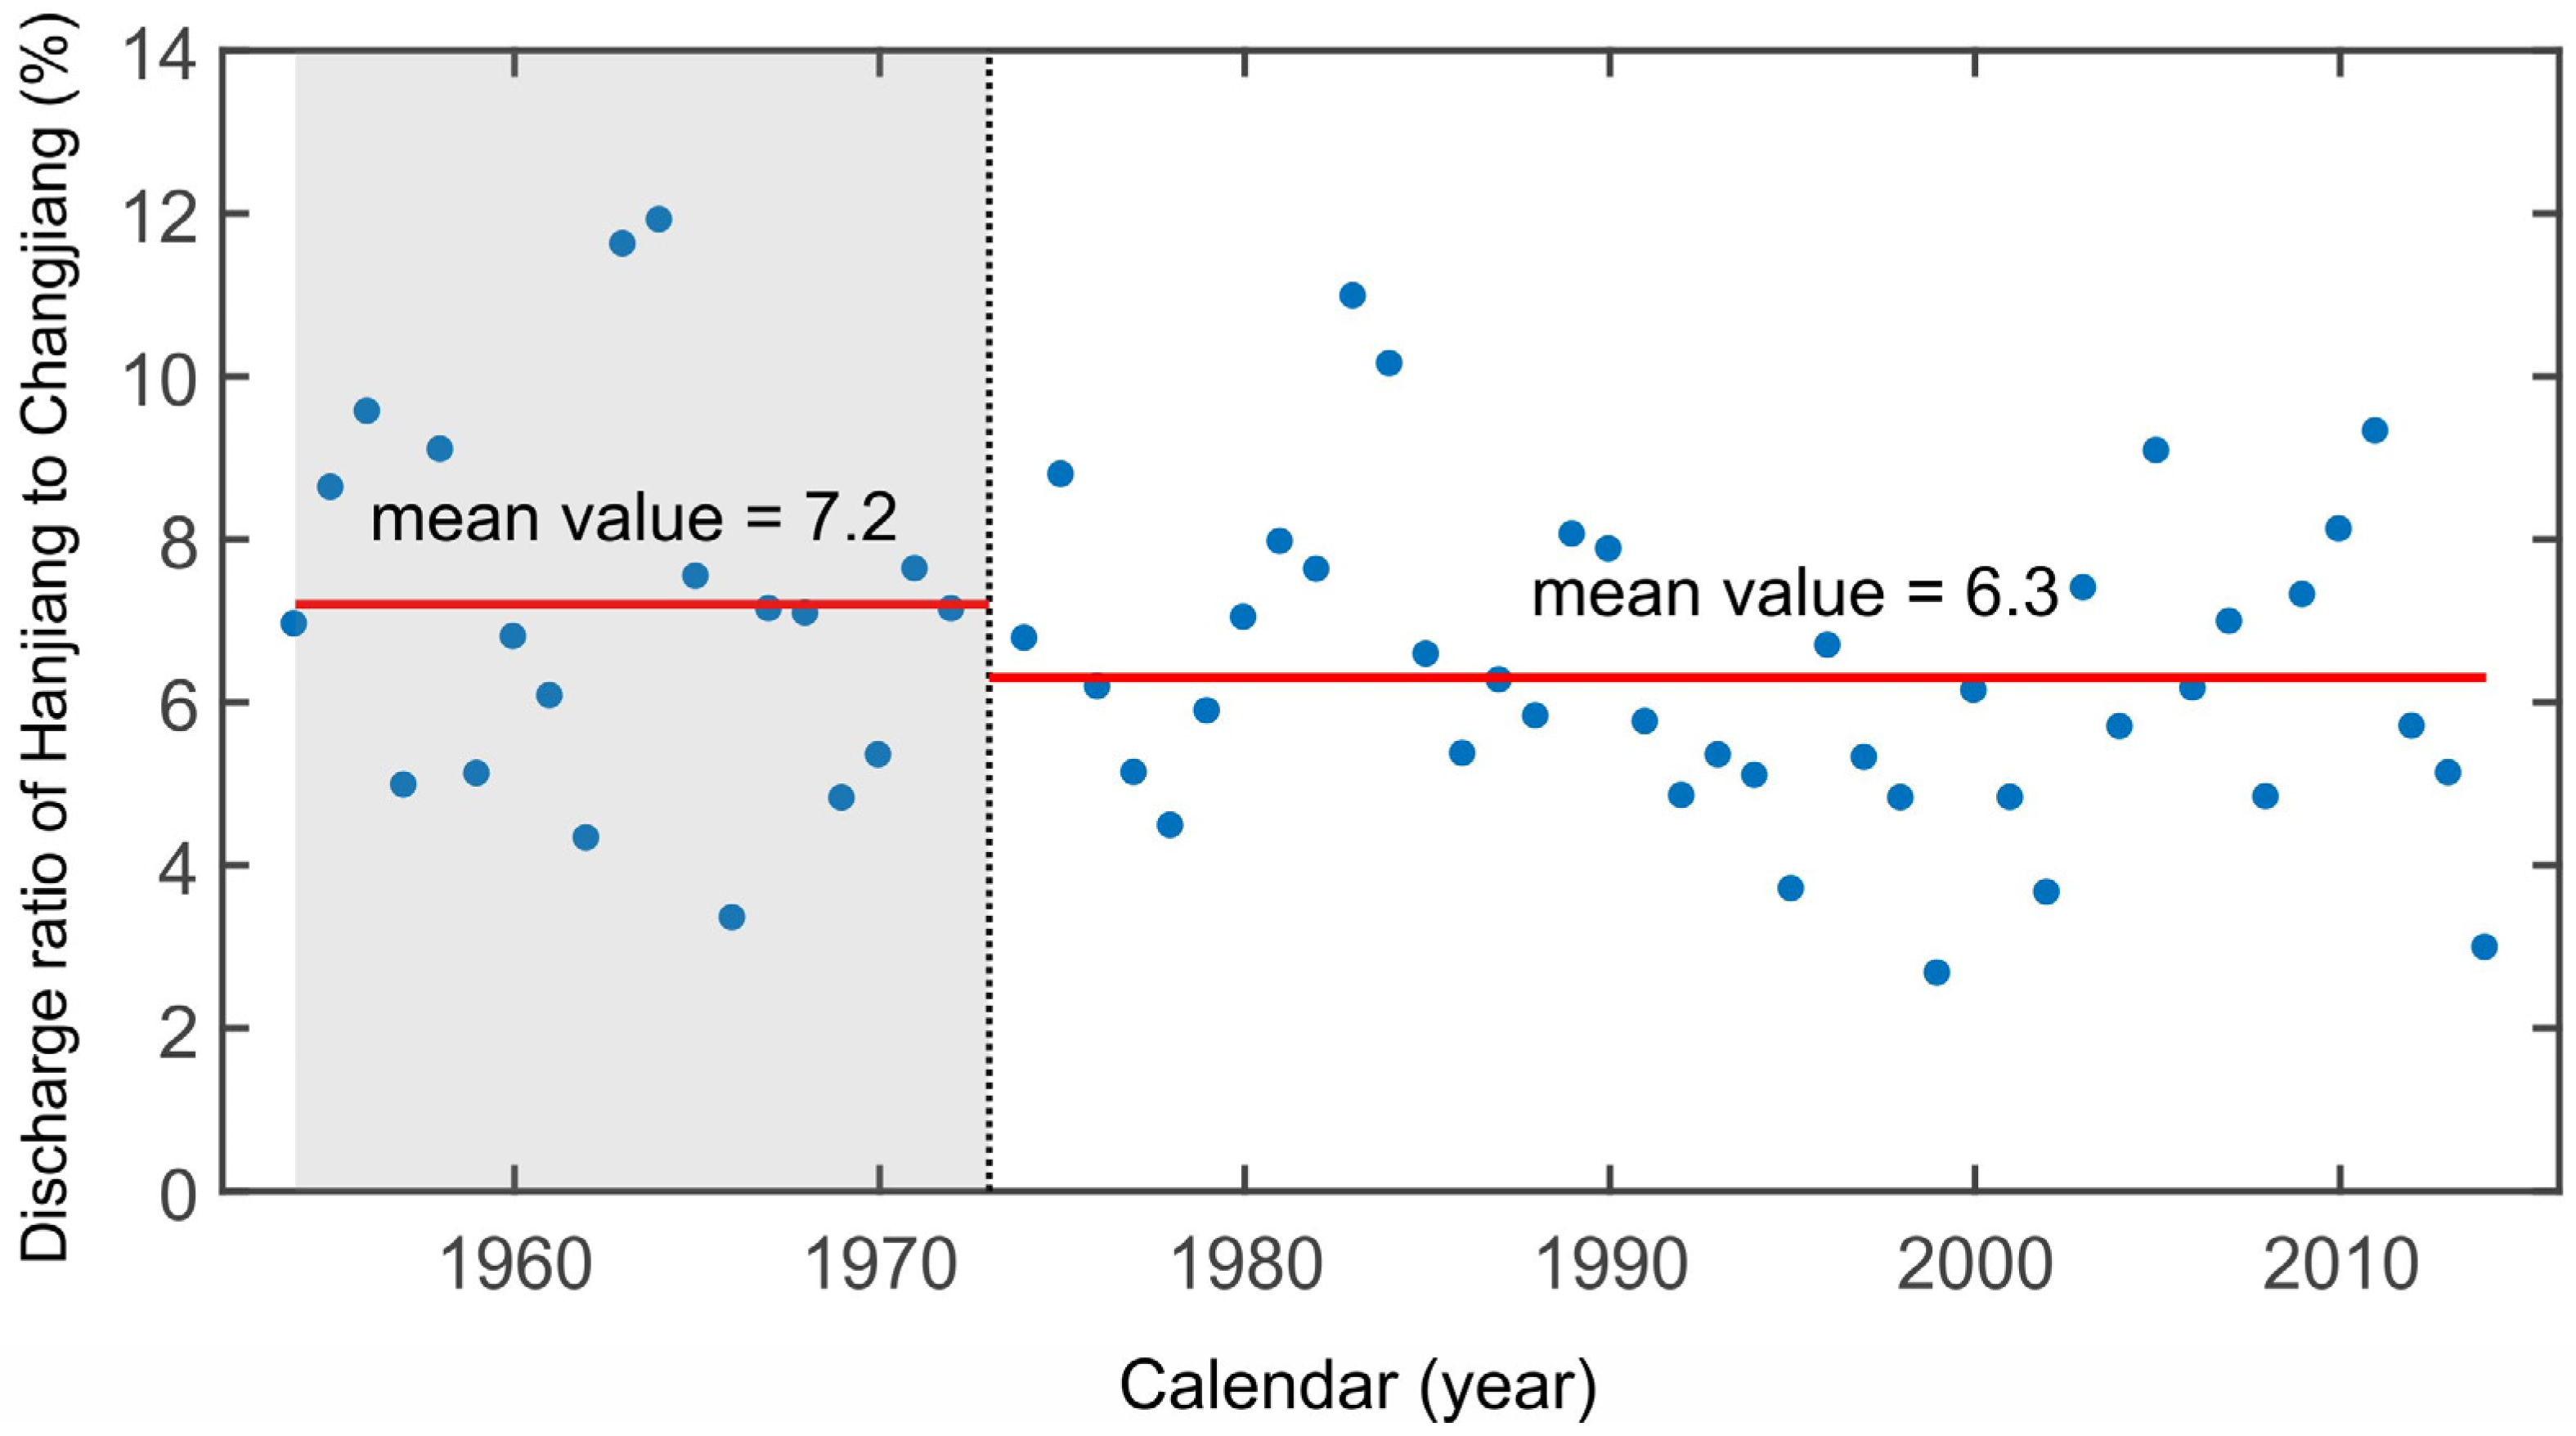
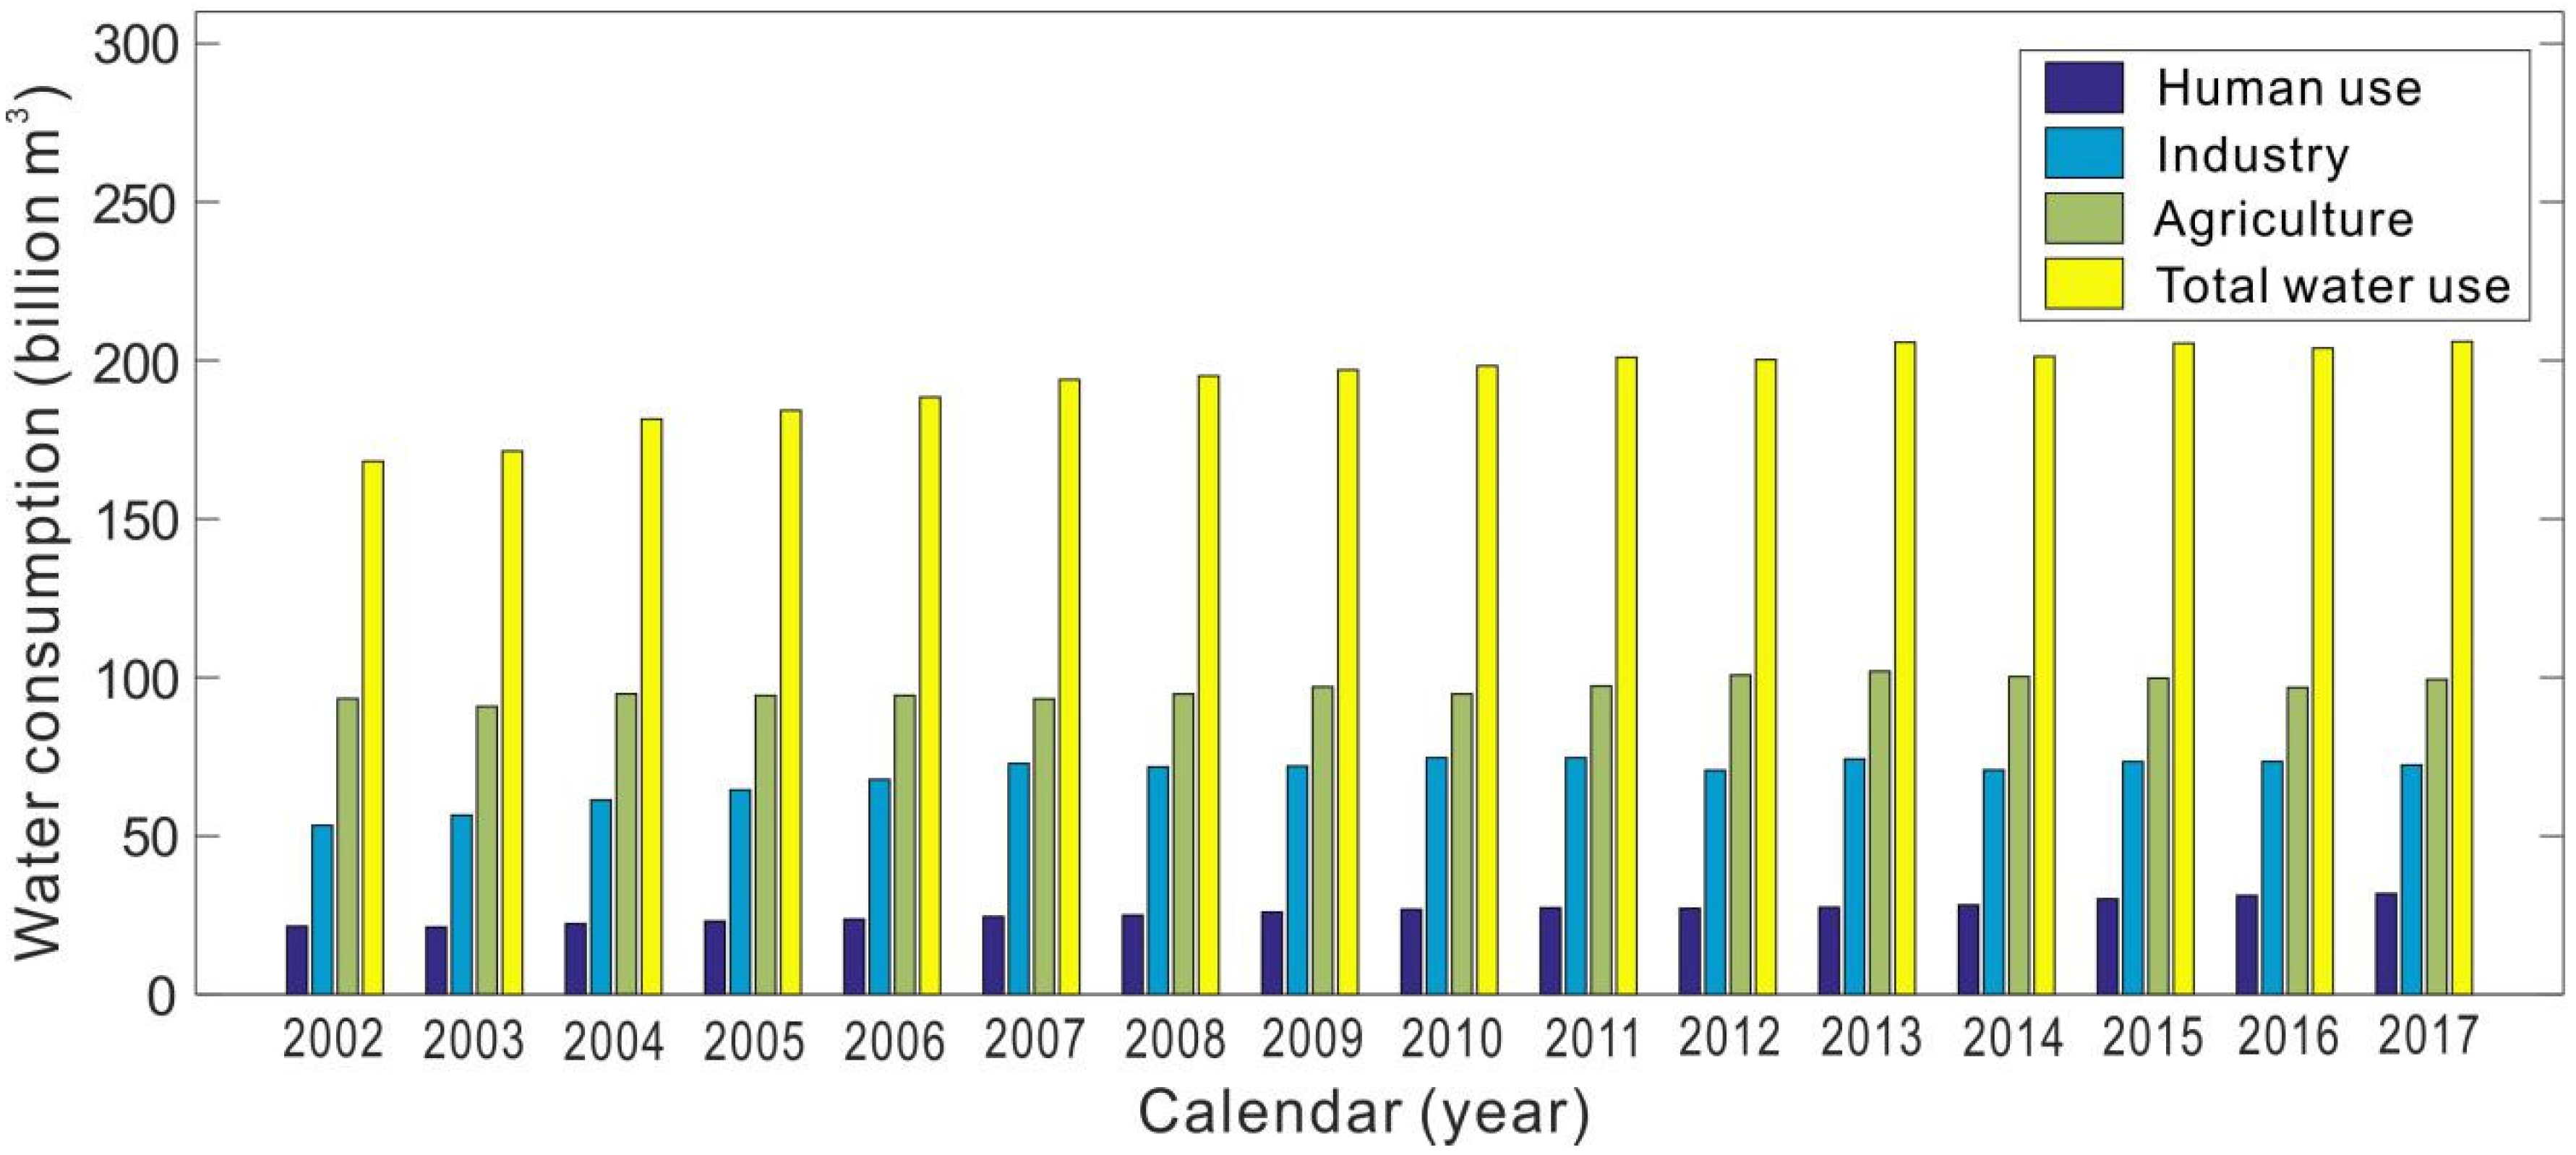
4.3. Influence of Water Withdrawal

Water withdrawal projects and reservoir (dam) operations interact with each other, and they are systematic engineering projects. Water was diverted from the main reservoirs for agricultural, industrial, and human consumption, which would influence the discharge and water resources within the reservoir in turn. A previous study has shown that the Eastern and middle routes of the SNWDP (Figure 1), which have already been in operation, are providing water resources from the Changjiang River for more than 100 million people in the areas of Jiangsu, Anhui, Shandong, Hebei, and Tianjin [39]. While the project benefits a large number of populations for their livelihoods in the North, this project indeed has put enormous pressure on the water resources of the Changjiang catchment in the South.
According to the project plan, the construction and operation of the SNWDP middle line was divided into three stages: by 2010, 9.5 billion m3 of water was diverted from the Danjiangkou Reservoir annually on the basis of net water shortage in Northern areas, and this value accounted for 20% of the annual discharge of the Hanjiang River. By 2030, an extra 3.5 billion m3 of water will be diverted from the Changjiang River to the Hanjiang River to improve the annual mean discharge to Northern China. By 2050, according to the water demand, a diversion project directly from the mainstream Changjiang River to the Northern area could be built to improve the water supply capacity of the middle line [40].
In addition, the construction and operation of the SNWDP Eastern line were designed for three stages from 2010 to 2030, respectively, with water diversions of 500, 600, and 800 m3/s [40]. Therefore, the total discharge of the middle and Eastern lines will account for 5.7% of the annual mean discharge of the Changjiang River at Datong. In 1979, which was an extreme drought year, the monthly mean discharge of the Changjiang River was only 7220 m3/s in January at Datong, when the designed total discharge of the SNWDP accounted for approximately 22% of the low flow.
In addition, Figure 14 shows that water consumption in the middle catchment was higher than that in the upper and lower catchments, and the mean volume of water consumption in the upper, middle, and lower catchments accounted for 4.2%, 10.3%, and 7.4% of the annual mean runoff of the Changjiang River, respectively. Moreover, Figure 15 shows that the total water use increased from 168 billion m3 to 206 billion m3 from 2002 to 2017 following an increasing industrial water consumption in the Changjiang catchment. Owing to the rising population and economic growth, water withdrawals have become increasingly intensive, so sharp declines in water availability per capita have taken place extensively in many areas of the world [14], as well as in the Changjiang catchment; this decline is expected to worsen [39].

4.4. Sustainability in the Future

At present, river systems worldwide have been extensively altered by anthropogenic stressors, such as large-scale damming and water diversions, which are challenging the integrity and future of these large rivers [41]. In addition, the rapidity and extent of such an impact on mega-Changjiang is particularly evident and may be irreparable [37]. The total capacity of reservoirs constructed in the Changjiang catchment was as high as 358.8 billion m3 in 2016, which accounted for approximately 40% of the annual runoff through Datong, and it has been predicted that the total capacity will continuously increase, owing to 100 river engineering construction projects (http://news.bjx.com.cn/html/20190617/986650.shtml). In addition, Zhang et al. [42] noted that the water extraction capacity downstream of Datong was almost 4000 m3/s, which was much more than the diversion capacity of the SNWDP Eastern line. This directly induced saltwater intrusion in the Changjiang Estuary, which was a serious issue affecting the development of society and the economy. Therefore, water withdrawal in the downstream Changjiang catchment is one of the most important factors affecting saltwater intrusion in the Changjiang Estuary. Based on previous investigations and simulations, when the water discharge at Datong station is less than 11,000 m3/s, water extraction and diversion projects are paused or the discharge of water withdrawal is reduced to avoid aggravating saltwater intrusion in the Changjiang Estuary [43].
Furthermore, the monthly mean water discharge in January was lower than that in other months, indicating that in January, saltwater intrusion was most likely to occur in the Changjiang Estuary. Owing to the replenishment of dams in the dry season, the monthly mean discharge during the post-dam period was approximately 2388 m3/s more than that during the pre-dam period in January, which greatly alleviated the current risk of saltwater intrusion. However, the rising water capacity of the SNWDP and the expansion of water extraction and consumption have caused serious vulnerabilities. Based on the present SNWDP capacity of 800 m3/s and its increasing water consumption volume of 73 m3/s per year, we estimated that the monthly mean discharge in January will be less than the threshold of 11,000 m3/s in 2028, probably resulting in the severe issue of saltwater intrusion. Furthermore, the situation will continue to worsen over time because the capacity of the SNWDP will reach the designed value of 1600 m3/s in 2030. If this coincides with a drought year, then the risk of water shortage will be greatly increased. Therefore, while river engineering and water consumption projects promote economic development and quality of life, we should regulate the distribution of water diversion and consumption to ensure the sustainability and resilience of water resources.

5. Conclusions

The great rivers and their drainage basins worldwide are central to the development of human civilization by providing water resources and transportation channels. However, they are facing enormous challenges resulting from the expansion of river engineering. Based on the water-gauge discharge data at the Yichang, Hankou, and Datong stations on a multidecadal scale, we examined how river engineering impacts the water discharge of the mega-Changjiang. The main conclusions can be summarized as follows:
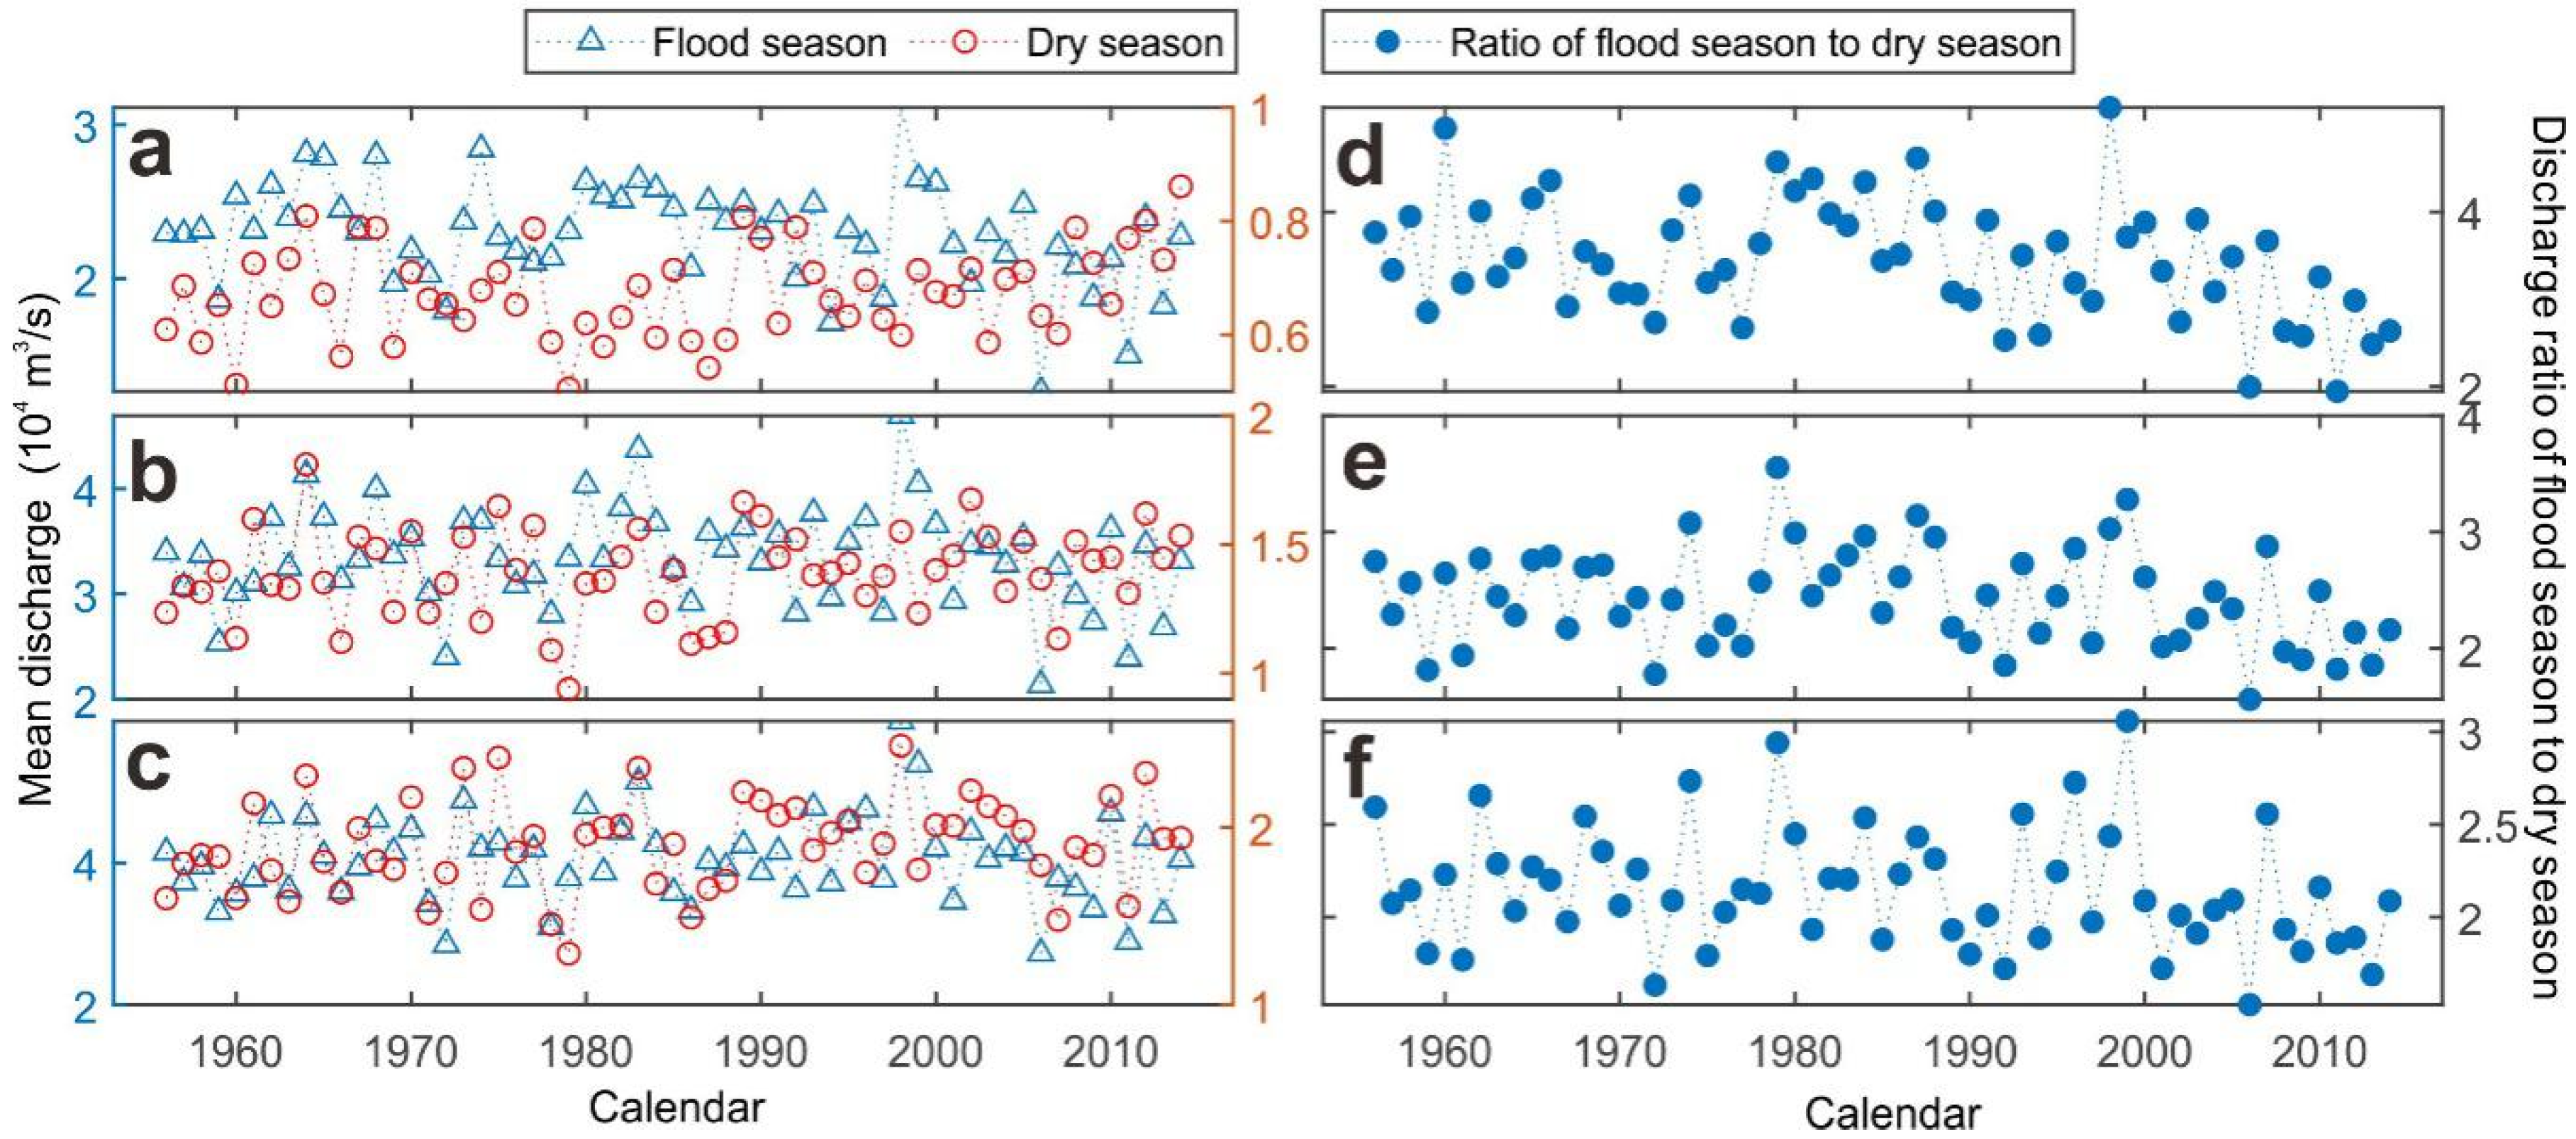
  • During the period of 1954–2014, there was a minor decrease in decadal water discharge in the upper Changjiang catchment and unremarkable variation in the middle and lower Changjiang catchments. The mean discharge ratio of the flood season to the dry season decreased by 0.8, 0.5, and 0.4 from the 1960s to 2010s in the upper, middle, and lower Changjiang catchments, respectively, indicating that the seasonality of the mega-Changjiang discharge was decreasing. This resulted in a dramatic discharge decrease in October and remarkable increases from January to March.
  • Precipitation dominated the annual discharge from the Changjiang River to the sea, which was also responsible for the intra-annual fluctuations in water discharge.
  • As reservoir projects were put into operation, discharges decreased significantly in the flood season (especially in October) and increased in the dry season (especially from January to March). With water withdrawals and consumption becoming increasingly intensive, these two actions accounted for approximately 22% of the annual mean runoff of the Changjiang River in 2017. We therefore estimated that in 2028, the severe issue of saltwater intrusion will occur in the Changjiang Estuary, when the monthly mean discharge at Datong is less than the threshold of 11,000 m3/s. To make things worse, the capacity of SNWDP will reach 1600 m3/s in 2030, so the situation will be exacerbated.

Supplementary Materials

The following are available online at https://www.mdpi.com/2071-1050/12/19/8060/s1, Figure S1: Monthly distribution of the discharge at Yichang station in each month from 1956 to 2014. The red solid lines are the fitted results of linear regression, Figure S2: Monthly distribution of the discharge at Hankou station in each month from 1956 to 2014. The red solid lines are the fitted results of linear regression, Figure S3: Monthly distribution of the discharge at Datong station in each month from 1956 to 2014. The red solid lines are the fitted results of linear regression.

Author Contributions

Conceptualization, Z.D.; investigation, J.G.; data curation, J.G. and W.P.; methodology, Y.L. and X.M.; software, J.W.; project administration, Z.D.; formal analysis, B.M.; writing—original draft, B.M.; writing—review and editing, Z.D., X.M. and B.M. All authors have read and agreed to the published version of the manuscript.

Funding

This research was funded by Ministry of Science and Technology of China (2018YFE0109900) and Shanghai Science and Technology Commission (19230712400).

Acknowledgments

This study was supported by Key Project of Intergovernmental Science and Technology Innovation Cooperation of Ministry of Science and Technology of China (2018YFE0109900), International Science and Technology Cooperation Project of Shanghai Science and Technology Commission (19230712400), and National Natural Science Foundation of China (NSFC) (41706093).

Conflicts of Interest

The authors declare no conflict of interest.

References

  1. Haddeland, I.; Heinke, J.; Biemans, H.; Eisner, S.; Flörke, M.; Hanasaki, N.; Konzmann, M.; Ludwig, F.; Masaki, Y.; Schewe, J.; et al. Global water resources affected by human interventions and climate change. Proc. Natl. Acad. Sci. USA 2013, 111, 3251–3256. [Google Scholar] [CrossRef] [PubMed] [Green Version]
  2. Largier, J.L.; Hollibaugh, J.T.; Smith, S.V. Seasonally hypersaline estuaries in Mediterranean-climate regions. Estuar. Coast. Shelf. Sci. 1997, 45, 789–797. [Google Scholar] [CrossRef]
  3. Lu, X.X. Vulnerability of water discharge of large Chinese rivers to environmental changes: An overview. Reg. Environ. Change 2004, 4, 182–191. [Google Scholar] [CrossRef]
  4. Nilsson, C.; Reidy, C.A.; Dynesius, M.; Revenga, C. Fragmentation and flow regulation of the world’s large river systems. Science 2005, 308, 405–408. [Google Scholar] [CrossRef] [PubMed] [Green Version]
  5. Steffen, W.; Crutzen, J.; McNeill, J.R. The Anthropocene: Are humans now overwhelming the great forces of nature? Ambio 2007, 36, 614–621. [Google Scholar] [CrossRef]
  6. Lin, Y.; Wei, X. The impact of large-scale forest harvesting on hydrology in the Willow watershed of Central British Columbia. J. Hydrol. 2008, 359, 141–149. [Google Scholar] [CrossRef]
  7. Genz, F.; Luz, L.D. Distinguishing the effects of climate on discharge in a tropical river highly impacted by large dams. Hydrol. Sci. J. 2012, 57, 1020–1034. [Google Scholar] [CrossRef]
  8. Dai, Z.; Du, J.; Tang, Z.; Ou, S.; Brody, S.; Mei, X.; Jing, J.; Yu, S. Detection of linkage between solar and lunar cycles and runoff of the world’s large rivers. Earth Space Sci. 2019, 6, 914–930. [Google Scholar] [CrossRef] [Green Version]
  9. Grill, G.; Lehner, B.; Thieme, M.; Geenen, B.; Tickner, D.; Antonelli, F.; Babu, S.; Borrelli, P.; Cheng, L.; Crochetiere, H.; et al. Mapping the world’s free-flowing rivers. Nature 2019, 569, 215–221. [Google Scholar] [CrossRef]
  10. McClelland, J.W.; Holmes, R.M.; Peterson, B.J.; Stieglitz, M. Increasing river discharge in the Eurasian Arctic: Consideration of dams, permafrost thaw, and fires as potential agents of change. J. Geophys. Res. Atmos. 2004, 109, 1–12. [Google Scholar] [CrossRef] [Green Version]
  11. Botter, G.; Basso, S.; Porporato, A.; Rodriguez-Iturbe, I.; Rinaldo, A. Natural streamflow regime alterations: Damming of the Piave river basin (Italy). Water Resour Res. 2010, 46, 1–14. [Google Scholar] [CrossRef]
  12. Burke, M.; Jorde, K.; Buffington, J.M. Application of a hierarchical framework for assessing environmental impacts of dam operation: Changes in streamflow, bed mobility and recruitment of riparian trees in a western North American river. J. Environ. Manag. 2009, 90, 224–236. [Google Scholar] [CrossRef] [PubMed]
  13. Mix, K.; Groeger, A.W.; Lopes, V.L. Impacts of dam construction on streamflows during drought periods in the Upper Colorado River Basin, Texas. Lakes Reserv. Res. Manag. 2016, 21, 329–337. [Google Scholar] [CrossRef]
  14. Grafton, R.Q.; Pittock, J.; Davis, R.; Williams, J.; Fu, G.; Warburton, M.; Udall, B.; McKenzie, R.; Yu, X.; Che, N.; et al. Global insights into water resources, climate change and governance. Nat. Clim. Change 2013, 3, 315–321. [Google Scholar] [CrossRef]
  15. Dai, Z.; Chu, A.; Du, J.; Stive, M.; Hong, Y. Assessment of extreme drought and human interference on baseflow of the Yangtze River. Hydrol. Process. 2010, 24, 749–757. [Google Scholar] [CrossRef]
  16. Mei, X.; Dai, Z.; Van Gelder, P.H.; Gao, J. Linking three gorges dam and downstream hydrological regimes along the Yangtze river, China. Earth Space Sci. 2015, 2, 94–106. [Google Scholar] [CrossRef]
  17. Dai, Z.; Du, J.; Li, J.; Li, W.; Chen, J. Runoff characteristics of the Changjiang River during 2006: Effect of extreme drought and the impounding of the Three Gorges Dam. Geophys. Res. Lett. 2008, 35, 1–6. [Google Scholar] [CrossRef]
  18. Chen, X.; Zong, Y.; Zhang, E.; Xu, J.; Li, S. Human impacts on the Changjiang (Yangtze) River basin, China, with special reference to the impacts on the dry season water discharges into the sea. Geomorphology 2001, 41, 111–123. [Google Scholar] [CrossRef]
  19. Dai, Z.; Liu, J.T.; Xiang, Y. Human interference in the water discharge of the Changjiang (Yangtze River), China. Hydrol. Sci. J. 2015, 60, 1770–1782. [Google Scholar] [CrossRef]
  20. Xu, K.; Milliman, J.D.; Yang, Z.; Wang, H. Yangtze sediment decline partly from Three Gorges Dam. Eos. Trans. AGU 2006, 87, 185–190. [Google Scholar] [CrossRef]
  21. Dai, Z.; Chu, A.; Stive, M.; Zhang, X.; Yan, H. Unusual salinity conditions in the Yangtze Estuary in 2006: Impacts of an extreme drought or of the three gorges dam? Ambio 2011, 40, 496–505. [Google Scholar] [CrossRef] [PubMed] [Green Version]
  22. PRCHR. The People’s Republic of China Hydraulic Re-Investigations Report; Chinese Electrical Power Press: Beijing, China, 2004. [Google Scholar]
  23. Chen, Z.; Li, J.; Shen, H.; Zhanghua, W. Yangtze River of China: Historical analysis of discharge variability and sediment flux. Geomorphology 2001, 41, 77–91. [Google Scholar] [CrossRef]
  24. Yang, S.; Gao, A.; Hotz, H.M.; Zhu, J.; Dai, S.B.; Li, M. Trends in annual discharge from the Yangtze River to the sea (1865–2004). Hydrol. Sci. J. 2005, 50, 825–836. [Google Scholar] [CrossRef] [Green Version]
  25. Yang, Z.; Wang, H.; Saito, Y.; Milliman, J.D.; Xu, K.; Qiao, S.; Shi, G. Dam impacts on the Changjiang (Yangtze) River sediment discharge to the sea: The past 55 years and after the Three Gorges Dam. Water Resour. Res. 2006, 42, 1–10. [Google Scholar] [CrossRef]
  26. Tian, J.; Chang, J.; Zhang, Z.; Wang, Y.; Wu, Y.; Jiang, T. Influence of Three Gorges Dam on downstream low flow. Water 2019, 11, 65. [Google Scholar] [CrossRef] [Green Version]
  27. Yu, M.; Liu, X.; Li, Q. Impacts of the Three Gorges Reservoir on its immediate downstream hydrological drought regime during 1950–2016. Nat. Hazards 2019, 96, 413–430. [Google Scholar] [CrossRef]
  28. Yang, S.L.; Liu, Z.; Dai, S.B.; Gao, Z.X.; Zhang, J.; Wang, H.J.; Luo, X.X.; Wu, C.S.; Zhang, Z. Temporal variations in water resources in the Yangtze River (Changjiang) over the Industrial Period based on reconstruction of missing monthly discharges. Water Resour. Res. 2010, 46, 1–13. [Google Scholar] [CrossRef] [Green Version]
  29. Morlet, J.; Arens, G.; Fourgeau, E.; Giard, D. Wave propagation and sampling theory—Part II: Sampling theory and complex waves. Geophysics 1982, 47, 222–236. [Google Scholar] [CrossRef]
  30. Sang, Y.F. Improved wavelet modeling framework for hydrologic time series forecasting. Water Resour. Manag. 2013, 27, 2807–2821. [Google Scholar] [CrossRef]
  31. Smith, L.C. Trends in russian arctic river-ice formation and breakup, 1917 to 1994. Phys. Geogr. 2000, 21, 46–56. [Google Scholar] [CrossRef]
  32. Xu, K.; Milliman, J.D.; Xu, H. Temporal trend of precipitation and runoff in major Chinese Rivers since 1951. Glob. Planet. Chang. 2010, 73, 219–232. [Google Scholar] [CrossRef]
  33. Gerstengarbe, F.W.; Werner, P.C. Estimation of the beginning and end of recurrent events within a climate regime. Clim. Res. 1999, 11, 97–107. [Google Scholar] [CrossRef] [Green Version]
  34. Viles, H.A.; Goudie, A.S. Interannual, decadal and multidecadal scale climatic variability and geomorphology. Earth-Sci. Rev. 2003, 61, 105–131. [Google Scholar] [CrossRef]
  35. Philander, S.G. El Niño and La Niña predictable climate fluctuations. Rep. Prog. Phys. 1999, 62, 123–142. [Google Scholar] [CrossRef]
  36. Wei, W.; Chang, Y.; Dai, Z. Streamflow changes of the Changjiang (Yangtze) River in the recent 60 years: Impacts of the East Asian summer monsoon, ENSO, and human activities. Quat. Int. 2014, 336, 98–107. [Google Scholar] [CrossRef]
  37. Dai, Z.; Mei, X.; Darby, S.E.; Lou, Y.; Li, W. Fluvial sediment transfer in the Changjiang (Yangtze) river-estuary depositional system. J. Hydrol. 2018, 566, 719–734. [Google Scholar] [CrossRef] [Green Version]
  38. Yu, M.; Li, Q.; Lu, G.; Cai, T.; Xie, W.; Bai, X. Investigation into the impacts of the Gezhouba and the Three Gorges Reservoirs on the flow regime of the yangtze river. J. Hydrol. Eng. 2013, 18, 1098–1106. [Google Scholar] [CrossRef]
  39. Kattel, G.R.; Shang, W.; Wang, Z.; Langford, J. China’s south-to-north water diversion project empowers sustainable water resources system in the north. Sustainability 2019, 11, 3735. [Google Scholar] [CrossRef] [Green Version]
  40. CSNWDPC. China South-to-North. Water Diversion Project Construction Yearbook (in China); China Electric Power Press: Beijing, China, 2010. [Google Scholar]
  41. Best, J. Anthropogenic stresses on the world’s big rivers. Nat. Geosci. 2019, 12, 7–21. [Google Scholar] [CrossRef]
  42. Zhang, E.; Savenije, H.H.G.; Chen, S.; Chen, J. Water abstraction along the lower Yangtze River, China, and its impact on water discharge into the estuary. Phys. Chem. Earth 2012, 47. [Google Scholar] [CrossRef]
  43. Xu, K.; Zhu, J.; Gu, Y. Impact of the eastern water diversion from the south to the north project on the saltwater intrusion in the Changjiang Estuary in China. Acta Oceanol. Sin. 2012, 31, 47–58. [Google Scholar] [CrossRef]
Figure 1. Map of the Changjiang drainage basin and locations of hydrological stations, reservoirs, and the South-to-North Water Diversion Project (SNWDP).
Sustainability 12 08060 g001
Figure 2. The annual discharge and mean decadal discharge of the Changjiang River at the three gauging stations. (a,b) Yichang, (c,d) Hankou, and (e,f) Datong. The red line indicates the linear regression at each station. The p value represents the significance level.
Sustainability 12 08060 g002
Figure 3. Average monthly water discharge from 1954 to 2014 at the gauging stations of Yichang, Hankou, and Datong.
Sustainability 12 08060 g003
Figure 4. The mean water discharges in the flood season and dry season at (a) Yichang, (b) Hankou, and (c) Datong and the discharge ratio of the flood season to the dry season at (d) Yichang, (e) Hankou, and (f) Datong.
Sustainability 12 08060 g004
Figure 5. Wavelet analysis of annual water discharge from 1954 to 2014. Wavelet power spectrum at (a) Yichang, (c) Hankou, and (e) Datong and global wavelet spectrum at (b) Yichang, (d) Hankou, and (f) Datong.
Sustainability 12 08060 g005
Figure 6. Abrupt changes in annual mean discharge from 1954 to 2014 calculated by the MK abrupt change test. (a) Yichang, (b) Hankou, and (c) Datong. UFk is the statistical data, which is calculated with progressive series, and UBk is calculated with retrograde series.
Sustainability 12 08060 g006
Figure 7. Abrupt changes in monthly mean discharge from 1956 to 2014 at Yichang station. UFk is the statistical data, which is calculated with progressive series, and UBk is calculated with retrograde series.
Sustainability 12 08060 g007
Figure 8. Abrupt changes in monthly mean discharge from 1956 to 2014 at Hankou station. UFk is the statistical data, which is calculated with progressive series, and UBk is calculated with retrograde series.
Sustainability 12 08060 g008
Figure 9. Abrupt changes in monthly mean discharge from 1956 to 2014 at Datong station. UFk is the statistical data, which is calculated with progressive series, and UBk is calculated with retrograde series.
Sustainability 12 08060 g009
Figure 10. Annual mean precipitation over the (a) upper, (b) middle, and (c) lower catchments of the Changjiang River and annual mean discharge of (a) Yichang, (b) Hankou, and (c) Datong. Correlation analysis of the annual mean discharge and precipitation for (d) Yichang, (e) Hankou, and (f) Datong. The red solid lines in panels (df) are the fitted results of the linear regression.
Sustainability 12 08060 g010
Figure 11. Time series of the three large dam operations.
Sustainability 12 08060 g011
Figure 12. Discharge ratio of the Hanjiang River to the Changjiang River before and after the first impoundment of Danjiangkou Reservoir in 1973.
Sustainability 12 08060 g012
Figure 13. Distribution of monthly mean discharges at six stages in (a) Yichang, (b) Hankou, and (c) Datong.
Sustainability 12 08060 g013
Figure 14. Water consumption from 2006 to 2018 in the upper, middle, and lower catchments of the Changjiang River.
Sustainability 12 08060 g014
Figure 15. Water consumption in recent years (2002–2017) along the Changjiang River.
Sustainability 12 08060 g015
Table 1. Related data specifications.
Gauging StationTime SpanFrequency
DischargeYichangJan. 1954–Dec. 2014Yearly
HankouJan. 1954–Dec. 2014Yearly
DatongJan. 1954–Dec. 2014Yearly
YichangJan. 1956–Dec. 2014Monthly
HankouJan. 1956–Dec. 2014Monthly
DatongJan. 1956–Dec. 2014Monthly
Water usageBasin-wide2002–2017Yearly
Table 2. Mann−Kendall trend analyses of discharge in different months at different control stations. N represents the number of data samples (years).
YichangHankouDatongN
Annual−3.34−0.37−0.1661
January8.9110.459.6859
February9.969.097.6059
March7.926.336.0159
April3.941.310.1759
May−0.35−3.04−2.9659
June−1.020.250.2759
July−0.900.000.6059
August−3.31−0.070.8559
September−2.66−1.74−0.1359
October−7.08−5.44−3.4159
November−3.43−2.32−1.4159
December0.122.303.0059

