1. Introduction
Global warming has been continuously threatening sustainable development of human society. As the key component of greenhouse gas (GHG) and primary cause of global warming, carbon dioxide has increasingly become the focus of the world. In this context, countries all over the world pay high attention to climate change and formulate environmental policies to reduce carbon emissions. China has become the world’s largest carbon emitter [
1], accounting for 29% of global carbon emissions in 2016 [
2]. Under such increasing pressure of reducing carbon emissions, China has implemented a series of mitigation actions [
3,
4,
5] and committed to reducing its carbon intensity by 60% to 65% by 2030 compared to 2005 levels. The carbon intensity target shows China’s ambition to control GHG emissions. IEA report indicates that carbon intensity in China decreased by nearly 70% in 1990–2016 [
6]. Although China’s carbon intensity has decreased significantly during the past decades, its downward trend has slowed down [
7]. Therefore, to achieve the reduction target of China’s carbon intensity is still an arduous task.
Then, how should China achieve the national carbon intensity (NCI) target? According to the 13th Five-Year
Plan for controlling GHG emissions, the key measures to reduce GHG emissions mainly include implementing the classified guidance of controlling carbon intensity, accelerating industrial restructuring, and improving energy efficiency. Though these measures have been put into practice, and some studies have evaluated the effects of these measures [
8,
9,
10,
11], a series of theoretical problems related to these measures have not been answered. In the industrial restructuring, which sectors will contribute to the decrease of NCI? Also, which sectors will promote the increase of NCI? What are the effects of the technical and economic connections among sectors on NCI? How will improving the utilization efficiency of various fossil fuels in different sectors affect the NCI?
This paper aims to answer these questions and comprehensively examine the contributions of these mitigation measures on achieving the NCI target. It would help to consider how adjusting these measures may be more efficient to achieve the target and has important reference and guiding significance to mitigate carbon intensity in China. Accordingly, this paper firstly investigates the effects of industrial development, intermediate input coefficients, and energy efficiency on the NCI in 2017 by establishing the elasticity model of NCI, and further evaluates the contributions of key mitigation measures on achieving NCI target. This paper makes two contributions to the literature. First, using the latest input-output table in China, this study identifies the effects and their effect sizes of changes in different economic variables on NCI in 28 sectors. This allows us to understand what the key to reducing emissions in the latest stage of China’s development is; second, this paper evaluates the emissions abatement contributions of adjusting industrial structure and improving technology and management on achieving carbon intensity target by combining the elasticity values of NCI creatively. It could provide theoretical references for formulating and implementing emission mitigation policies.
The structure of this paper is as follows.
Section 2 provides the literature review.
Section 3 describes the research model and data used in this paper.
Section 4 presents the empirical results and discussion. The last section gives the conclusions and policy implications.
2. Literature Review
Many studies have investigated the impact of some main factors or mitigation measures on carbon emissions, while some studies have focused on the effects of carbon emissions or climate change on productivity and environmental innovation on productivity and employment [
12,
13,
14,
15]. The research on the influencing factors of carbon emissions is mainly based on three different approaches. Factor decomposition analyses have been extensively used to explore the quantitative effects of different factors on carbon emissions, including structural decomposition and index decomposition. Some scholars have explored the impact of energy intensity and other factors on carbon emissions using structural decomposition [
16], Laspeyres method [
17], and Log Mean Divisia Index method [
18,
19,
20]. Econometric models could be used to reveal the relative influence of most factors on carbon emissions. Some studies have applied econometric models to investigate the relationships between socioeconomic structures and carbon emissions [
21], and the influence factors of carbon emissions [
22,
23,
24]. The computable general equilibrium (CGE) model has been widely chosen to evaluate the effects of mitigation measures or policies on carbon emissions. Using the CGE model, Xiao et al. [
25] investigated the impacts of energy efficiency, energy mix, and economy structure on carbon emissions, while Wu et al. [
26] analyzed the effects of export restructuring on carbon emissions.
The above methods have been widely used to explore the main influence factors of carbon emissions. In addition, the sensitivity analysis based on the input-output model could be used to explore the effects of changes in different factors on carbon emissions in different sectors [
27]. Compared with the above methods, the sensitivity analysis focuses on measuring the driving effect of key factors on carbon emissions from the perspective of economy rather than technology, which could reveal the reaction degree of carbon emissions to influence factors in depth. By conducting an ex-ante analysis, the approach is conducive to identifying the direction and strength of changes in carbon emissions as various factors change to formulate more reasonable and practical emissions reduction policies.
Tarancón et al. [
28] investigated the main linkages among industries in light of carbon emissions in Spanish by combining an input-output model and the sensitivity analysis creatively. On this basis, the sensitivity analysis based on an input-output model has been applied to study energy consumption and environment pollution. Cruz [
29] studied the elasticity of carbon emissions in Portugal to changes in final demand, fuel use, and intermediate trading applied input-output analysis. Tarancón et al. [
30] summarized the studies on carbon emissions using the method. There is limited literature using the sensitivity analysis to study China’s carbon emissions. Liu et al. [
31] and Yang et al. [
32] investigated the elasticity of sectoral carbon emissions to technical and final demand coefficients in China. Focusing on high energy-consuming or energy-intensive industries in China, Yuan and Zhao [
33] investigated the sensitivity of carbon emissions to technological changes, while Yan et al. [
34] examined the sensitivity of carbon emissions intensity to technology and supply. Li et al. [
27] conducted the sensitivity analysis of China’s carbon intensity to changes in the emissions intensity coefficient and technology coefficient. Furthermore, some studies have applied sensitivity analysis based on the input-output model to the research of other indicators related to environment and energy, such as pollutant emissions [
35] and metal consumption intensity [
36].
These existing studies have mainly concentrated on the sensitivity of carbon emissions to changes in technical and final demand, and many of them focused on carbon emissions of industries or key industries. However, there have been few studies investigating the effects of adjusting industrial structure, improving energy efficiency and levels of technology and management, and other mitigation measures on NCI in China. It is necessary to assess the sensitivity of NCI to these mitigation measures, which could help policymakers to consider how these measures may be efficient to realize the target of decline in NCI. Therefore, this paper measures the elasticity of NCI to industrial development, intermediate input coefficients, and energy efficiency based on the input-output model, which could reveal the contributions of these mitigation measures on achieving China’s NCI target. The results could provide theoretical references for formulating and implementing related mitigation policies, which has practical significance for achieving NCI target and development of low carbon economy in China.
4. Results and Discussion
4.1. Industrial Carbon Emissions and Carbon Intensity
Figure 1 shows the carbon emissions and carbon intensity of sectors in China in 2017. It could be observed that sectors with higher carbon emissions were Electricity production and supply (N22), Metal smelting (N14), and Transport and post (N26). The carbon emissions of these three sectors were 3420.83 million tons, 1926.81 million tons, and 694.61 million tons, accounting for 39.23%, 22.09%, and 7.96% of the total carbon emissions, respectively, as shown in
Figure 2. Meanwhile, the sectors with lower carbon emissions were gas production and supply (N23), water production and supply (N24), and measuring and other machinery (N20), the values of which were less than 1 million tons. Therefore, it should focus on the sectors with higher carbon emissions, and the targeted emission reduction strategies should be developed for these sectors according to their industrial characteristics.
In terms of carbon intensity, the sectors with higher carbon intensity were electricity production and supply (N22), metal smelting (N14), and nonmetal mineral products (N13), with the values of 1.918 kg CO2/yuan, 0.819 kg CO2/yuan, and 0.302 kg CO2/yuan, respectively. The carbon intensity of these sectors was significantly higher than NCI (0.106 kg CO2/yuan). Meanwhile, the sectors with lower carbon intensity were electrical equipment (N18), measuring and other machinery (N20), and telecommunication equipment (N19), the values of which were less than 0.005 kg CO2/yuan. Carbon intensity of a sector could reflect the carbon cost for producing one unit of output value in the sector. The higher carbon intensity of a sector means a higher carbon cost of the development in the sector. To achieve China’s NCI target is essentially to reduce carbon cost of industrial economic development, the key of which is to cut down carbon cost of sectors with higher carbon intensity.
4.2. The Elasticity Analysis of NCI
4.2.1. The Elasticity Analysis of NCI to Industrial Development
The elasticity of NCI to the development of 28 sectors are shown in
Figure 3. It can be observed that seven of all elasticity values were positive while 21 of all values were negative. Sectors with positive elasticity values indicate that the increase of values added in these sectors will lead to the rise of NCI when the values added of other sectors remain unchanged, that is, the development of these sectors will promote the increase of NCI. Conversely, sectors with negative elasticity values imply that the development of these sectors will contribute to the reduction of NCI. Therefore, the development of most sectors in China could be beneficial to the decrease in NCI.
In all sectors with positive elasticity values, electricity production and supply (N22) was the sector with highest elasticity of NCI to industrial development, the value of which reached 0.371. It indicates that if the value added of this sector increases by 1%, the NCI will increase by 0.371% when the values added of other sectors remain unchanged. Furthermore, the elasticity of NCI to the development of metal smelting (N14), nonmetal mineral products (N13), and coal mining (N2) were relatively higher, with the values of 0.192, 0.042, and 0.031, respectively. Therefore, the key of industrial structure adjustment is to strengthen the rational regulation and control of the development of these seven sectors, especially electricity production and supply and metal smelting, which could accelerate the achievement of NCI target in China.
Meanwhile, other services (N28) was the sector with lowest elasticity of NCI to industrial development among all sectors with negative elasticity values (the absolute value is the largest), with the value of −0.33. It indicates that for every 1% increase in the value added of the sector, the NCI will decrease by 0.33% when the values added of other sectors remain unchanged. Moreover, the elasticity of NCI to the development of wholesale and retail (N27) and agriculture (N1) were relatively low, the values of which were −0.101 and −0.067, respectively. The results show that the moderate expansion of industry scale in 21 sectors with negative elasticity values of industrial development is conducive to reducing NCI, and achieving NCI target, especially the above three sectors.
4.2.2. The Elasticity Analysis of NCI to Intermediate Input Coefficients
As shown in
Figure 3, all elasticity values of NCI to intermediate input coefficients of 28 sectors were positive, which indicates that the decrease in intermediate input coefficient of any sector will contribute to the reduction of NCI.
It could be seen that the elasticity values of NCI to intermediate input coefficients of electricity production and supply (N22), metal smelting (N14), and chemical industry (N12) were relatively great, the values of which were 0.83, 0.761, and 0.224, respectively. Specifically, electricity production and supply was the sector with highest elasticity value of intermediate input coefficient, which shows that if the intermediate input coefficient of the sector decreases by 1%, the NCI will decrease by 0.83% when the intermediate input coefficients of other sectors remain unchanged.
The elasticity of NCI to intermediate input coefficients could describe the sensitivity of NCI to changes of technology and management in economic sectors. The intermediate input coefficients of sectors could be reduced by fully exerting the function of technical economic connections and economic efficiency among sectors and improving technology and management related to energy utilization, which could lead to the decrease in NCI. Thus, it should pay more attention to the sectors with higher elasticity values of intermediate input coefficients, and the technology and management in these sectors should be overall improved, which will contribute to achieving NCI target in China.
4.2.3. The Elasticity Analysis of NCI to Energy Efficiency
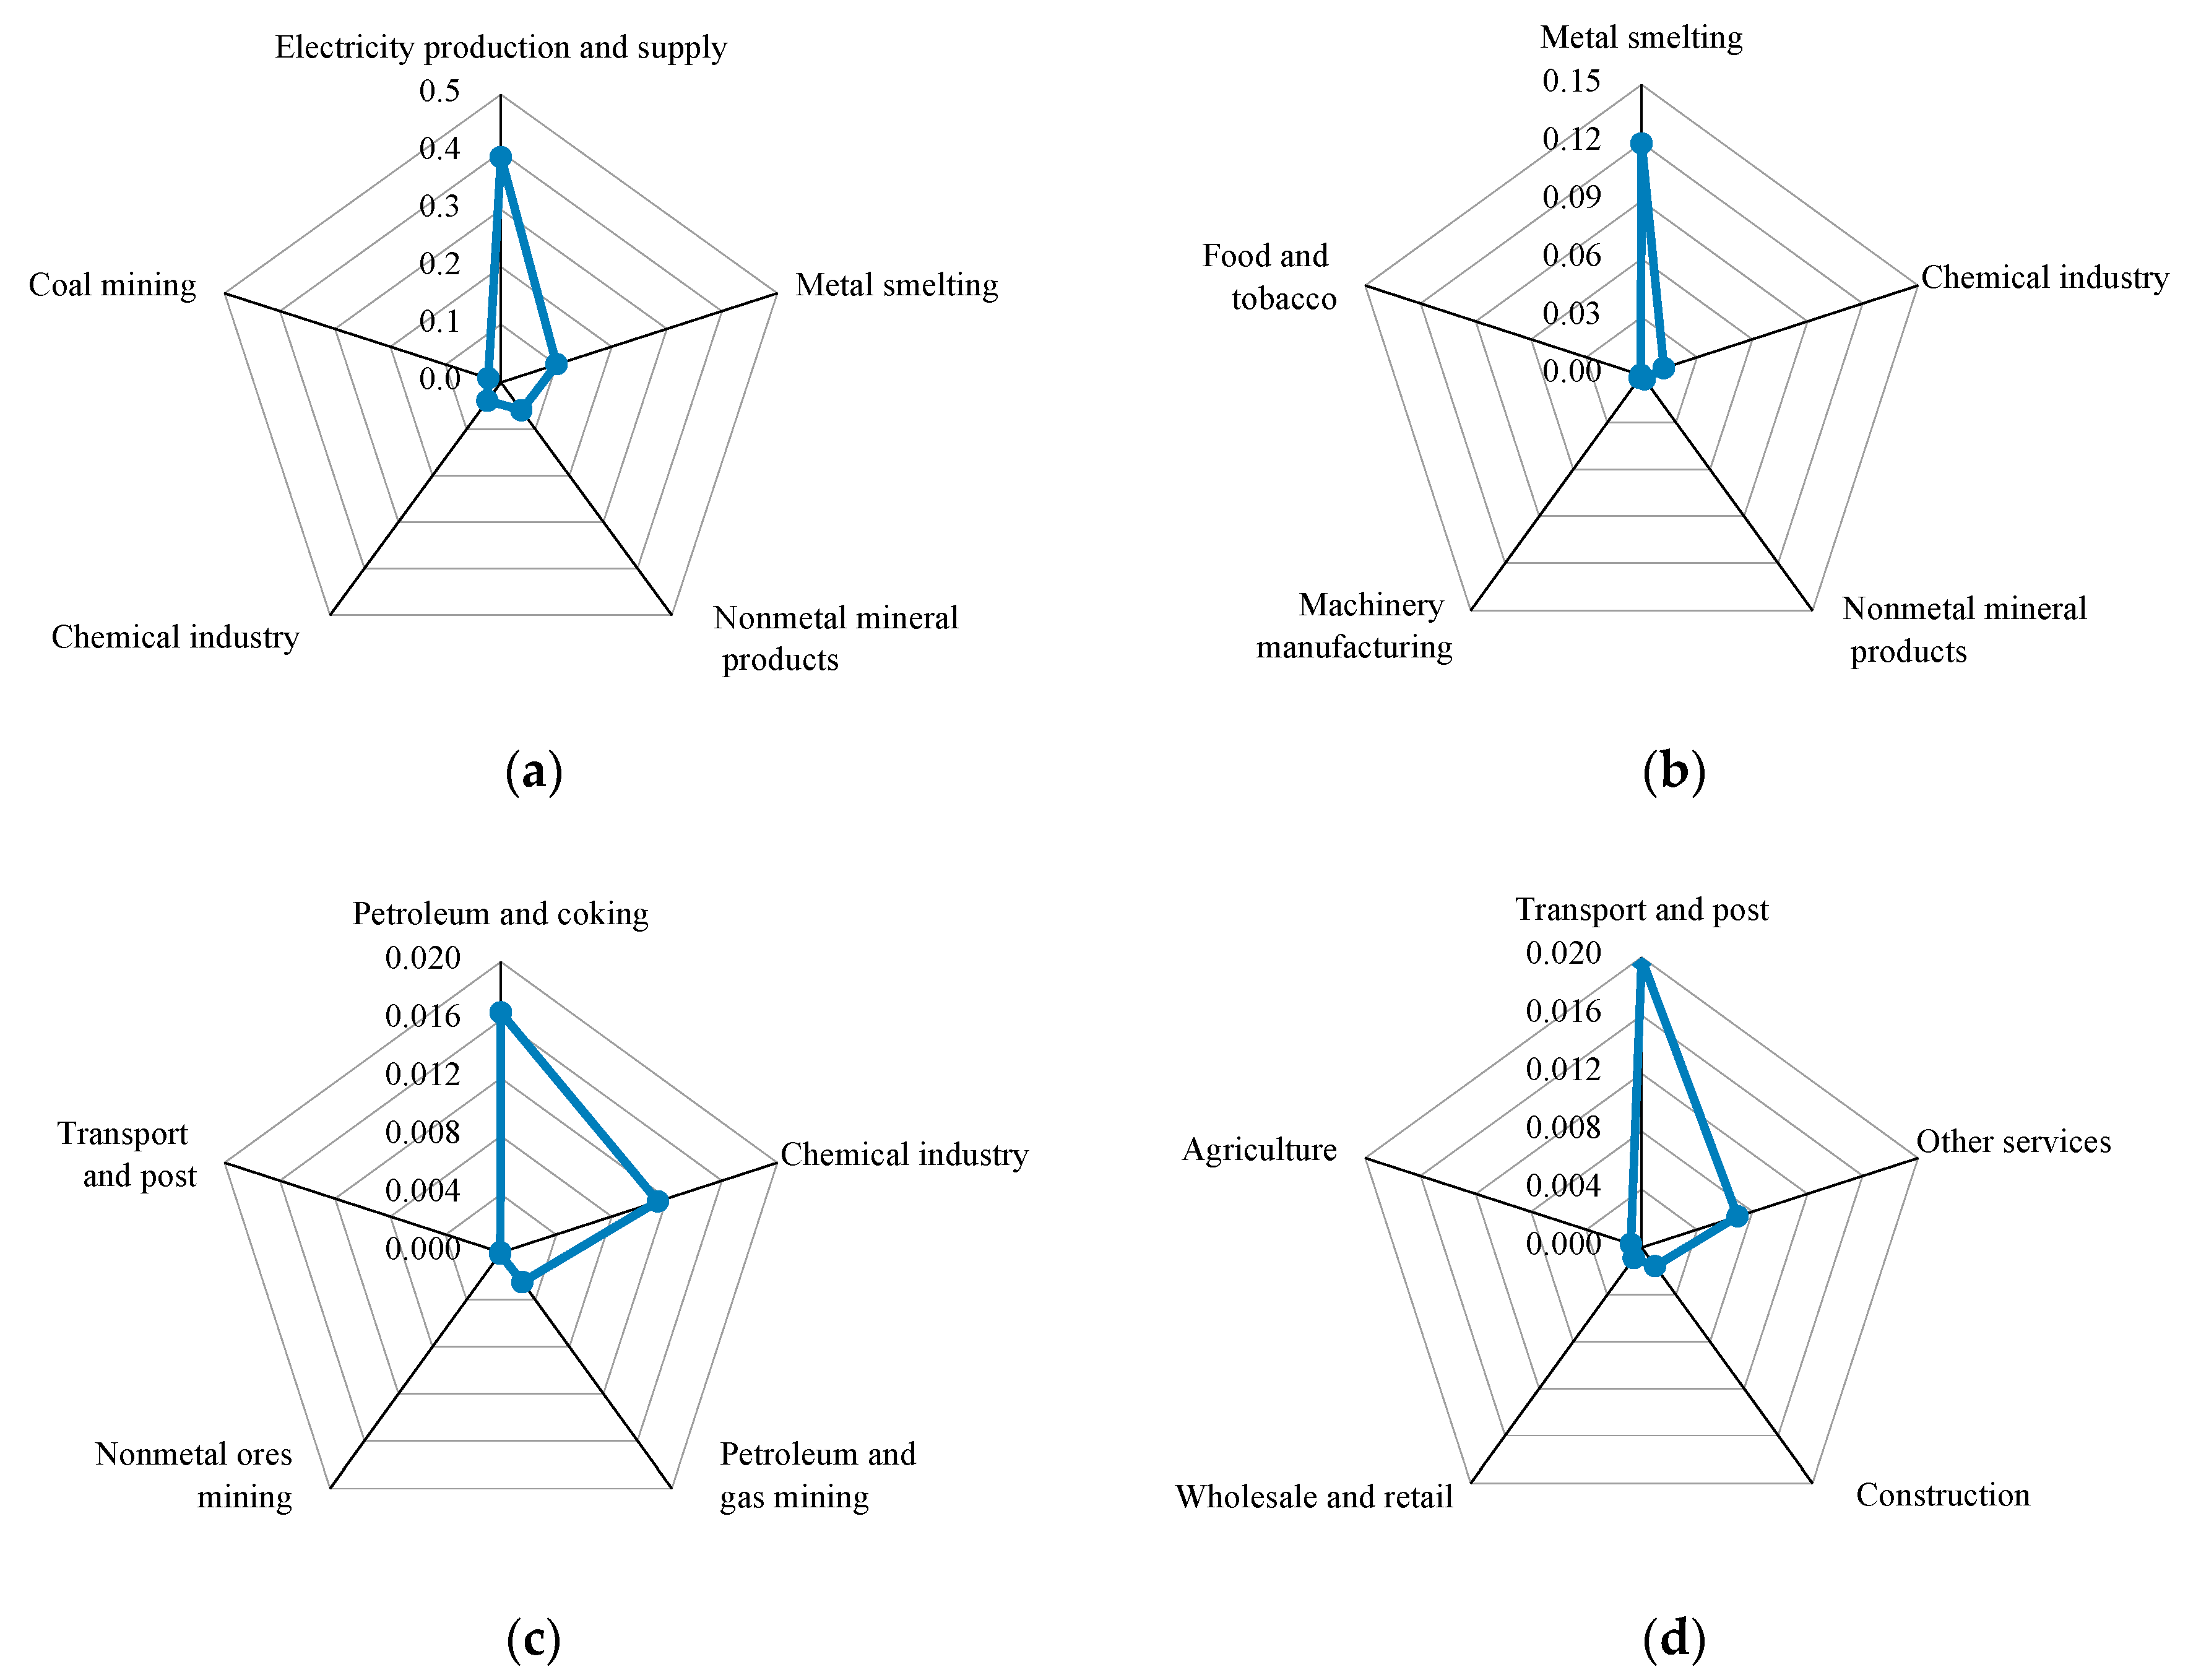
The elasticity of NCI to energy efficiency indicates the sensitivity of NCI to the efficiency change in eight types of fossil fuels used by 28 sectors. Since the amount of elasticity data is larger and most of the elasticity values are relatively small,
Figure 4 only presents the sectors with higher elasticity of NCI to the utilization efficiency of eight types of fuels.
As shown in
Figure 4a, the elasticity values of NCI to the utilization efficiency of coal in electricity production and supply and metal smelting were relatively great, the values of which were 0.391 and 0.101, respectively. Specifically, as the sector with highest elasticity, every 1% increase in the utilization efficiency of coal in electricity production and supply will reduce the NCI by 0.391%. The coal consumption of the sector in 2017 accounted for 46.49% of the total coal consumption in China. This might be the reason that the sector has highest elasticity. It can be seen from
Figure 4b that the elasticity of NCI to the utilization efficiency of coke in metal smelting and chemical industry was highest, the values of which were 0.12 and 0.012, respectively. Since the coke consumption of metal smelting and chemical industry in 2017 accounted for 86.96% and 8.44%, respectively, of the total coke consumption in China, the elasticity values of NCI to the utilization efficiency of coke in these sectors were relatively great.
Figure 4c indicates that the elasticity values of NCI to the utilization efficiency of crude oil in petroleum and coking and chemical industry were relatively great, with the values of 0.017 and 0.011, respectively. The main reason for this result might be that these two sectors consumed a large of crude oil, accounting for 93.26% and 5.47%, respectively, of the total crude oil consumption in 2017.
As shown in
Figure 4d–g, transport and post was the sector with highest elasticity of NCI to the utilization efficiency of all oil products among 28 sectors, which might be caused by high demand of oil products in the sector. Specially, the elasticity of NCI to the utilization efficiency of diesel in transport and post was highest among all elasticity of energy efficiency in the sector, which shows that if the utilization efficiency of diesel in the sector increases by 1%, the NCI will decrease by 0.041%. The main reason for the phenomenon might be that the diesel consumption of Transport and post in 2017 reached 112.54 million tons, accounting for 51.39% of the oil products consumption in the sector. Thus, improving the utilization efficiency of diesel should be the key of controlling carbon emissions from mobile source to realize China’s NCI target. In addition, the elasticity values of NCI to the utilization efficiency of natural gas were very small in all sectors, with the maximum value of 0.001, as presented in
Figure 4h. The main reason for this result might be that the share of natural gas in China’s energy consumption structure is relatively small and it is a cleaner energy with lower carbon emissions and less pollution compared with coal and other fossil fuels.
4.2.4. The Elasticity Analysis of NCI to Residential Energy Saving
The energy consumption per unit of expenditure from residential sector is used as the indicator to measure degree of residential energy saving in this paper. The elasticity values of NCI to residential energy saving are summarized in
Figure 5. It can be observed that the elasticity of NCI to residential saving of coal, oil products, and natural gas were 0.02, 0.014, and 0.001, respectively. Specifically, coal was the energy with highest elasticity value of NCI to residential energy saving among three types of fuels, which shows that if the saving degree of coal in residential sector increases by 1%, the NCI will decrease by 0.02% when the residential saving degree of other energy remain unchanged. Since the coal consumption in residential sector reached 66.52 million tons of standard coal, exceeding the consumption of oil products and natural gas, the carbon emissions from coal consumption is the most in residential sector. It might be the reason that the elasticity value of NCI to residential saving degree of coal is greater than that of oil products and natural gas.
4.3. The Evaluation of Contributions of Key Mitigation Measures on Achieving NCI Target
As mentioned above, to some degree, the industrial development could represent the adjustment of industrial structure. The fluctuation of intermediate input coefficient in an industry could reflect the changes in the levels of technology and management in the industry, and energy efficiency could measure technology and management related to energy utilization. Thus, this paper further evaluates the emissions abatement potential of these measures based on the elasticity values of NCI to industrial development, intermediate input coefficients, energy efficiency, and residential energy saving. Moreover, according to the results of elasticity analysis, the elasticity of NCI to industrial development and intermediate input coefficients were relatively great while the elasticity of energy efficiency and residential energy saving were relatively small. This indicates that changes in industrial development and intermediate input coefficients have more impacts on NCI. Therefore, this paper only evaluates the contributions of adjusting industrial structure and improving industrial technology on achieving NCI target.
4.3.1. The Contribution of Adjusting Industrial Structure on Achieving NCI Target
To evaluate the contribution of adjusting industrial structure in the future on achieving NCI target using the elasticity of NCI to industrial development, the future growth rate of values added in sectors should be predicted first. Then, this paper predicts the effect of the development of every sector on NCI combining with the elasticity of NCI to industrial development. On this base, this paper could further evaluate the contribution of adjusting industrial structure on achieving NCI target.
Firstly, the annual growth rate of values added in 28 sectors in 2012–2017 were calculated as the basis to predict that in sectors in 2017–2022. Since the data in recent five years are closer to the real industrial development than longer data, this paper used the data of values added in sectors from 2012 to 2017. Meanwhile, using short-term data to predict long-term trends is prone to large errors, so the changes in values added of sectors during 2017–2022 are predicted in this paper. Moreover, due to missing data in some sectors, the data of values added used in this paper are derived from our research group, which are calculated by the method provided by Chen [
44].
Table 1 shows the annual growth rate of values added in 28 sectors in 2012–2017. It could be observed that the sectors with higher annual growth rate of values added were gas production and supply (N23), transport equipment (N17), and telecommunication equipment (N19), with the growth rate of 14.36%, 11.97%, and 11.56%, respectively. Meanwhile, the sectors with lower annual growth rate of values added were agriculture (N1), petroleum and gas mining (N3), and coal mining (N2), with the growth rate of 3.40%, 1.44%, and 1.30%, respectively.
Then, this paper assumes that the development trends of all sectors in 2017–2022 have not changed compared to the period 2012–2017. It means that the annual growth rates of industrial values added in the future will continue the historical trends. Based on the elasticity values of NCI to industrial development and predictive growth rates of values added, this paper could predict the effects of the development of 28 sectors on NCI in 2017–2022. As shown in
Figure 6, if all sectors could continue their development trends in recent years by adjusting the industrial structure, the development of seven sectors will lead to the increase in NCI, while development of 21 sectors will promote the decrease in NCI. Out of all the sectors that will lead to the increase in NCI, electricity production and supply (N22) and metal smelting (N14) are the sectors that will result in larger growth in NCI. With the development of these two sectors, the NCI will increase by 7.97% and 5.77% in 2017–2022, respectively. Meanwhile, in sectors that will lead to a reduction in NCI, other services (N28) and wholesale and retail (N27) are the sectors that will lead to a sharp decrease in NCI. Also, the NCI will decrease by 14.89% and 3.96%, respectively, in next five years with the development of these two sectors. The main reason for the predictive result might be that these seven sectors that will lead to the increase in NCI are major sectors that consume a large amount of fossil fuels while the energy consumption of other sectors is relatively small.
In terms of three major industries, the NCI will decrease by 1.14% and 18.08% with the development of the primary and tertiary industry, while the NCI will increase by 9.11% with the development of the secondary industry. On the whole, the development of all sectors will reduce the NCI by 10.11% in 2017–2022 on the abovementioned assumption. It could be observed that adjusting industrial structure has a great contribution to achieving NCI target.
4.3.2. The Contribution of Improving Technology and Management on Achieving NCI Target
The contribution of improving technology and management on achieving NCI target could be evaluated by the elasticity values of NCI to intermediate input coefficients. In real economic activities, the intermediate input coefficients of sectors may show fluctuation with the development of production technology and management. Thus, the changes in intermediate input coefficients of all sectors in the future should be predicted firstly. Then, this paper could predict the effect of changes in technology and management of every sector on NCI based on the elasticity of NCI to intermediate input coefficients. Finally, this paper could further evaluate the contribution of improving technology and management on achieving NCI target.
Firstly, this paper calculated the annual changing rate of intermediate input coefficients in 28 sectors in 2012–2017, which could be used as the data basis of prediction. The annual changing rate of intermediate input coefficients in 2012–2017 could be represented by the average changes in intermediate input coefficients during 2012–2015 and 2015–2017 periods, which were calculated based on the input-output table in 2012, 2015 and 2017.
As shown in
Table 2, the intermediate input coefficients of 12 sectors increased while those of 16 sectors decreased in 2012–2017. The sectors with descending intermediate input coefficients indicate that the levels of technology and management in these sectors have been improved during this period, while the sectors with rising intermediate input coefficients mean that these sectors may not have advanced in technology and management. It could be observed that the sectors with greater rising range of intermediate input coefficients were machinery and equipment repairing (N21), wholesale and retail (N27), and coal mining (N2), with the increasing rate of 3.32%, 1.73%, and 1.20%, respectively. Meanwhile, the sectors with greater descending range of intermediate input coefficients were transport and post (N26), petroleum and gas mining (N3), and petroleum and coking (N11), with the decrease rate of 2.65%, 1.83%, and 1.67%, respectively.
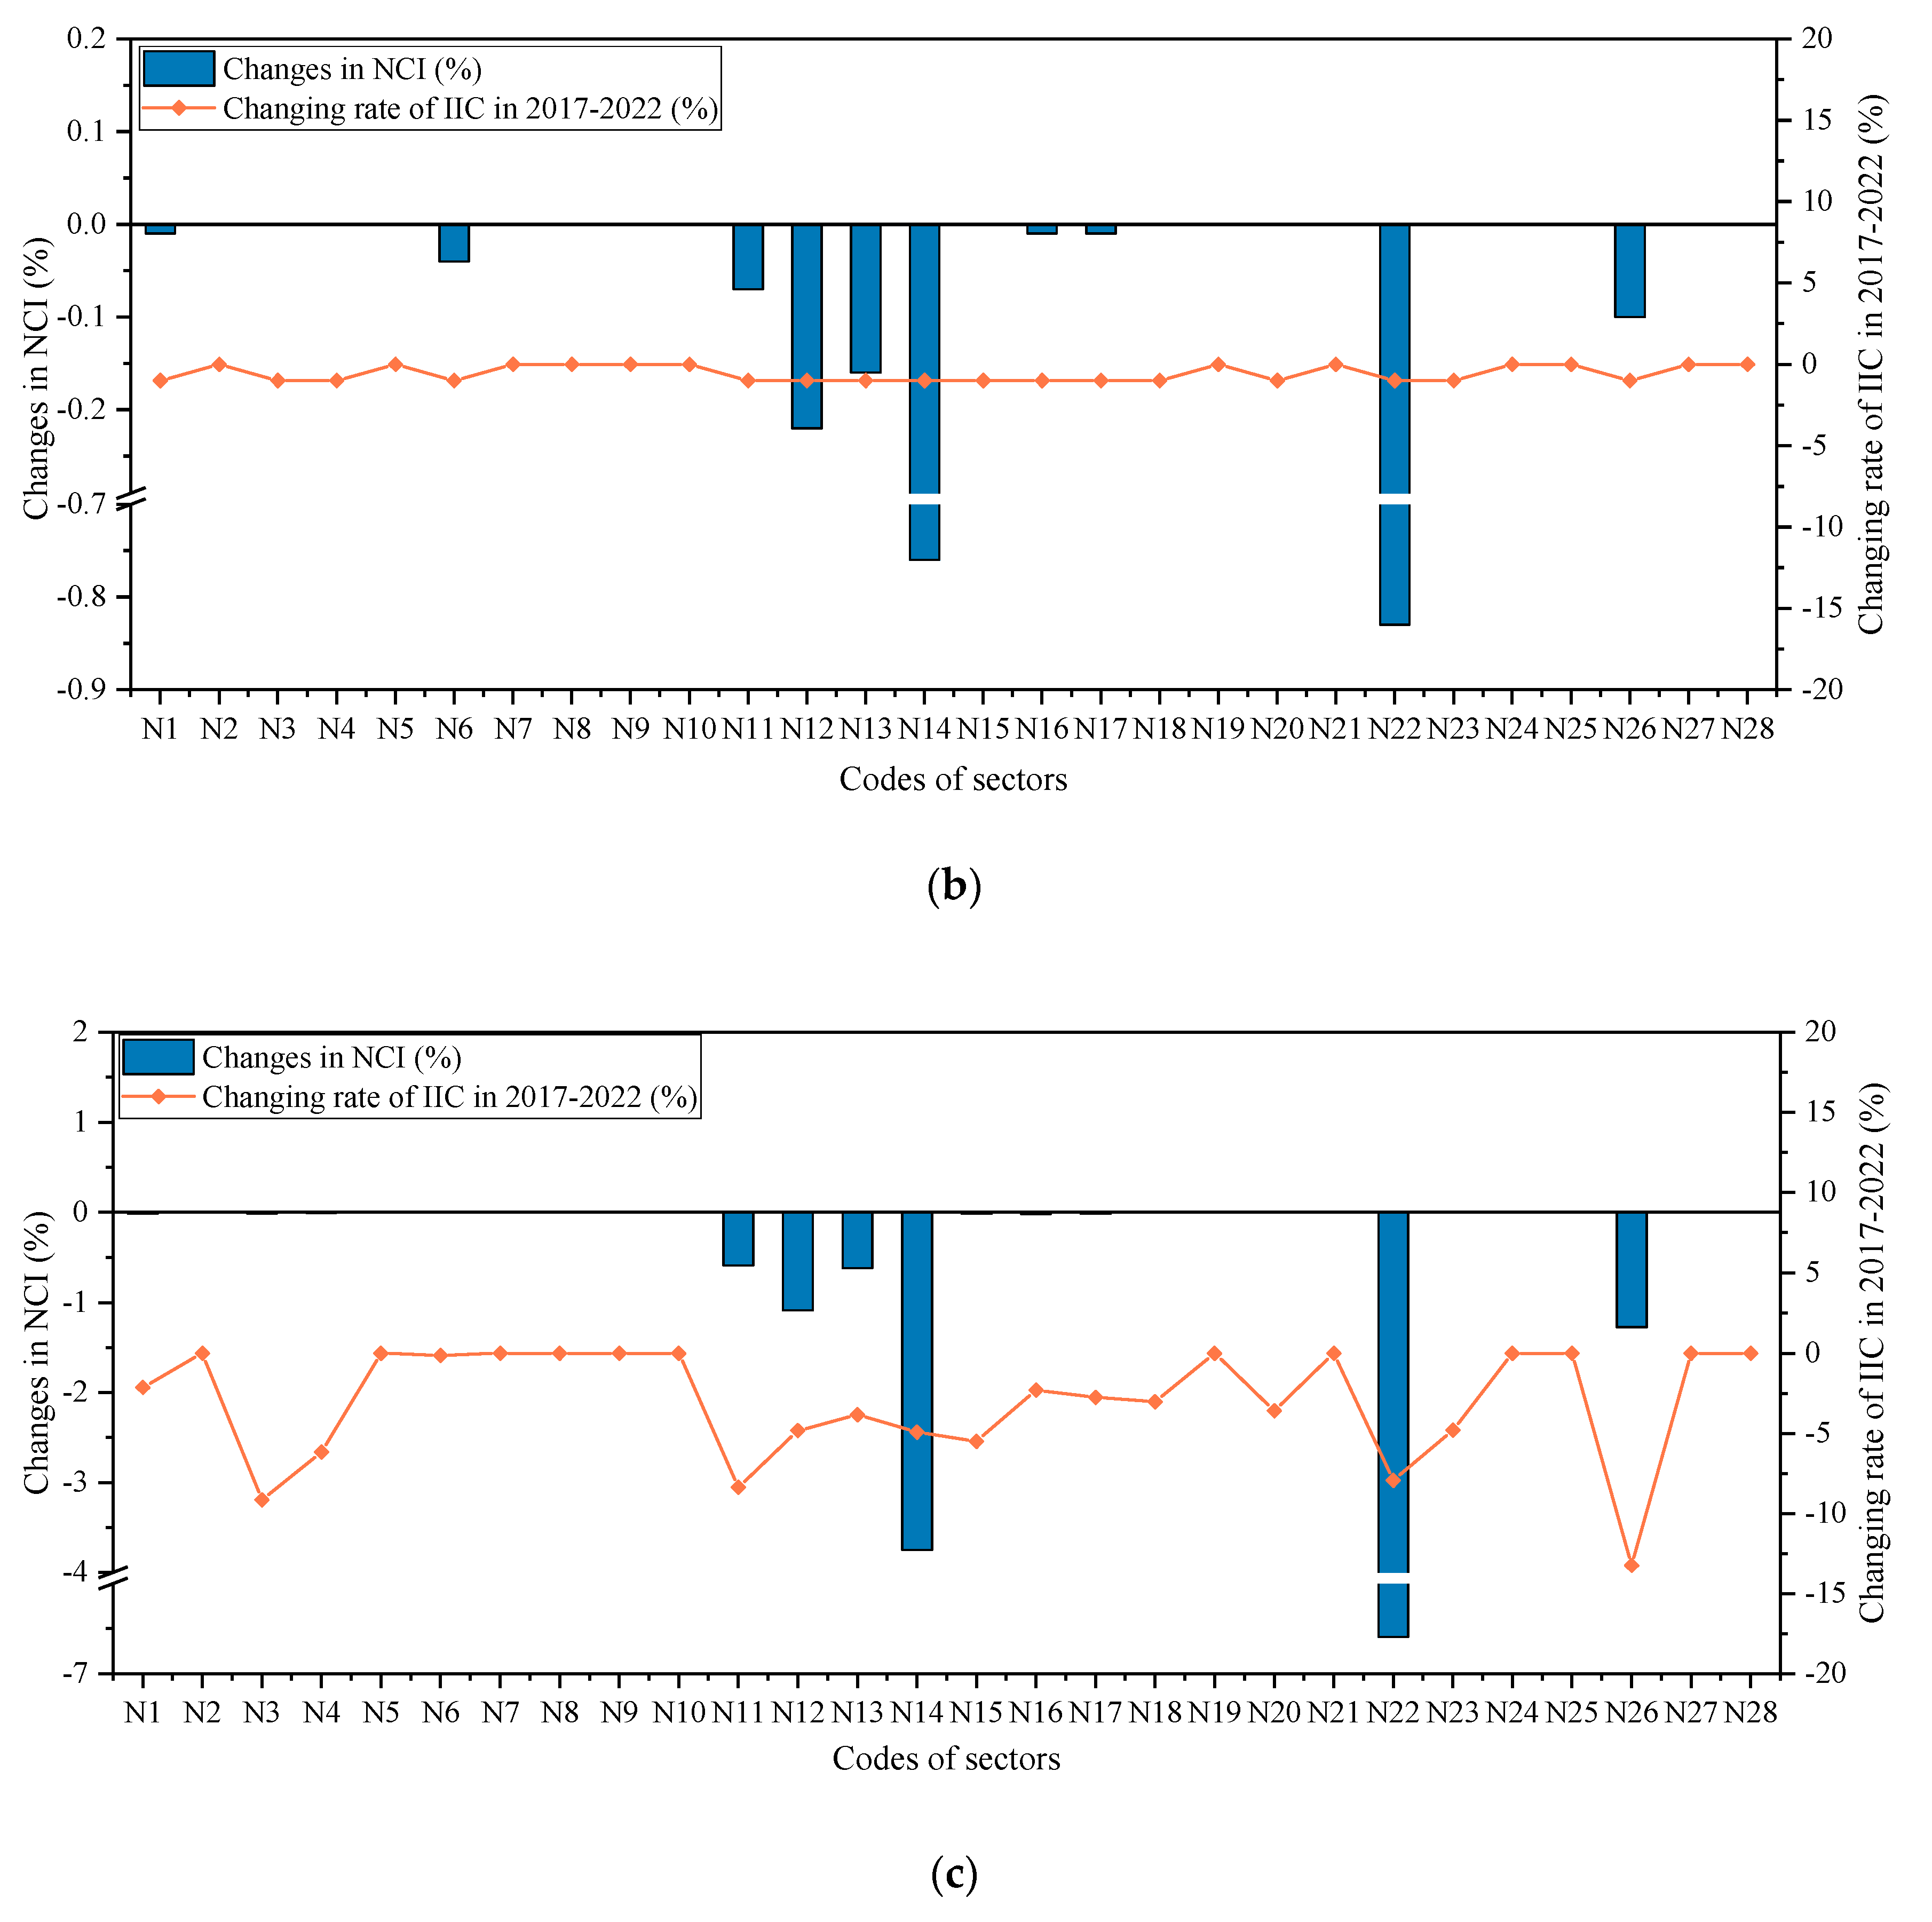
Given the differences of technological change of sectors in the future, three scenarios are set by predicting the changes in intermediate input coefficients of all sectors in 2017–2022 based on those of sectors in 2012–2017. By comparing the effects of changes in intermediate input coefficients on NCI under different scenarios (see
Figure 7), this paper could derive the contribution of improving technology and management on achieving NCI target.
The scenario 1 is designed by assuming that the changing rate of intermediate input coefficients in sectors in 2017–2022 will continue the historical trends in 2012–2017, which is served as a reference to be compared with other two scenarios.
Figure 7a presents the effects of changes in intermediate input coefficients of sectors on NCI under scenario 1. It could be observed that the changes in technology and management in nine sectors will lead to the increase in NCI, 13 sectors will promote the decrease in NCI, and the remaining six sectors have limited impact on NCI. In all sectors that will promote the increase in NCI, coal mining (N2) is the sector that will result in the largest growth in NCI. With the changes in technology and management in this sector, the NCI will increase by 0.14%. Meanwhile, in sectors that will promote the decrease in NCI, electricity production and supply (N22) and metal smelting (N14) are the sectors that will lead to a sharp decrease in NCI. In addition, the NCI will decrease by 6.59% and 3.75%, respectively, with the changes in technology and management in these two sectors. On the whole, the changes in technology and management in all sectors will reduce the NCI by 13.61% in 2017–2022 under scenario 1.
Under scenario 2, this paper assumes that the sectors with rising intermediate input coefficients during 2012–2017 will keep their coefficients unchanged in the future, while the sectors with descending intermediate input coefficients during this period will reduce their coefficients by 1% from 2017 to 2022. The effects of changes in technology and management in sectors on NCI under scenario 2 are shown in
Figure 7b. Specifically, with the changes in technology and management in electricity production and supply (N22), the NCI will decrease by 0.83%. In general, the changes in technology and management in all sectors will reduce the NCI by 2.21% in 2017–2022 under scenario 2. It shows that improving technology and management under scenario 2 has a smaller contribution to achieving NCI target than the scenario 1. This phenomenon indicates that, although sectors with declining technical level during 2012–2017 could stop their technology from declining, improving technology and management plays limited role in achieving NCI target if the improvement of technology and management level of sectors with greater technical progress slows down in the future.
Scenario 3 shows higher expectations of technical development and management improvement in sectors. It is constructed by assuming that the sectors with rising intermediate input coefficients in 2012–2017 will keep their coefficients unchanged in the predicting period, while the sectors with descending intermediate input coefficients during this period will continue the historical descending trend in the future. Under scenario 3, the effects of changes in technology and management in sectors on NCI are shown in
Figure 7c. It can be found that the changes in technology and management in all sectors will decrease the NCI by 14.02% under scenario 3. On the whole, improving technology and management under scenario 3 has a greater effect on promoting the reduction of NCI than other scenarios. It further shows that it is important to enhance the technology and management continuously in sectors with greater technical progress.
4.4. Discussion
The results show that the sectors with higher carbon emissions and carbon intensity were electricity production and supply, metal smelting, and nonmetal mineral products, while sectors with lower carbon emissions and carbon intensity were measuring and other machinery, telecommunication equipment, and water production and supply. These results are consistent with those of Wang and Feng [
37]. However, the carbon intensity of gas production and supply estimated in this paper differs from the results of Wang and Feng [
37], who pointed that the carbon intensity of gas production and supply was 0.112 kg CO
2/yuan in 2007 and ranked 10 among all sectors. In this paper, the carbon intensity of this sector was 0.007 kg CO
2/yuan in 2017, ranking 23 among 28 sectors. This means that the carbon intensity of gas production and supply decreased by 93.75% from 2007 to 2017. The coal consumption of gas production and supply decreased from 15.38 million tons to 5.83 million tons during the 2007–2017 period (decreasing by 62.09%), resulting in a significant decrease in carbon emissions of the sector. Meanwhile, the value added of gas production and supply increased from 22.2 billion yuan to 139.26 billion yuan from 2007 to 2017, which increased by 527%. Therefore, the main reason for a sharp decrease in the carbon intensity of gas production and supply is that carbon emissions decreased, and value added increased, significantly in the sector. In general, to achieve China’s carbon intensity target, it should focus on the sectors with higher carbon emissions and carbon intensity and fully excavate the emissions abatement potential of these sectors.
In all elasticity of NCI to economic variables calculated in this paper, the elasticity with greater absolute values was the elasticity of NCI to intermediate input coefficients of electricity production and supply, metal smelting, chemical industry, and nonmetal mineral products (with the values of 0.83, 0.761, 0.224, and 0.16, respectively), the elasticity of NCI to the development of electricity production and supply, other services, metal smelting, and wholesale and retail (with the values of 0.371, −0.33, 0.192, and −0.101, respectively), the elasticity of NCI to the coal utilization efficiency in electricity production and supply (with the value of 0.391), and the coke utilization efficiency in metal smelting (with the value of 0.12). These results indicate that adjusting industrial structure, reducing intermediate input coefficients, and improving energy utilization efficiency will contribute to the reduction of NCI, while the energy saving degree in the residential sector has a limited impact on NCI.
From the perspective of the effect of industrial development on NCI, the development of electricity production and supply and metal smelting will lead to a significant increase in NCI. This result may be explained by the fact that both carbon emissions and carbon intensity of these two sectors are highest among all in 2017. Specifically, carbon emissions of electricity production and supply and metal smelting were 3420.83 million tons and 1926.81 million tons, while carbon intensities of these two sectors were 1.918 kg CO2/yuan and 0.819 kg CO2/yuan, respectively. Meanwhile, the development of Other services will lead to a sharp decrease in NCI. The possible explanations for this result are as follows. The carbon emissions of other services were 171.28 million tons in 2017, accounting for 1.96% of the total carbon emissions, while the value added of the sector reached 28.78 trillion yuan accounting for 34.96% of GDP. This caused the carbon intensity of the sector to be relatively small, with the value of 0.006 kg CO2/yuan. Thus, the main reason that other services has the lowest elasticity value might be smaller carbon emissions and greater value added. These results could provide a relatively precise reference to evaluate the policy performance of carbon intensity reduction in the development of other services. On the whole, these findings suggest that China could achieve the NCI target by further adjusting and optimizing industrial structure. The key to adjusting industrial structure is not only to strengthen the regulation and control of the development of electricity production and supply and other highly energy-consuming sectors, but also to support the development of other services and other sectors with lower energy consumption.
The results of this study show that reducing the intermediate input coefficient of electricity production and supply, metal smelting, chemical industry, and nonmetal mineral products has a great contribution to decreasing NCI. The possible explanations for this are as follows. As energy-intensive industries, the inputs of fossil energy in these sectors account for a large proportion of intermediate inputs. Thus, the changes in intermediate input coefficients of these sectors will inevitably have great impacts on NCI. Since the intermediate input coefficients could reflect the levels of technology and management related to energy utilization, improving technology and management is one of the key measures to reduce NCI. Therefore, the sectors with higher elasticity values of intermediate input coefficients should be given more attention, and the technology and management in these sectors should be overall improved.
In terms of the effect of energy efficiency on NCI, improving the utilization efficiency of coal in electricity production and supply and coke in metal smelting will significantly reduce NCI. Electricity production and supply is a highly energy-consuming sector; the coal consumption of this sector in 2017 accounted for 46.49% of the total coal consumption in China. So, improving the utilization efficiency of coal in this sector will make a significant contribution to reducing NCI. On the other hand, coke is mainly used in blast furnace ironmaking and nonferrous metallurgy as a reducing agent, exothermic agent, and stock column skeleton, and it could also be used in calcium carbide production, gasification, and synthetic chemistry as raw material. Thus, metal smelting is the major sector with higher coke consumption, the coke consumption of this sector in 2017 accounted for 86.96% of the total coke consumption in China. This could explain the phenomenon that improving the utilization efficiency of coke in Metal smelting will lead to an obvious decrease in NCI. In general, it is important to strengthen the supervision and management of energy consumption in highly energy-consuming sectors and encourage enterprises to develop green production technologies. These measures could improve energy utilization efficiency and contribute to achieving the NCI target.
In addition, since changes in industrial development and intermediate input coefficients have more effects on NCI, this paper further evaluates the contributions of adjusting industrial structure and improving industrial technology on achieving NCI target. From the perspective of the contribution of adjusting industrial structure, the development of all sectors will reduce NCI by 10.11% in 2017–2022 if all sectors could continue the historical development trends. One important finding is that the development of the primary and tertiary industry will contribute to the reduction of NCI, while the development of the secondary industry will lead to an increase of NCI. These results further indicate that adjusting industrial structure plays an important role in achieving the NCI target. Therefore, the government should actively promote industrial structure adjustment, strengthen the primary industry, optimize the structure of the secondary industry, and vigorously develop strategic emerging industries and the modern service industry.
In terms of the contribution of improving industrial technology, one interesting finding is that for the sectors with a larger decline in intermediate input coefficients, continuous improvement of technology and management levels is very important to achieve the NCI target. The larger decline in intermediate input coefficients of some sectors indicates that these sectors have significantly improved the levels of technology and management. It also suggests that these sectors may have greater potential for upgrading and transformation. We found that most of the sectors with greater technical progress are highly energy-consuming sectors, such as petroleum and coking and electricity production and supply. In addition to these sectors, the levels of technology and management in transport and post have also developed rapidly. A possible explanation for this is that China has accelerated the construction of infrastructure in recent years, which makes transport and post enter a period of great development. Another possible explanation is that with the rapid development of internet, transport and post has realized new development based on big data, cloud computing, and other new technologies. Furthermore, it can be found that the majority of the sectors with greater technical progress have higher elasticity values of intermediate input coefficients. The sectors with greater technical progress and higher elasticity of intermediate input coefficients mean that they have greater potential for upgrading and transformation, and their technical upgrading has a greater contribution to achieving the NCI target. Thus, it should pay more attention to these sectors with greater potential for upgrading and contribution to emission reduction, and continuously improve the levels of their technology and management.
5. Conclusions and Policy Implications
This paper investigates the elasticity of NCI in China to industrial development, intermediate input coefficients, and energy efficiency by establishing the elasticity model of NCI based on the input-output model, and further evaluates the contributions of key mitigation measures on achieving NCI target. The conclusions can be obtained as follows.
The carbon emissions and carbon intensity of different sectors in China showed significant differences in 2017. The sectors with higher carbon emissions were electricity production and supply, metal smelting, and transport and post, accounting for 39.23%, 22.09%, and 7.96% of total carbon emissions, respectively. The sectors with higher carbon intensity were electricity production and supply, metal smelting, and nonmetal mineral products.
In terms of the elasticity of NCI to industrial development, the development of seven sectors will lead to the increase of NCI. Also, electricity production and supply was the sector with the highest elasticity among them, with the values of 0.371. Meanwhile, the development of 21 sectors will promote the reduction of NCI, where other services was the sector with the lowest elasticity, with the values of −0.33. From the perspective of the elasticity of NCI to intermediate input coefficients, the decrease in intermediate input coefficients of any sectors will promote the reduction of NCI. If the intermediate input coefficients of electricity production and supply, metal smelting, and chemical industry decrease by 1%, the NCI will decrease by 0.83%, 0.761%, and 0.224%, respectively.
Most of the elasticity values of NCI to energy efficiency are relatively small. Specifically, the elasticity of NCI to the utilization efficiency of coal in electricity production and supply reached 0.391, and the elasticity of NCI to the utilization efficiency of coke in metal smelting reached 0.12. Moreover, the energy saving degree in residential sector has a limited impact on the NCI. For every 1% increase in the residential saving degree of coal, oil products, and natural gas, the NCI will decrease by 0.02%, 0.014%, and 0.001%, respectively.
If all sectors could continue the historical development trends, the development of all sectors will reduce the NCI by 10.11% in 2017–2022. Specifically, the NCI will increase by 9.11% in 2017–2022 with the development of secondary industry and decrease by 1.14% and 18.08% with the development of primary and tertiary industry, respectively. It indicates that adjusting industrial structure has great contribution to achieving NCI target.
Assuming that the changes in technology and management level in sectors during 2017–2022 will continue the historical change trends (scenario 1), the development of technology and management in all sectors will reduce the NCI by 13.61% in 2017–2022. Under scenario 3, if all sectors will further make technical progress, the improvement of technology and management in all sectors will decrease the NCI by 14.02% in 2017–2022. It has greater contribution to achieving NCI target than other scenarios.
Based on the empirical results, some interesting implications for emissions reduction policies could be obtained in this paper. In general, improving technology and management and adjusting industrial structure might be effective ways to achieve the NCI target in China.
Firstly, China could achieve NCI target by further optimizing industrial structure. The empirical results show that the development of most sectors will promote the decrease in NCI. Moreover, by evaluating the contribution of adjusting industrial structure, this paper found that the development of the primary and tertiary industry will reduce NCI, while the development of the secondary industry will lead to the increase of NCI. These findings imply that adjusting and optimizing industrial structure have great potential for emissions reduction. Therefore, government should optimize the structure of the secondary industry, limit the development of high-energy-consumption industries, promote the transformation and upgrade of traditional industries, and eliminate inefficient and backward production. On the other hand, government should also cultivate and strengthen emerging industries, develop a modern service industry and agriculture, expand energy conservation and environmental protection industries, and guide China’s industrial structure to be high value added, low energy consumption, and low carbon emissions.
Secondly, improving technology and management could decrease the intermediate input coefficients, which will contribute to achieving emission reduction target. As found in this paper, reducing the intermediate input coefficients of any sectors will decrease NCI, and reducing those of electricity production and supply and metal smelting contributes more to decreasing NCI. Thus, promoting the improvements of technology and management in electricity production and supply and other sectors with higher elasticity of intermediate input coefficients will be helpful to achieving the NCI target. Governments should promote the optimization and improvement of the production process in energy-intensive industries and encourage enterprises to implement energy saving technology and clean production transforming. In terms of the contribution of improving technology and management, we found that in order to achieve the NCI target, it is important to continuously improve the technology and management in sectors with larger decline in intermediate input coefficients. So, this paper suggests that it should not only focus on the sectors with rising intermediate input coefficients, but also enhance the technology and management continuously in sectors with greater potential for upgrading and contribution in emission reduction, such as transport and post and petroleum and coking.
Finally, improving energy utilization efficiency will promote the achievement of NCI target. The results of this study show that improving the utilization efficiency of coal in electricity production and supply and coke in metal smelting has a great contribution to decreasing NCI. First, it is important to strengthen the supervision and management of energy consumption in the production process of enterprises and encourage enterprises to develop green production technologies and use cleaner products. Second, it should develop renewable power generation, strictly control the total coal consumption, and implement clean coal-fired central heating. These measures could promote energy conservation and emission reduction in electricity production and supply. Third, the transformation and upgrading of steel and coking industries should be accelerated to establish a development model with low energy consumption and low emissions. Moreover, this paper found that transport and post was the sector with the highest elasticity of NCI to the efficiency of all oil products. Thus, the energy consumption structure in transport and post should be further optimized. Specially, reducing the consumption of oil products and developing clean energy should be the key to controlling carbon emissions from mobile source. In addition, guiding the transformation of household consumption to low carbonization is also an important way to decrease NCI.


