Article

Solid Waste Incineration Modelling for Advanced Moving Grate Incinerators

by
Mingtao Jiang
1,†,
Adrian C. H. Lai
1,† and
Adrian Wing-Keung Law
1,2,*
1
Environmental Process Modelling Centre, Nanyang Environment and Water Research Institute, Nanyang Technological University, 50 Nanyang Avenue, Singapore 639798, Singapore
2
School of Civil and Environmental Engineering, Nanyang Technological University, 50 Nanyang Avenue, Singapore 639798, Singapore
*
Author to whom correspondence should be addressed.
Mingtao Jiang and Adrian C. H. Lai contributed equally to this work as first authors.
Sustainability 2020, 12(19), 8007; https://doi.org/10.3390/su12198007
Submission received: 27 August 2020 / Revised: 14 September 2020 / Accepted: 22 September 2020 / Published: 28 September 2020

Abstract

:
Currently, the design of advanced moving grate (AMG) incinerators for solid waste is aided by computational simulations. The simulation approach couples a waste bed model to characterize the incineration processes of the waste material on top of the moving grate, with a computational fluid dynamics (CFD) model to reproduce the heated air movement and reactions in the incinerator space above. However, the simulation results of AMG incinerators are rarely compared with actual field measurements for validation in the literature so far. In this study, we first examine the sensitivity of pyrolysis kinetics in the waste bed model using three existing alternatives. The predictions of combustion characteristics, including the bed height, flow and temperature distributions, composition of stack gases and gas emissions are obtained for the three alternatives and compared with measurements from a simple laboratory furnace. The results show that the pyrolysis kinetics mechanism can significantly affect the outputs from the waste bed model for incineration modelling. Subsequently, we propose a new coupling approach based on a recent AMG waste bed model (which includes the complex pyrolysis kinetics inside the waste bed on top of the moving grate) and the freeboard CFD simulations. The new approach is then used to predict the field performance of a large scale waste-to-energy (WTE) plant and the predictions are compared directly with the real measurements in various operational scenarios. The comparison shows an overall satisfactory agreement in terms of temperature and exit gases composition given the complexity of the real life operations, although the CO emission is slightly underpredicted.

1. Introduction

Sustainable waste management is of critical importance worldwide and particularly for the developing countries in Asia [1,2,3,4,5]. An effective tool for sustainable waste management is the incineration of solid waste through waste-to-energy (WTE) plants. A schematic diagram for a WTE plant is shown in Figure 1 (from [6]). The WTE plant can largely reduce the waste volume and alleviate the requirement for landfills and the steam turbines can also recover a major portion of the energy contained in the solid waste. At the same time, a comprehensive understanding of the physical and chemical processes for the waste incineration is essential for the engineers to properly design the incinerator to meet the strict requirements and regulations set by the government agencies.
Among the various types of solid waste incinerator nowadays, the advanced moving grate (AMG) incinerator is the most common choice. Its main components are the waste feeding system, moving grate and grate bars. When the operation begins, the solid waste is transported into the incinerator through the moving grate at the bottom. The complex processes of drying, pyrolysis, gasification and char combustion (on top of the grate) then take place in the waste bed due to the high temperature inside the incinerator, while the gaseous products and volatiles released from the solid waste are further mixed and combusted in the freeboard region above the waste bed. Experimental investigations on the combustion characteristics inside laboratory incinerators have been reported in several previous studies [7,8,9]. These experimental measurements provided important insights to improve the understanding of the mechanisms involved. However, to the best of our knowledge, field measurements inside AMG incinerators under various operational scenarios have been very rarely reported so far.
Computational simulations have been used to predict the performance of AMG incinerators for design improvement and verification. Early attempts to model the incineration process date back to at least the 1970s [10] and were based on the very limited computational resources available at that time, which were insufficient to represent the complexities involved. With continuous improvement in computational power and improved understanding of thermo-fluid dynamics and chemical reaction kinetics, recent simulations have advanced significantly [11,12,13]. However, accurate modelling of the AMG incinerator, which undergoes the complex processes of drying, pyrolysis, gasification and char combustion, is still a major challenge at present.
For industrial applications, a common approach to model the waste bed is through the one-dimensional Lagrangian approach whereby the waste bed is represented as a series of non-interfering Lagrangian elements. The changes in its mass, composition and temperature as well as the resulting gas products from these elements are tracked over time. A mathematical model was developed by [14,15] using the above approach to account for the bed volume change and various thermochemical processes. An improved radiation model was adopted by [16] that simulated the chemical reaction kinetics in detail and their model was validated by their own experimental measurements in a laboratory reactor. Mathematical modeling was carried out by [17] of grate-fired boilers by incorporating a standalone bed model coupled with the computational fluid dynamics (CFD) simulations for the freeboard, which included the energy equations for both the fuel and gases and accounted for the heat transfer among the multi-phases. The Lagrangian approach was extended by [18] to two-dimensional, which is beneficial potentially considering that the waste composition might be spatially non-uniform on top of the moving grate in practice. Other studies involved further improvement to incorporate additional effects such as the effects of the devolatilization rate and moisture content [9,19]. A recent research approach for the waste bed model is the particle-based approach of the discrete element method. The waste bed is represented by a large group of discrete particles undergoing the various heat and mass transfer processes with different chemical reactions. A simplified approach was developed by [20] by pre-defining the pathway of the particles, thus avoiding resolving their equation of motion. The resulting concentration of gases and momentum was then coupled to the CFD freeboard model. However, the computational time and resources required with the discrete element method are still excessive for engineering applications at present. Thus, the approach is not commonly used for industrial applications. With respect to the freeboard CFD simulations, various approaches also have been reported in previous studies using different turbulence closures and turbulence/reaction modelling methods [8,11,21,22,23,24].
The present study addresses two key issues in the computational modelling of AMG incinerators. First, the sensitivity of pyrolysis kinetics for the waste bed in influencing the computational predictions of solid waste incineration is examined. In particular, three existing alternatives proposed in the literature are compared in a setting of a simple laboratory furnace [16,25,26]. The results show that both the temperature and gas emissions from the furnace are sensitive to pyrolysis kinetics. Thus, they highlight the importance to select a proper waste bed model that encompasses pyrolysis kinetics accurately. Subsequently, we propose a new approach for the AMG incinerator modelling by coupling the AMG waste bed model developed recently by [27] (which includes the complex pyrolysis kinetics inside the waste bed on top of the moving grate) and the freeboard CFD simulations. The new approach is used to predict the performance of the waste-to-energy (WTE) plant of Keppel Seghers Pte Ltd. in Singapore. The study thus represents the rare reporting of the comparison between the computational predictions and field measurements from a prototype large scale WTE facility for validation.

2. Simulation Models

2.1. Freeboard Model

As discussed earlier, incineration modelling requires the coupling of a waste bed model and a freeboard CFD model. In the present study, the approach for the freeboard simulations was kept the same based on the popular software FLUENT Version 19.0. Inside the freeboard of the incinerator, the combustion gases were modeled as an ideal gas mixture and the material properties such as density, specific heat, thermal conductivity and viscosity were calculated using the ideal gas mixing law. The turbulent flows were simulated by solving the Reynolds-averaged Navier–Stokes (RANS) equations. The unknown Reynolds stress term in the RANS equation was computed with the eddy viscosity, μ t , solved by the RNG k-ε turbulence closure through two equations corresponding to turbulence kinetic energy (k) and the rate of the dissipation of turbulence energy (ε), respectively. The equations are shown below [28]:
( ρ k ) t + ( ρ k u i ) x i = x j ( α k μ e f f k x j ) + G k + G b ρ ε Y M + S k
( ρ ε ) t + ( ρ ε u i ) x i = x j ( α ε μ e f f ε x j ) + C 1 ε ε k ( G k + C 3 ε G b ) C 2 ε ρ ε 2 k R ε + S ε
where ρ is the density of the gas phase, ui is the velocity in i direction, α k and α ε are the inverse effective Prandtl numbers, G k is the turbulence kinetic energy that is generated by the mean velocity gradients, G b is turbulence kinetic energy generated by buoyancy, Y M is the contribution of fluctuating dilatation in the compressible turbulence to the dissipation rate that is normally neglected in the modeling of incompressible flows, S k and S ε are the source terms that can be determined by the user, μ e f f is the effective viscosity calculated by RNG theory, R ε is the additional correction term and C 1 ε and C 2 ε   are the standard closure constants. Compared with the standard k-ε closure, the RNG k-ε closure included the effect of swirl on the turbulence modelling. Meanwhile, the additional terms in the ε equation improved the accuracy for simulating rapidly strained flows.
Chemical reactions of the gas phase were modeled in the freeboard CFD simulations by using the species transport eddy-dissipation model for the turbulence-chemistry interactions. By doing so, detailed Arrhenius chemical kinetic calculations were avoided to save on the computational time. The methane–air two-step chemical reaction mechanism was applied with CO as the intermediate species as shown below:
CH 4 + 3 2 O 2   CO   + 2 H 2 O
CO + 1 2 O 2   CO 2
H 2 + 1 2 O 2   H 2 O .
The reaction rate in the eddy-dissipation model [29] is given as:
R i , r = ν i , r M w , i A ρ ε k m i n ( Y R ν R , r M w , R )
where R i , r is the rate of the production of species i due to the reaction r, ν i , r is the stoichiometric coefficient for the reactant i in reaction r, M w , i is the molecular weight of species I, M w , R is the molecular weight of species R, ρ is the local density, A is empirical constant with its default value equal to 4.0, YR is the mass fraction of a particular reactant, ν R , r is stoichiometric coefficient for product species R in reaction r and k and ε are the turbulence kinetic energy and dissipation rate of turbulence energy, respectively. Thus, the term ε k represents the inverse of the large-eddy mixing time scale. In premixed turbulent flames, the rate of combustion is determined by the local fire spread. Therefore, an extra equation for the dissipation of hot eddies is necessary in cases whereby the concentration of hot combustion products is low. The additional equation [29] is shown as follows:
R i , r = ν i , r M w , i A B ρ ε k P Y P j N ν j , r M w , j
where B is the empirical constant that is equal to 0.5, Yp is the mass fraction of any product species P, ν j , r is the stoichiometric coefficient for product j in reaction r and M w , j is the molecular weight of species j. In the eddy-dissipation model, the actual net rate of the production of species i due to reaction r,   R i , r , is given by the smaller value from Equations (6) and (7). Note that Equation (7) is designed for premixed cases, only the value of A affected the reaction rate in the present diffusion flame case.
Radiation heat transfer needs to be considered when the radiant heat flux, Q r a d i a t i o n ( Q r a d i a t i o n = σ ( T m a x 4 T m i n 4 ) ), is large compared with the heat transfer rate due to convection or conduction. Considering the intermediate optical thickness in the combustion case, the P-1 radiation model [30] was adopted in the present case with its equation shown as follows:
q r = Γ Δ G
where Γ = 1 3 ( a + σ s ) C σ s , a is the absorption coefficient, σ s is the scattering coefficient and C is the linear-anisotropic phase function coefficient. The transport equation for G is shown as follows:
. ( Γ G ) a G + 4 a n 2 σ T 4 = S G .
Here, n is the refractive index of the medium, σ is the Stefan–Boltzmann constant and SG is a user-defined radiation source.

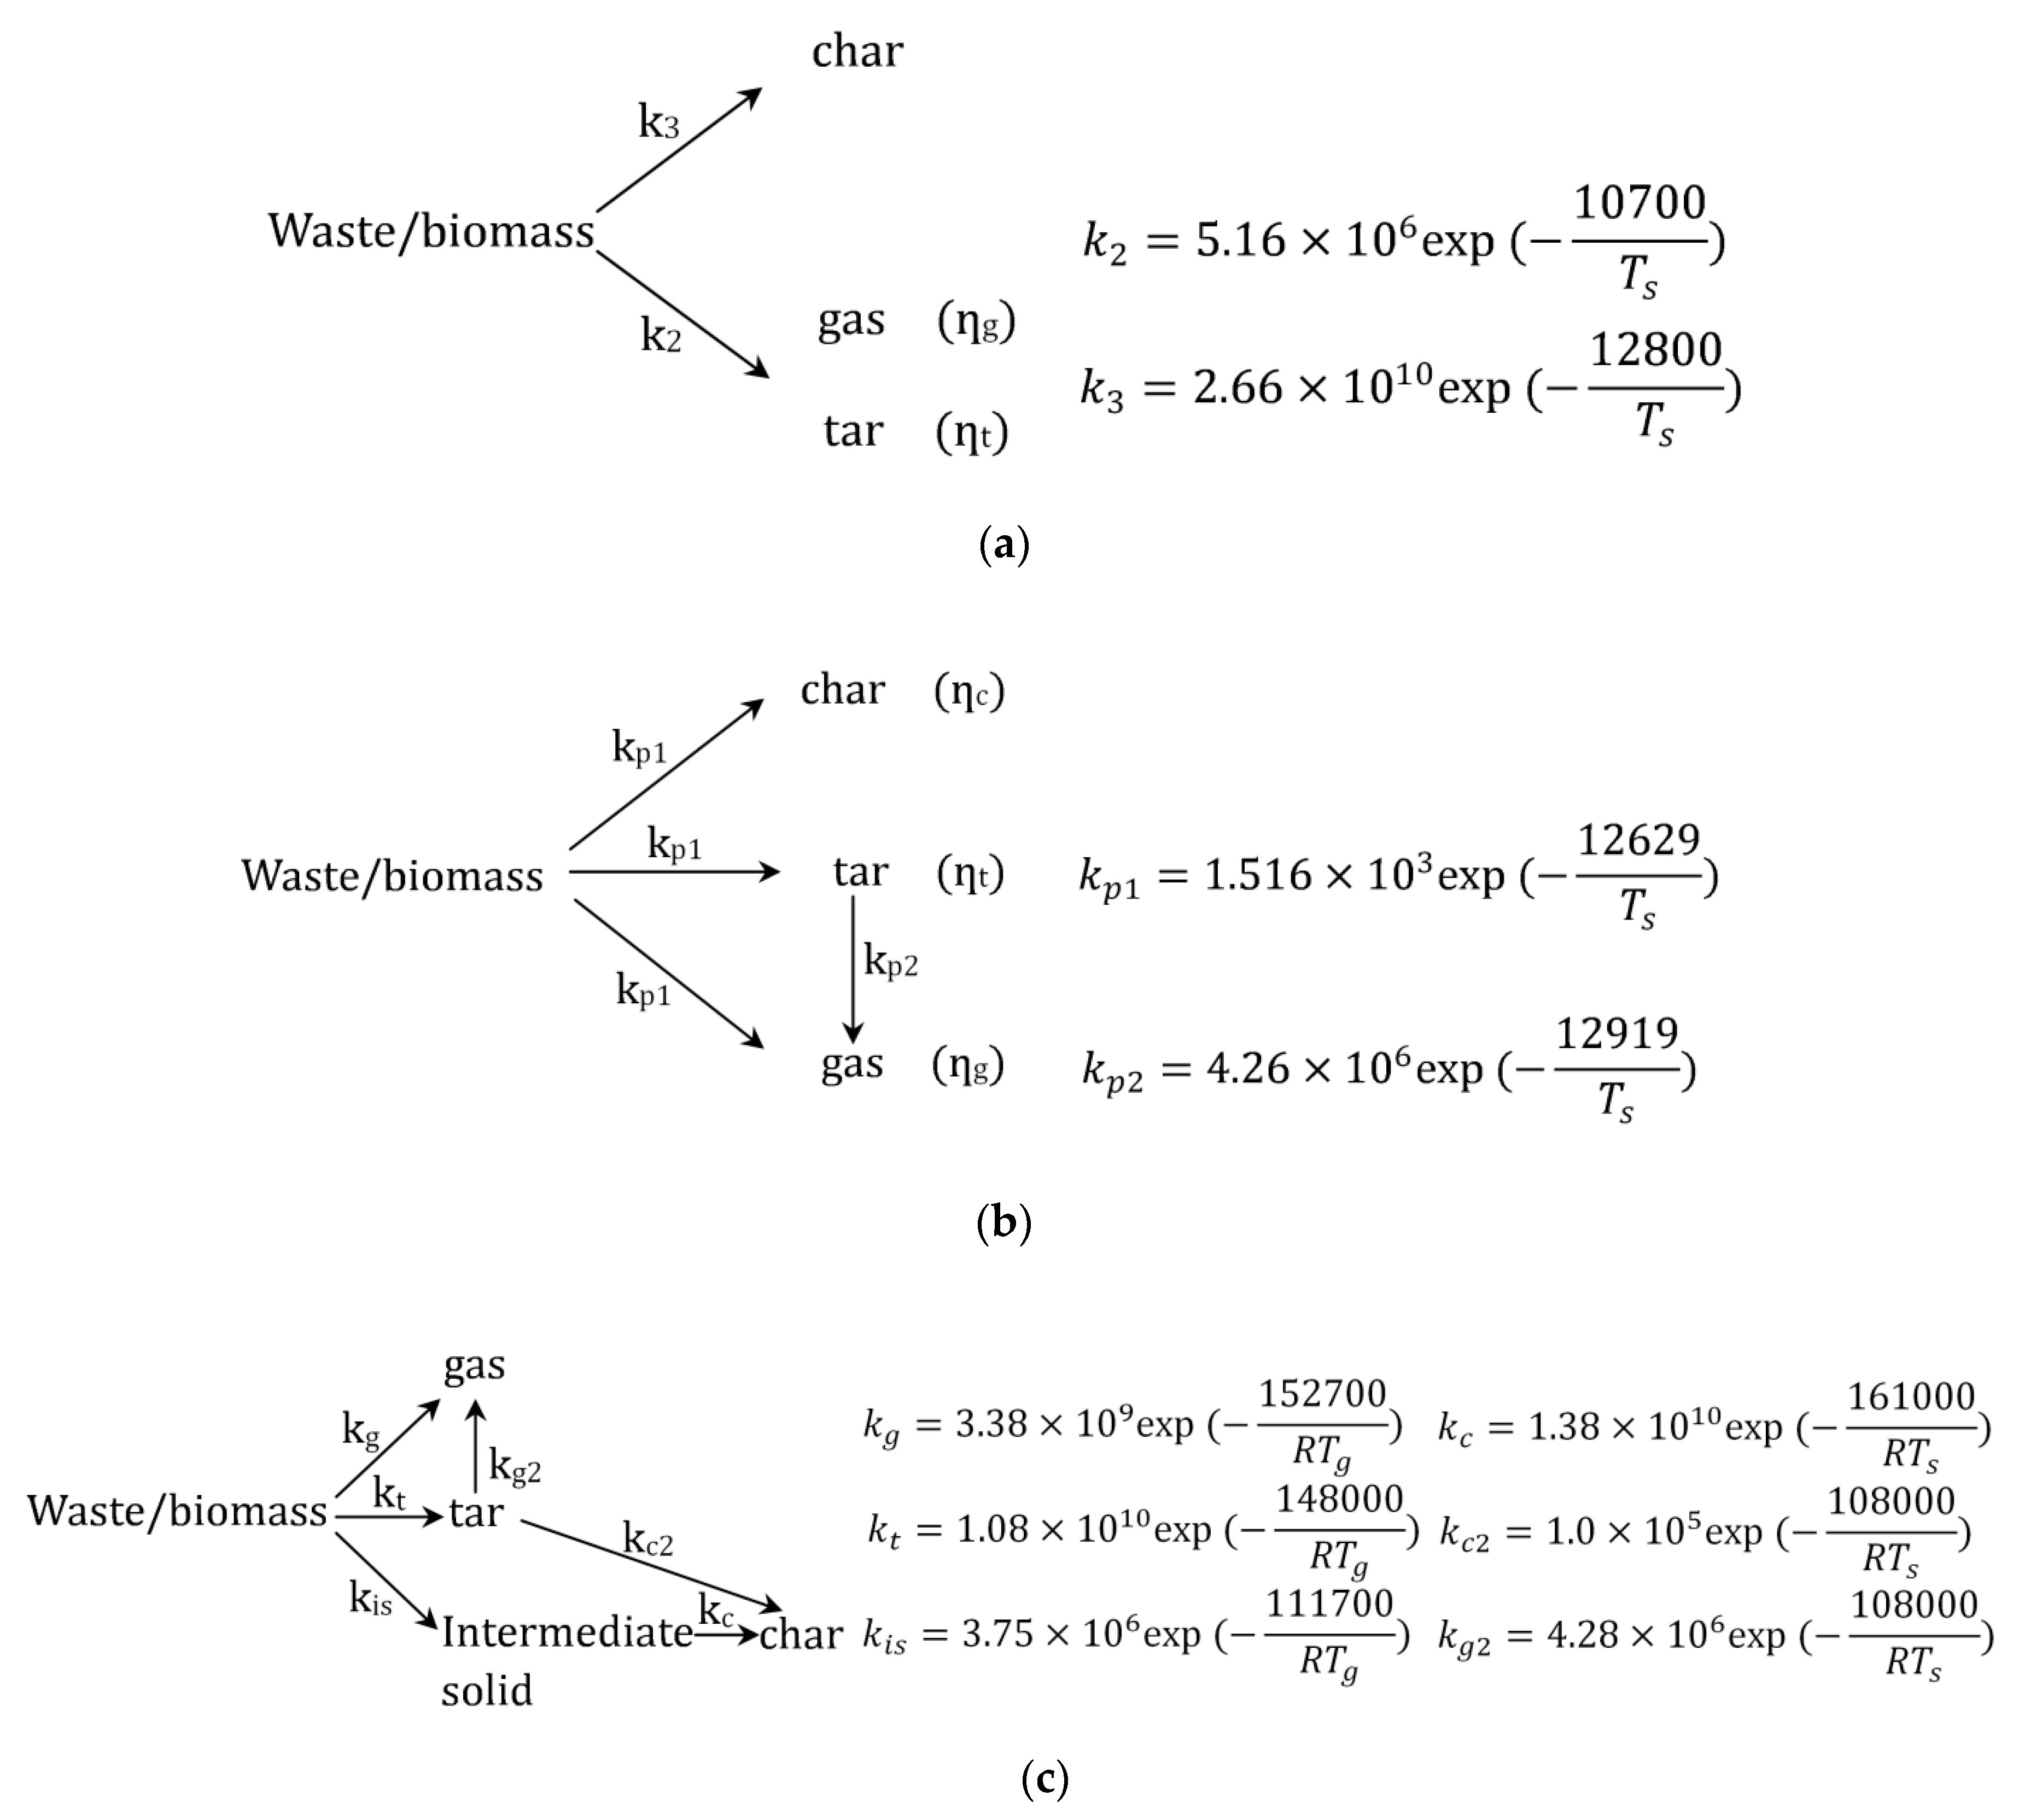
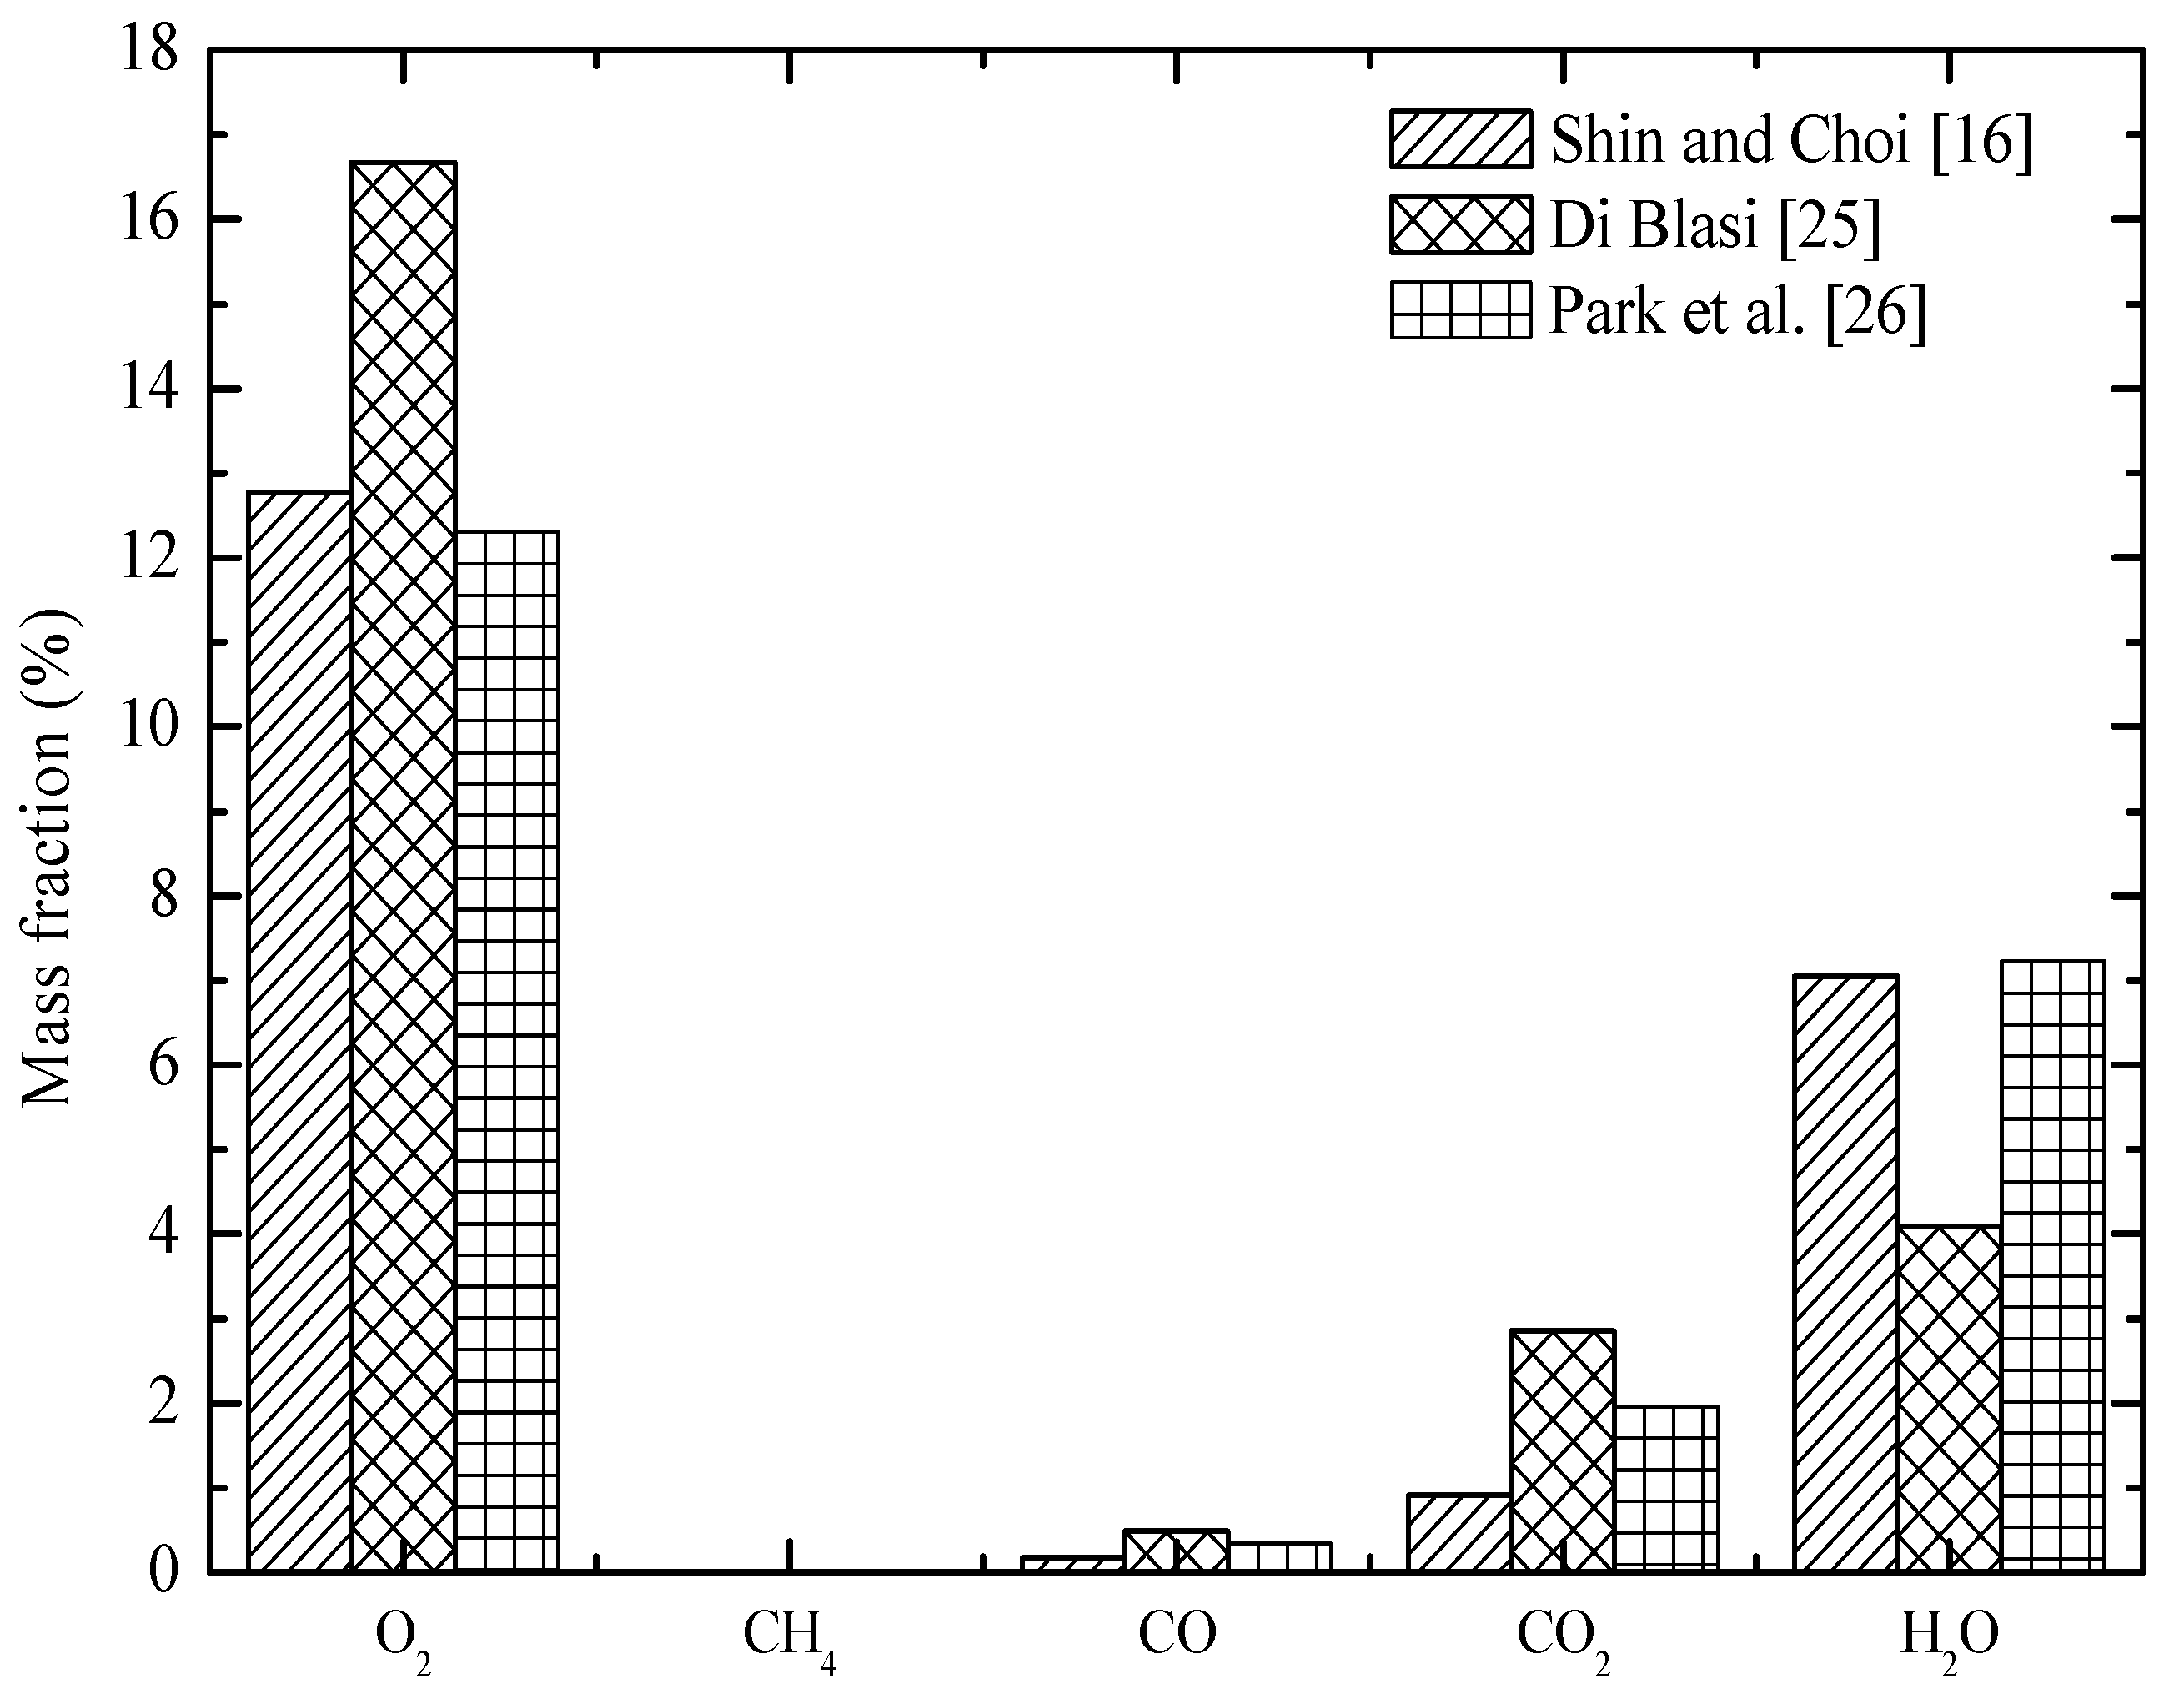
2.2. Pyrolysis Mechanisms

In this study, three different alternatives of pyrolysis mechanisms reported in the literature [16,25,26] were first examined in a simple laboratory furnace [31] to investigate the sensitivity of pyrolysis kinetics to the predictions by the waste bed model. The brief details of the three alternatives are shown in Figure 2.
Figure 3a,b shows the geometry and computational mesh of the simple laboratory furnace from [31], respectively. The dimensions of the furnace were 10 m (tall) × 5 m (long) × 3 m (wide). The waste composition was wood pieces piled up to 0.45 m in the combustion chamber with a density of 800 kg/m3. The moisture content was 10%. The primary air supply with ambient temperature was discharged through five primary air (PA) zones at the bottom. The total flow rate was determined to be 5.88 m3/s. The flow rates of the front, rear and over-fired air were 2.75, 2.75 and 1.13 m3/s, respectively. The under-grate temperature was set at the ambient temperature of 300 K with the ambient air composition of O2 = 23% and N2 = 77%. Using the pyrolysis kinetics mechanism of the three different alternatives, the transient changes in the average bed height and solid and gas composition were computed as shown in Figure 3c–h.
From Figure 3c–e, it can be observed that the predictions of the transient changes in the bed height were similar between [16,26]. The bed height started to decrease about 3 min after the incineration began. From t = 3 to 45 min, the predicted bed height decreased almost linearly. The measured bed height (shown in red dots in the figures) also decreased linearly but with a much faster rate and values became lower than the predicted after t > 35 min. The differences could be attributed to the fact that the reaction for the char oxidation (the reduction in bed mass) was not produced well in the two alternatives. In comparison, the results from [25] were much different from the other two; the predicted bed height decreased almost linearly with a constant rate, and the bed height decreased to less than 0.15m before t = 15 min.
Figure 3f–h shows the average concentration of gas, tar and water vapor in the waste bed over time. The results from the pyrolysis mechanisms of [16,26] were close to each other with the concentration of water vapor kept at 0.16 kg/m3 from 3 to 40 min and decreased to zero at the end of the combustion. The concentration of tar increased to 0.05–0.07 kg/m3 at t = 3 min and decreased to 0.01 kg/m3 at t = 60 min. The concentration of gases from [26] gradually increased to 0.05 kg/m3 at t = 40 min and started to decrease afterwards and the concentration dropped to 0.02 kg/m3 at t = 60 min. The gas concentration from [16] kept decreasing from t = 3 to 40 min and dropped rapidly afterwards with the concentration dropping to 0.01 kg/m3 at t = 60 min. However, the results from [25] were much different from the other two; the concentration of gas, tar and water vapor were higher at t = 4 min but dropped much faster afterwards, e.g., the concentration of tar and gas decreased to less than 0.1 kg/m3 after 10 min.
Figure 4a shows the flow pattern and velocity distribution inside the laboratory furnace based on the three different alternatives of pyrolysis mechanism. The predictions were close to each other, indicating the limited influence of the pyrolysis mechanism on the flow characteristics in the freeboard. The velocity magnitudes were also similar. The average velocity magnitudes inside the furnace were 2.3 m/s, 2.3 m/s and 2.2 m/s with the pyrolysis mechanism of [16,25,26], respectively. Compared with the flue gases from the grate, the high speed secondary air jets had a much larger influence on the flow pattern. Higher velocity jet flows could be observed at the secondary air inlet, which caused the redistribution of the surrounding flow field.
The temperature contours inside the furnace shown in Figure 4b illustrated a strong dependence on the pyrolysis mechanism. In the combustion region, the temperatures from [26] were generally higher than that of [16,25] with the maximum temperature around 1300 K in the rear region (above zone 5). The results were consistent with the observations from Figure 4c,d that [26] yielded more gas products and thus the combustion of these gases increased the temperature in the combustion region. Above the combustion region, [25] yielded the maximum temperature that was about 900 K. The higher temperature from [25] may be attributed to the weak flow inside the furnace due to a lesser amount of flue gases released from the waste bed, which slowed down the dissipation of the internal heat. The mass fraction contours of different gas compositions also corroborated with the temperature distributions. The concentration of CH4 predicted by [26] was higher but the corresponding mass fraction of O2 was relatively low, i.e., the oxygen had been exhausted by the combustion of methane. The additional heat generated by the methane combustion raised the temperature inside the furnace. In general, the observation showed that the flue gases from the waste bed increased the temperature in the combustion region.
The gas emissions from the waste bed with the three different pyrolysis mechanisms are shown in Figure 5. The mass fraction of O2 from [25] was the highest (16.8%), indicating that the flue gases generated from the waste bed were predicted to be insufficient to consume the oxygen in the furnace. On the contrary, the low oxygen mass fraction and the high concentration of CO2 and water vapor from [26] implied the prediction of full combustion of the combustible gas products from the waste bed.
Overall, the above results highlighted that the gas composition and temperature distribution inside the incinerator could be affected significantly by the pyrolysis kinetics mechanism. Therefore, it can be concluded that an accurate representation of the pyrolysis mechanism for the waste bed is essential for computational incineration modelling and particularly for the design verification of AMG incinerators.

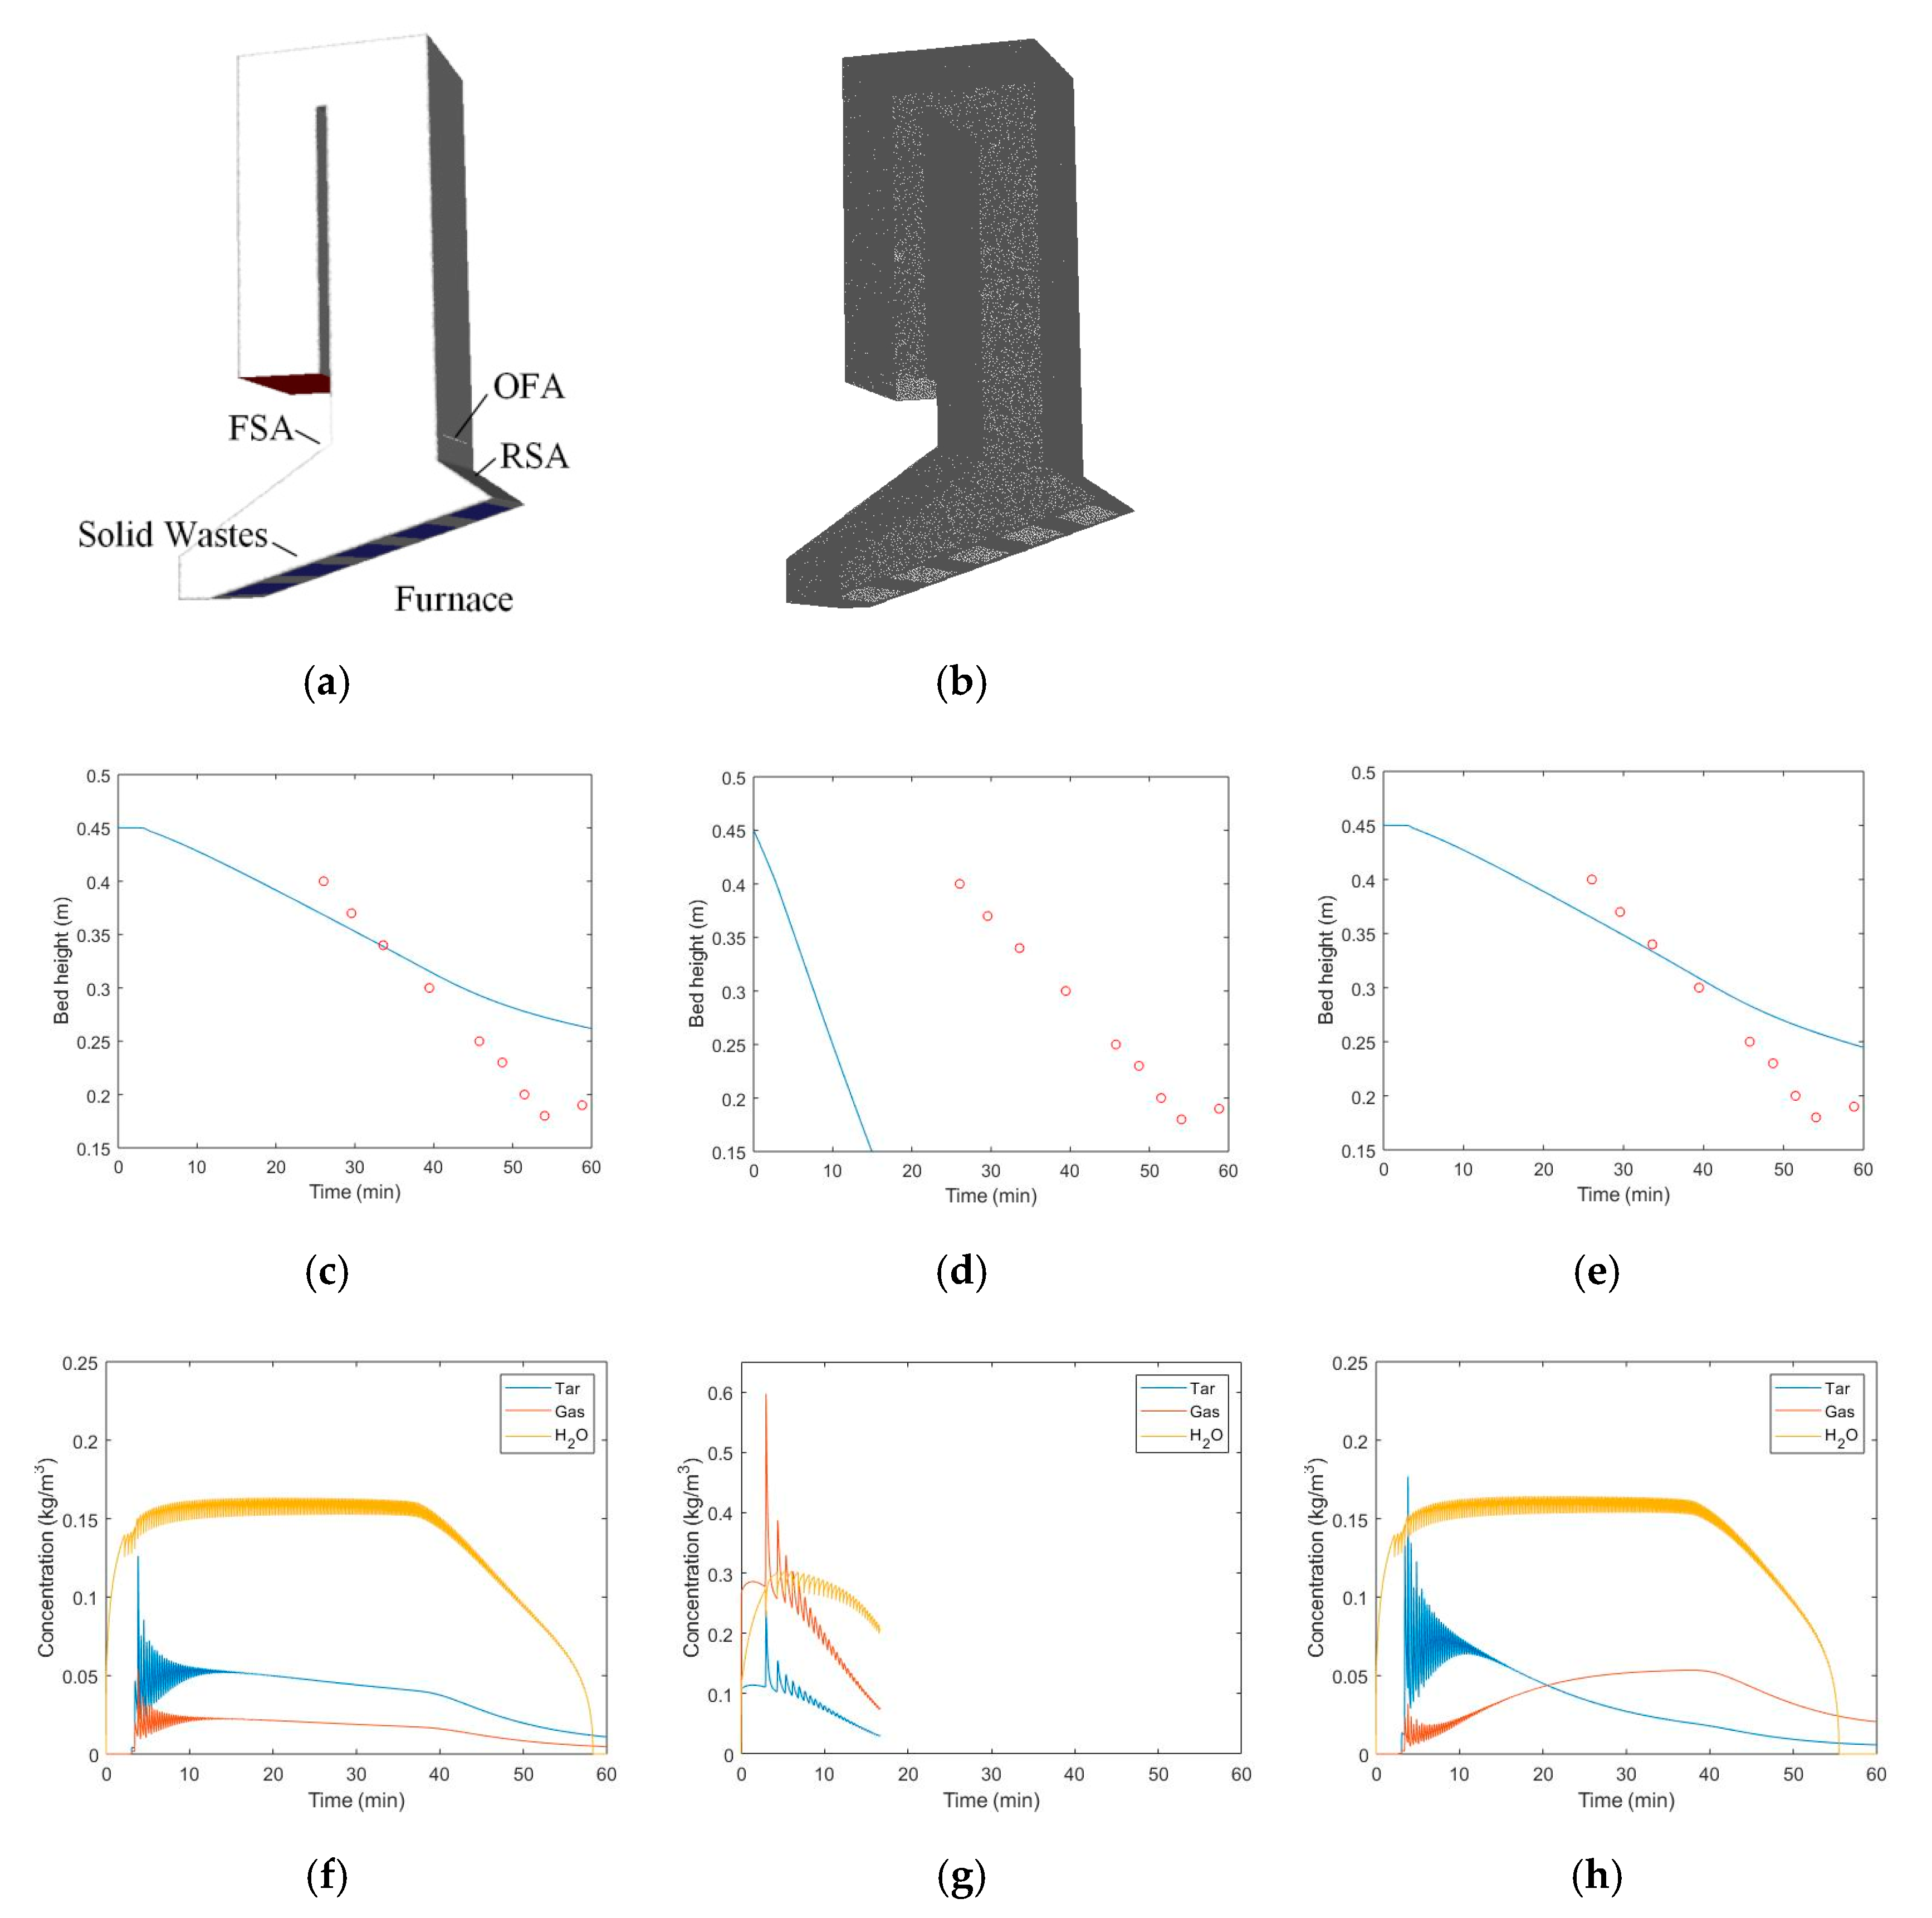
3. A New Coupling Approach

In this study, we propose a new coupling approach for the computational modelling of AMG incinerators by coupling the waste bed model of [27] (which introduced an original approach to represent the complex pyrolysis kinetics inside the waste bed on top of the moving grate) with the freeboard CFD simulations. The new coupling approach has not been attempted for AMG incinerators so far. We shall describe the details in the following sections.
The Lagrangian finite-volume method was adopted by [27] in which the waste bed was considered as an array of waste columns. The individual control volume thus consisted of the combination of both solid and gas phases. The gas phase composition inside the control volume varied over time because of the conversion from the solid phase as well as the subsequent chemical reactions among the gases. The temperature of the solid and gas phases, i.e., Ts and Tg, respectively, were calculated from the heat transfer by conduction, chemical reactions and heat exchange between the two phases. The distribution of the temperature and gas composition on top of the moving grate was obtained by tracking the movement of the volume along the moving grate direction. Hence, the one-dimensional unsteady or transient analysis could be translated to the equivalent quasi-steady analysis.
Drying, pyrolysis and char oxidation processes were considered in the transient changes of the waste mass in [27]. The changing waste mass is expressed by the following equation:
d M d t = d ( M m o i s t u r e +   M w a s t e   +   M c h a r ) d t   .
The change in moisture content is represented using the Lewis semi-empirical model [18]:
d M m o i s t u r e d t = K d r y M m o i s t u r e 0 e x p ( K d r y t )
where M m o i s t u r e 0 is the initial moisture content and kdry is the kinetic constant.
In [27], the volatile products were assumed to be composed of gases and tar and the percentage mass fractions were assumed to approximately 0.3 and 0.7, respectively [19]. The gases consisted of carbon dioxide, carbon monoxide and methane with their mass fraction assumed to be 0.65, 0.3 and 0.05, respectively. The details of the reaction rates for devolatilization k1 and char formation k2 can be found in [27].
Char also underwent oxidization to become carbon monoxide and carbon dioxide [19] with the following reaction:
C + 1 θ O 2   2 ( 1 1 θ ) CO   + ( 2 θ 1 ) CO 2
( reaction   rate :   d M c h a r d t = M c h a r K 3 P O 2 ,   Δ H   =   111   kJ / mol )
where θ is the stoichiometric ratio for char combustion, which relates to the ratio of CO to CO2. P O 2 is the partial pressure of oxygen in the gas phase and k3 is the kinetic constant. The gases and tar produced in the process reacted with oxygen at the top of the waste bed. The homogeneous reactions and the corresponding heat of reactions among the gases were:
CH 4 + 3 2 O 2   CO 2   + 2 H 2 O
( reaction   rate :   dC CH 4 dt = K CH 4 C CH 4 0.7 C O 2 0.8 ,   Δ H   =   520   kJ / mol )
CO + 3 2 O 2   CO 2
( reaction   rate :   dC CO dt = K CO C CO C O 2 0.5 ,   Δ H   =   284   kJ / mol )
CH 1.84 O 0.96 + 0.48 O 2   CO + 0.92 H 2 O  
( reaction   rate :   dC CH 1.84 O 0.96 dt = K CH 1.84 O 0.96 C CH 1.84 O 0.96 0.5 C O 2 ,   Δ H   =   + 42   kJ / mol )
where K C H 4 , K C O and K C H 1.84 O 0.96 are kinetic constants and C C H 4 , C O 2 , C C O and C C H 1.84 O 0.96 are gases and tar concentrations in mol/m3. Detail values for the above constants can also be found in [27].
The temperature distribution of the solid phase within the waste bed column was predicted by the energy equation as follows:
ρ S c S T s t = z ( k e f f T s z ) + h S ( T s T s ) + Q m o i s t u r e + Q p y r o l y s i s + Q c h a r
where ρ S is the density of the waste. cs is the heat capacity of the waste bed, which is calculated based on the weighted mean cp of the composing materials. Ts is the waste bed temperature, Tg is the gas temperature, h = (Nukair/d) is the gas–solid heat transfer coefficient (Nu is the Nusselt number, kair is the thermal conductivity of air, d is the particle diameter), S is the surface area of the control volume, Keff is the effective thermal conductivity of the solid phase accounts for both the radiative conductivity and the thermal conductivity and Qmoisture and Qchar (Q = Δ H d M d t ) are the heat sources from drying and char combustion, respectively.
The energy equation for the gas phase is expressed as:
ρ g c g T s t + ρ g c g v g T s z = z ( k a i r T g z ) + h S ( T s T s ) + Q d e v o l a t i l i z a t i o n +   Q g a s e s
where ρ g is the density of gas phase, cg is the heat capacity of the gases, vg is the gas velocity (primary air velocity) and Qdevolatilization and Qgases are the heat sources from devolatilization and gas homogeneous reactions, respectively.
The gases produced in the processes within the waste bed were transported by the primary air supply from the bottom of the AMG incinerator into the freeboard. The species transport is represented by the following equation:
C i t + v g C i z = z ( D a C i z ) + r i
where Ci is the concentration of gas species i, Da is the dispersion coefficient of air [19] and ri is the reaction of the individual gas species.

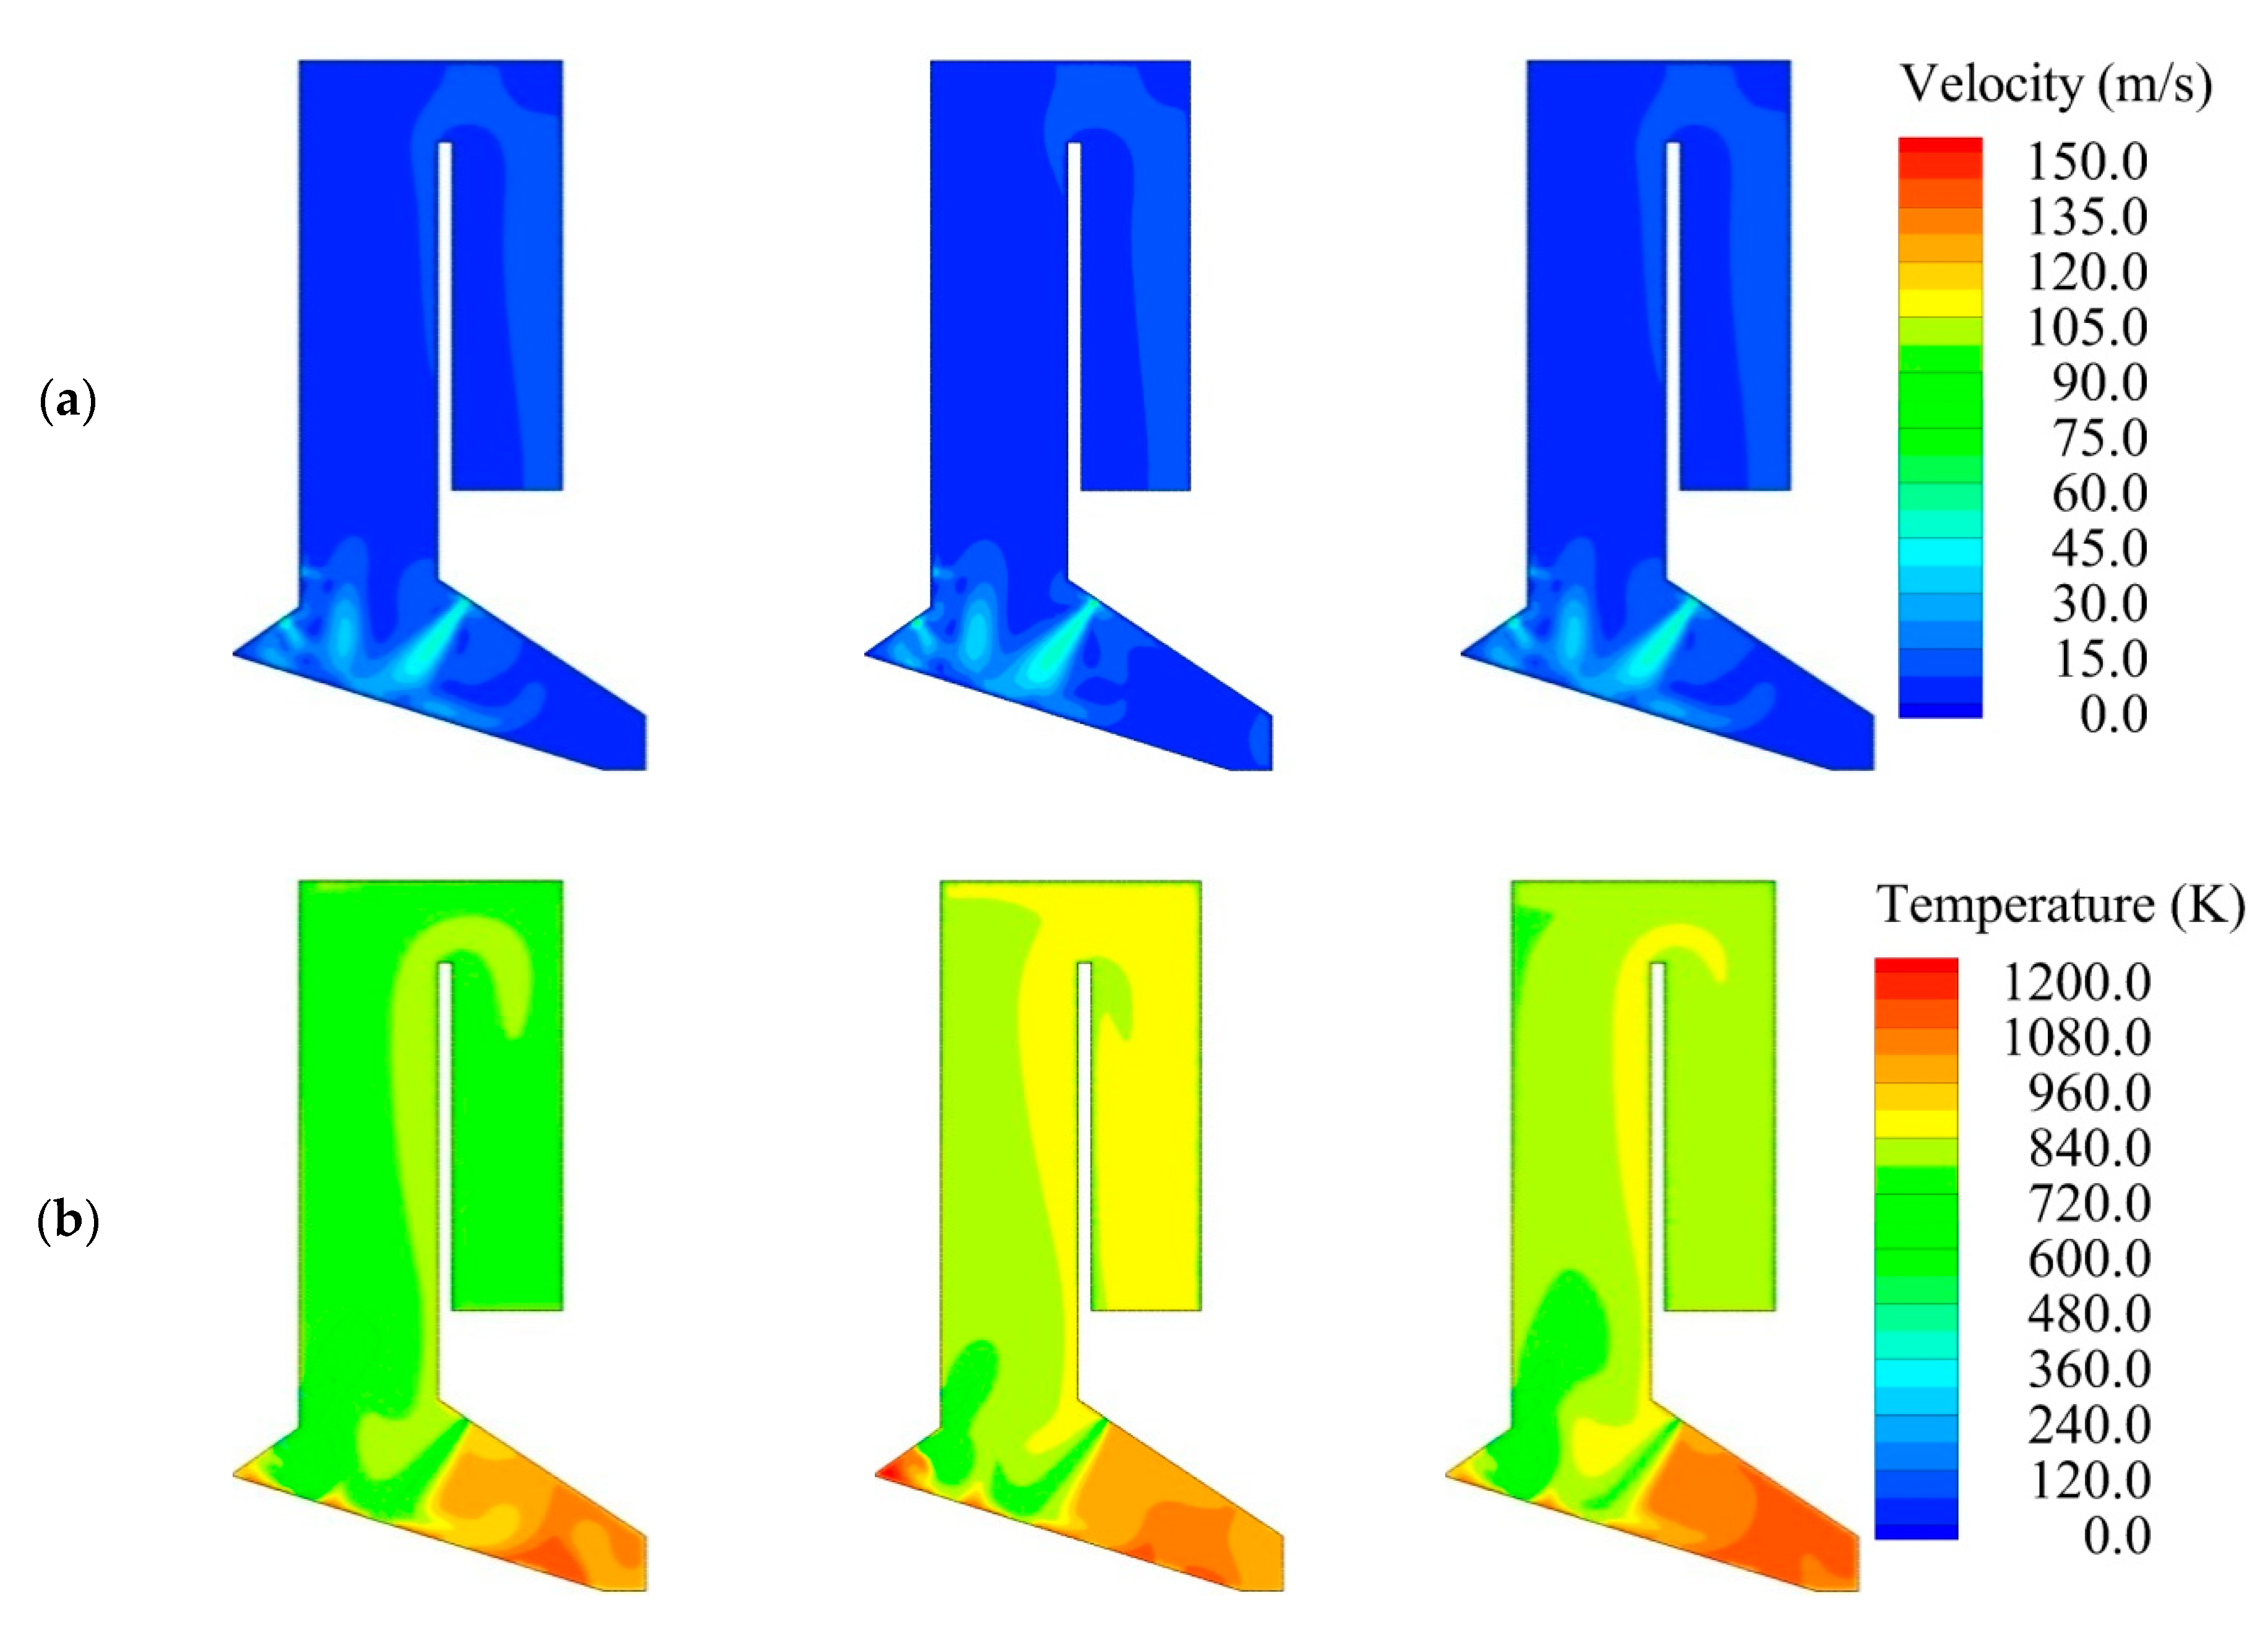
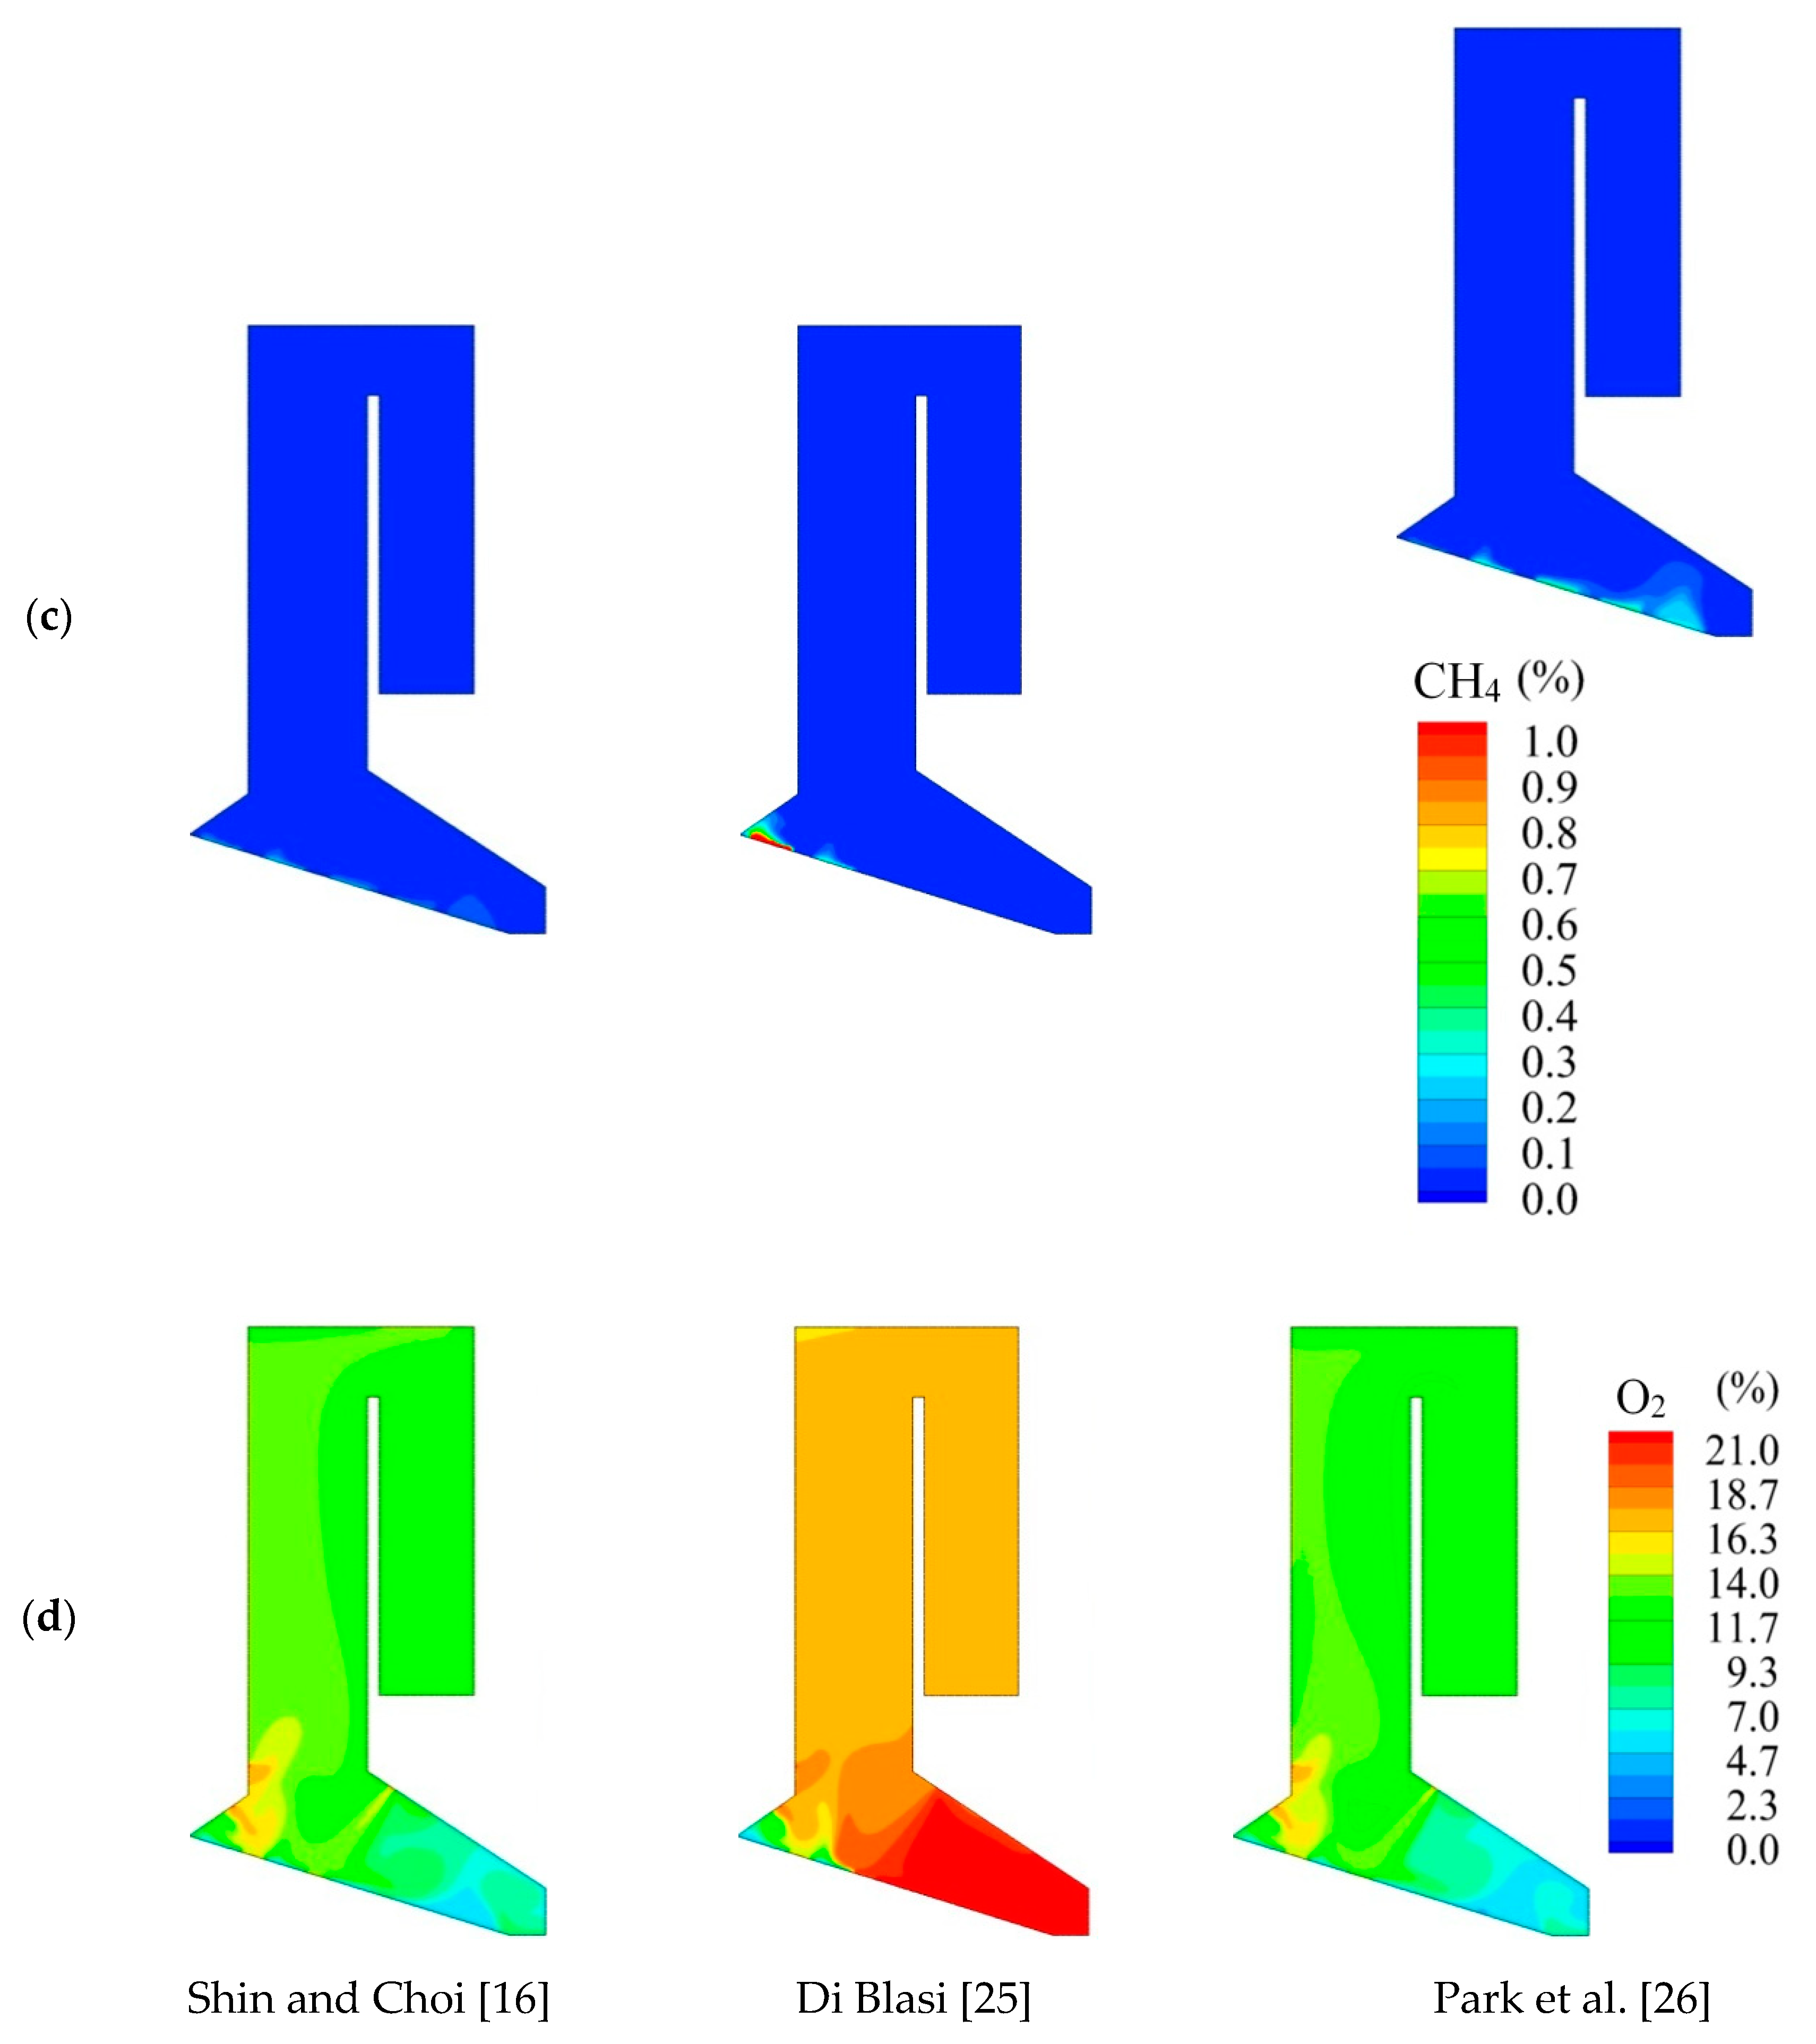
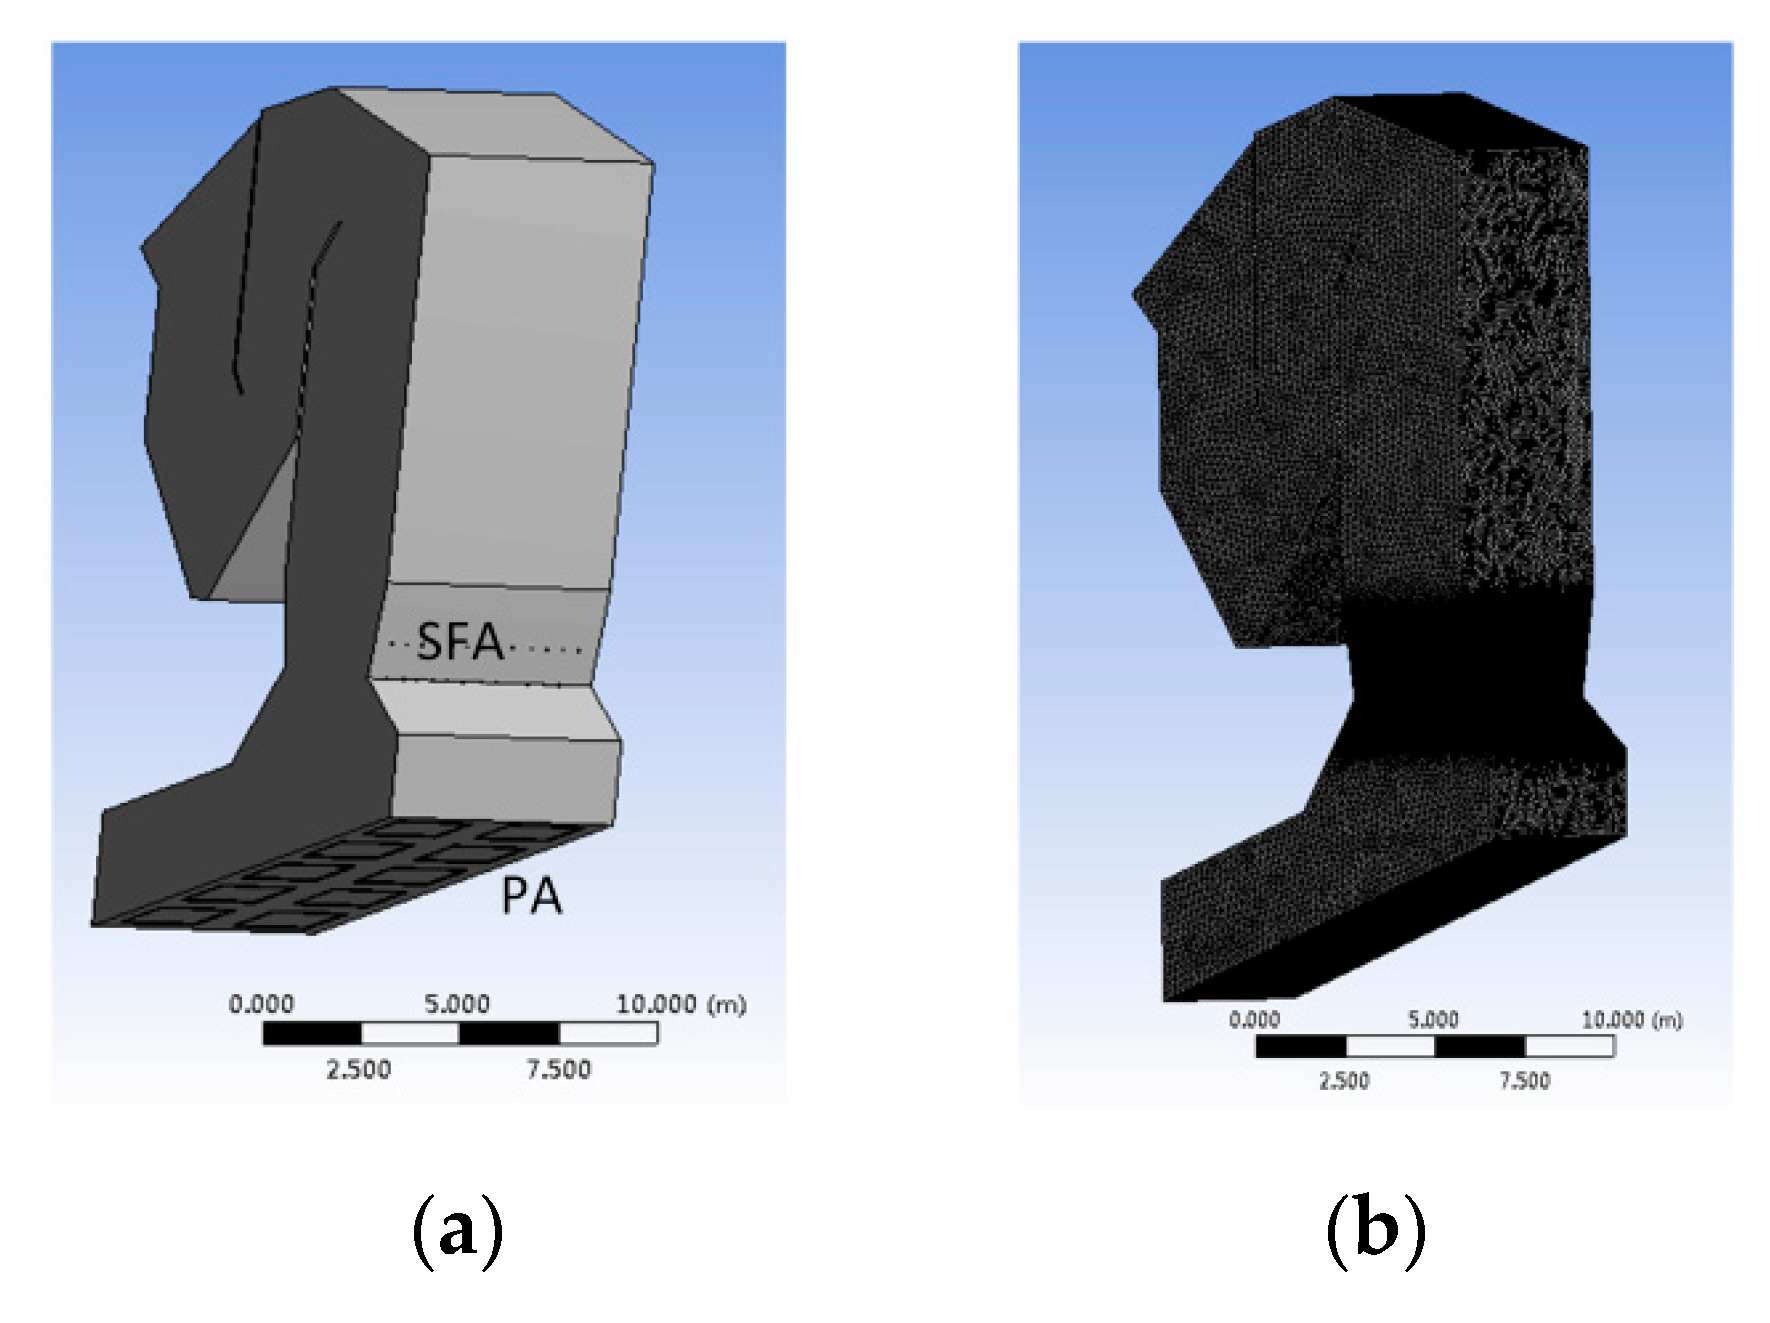
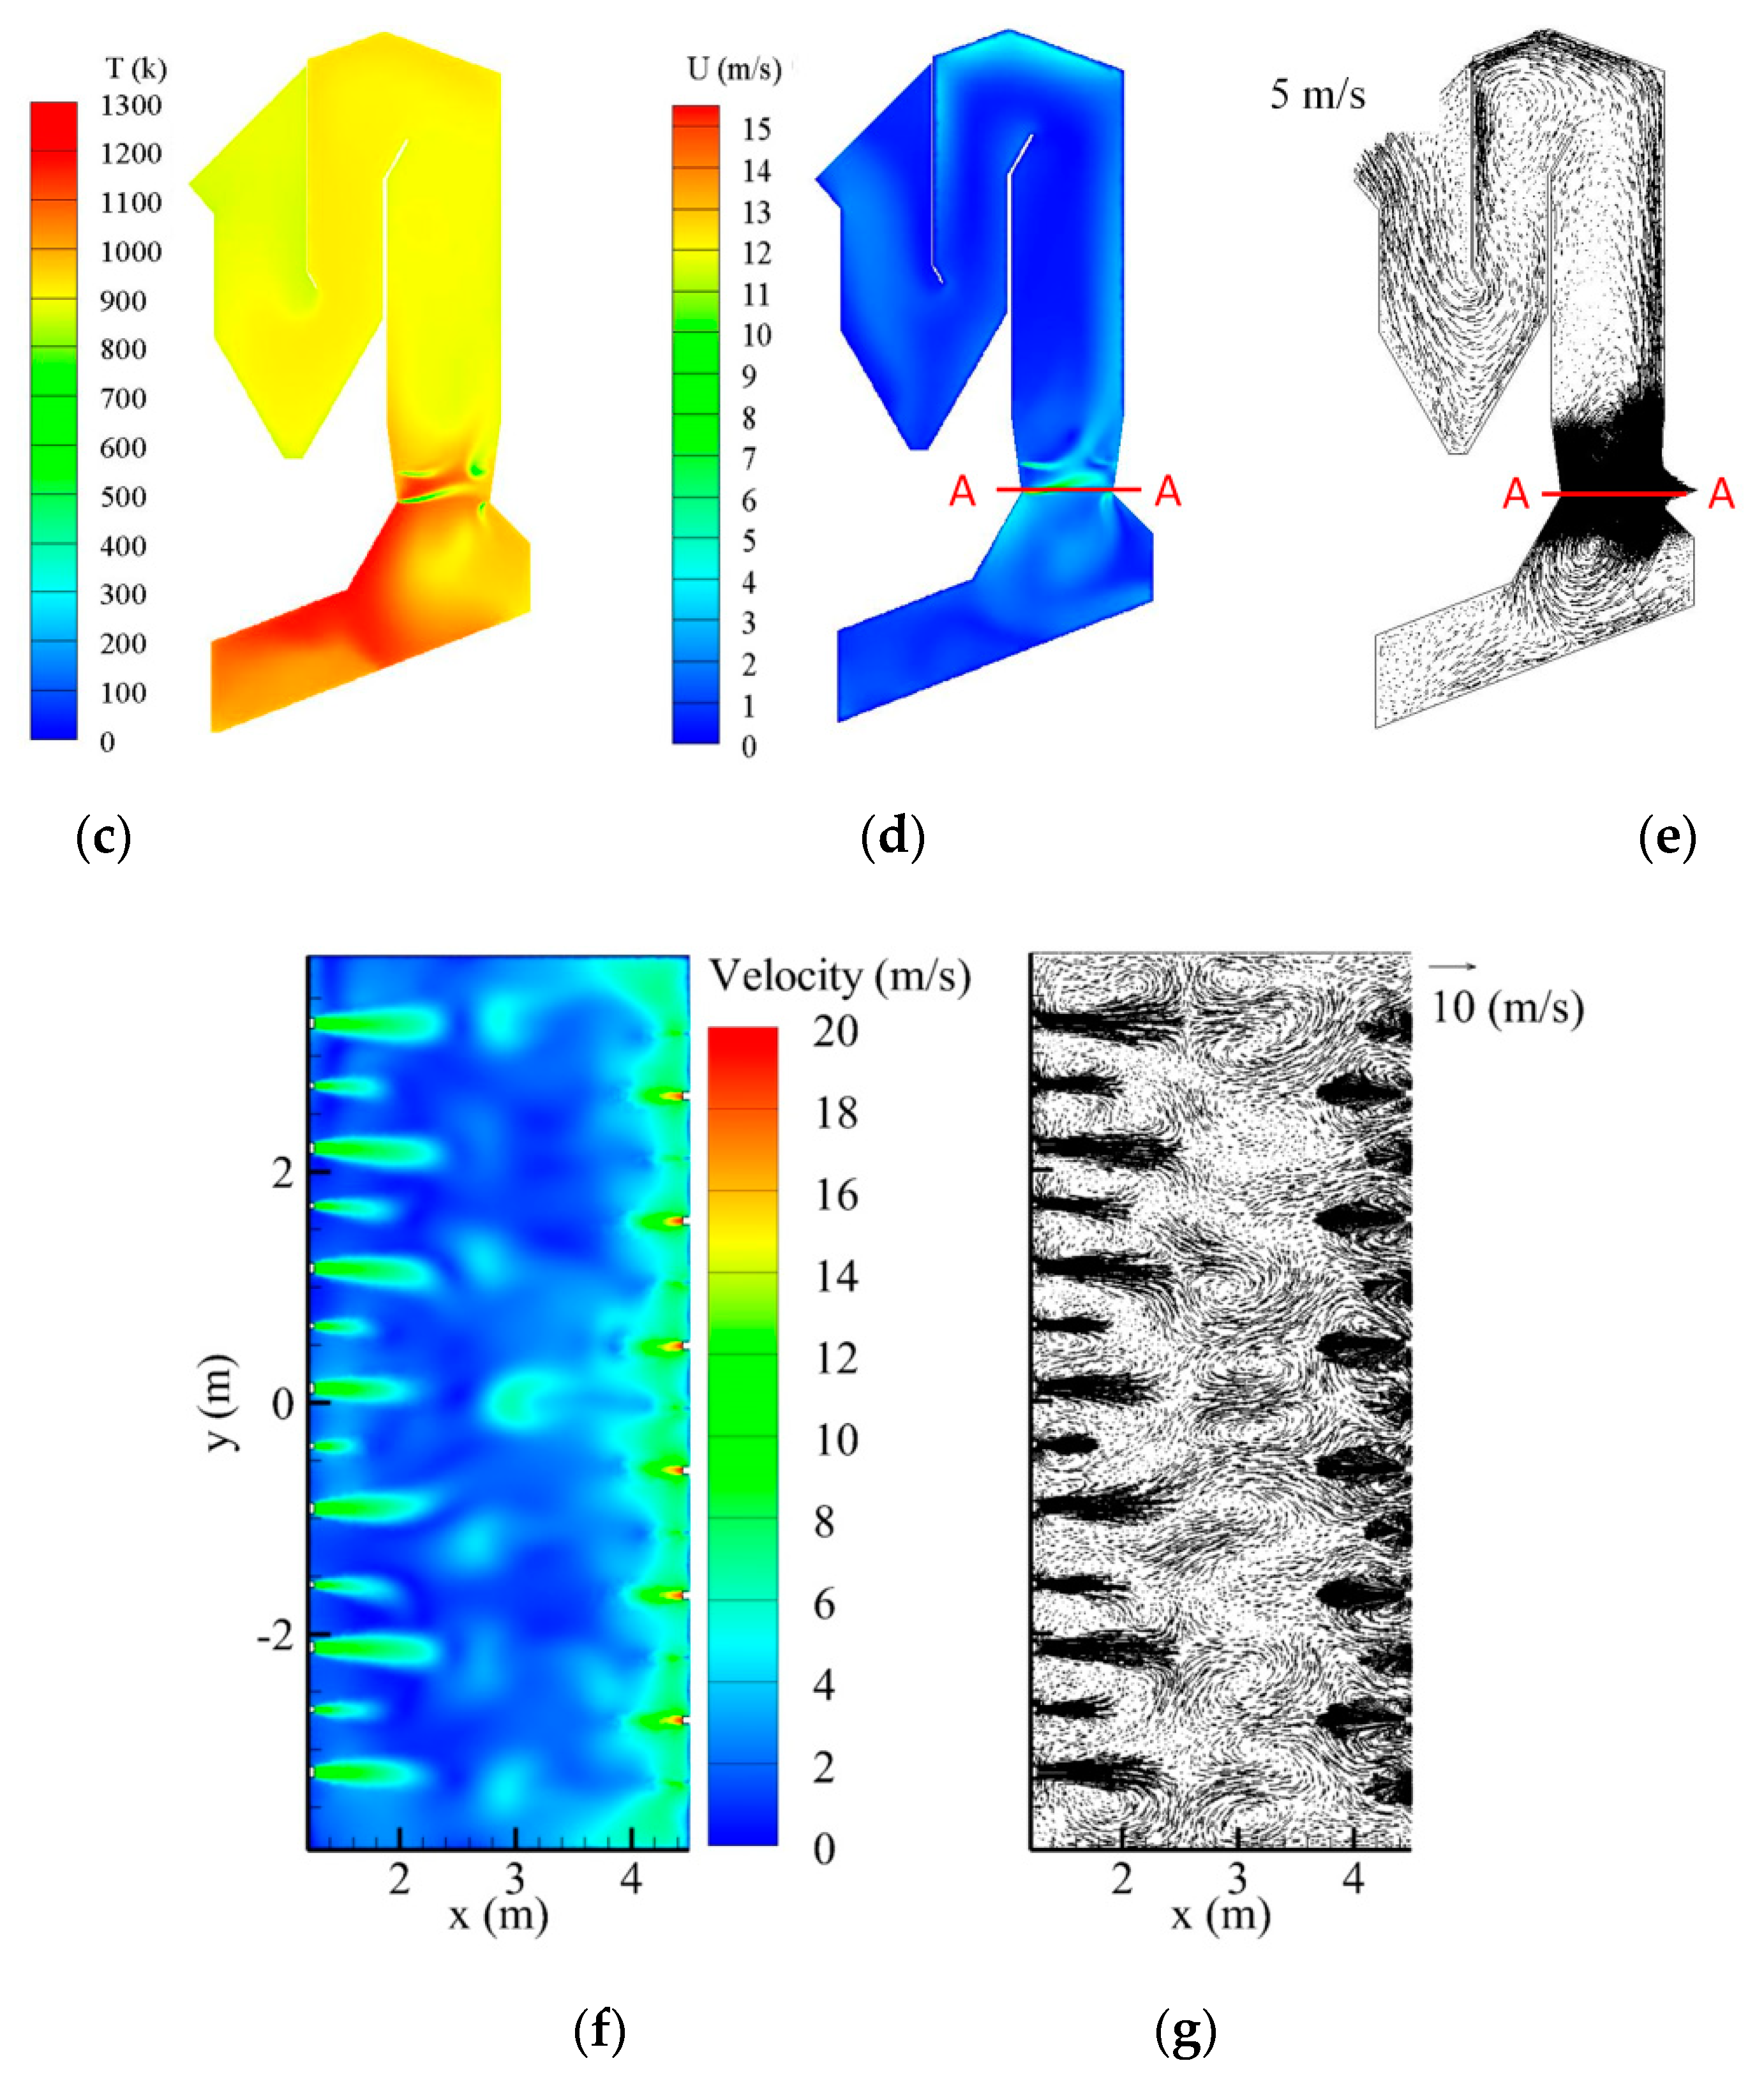
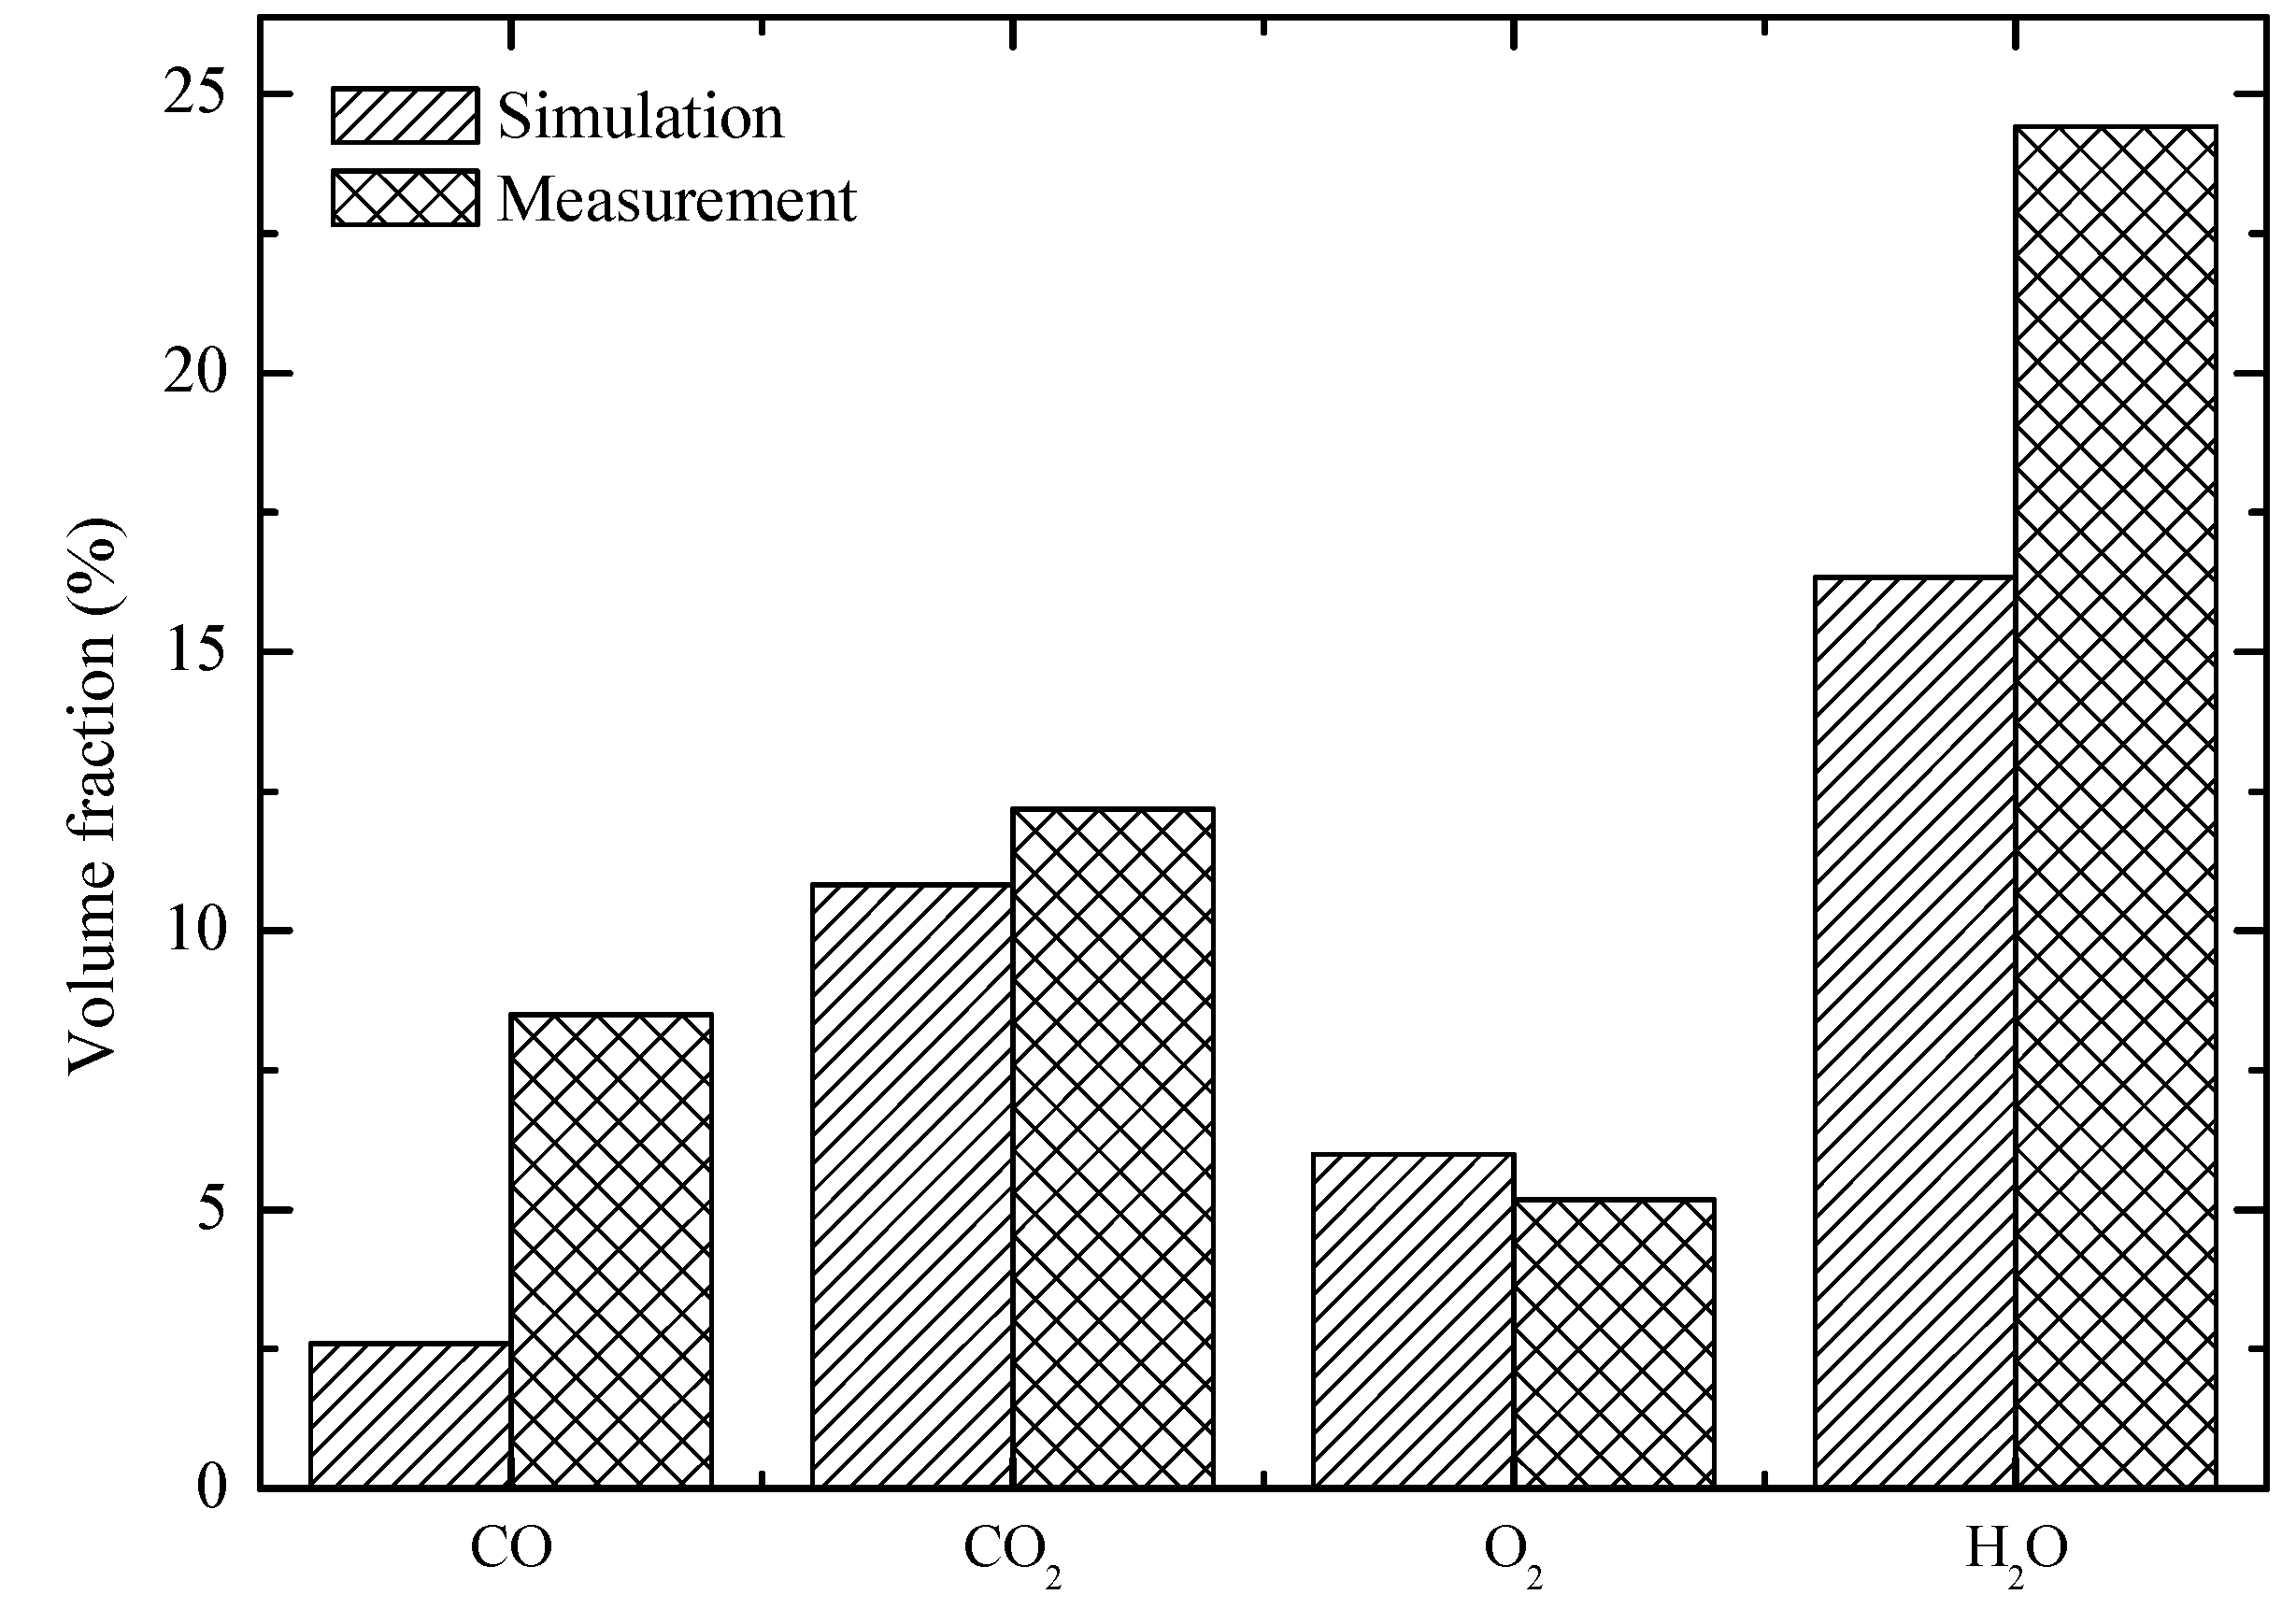
4. Predictions for a Large Scale WTE Plant

In this study, the new coupling approach was adopted to simulate a large scale WTE facility and the predictions were compared with real measurements from this facility under various operational scenarios. The geometry of the WTE incinerator is shown in Figure 6a,b. The computational domain was meshed by the ICEM-CFD and discretized into 7,959,512 unstructured cells. In the simulations, the primary air was preheated to 483 K and then discharged from 10 primary air zones (PA), while the secondary air was supplied with the temperature of 303 K to 313 K from the secondary nozzles at the front (SFA) and rear (SRA) walls. The mass flow rate for the PA, SFA and SRA were 11.9, 1.42 and 2.18 kg/s, respectively. The flow rate and temperature of the PA, SAF and SAR can be found in Table 1. The RNG k-ε closure with standard wall function was chosen for the turbulence model.
The simulations were performed using the high-performance computing cluster at the High-Performance Computing Centre at the Nanyang Technological University, Singapore. The real-time computing duration required was ~10 h with 32 CPU cores. The initial conditions of the waste bed model were set based on the operational condition of the WTE plant. The density of the waste was 600 kg/m3 with a moisture content of 20% and the initial waste bed height was 0.45 m. The primary under-grate airflow was 9.71 m3/s. The under-grate temperature was 483 K with the ambient air composition of O2 = 23% and N2 = 77%. The speed of the moving grate was 0.00279 m/s. Using the waste bed model from [27], the boundary conditions for the freeboard model could also be obtained as shown in Table 1.
From Figure 6c, the temperature was predicted to increase from 1110 to 1400 K due to the chemical reactions and thermal convections, which was consistent with the field measurements of ~1373 K. The combustion mainly occurred in the region between the bottom and secondary jets. The temperature near the front wall side was higher than the rear wall side.
Figure 6d–g shows both the vertical velocity distributions inside the incinerator as well as a horizontal cross-section (4.54 m away from the bottom). From the figures, the flow field was controlled mainly by the high speed secondary air jets with swirling flows formed in the intermediate area. These swirling flows in the horizontal direction enhanced the mixing, increased the residence time of the combustibles and uniformized the temperature distribution, thus creating good burnout overall. The flow field in the incinerator also indicated several small local recirculation zones observable in the vertical planes, which improved the mixing of the stack gases. We noted that the presence of small local recirculations was highly desirable in the incinerator as they increased the residence time of the combustibles in the burnout zone. However, large scale recirculations are unwanted as they can confine the main flow of combustible gases into a high speed narrow stream and shorten their residence time, leading to poor performance of the incinerator in general [32]. Therefore, the overall observations from both the horizontal and vertical cross-sections demonstrated that the incinerator was well designed. We also studied the three-dimensional pathlines of tracing particles from primary (PA) and secondary (SA) air inlets. The majority of the particles from the bottom directly passed through the combustion zone and then reached the exit of the furnace while only a small number of particles made spiral motions due to the influence of the secondary jets in the combustion zone.
Figure 7 illustrates the volume fractions of the gas emissions at the outlet. The results showed that the predictions from the simulation were close to the measurements. Considering the complexity of the waste composition and the varying operating conditions in the WTE plant, the present predictions were deemed to be satisfactory. At the same time, the volume fraction of CO was evidently lower than the field measurements, which demonstrated that further improvement in the coupling model was necessary in the future. It should be noted that the predicted temperature of the gas emission (900 °C) at the exit was much higher than the field measurement (190 °C) due to the fact that the heat exchange zone for power generation at the top of the incinerator was not included in the simulation. However, the omission of this heat exchange zone did not significantly affect the simulation inside the incinerator.

5. Conclusions

The present study had two major parts. In the first part, three different pyrolysis mechanisms reported in the literature were used to predict the incineration conditions in a simple laboratory furnace and the predictions were compared with the limited measurements reported. The comparison showed significant differences depending on the pyrolysis mechanism, which highlighted the importance of its accurate representation for incineration modelling. In the second part, a new coupling approach was proposed for the solid waste incineration modelling of complex AMG incinerators by coupling the recent waste bed model from [27] with the freeboard CFD model. The new approach was then used to predict the performance of the large scale waste-to-energy plant (WTE) of Keppel Seghers Pte Ltd. in Singapore. The simulation results showed that the high temperature region appeared in the area between the bottom and the secondary air jets with the temperature rising to 1100–1400 K, which was consistent with the field measurements. The comparison of the simulated gas emissions also generally agreed with the field measurements. Considering the complexity of the waste composition in the actual WTE plant, the present predictions were judged to be acceptable, which validated the new approach for the design verification of prototype AMG incinerators. At the same time, the CO emission was underpredicted implying that further improvement remains necessary in the future.

Author Contributions

Conceptualization, A.W.-K.L.; Methodology, M.J., A.C.H.L. and A.W.-K.L.; Formal Analysis, M.J., A.C.H.L. and A.W.-K.L.; Investigation, M.J. and A.C.H.L.; Resources, A.W.-K.L.; Data Curation, M.J. and A.C.H.L.; Writing—Original Draft Preparation, M.J., A.C.H.L. and A.W.-K.L.; Writing—Review & Editing, M.J., A.C.H.L. and A.W.-K.L.; Supervision, A.W.-K.L.; Project Administration, A.W.-K.L.; Funding Acquisition, A.W.-K.L. All authors have read and agreed to the published version of the manuscript.

Funding

This research was funded by the National Research Foundation, Prime Minister’s Office, Singapore and the National Environment Agency, Ministry of Sustainability and the Environment, Singapore under the Waste-to-Energy Competitive Research Programme (WTE CRP 1601 105). We would also like to acknowledge the support of Keppel Seghers Pte Ltd. who provided the field data for this research project.

Conflicts of Interest

The authors declare no conflict of interest.

References

  1. Hettiarachchi, H.; Ryu, S.; Caucci, S.; Silva, R. Municipal Solid Waste Management in Latin America and the Caribbean: Issues and Potential Solutions from the Governance Perspective. Recycling 2018, 3, 19. [Google Scholar] [CrossRef] [Green Version]
  2. Kim, J.; Jeong, S. Economic and Environmental Cost Analysis of Incineration and Recovery Alternatives for Flammable Industrial Waste: The Case of South Korea. Sustainability 2017, 9, 1638. [Google Scholar]
  3. Schneider, P.; Anh, L.H.; Wagner, J.; Reichenbach, J.; Hebner, J. Solid Waste Management in Ho Chi Minh City, Vietnam: Moving towards a Circular Economy? Sustainability 2017, 9, 286. [Google Scholar] [CrossRef] [Green Version]
  4. Siddiqi, M.M.; Naseer, M.N.; Abdul Wahab, Y.; Hamizi, N.A.; Badruddin, I.A.; Chowdhury, Z.Z.; Akbarzadeh, O.; Johan, M.R.; Khan, T.M.Y.; Kamangar, S. Evaluation of Municipal Solid Wastes Based Energy Potential in Urban Pakistan. Processes 2019, 7, 848. [Google Scholar] [CrossRef] [Green Version]
  5. Sikalidis, A.; Emmanouil, C. Description and Economic Evaluation of a Zero-Waste Mortar-Producing Process for Municipal Solid Waste Management in Greece. J. Open Innov. Technol. Mark. Complex. 2019, 5, 46. [Google Scholar] [CrossRef] [Green Version]
  6. Lam, C.H.K.; Ip, A.W.M.; Barford, J.P.; McKay, G. Use of Incineration MSW Ash: A Review. Sustainability 2010, 2, 1943–1968. [Google Scholar] [CrossRef] [Green Version]
  7. Hunsinger, H.; Jay, K.; Vehlow, J.; Seifert, H. Investigations on the combustion of various waste fractions inside a grate furnace. In Proceedings of the 7th Annual North American Waste-to-Energy Conference, Tampa, FL, USA, 17–19 May 1999; pp. 199–212. [Google Scholar]
  8. Frey, H.H.; Peters, B.; Hunsinger, H.; Vehlow, J. Characterization of municipal solid waste combustion in a grate furnace. Waste Manag. 2003, 23, 689–701. [Google Scholar] [CrossRef]
  9. Yang, Y.B.; Goodfellow, J.; Nasserzadeh, V.; Swithenbank, J. Study on the transient process of waste fuel incineration in a full-scale moving-bed furnace. Combust. Sci. Technol. 2004, 177, 127–150. [Google Scholar] [CrossRef]
  10. Essenhigh, R.H.; Kuo, T.J. Combustion and emission phenomena in incinerators: Development of physical and mathematical models of incinerators, Part I: Statement of the problem. In Proceedings of the National Incinerator Conference; ASME: New York, NY, USA, 1970; pp. 261–271. [Google Scholar]
  11. Klason, T.; Bai, X.S. Combustion process in a biomass grate fired industry furnace: A CFD study. Prog. Comput. Fluid Dyn. Int. J. 2006, 6, 278–286. [Google Scholar] [CrossRef]
  12. Brosch, B.; Scherer, V.; Wirtz, S. Simulation of municipal solid waste incineration in grate firing systems with a particle based novel discrete element method. VGB Powertech 2014, 1, 75. [Google Scholar]
  13. Wissing, F.; Wirtz, S.; Scherer, V. Simulating municipal solid waste incineration with a DEM/CFD method–influences of waste properties, grate and furnace design. Fuel 2017, 206, 638–656. [Google Scholar] [CrossRef]
  14. Goh, Y.R.; Siddall, R.G.; Nasserzadeh, V.; Zakaria, R.; Swithenbank, J.; Lawrence, D.; Garrod, N.; Jones, B. Mathematical modelling of the burning bed of a waste incinerator. J. Inst. Energy 1998, 71, 110–118. [Google Scholar]
  15. Goh, Y.R.; Yang, Y.B.; Zakaria, R.; Siddall, R.G.; Nasserzadeh, V.; Swithenbank, J. Development of an incinerator bed model for municipal solid waste incineration. Combust. Sci. Technol. 2001, 162, 37–58. [Google Scholar] [CrossRef]
  16. Shin, D.; Choi, S. The combustion of simulated waste particles in a fixed bed. Combust. Flame 2000, 121, 167–180. [Google Scholar] [CrossRef]
  17. Kær, S.K. Straw combustion on slow-moving grates—a comparison of model predictions with experimental data. Biomass Bioenergy 2005, 28, 307–320. [Google Scholar] [CrossRef]
  18. Miljković, B.; Pešenjanski, I.; Vićević, M. Mathematical modelling of straw combustion in a moving bed combustor: A two dimensional approach. Fuel 2013, 104, 351–364. [Google Scholar] [CrossRef]
  19. Zhou, H.; Jensen, A.D.; Glarborg, P.; Jensen, P.A.; Kavaliauskas, A. Numerical modeling of straw combustion in a fixed bed. Fuel 2005, 84, 389–403. [Google Scholar] [CrossRef]
  20. Yang, Y.B.; Ryu, C.; Goodfellow, J.; Sharifi, V.N.; Swithenbank, J. Modelling waste combustion in grate furnaces. Process Saf. Environ. Prot. 2004, 82, 208–222. [Google Scholar] [CrossRef]
  21. Ryu, C.; Shin, D.; Choi, S. Combined simulation of combustion and gas flow in a grate-type incinerator. J. Air Waste Manag. Assoc. 2002, 52, 189–197. [Google Scholar] [CrossRef] [Green Version]
  22. Cordiner, S.; Manni, A.; Mulone, V.; Rocco, V. Biomass furnace study via 3D numerical modeling. Int. J. Numer. Methods Heat Fluid Flow 2016, 26, 515–533. [Google Scholar] [CrossRef]
  23. Yin, C.; Rosendahl, L.; Clausen, S.; Hvid, S.L. Characterizing and modeling of an 88 MW grate-fired boiler burning wheat straw: Experience and lessons. Energy 2012, 41, 473–482. [Google Scholar] [CrossRef]
  24. Goerner, K.; Klasen, T. Modelling, simulation and validation of the solid biomass combustion in different plants. Progress Comput. Fluid Dyn. Int. J. 2006, 6, 225–234. [Google Scholar] [CrossRef]
  25. Di Blasi, C. Modeling wood gasification in a countercurrent fixed-bed reactor. AIChE J. 2004, 50, 2306–2319. [Google Scholar] [CrossRef] [Green Version]
  26. Park, W.C.; Atreya, A.; Baum, H.R. Experimental and theoretical investigation of heat and mass transfer processes during wood pyrolysis. Combust. Flame 2010, 157, 481–494. [Google Scholar] [CrossRef]
  27. Lai, A.C.H.; Law, A.W.K. Numerical modeling of municipal waste bed incineration. Int. J. Numer. Methods Heat Fluid Flow 2019, 29, 504–522. [Google Scholar] [CrossRef]
  28. Yakhot, V.; Orszag, S.A. Renormalization group analysis of turbulence. I. Basic theory. J. Sci. Comput. 1986, 1, 3–51. [Google Scholar] [CrossRef] [Green Version]
  29. Magnussen, B.F.; Hjertager, B.H. On mathematical modeling of turbulent combustion with special emphasis on soot formation and combustion. Symp. (Int.) Combust. 1977, 16, 719–729. [Google Scholar] [CrossRef]
  30. Cheng, P. Two-dimensional radiating gas flow by a moment method. AIAA J. 1964, 2, 1662–1664. [Google Scholar] [CrossRef]
  31. Tu, Y.; Zhou, A.; Xu, M.; Yang, W.; Siah, K.B.; Prabakaran, S. Experimental and numerical study on the combustion of a 32 MW wood-chip grate boiler with internal flue gas recirculation technology. Energy Procedia 2017, 143, 591–598. [Google Scholar] [CrossRef]
  32. Yin, C.; Rosendahl, L.; Kær, S.K.; Clausen, S.; Hvid, S.L.; Hille, T. Mathematical modeling and experimental study of biomass combustion in a thermal 108 MW grate-fired boiler. Energy Fuels 2008, 22, 1380–1390. [Google Scholar] [CrossRef] [Green Version]
Figure 1. Schematic diagram of a waste-to-energy (WTE) plant (from [6]).
Sustainability 12 08007 g001
Figure 2. Three alternatives of pyrolysis kinetics mechanism from: (a) [16]; (b) [25] and (c) [26].
Sustainability 12 08007 g002
Figure 3. (a) Incinerator components. Secondary and over-fired air (OFA) entered the chamber through the secondary nozzles on the front (SFA) and rear (SRA) walls of the furnace; (b) computational mesh; and transient changes in the average bed height as well as the average solid and gas composition: (c,f) [16]; (d,g) [25]; (e,h) [26].
Sustainability 12 08007 g003
Figure 4. Distribution of: (a) velocity; (b) temperature; (c) CH4 and (d) O2 inside the laboratory furnace.
Sustainability 12 08007 g004aSustainability 12 08007 g004b
Figure 5. Exit gas composition.
Sustainability 12 08007 g005
Figure 6. Predictions of the advanced moving grate (AMG) incinerator (a,b: mesh; ce: profile; f,g: cross-section).
Sustainability 12 08007 g006aSustainability 12 08007 g006b
Figure 7. Volume fractions of exit gas composition.
Sustainability 12 08007 g007
Table 1. Summary of the flow rate, temperature and gas composition at the primary and secondary air boundaries.
Area (m2)Grate LengthFlow Rate (kg/s)Temp (K)O2 (%)H2O (%)CO2 (%)CO (%)CH4 (%)H2 (%)
E1L3.940–21.3111004.923.89.613.33.80.1
E1R3.940–21.3111004.923.89.613.33.80.1
E2L3.852–41.8711000.218.332.616.84.00.2
E2R3.852–41.8711000.218.332.616.84.00.2
E3L3.854–61.8911003.28.224.02.61.00.0
E3R3.854–61.8911003.28.224.02.61.00.0
E4L3.856–80.73110011.50.016.80.20.10.0
E4R3.856–80.73110011.50.016.80.20.10.0
E5L3.508–100.15110018.20.46.30.00.00.0
E5R3.508–100.13110018.20.46.30.00.00.0
SAF0.21--1.42110023.00.00.00.00.00.0
SAR0.21--2.18110023.00.00.00.00.00.0

