Article

Urban Heat Island Mitigation Strategies: Experimental and Numerical Analysis of a University Campus in Rome (Italy)

by
Gabriele Battista
1,*,
Luca Evangelisti
1,
Claudia Guattari
1,
Emanuele De Lieto Vollaro
2,
Roberto De Lieto Vollaro
1 and
Francesco Asdrubali
1
1
Department of Engineering, Roma TRE University, Via Vito Volterra 62, 00146 Rome, Italy
2
Department of Architecture, Roma TRE University, Via della Madonna dei Monti 40, 00184 Rome, Italy
*
Author to whom correspondence should be addressed.
Sustainability 2020, 12(19), 7971; https://doi.org/10.3390/su12197971
Submission received: 12 August 2020 / Revised: 22 September 2020 / Accepted: 24 September 2020 / Published: 25 September 2020
(This article belongs to the Collection Sustainable Buildings and Energy Performance)

Abstract

:
The urban heat island (UHI) phenomenon is strictly related to climate changes and urban development. During summer, in urban areas, the lack of green zones and water sources causes local overheating, with discomfort and negative effects on buildings’ energy performance. Starting from this, an experimental and numerical investigating of the climatic conditions in a university area in Rome was achieved, also assessing the occurrence of the UHI phenomenon. The analyzed area was recently renewed, with solutions in contrast to each other: on one side, an old building was re-designed aiming at high performance; on the other hand, the neighboring areas were also refurbished leading to large paved surfaces, characterized by high temperatures during summer. A calibrated numerical model was generated through ENVI-met software and eight different scenarios were compared, to mitigate the overheating of this area and to analyze the influences of the proposed solutions in terms of air temperature reduction. The analysis of this case study provides information on potential mitigation solutions in the urban environment, showing that goals and priorities in the design phase should concern not only buildings but also external areas, also considering university areas.

1. Introduction

Human comfort and buildings’ energy performance are influenced by the growth of urban areas, where constructions and infrastructures have replaced open land and vegetation, with unavoidable landscape change.
Modifications of towns led to the well-known urban heat island (UHI) phenomenon, with higher air temperatures in densely built areas than rural ones. Differences in temperature can vary between 1 °C and 3 °C in cities where a million or more people live [1].
The UHI phenomenon has been investigated since the 19th century [2] and it is currently studied by the scientific community, which is focused on identifying mitigation strategies and effects that the UHI implies [3].
The UHI effects are influenced by various local, regional and global variables strictly correlated to the global climate change. Climate change improve the stress on urban environments through the increase of heat waves, threatening the health of all people, from old to young. Furthermore, climate change rises the frequency and intensity of droughts and inland floods threatening water supplies, and the enhanced sea level and storm surges affecting people and infrastructures [4]. At the same time, human activities are one of the main causes of the increasing of greenhouse gas emissions that contribute to increase the global climate change and, as in a loop, it is one of the reasons why the urban temperatures are rising. Urban temperature projections are required for the development of city-specific climate change mitigation policies despite the non-stationary nature of UHIs over time [5]. Urban environments’ quality in cities are vulnerable to the effects of climate change and, at the same time, they play a crucial role in its mitigation.
The future urbanization until the 2070s was investigated by Adachi et al. [6], finding that the increase in the surface air temperature from 1990s to 2070s will be about 2.0 °C as a result of global climate changes, and about 0.5 °C as a result of urbanization. McCarthy et al. [7] affirms that the presence of the urban heat island has a significant impact on the frequency of extreme high temperatures both in present and future climates, and it will exacerbate the impact of climate change on the urban population. Therefore, climate simulations have an important role to investigate the future warming due to UHIs’ effects [8,9], and simulation on local climate conditions have an important role in order to evaluate the effectiveness of mitigation strategies.
Several investigations have been achieved all over the world, demonstrating that UHI is a current problem, able to significantly influence local microclimate, determining high temperatures, with subsequent negative influences on human comfort, contributing to human diseases and health risks [10,11]. Moreover, the urban heat island phenomenon, due to persistent high temperatures, determines impacts also related to buildings’ energy consumptions, with higher cooling energy demands [12,13]. Even though UHI is usually related to big cities (characterized by large paved surfaces and millions of inhabitants), recent studies in literature show that even small towns (characterized by a few hundred thousand inhabitants) can be affected by this phenomenon [14].
For this reason, examining and investigating the urban heat island phenomenon is considered a key point by researchers all over the world, taking into account both causes and effects. Besides, it is fundamental in finding effective mitigation strategies and analyzing the best solutions, among which are green roofs, increased vegetation, cool materials and water bodies [15,16].
The relevance that the scientific community attributes to this topic is demonstrated by many scientific works available on search engines, such as ScienceDirect—in 2019 alone, more than 500 studies, related to the UHI mitigation strategies, were published. Some of them are discussed in the following.
Farhadi et al. [17] investigated different solutions for the UHI mitigation in Tehran. In particular, the authors analyzed the effects of urban vegetation on the street and roofs, high albedo surfaces’ installation and the orientation of buildings by means of numerical models, generated with ENVI-met software. The authors affirmed that proper urban planning could mitigate the UHI, in particular for new sustainable developments, while thermal comfort improvements can be reached by increasing the percentage of urban vegetation.
Taking into account the neighborhood scale, Taleghani et al. [18] focused on the effect of mitigation solutions on the surface energy balance, analyzing the influence of four strategies, based on green roof, cool roof, additional trees, and cool pavement. The authors found that cool pavements led to the highest reductions in net radiation, with a temperature reduction equal to 2 °C in the early afternoon.
Imran et al. [19] proposed a study for evaluating the efficacy of urban vegetation covers such as mixed forest, combination of mixed forest and grasslands, and combination of mixed shrublands and grasslands for decreasing the UHI effects in the city of Melbourne. The analysis was performed using simulations performed through the Weather Research and Forecasting model coupled with the Single Layer Urban Canopy Model. The authors obtained temperature reductions ranging between 0.4 °C and 3.7 °C. However, the limitation of this study is related to the fact that direct interactions between vegetation and urban surfaces are not accounted for in the proposed model.
In his study, Bao-Jie He [20] proposed a new concept of Green Building, suggesting the idea of Green Building-based UHI Mitigation system, or Zero UHI impact building, aiming to reach the zero-heat impact on surrounding environments by means of sensibly designing structures, or depending on innovative solutions for removing the excessive heat.
A review related to the mitigation strategies for improving the thermal environment and comfort in urban areas was proposed by Lai et al. [21]. In particular, the mechanisms and cooling effects of some major mitigation strategies (urban geometry change, increased vegetation, cool surface installation and water bodies’ use) allowed to find a median reduction of the outdoor air temperature equal to 2.1 °C, 2.0 °C, 1.9 °C, and 1.8 °C, respectively.
Finally, taking into account the raising public awareness about the UHI phenomenon, Zhang et al. [22] empirically analyzed the will of Beijing inhabitants to pay for the benefits deriving from green roofs for mitigating the urban heat island effects. The data were obtained from a valuation survey characterized by many zero responses. This paper advises that improving government credibility is a key factor in promoting public participation in mitigating urban heat island effect.
The potential effects of mitigation techniques and the assessment of the effects of the UHI are widely investigated through the dynamic simulation tool ENVI-met, developed by the Ruhr University of Bochum (Universitätsstraße 150, 44801 Bochum, Germany) [23]. The software was released in 1998, with a rapid growth in the number of authors who have used this tool for their scientific works, over the past decade [24]. In September 2020, on the Scopus database, about 556 papers were published using the ENVI-met tool of which 380 were published in international scientific journals. The majority of these papers focused on the assessment of the performance of the mitigation techniques. Researchers used this tool for simulating the thermo-fluid dynamic condition of urban areas, assessing the influences of urban vegetation, cool materials, water fountains, pollutant sources, geometry and distribution of buildings and roads. Several scientific papers investigated the effect of various urban greening on the outdoor air temperature [25,26,27,28]. Morakinyo and Lam [29] generated a model of an urban canyon to simulate the influence of different tree configurations. Wang and Zacharias [30] observed that the use of urban greening and permeable soils on roads can lead to a decrease in air temperature of about 0.5–1 °C. Furthermore, many researchers used the ENVI-met software for assessing the effects of cool materials [31,32,33]. Chen et al. [34] found that an increased number of trees and higher albedo are more effective compared to green roofs in reducing summer potential temperatures at street level. Yuan et al. [35] simulated, through the ENVI-met tool, six scenarios varying the urban albedo and the urban greening in order to find the best match for a new residential area in Osaka.
Several investigations were done to evaluate the potential for urban overheating and mitigation in different areas of the world. However, not many studies on university campuses have been conducted, especially in Italy. This study focuses on university areas, analyzing the thermo-fluid dynamic condition in a recently renewed area of the Roma TRE University, placed in Rome (Italy). Roma TRE University is a young Italian campus, characterized by many buildings. Recently, the Engineering Department area, placed in a central area of the city, was renewed and the ex-towing tank building was re-designed, aiming at high performance. As mentioned before, the neighboring areas were also re-designed, leading to the construction of large paved surfaces characterized by high temperatures during summer. So, a methodological approach was here proposed and applied in order to generate a calibrated model by means of ENVI-met code and to test the influence of different mitigation strategies, represented by greenery, cool materials and canopy.

2. Materials and Methods
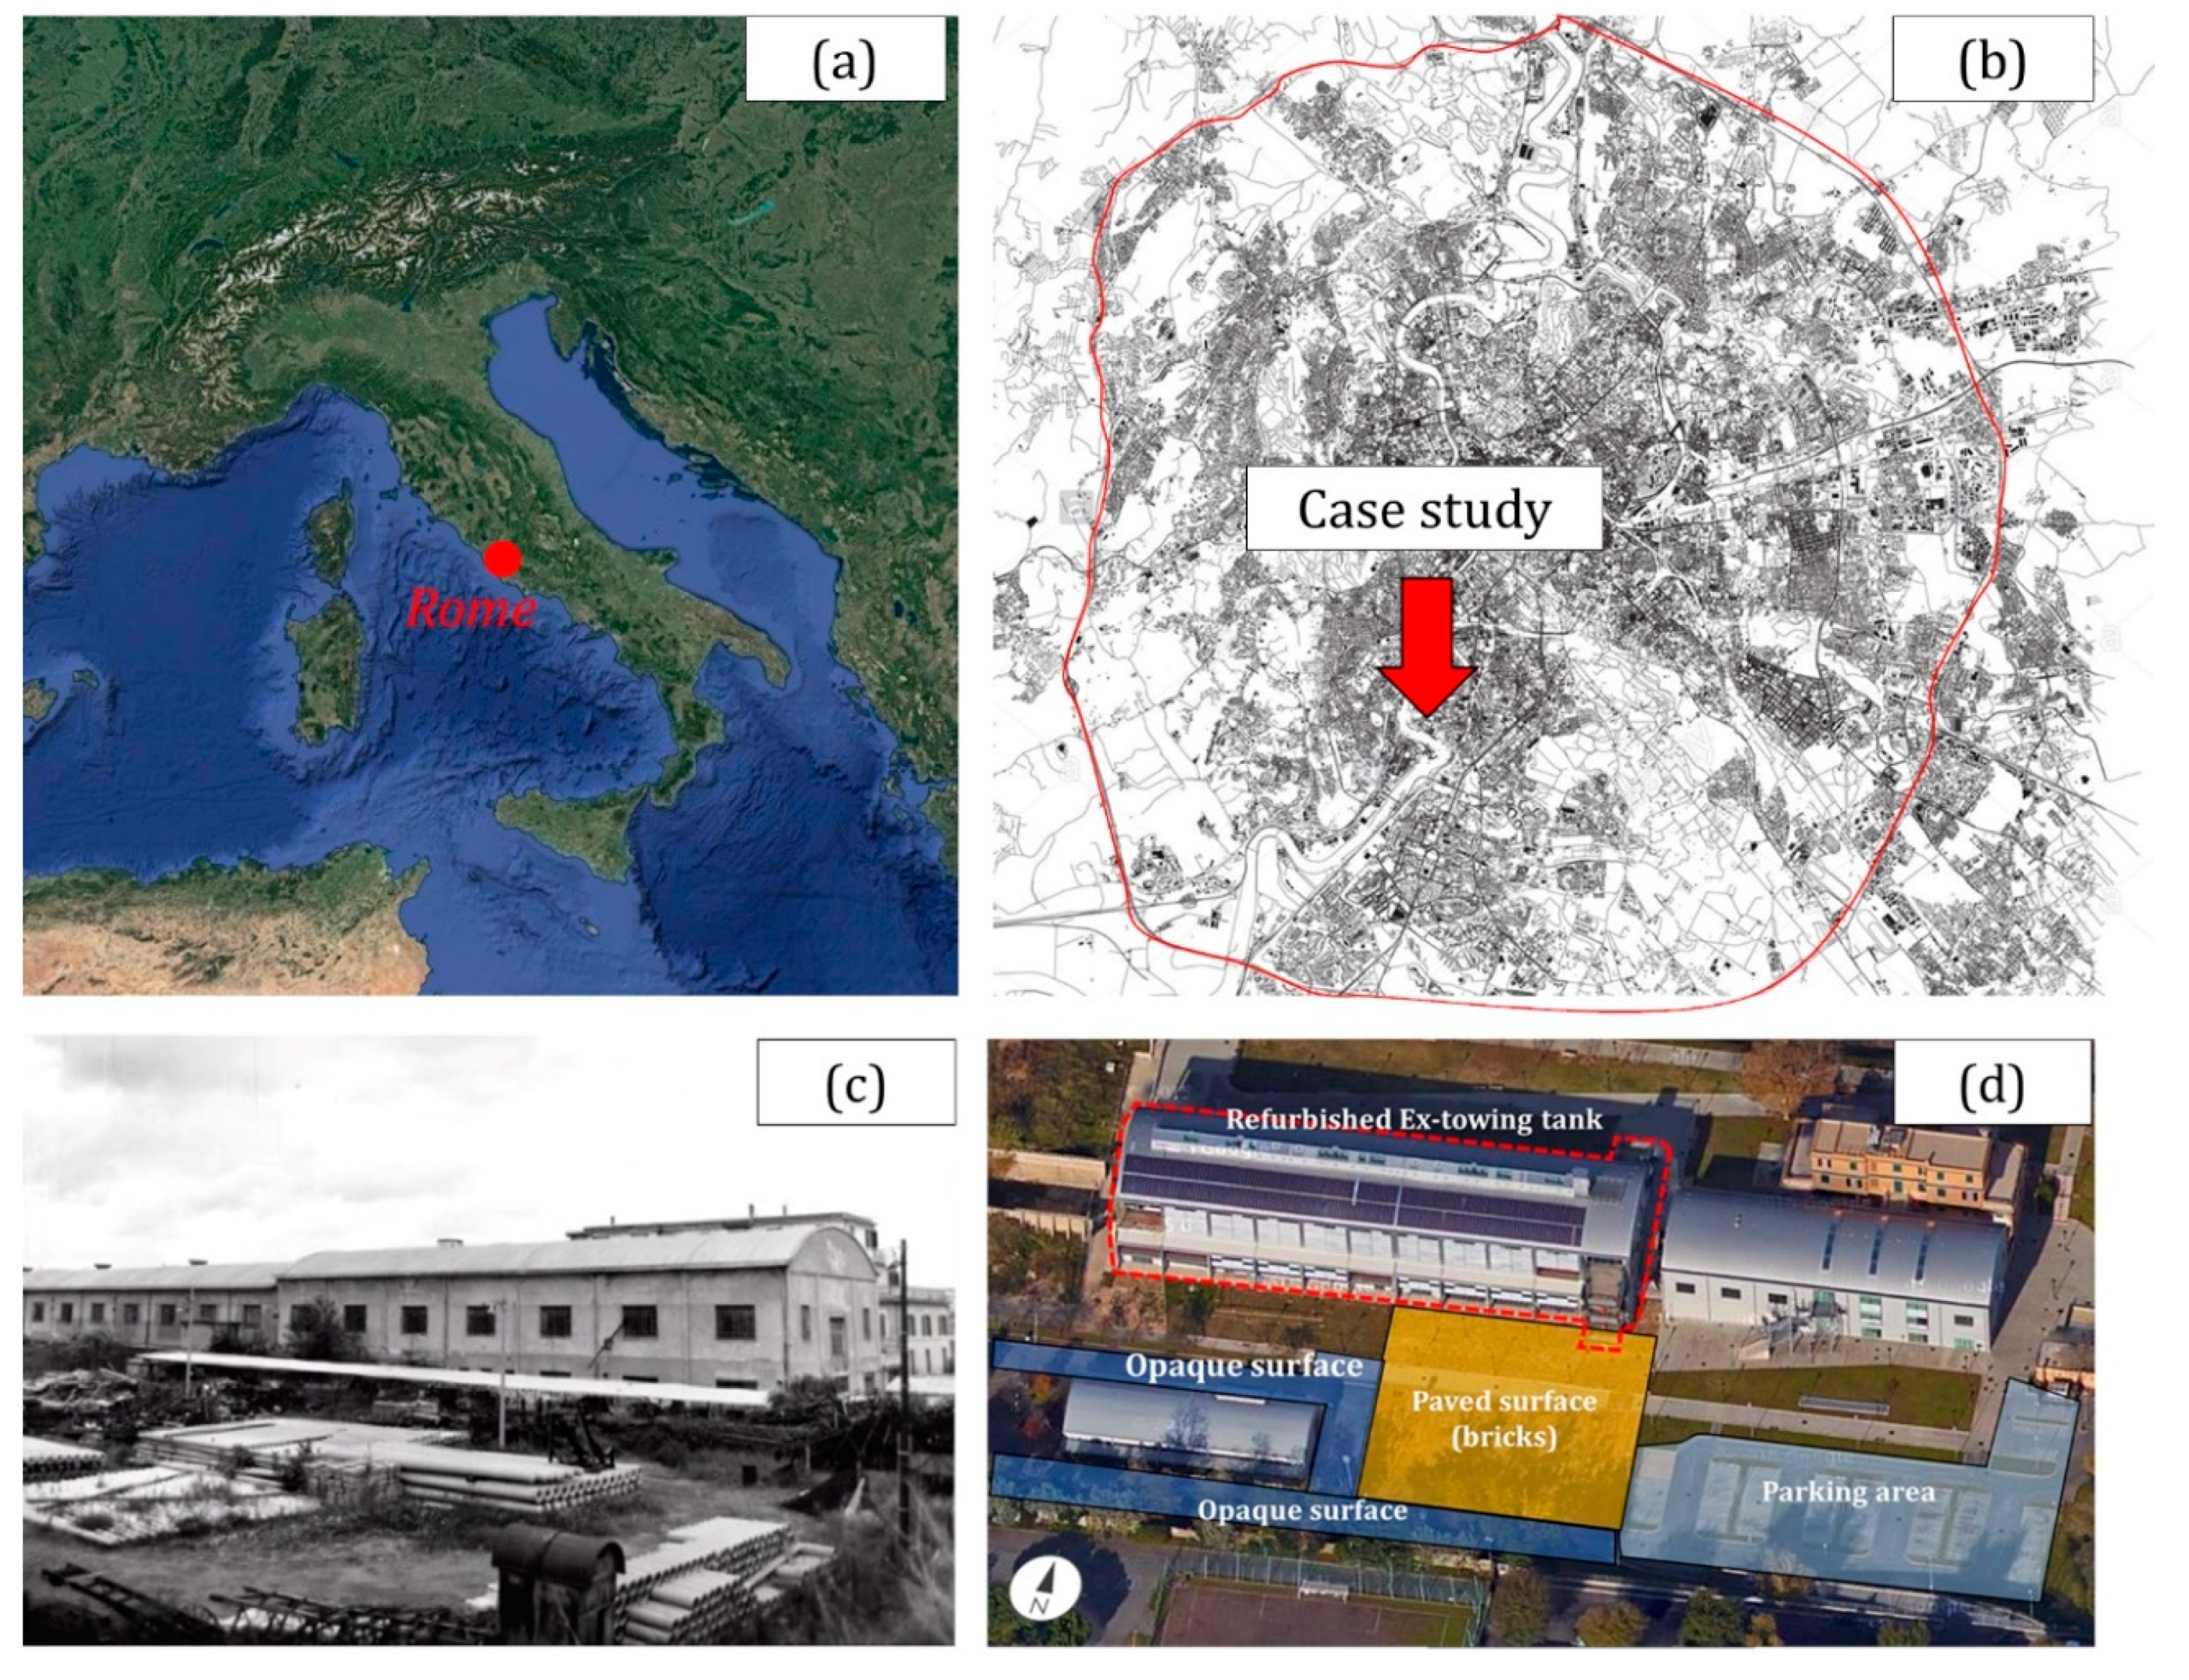
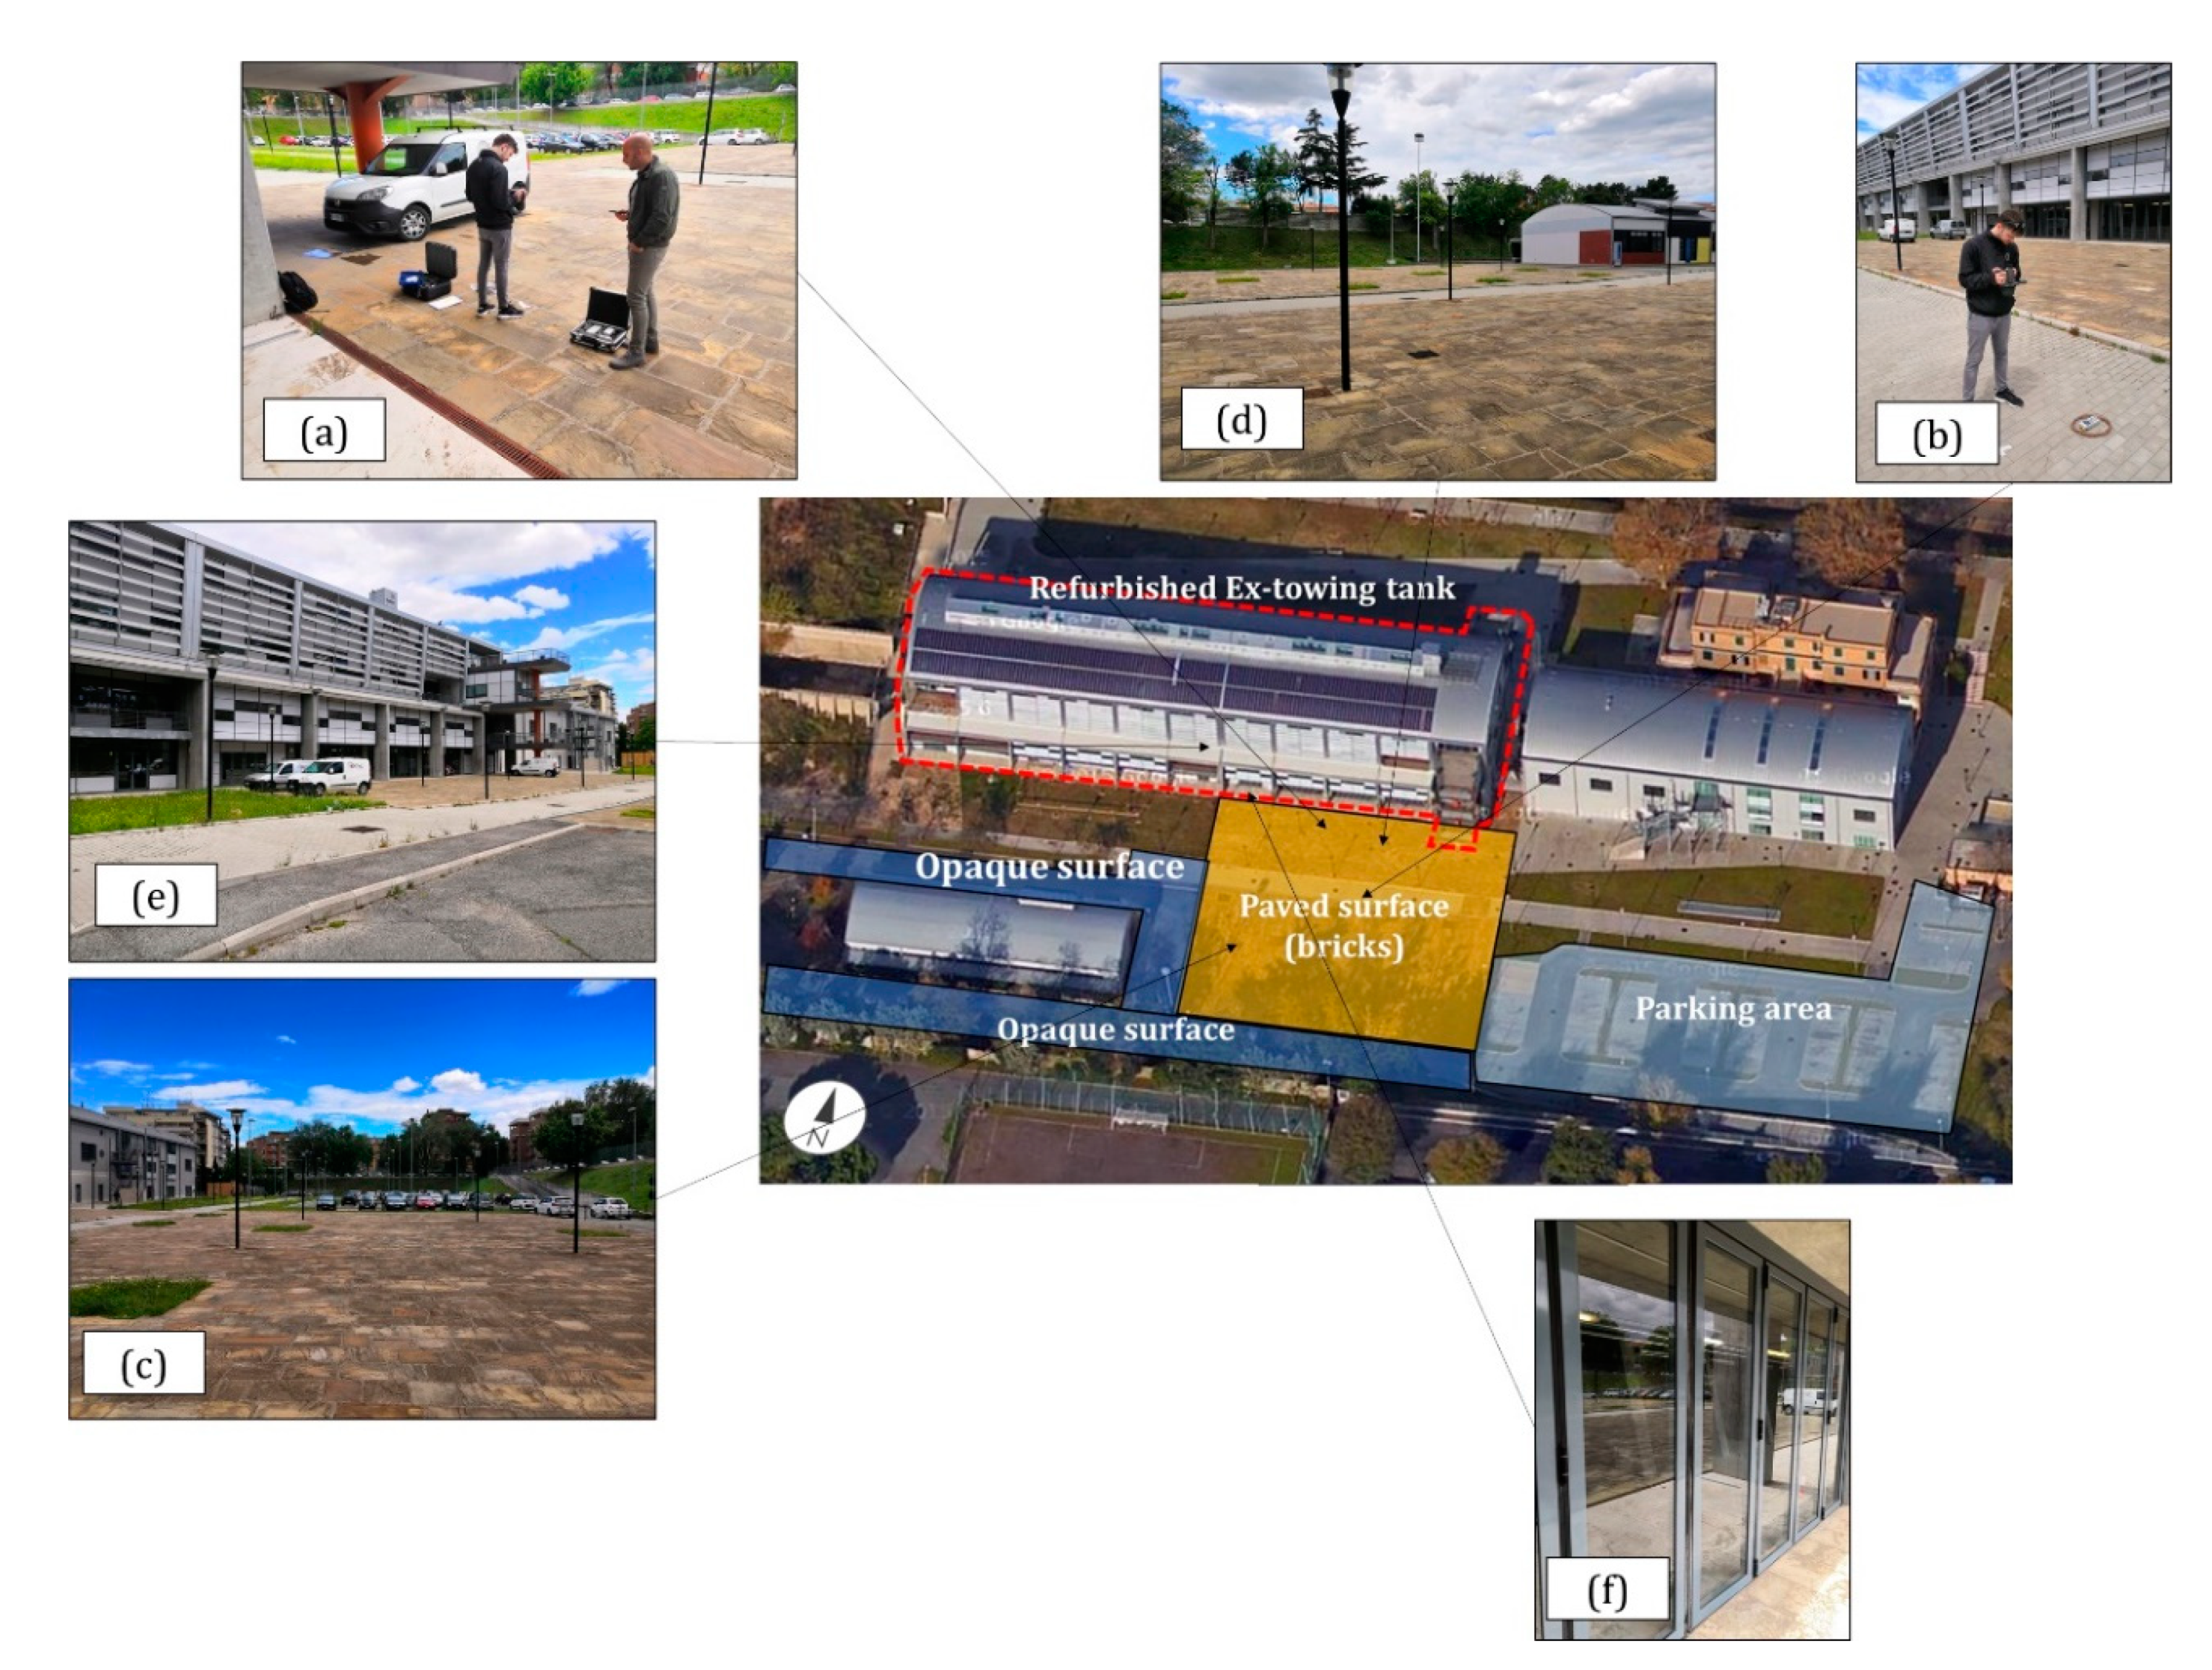
2.1. The Case Study

The National pool for trials in naval architecture was built in 1928, in Rome (Italy), by the engineer Cesare Leoni (see Figure 1a,b). In the past, it was used for testing hulls and propellers (see Figure 1c). Now, the ex-towing tank is one of the buildings of the Engineering Department of Roma TRE University (Via Vito Volterra 62, 00146, Rome, Italy), and it was changed into an efficient building (see Figure 1d).
The new structure is characterized by an efficient envelope, with active and passive energy solutions, such as photovoltaic panels and geothermal system. The structure is sited along the East-West direction, with the longer façades facing North and South.
However, this refurbishment seems to be characterized by solutions in contrast to each other: on one side, an old building was re-designed aiming at high performance; on the other hand, the neighboring areas were also refurbished leading to large paved surfaces, characterized by high temperatures during summer. In front of the South side of the building, large paved surfaces were built, realizing a parking area, wide transit routes and a large paved surface (represented in Figure 1b by the orange square, with an area equal to more than 2000 m2), with no trees or vegetation (only 44 m2 are covered by grass), thus leading to a large overheated surface during summer. The total area in front of the ex-towing tank building is equal to 7703 m2 of which 1821 m2 is covered by flowerbeds. Some trees can be observed along the perimeter of the investigated area, not generating useful shadows to prevent surfaces from overheating.

2.2. Methodology

As mentioned before, the main goal of this study is assessing the influence of some UHI mitigation strategies on the external environmental conditions of a University campus in Rome (Italy). This aim was pursued by means of experimental and numerical analysis, thus proposing potential solutions that should be considered during the design phase of new urban areas.
The implemented methodology consists of several successive steps that can be summarized as follows:
  • Case study identification. This is a preliminary step useful to identify high thermal stress areas characterized by low greenery, large paved surfaces, poor shading, and absence of water sources.
  • Monitoring and analysis of the selected area. The geometric characteristics of the area need to be noted, as well as the characteristics of the green areas. In this way, the thermal stress can be evaluated. Additional measurements can be carried out for the numerical model calibration.
  • Numerical model generation. The constructive and geometrical features of the site need to be modeled through a thermo-fluid dynamic code, such as ENVI-met.
  • Numerical model calibration. The measured environmental microclimatic parameters are used to calibrate the numerical model, setting the domain boundary conditions.
  • Identification of the mitigation techniques and strategies. Suitable mitigation techniques need to be identified. As a theoretical analysis, the solutions are selected among the most used in similar conditions, but do not take into account limitations that may arise in cases of real applications (e.g., availability of public water in case of blue mitigation strategies, or using mitigation strategies as not able to influence the historical architecture of the buildings and the urban area).
  • Assessment of mitigation scenarios. The last step is related to the analysis of the influence of different mitigation strategies and techniques, to be used alone and in combination, on the air temperature and thermal comfort evolution in selected spots of the case study area.
Starting from this general approach, the case study was identified as an area characterized by large paved surfaces, small green areas, and no water sources, representing an urban extent characterized by a high thermal stress.
The preliminary step was the evaluation of the local UHI phenomenon, by comparing the air temperatures recorded in the university campus with those registered in a greener area of Rome, close to the university campus. This comparison was carried out a year earlier, during June 2018.
During 22 July 2019, air temperatures were measured using sensors installed in four different positions on the main paved surface represented in Figure 1b by the orange area. Moreover, a spectrophotometer and a thermal imaging camera were used for measuring the albedo and the emissivity of the external surfaces [37], respectively (see Figure 2 and Figure 3). The obtained values are listed in Table 1. The relative humidity, wind speed and wind direction were obtained from a weather station sited close to the university campus (about 1.5 km away).
It is worthy to notice that from the preliminary UHI investigation date of June 2018 till the experimental campaign conducted in July 2019, the morphology of the site and the surrounding areas has not changed.
The urban geometrical features were modeled by means of the simulation software ENVI-met, whose detailed description will be made in the following Section 2.3. The recorded temperatures (four measuring points) were used for the calibration of the model using the Mean Absolute Error (MAE) and the Root Mean Square Error (RMSE):
M A E = i = 1 n | y i x i | n
R M S E =   i = 1 n ( y i x i ) 2 n
where {\displaystyle y_{i}}yi is the simulated value and {\displaystyle x_{i}}xi the experimental one. The total number of data is represented by n.
Once the calibrated model was obtained, the impact of different mitigation strategies (used alone and combined) were evaluated. The thorough description of the mitigation approaches will be discussed in the following Section 2.4 The flow-chart representing the main steps applied in this study is summarized in Figure 4.

2.3. Numerical Model Setup

The model was created by means of ENVI-met software (ENVI_met GmbH, Kaninenberghöhe 2, 45136 Essen, Germany), which is based on the Soil, Vegetation and Atmosphere Transfer model (SVAT). The geometrical model is presented in Figure 5, where the current situation of the investigated area is shown, also reporting the receptors T1, T2, T3 and T4 where the air temperature measurements were carried out for the calibration of the model. Figure 5 also shows the receptor T5, useful as a representative point for the simulation results related to the parking area.
The model is characterized by an extent equal to 28,000 m2, with a domain height of 40 m. The model’s domain is characterized by a quadrilateral grid imposed by the software, consisting of 100 (x) × 70 (y) × 30 (z) cells distinguished by a grid size equal to 2 m. This grid size allows high simulation quality and reduced computing time [3,38]. Along the z axis, the discretization was executed using a first grid height of 1 m divided by 5 sub-cells of 20 cm each—one for a better accuracy of the boundary layer. The cells, over the first one, are higher than that, with an increase of 2%.
The input parameters applied in the model are listed in Table 2. As previously mentioned, the hourly relative humidity, the average wind speed and the average wind direction were obtained from a weather station located near the investigated area (about 1.5 km away). In Figure 6 are reported the weather data taken into account. Simulations were performed from 6:00 p.m. of 21 July 2019 till to midnight of 22 July 2019, for 30 h of continuous simulation. The initial 6 h can be considered essential for solving the preliminary transient period. Thus, an entire day can be simulated. In Table 2, it is indicated that both air temperature and relative humidity at an altitude of 2 m are “forced” at the boundary, where the air flow crosses the domain (South-West side). This is necessary to reproduce the daily air temperature and relative humidity variation. The air temperature values are the results of the measurements taken in the receptors T1, T2, T3 and T4, and were changed hour by hour during the calibration phase.

2.4. Mitigation Strategies

Starting from the availability and largeness of spaces and considering that the case study is a university campus, the mitigation strategies were supposed in accordance with those that best match the intended use of the area. They consisted in improving urban vegetation (by means of additional grass and trees, aiming at increasing the shaded areas available to students), using cool pavements, and using a greenery canopy for the parking area (useful for university employees). The proposed mitigation solutions were applied individually and in combination with others. In the following, a brief description of the actual scenario and the improved proposed scenarios:
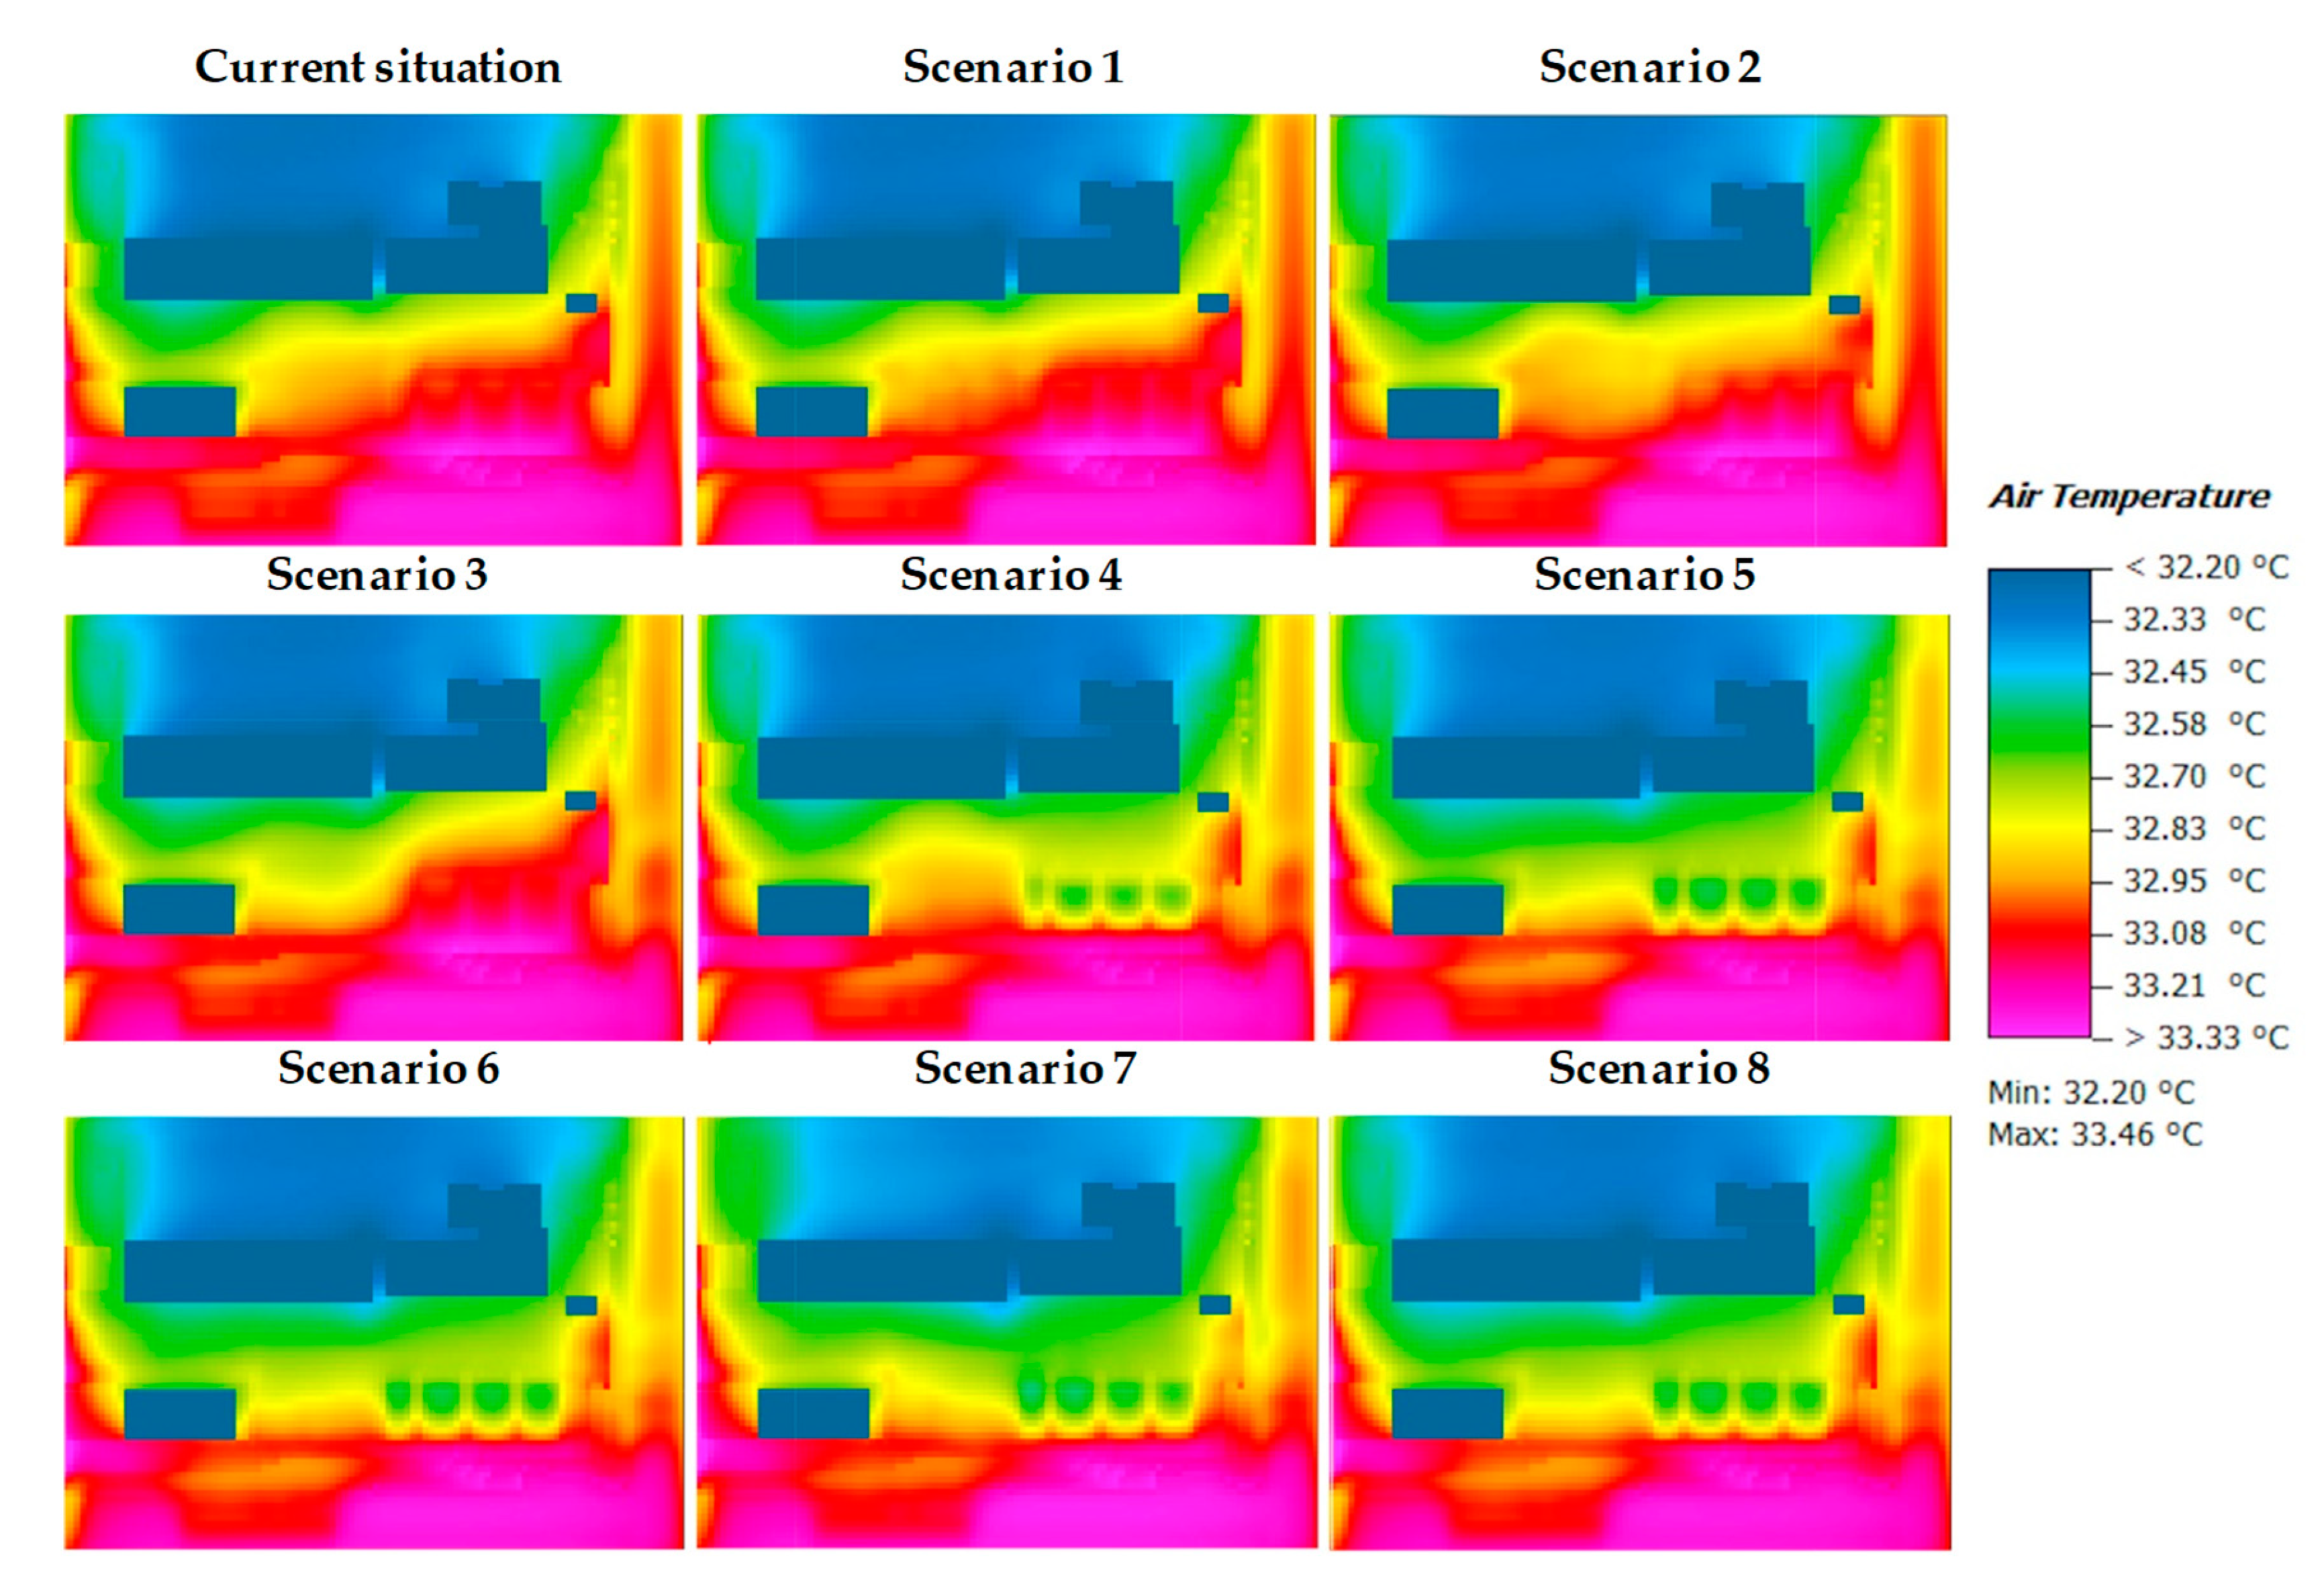
  • Current situation: This scenario refers to the actual conditions of the external areas, characterized by large paved surfaces.
  • Scenario 1: This scenario is characterized by the insertion in the external environment of 9 trees in the paved surface area and of 8 trees in the parking area (see also Figure 1b). All the trees are 5 m height.
  • Scenario 2: This scenario is characterized by the integration of 4 trees inside the paved surface (orange square in Figure 1b) and of 3 trees inside the parking area, all characterized by 15 m height.
  • Scenario 3: This scenario is characterized by the integration of a cool pavement inside the area outlined through the red dot line. The cool pavement has a solar reflectance equal to 0.8.
  • Scenario 4: This scenario is characterized by the integration of a canopy in the parking area (see Figure 1b).
  • Scenario 5: This scenario is characterized by the integration proposed for Scenario 4, with the additional application of lawn on the paved surface in front of the refurbished ex-towing tank building.
  • Scenario 6: It is characterized by both the integrations described for Scenario 5 and the insertion in the external environment of 8 trees in the paved surface area and of 5 trees in the parking area (see also Figure 1b). All the trees are 5 m in height.
  • Scenario 7: It is characterized by both the integrations described for Scenario 5 and the insertion in the external environment of 8 trees in the paved surface area and of 5 trees in the parking area (see also Figure 1b). All the trees are 15 m in height.
  • Scenario 8: It is characterized by both the integrations described for Scenario 3 and Scenario 4.
The corresponding ENVI-met models for each described scenario are shown in Figure 7.

3. Results and Discussion

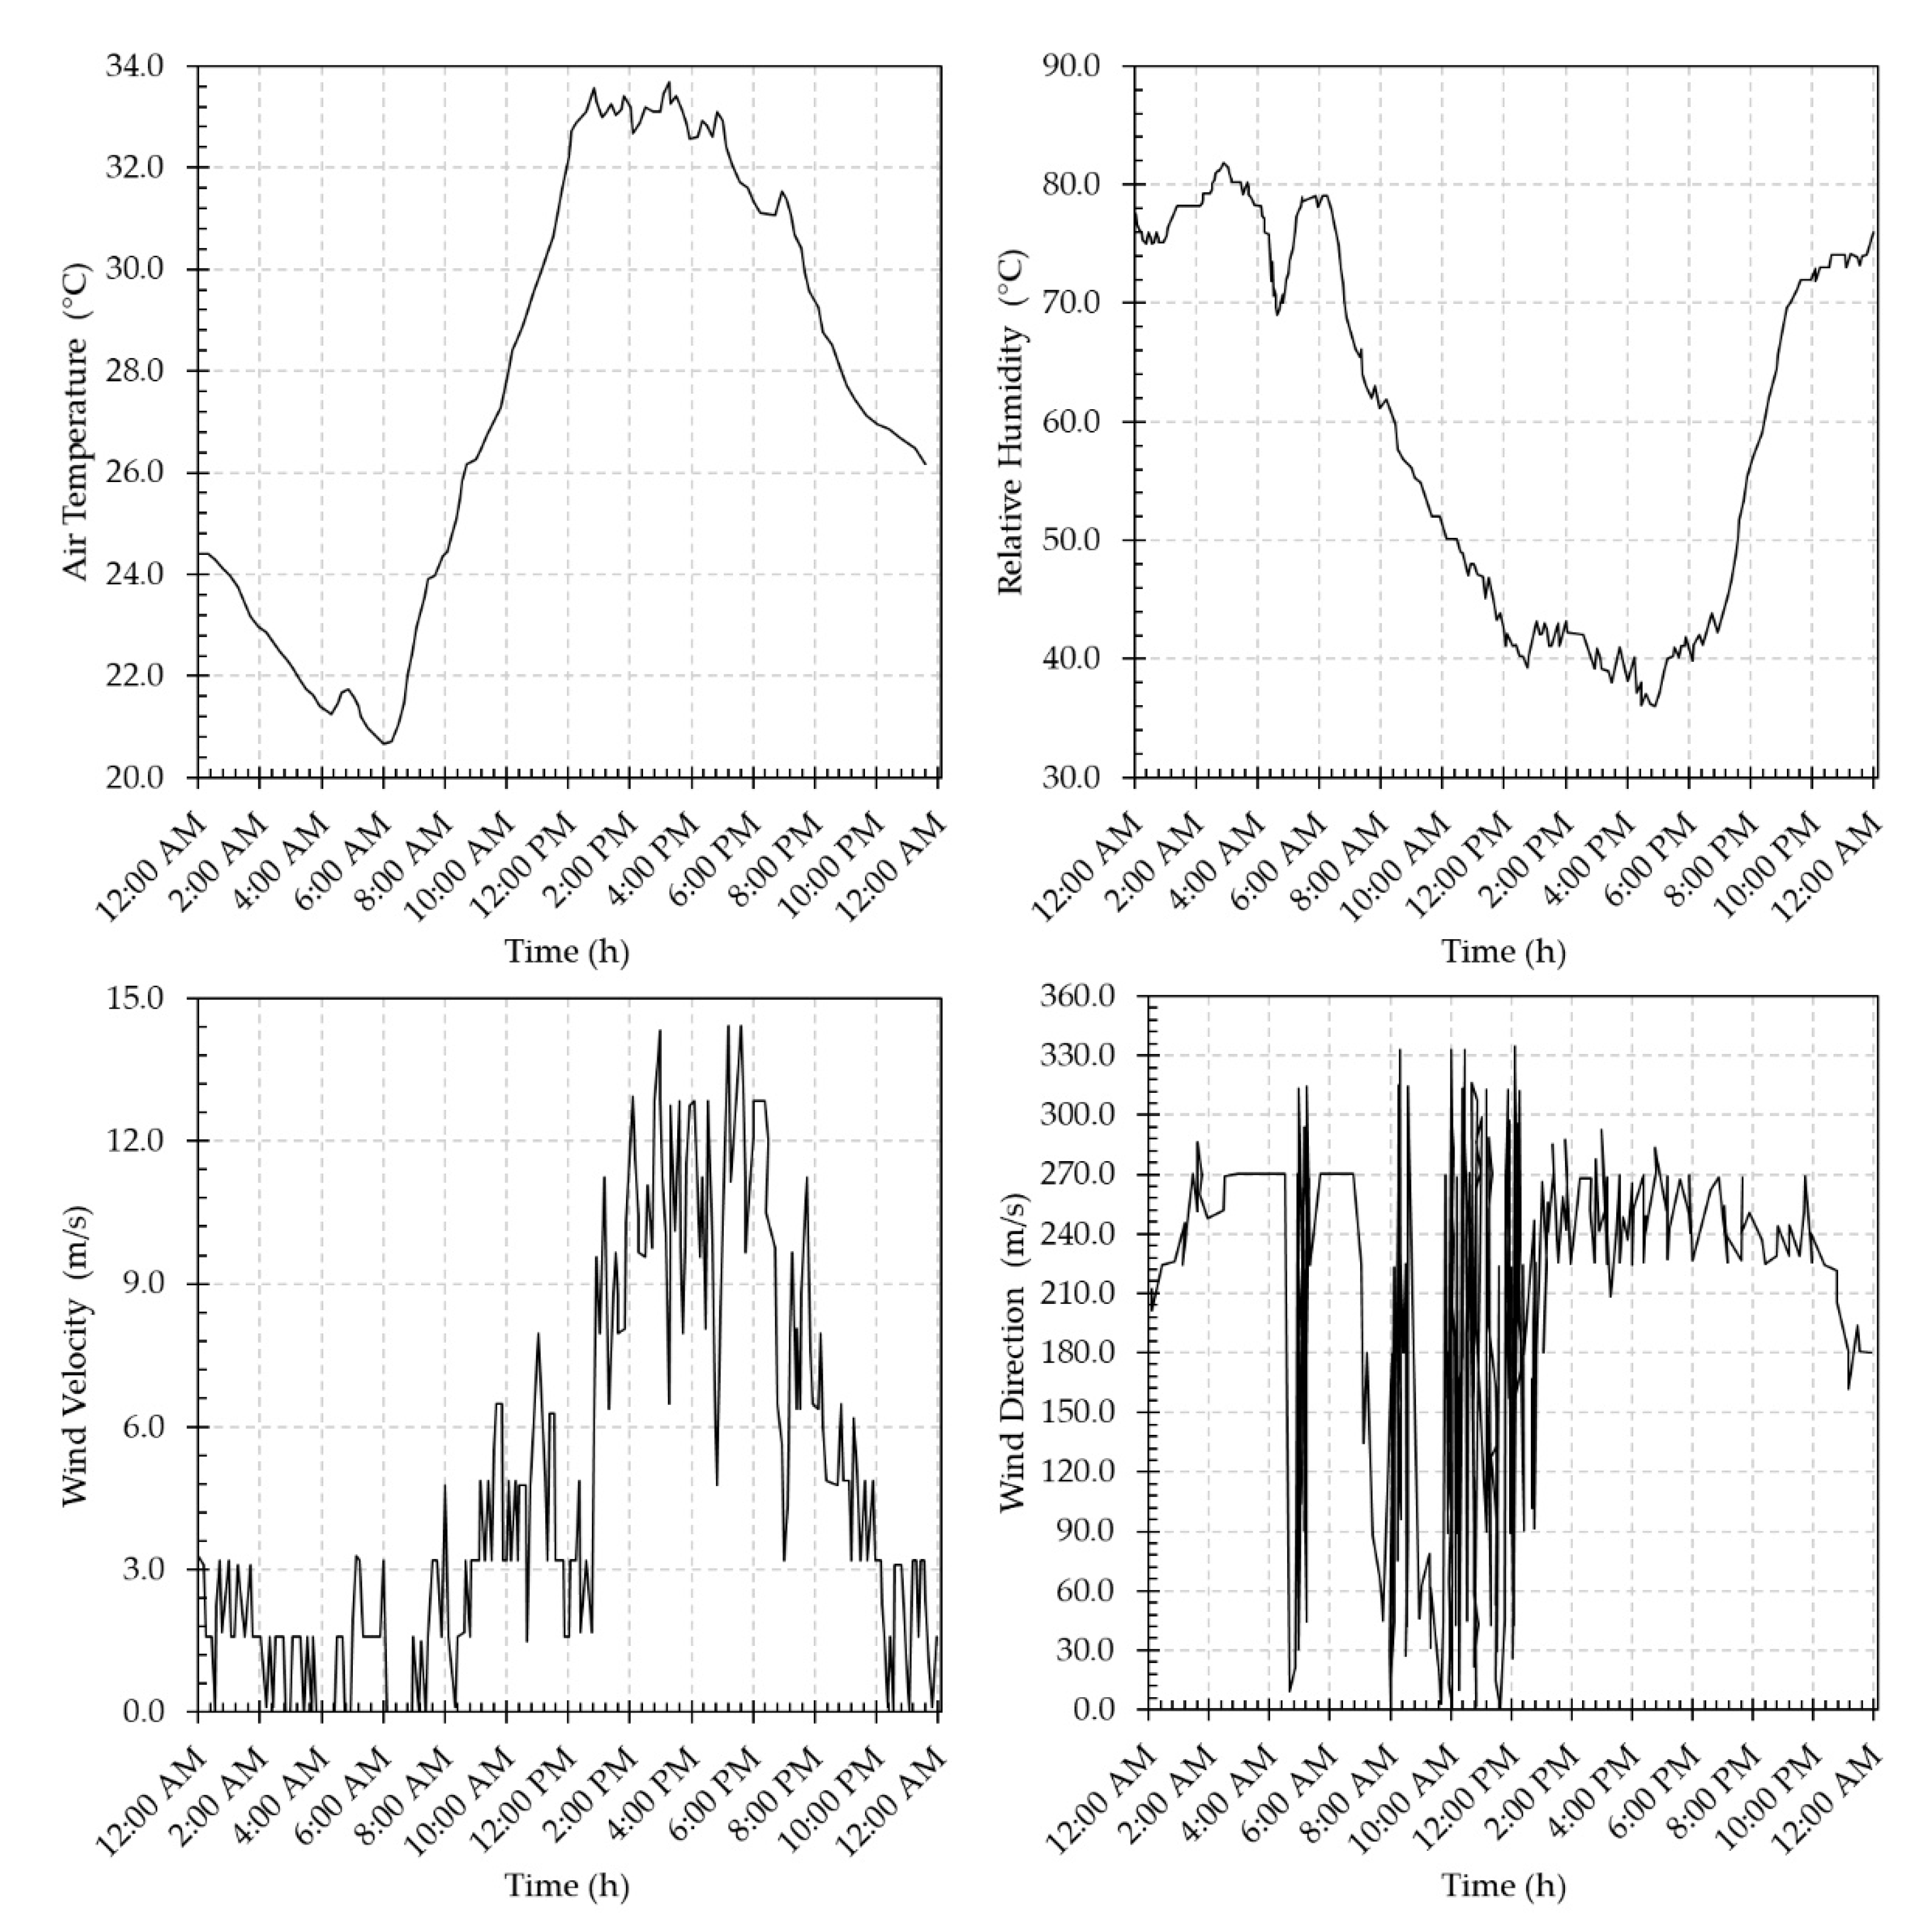
3.1. Preliminary UHI Phenomenon Evaluation

As mentioned in the methodology section, the preliminary step of the research was the assessment of the local UHI phenomenon. For this reason, a comparison between the air temperatures recorded in the university campus with those recorded in a greener neighborhood of Rome (nearby the university campus) was carried out. The results of this assessment are shown in Figure 8. In particular, Figure 8a shows maximum, average and minimum air temperatures for the whole measurement period and Figure 8b makes a focus on a single day, highlighting that the temperature differences during the day allow to identify a localized urban heat island phenomenon, characterized by a higher intensity from 9:30 a.m. till to 7:00 p.m. Taking into account all day long, it is possible to obtain an average urban heat island index equal to 1.14 °C and, considering only the aforementioned time interval, the average urban heat island index becomes equal to 2.65 °C. The highest urban heat island intensity value was registered at 12:44 p.m. and it is equal to 5.9 °C. The experimental results clearly show a localized occurrence of the urban heat island phenomenon due to the design features of the area.
During this first step, a preliminary thermographic analysis was conducted, taking a photo straddling the paved area and a part of the small flowerbed covered with grass. The result of this comparison is shown in Figure 9, where it is possible to notice a temperature reduction of about 12 °C, suggesting that growing the greenery can lead to lower temperatures and more comfort, with better environmental conditions. The result shown in Figure 9 is predictable, but in the analyzed case study, the issue is related to the effect of this predictable result when lawn is applied on a large scale in terms of air temperature distribution. This can be simulated only through calibrated numerical models.
It is worthy to notice that from the preliminary UHI investigation conducted during June 2018 till the on-site experimental campaign conducted in July 2019, the morphology of the site and the surrounding areas has not changed. Therefore, this preliminary analysis can be considered reliable for identifying the investigated campus as a high thermal stress area.

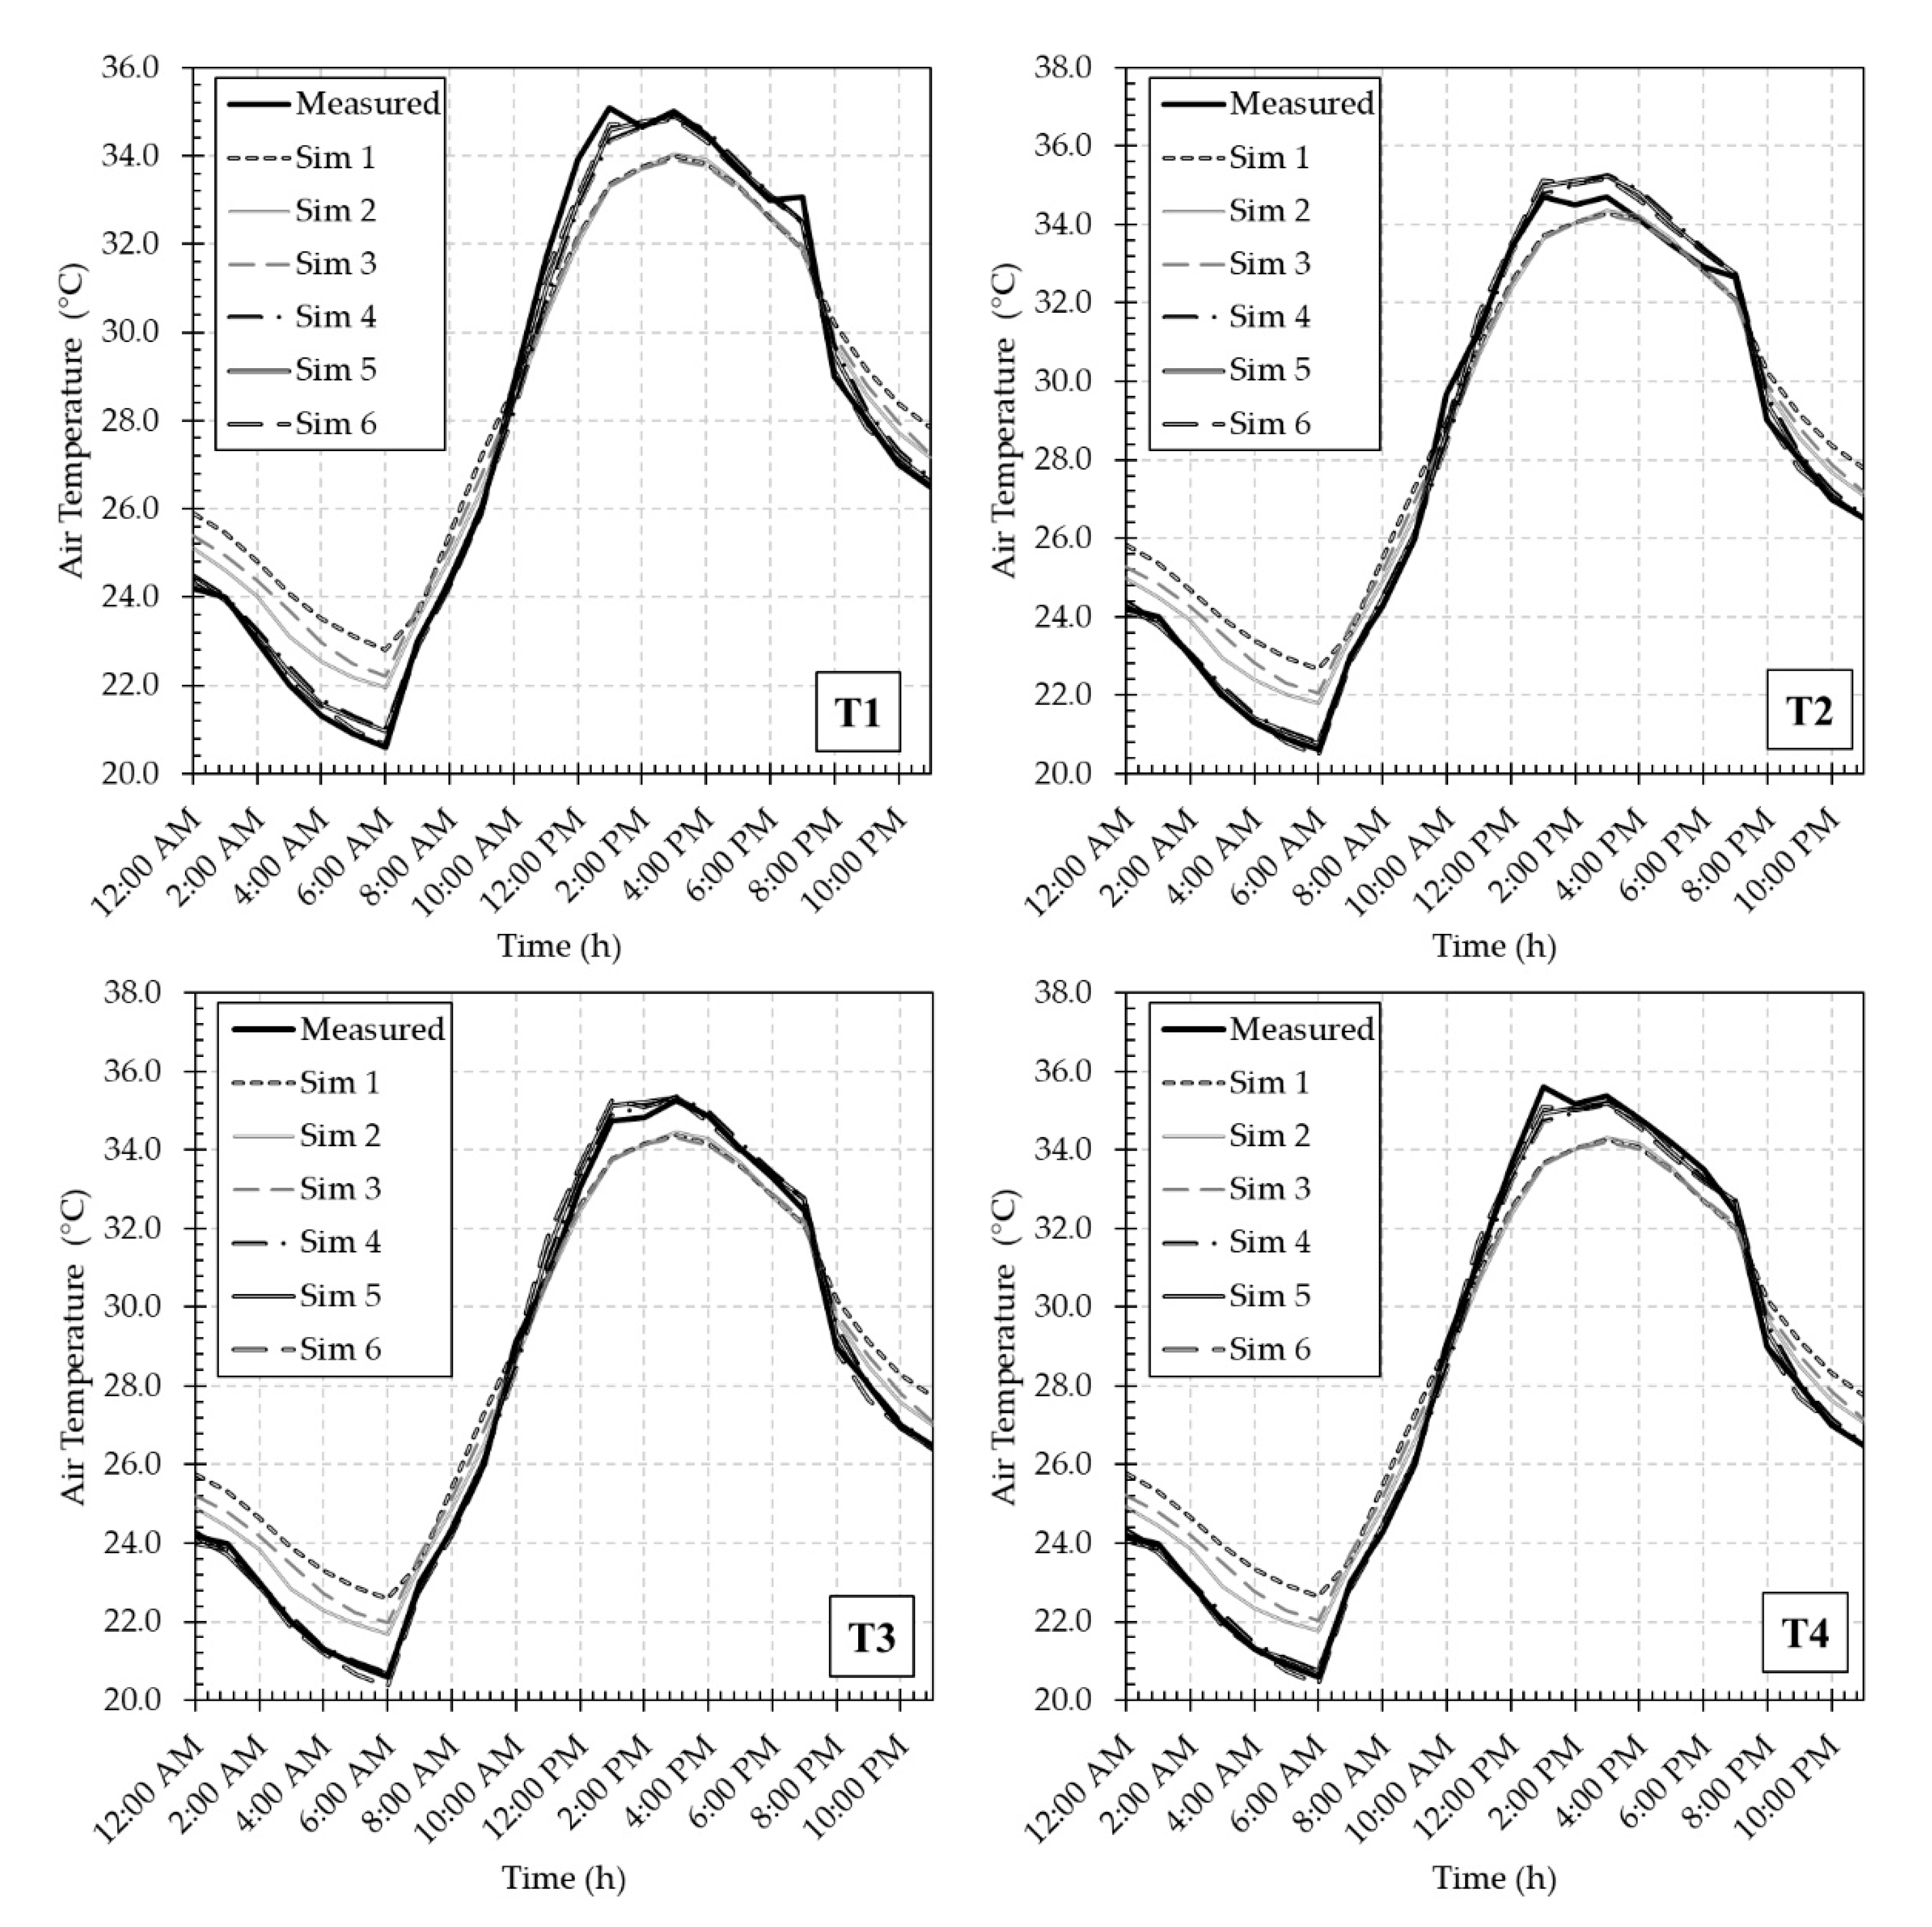
3.2. Numerical Model Calibration

The numerical model was calibrated by means of experimental data in four different points (previously called receptors T1, T2, T3 and T4). The calibration process consisted of the comparison between simulated and measured air temperatures, calculating the Mean Absolute Error (MAE) and the Root Mean Square Error (RMSE). Figure 10 provides the comparison among measured air temperatures and temperatures obtained by different simulations (in the picture, these simulations are called Sim, followed by the simulation number). Table 3 lists the MAE and the RMSE for each simulation. Several atmospheric quantities are required for running the model, and the calibration process is the results of the variation, step by step, of the forced air temperature set on the boundary of the computational domain. For all the receptors, the last simulation (called Sim 6) allowed to obtain the lower values of the Mean Absolute Error (equal to 0.20) and the Root Mean Square Error (equal to 0.27).

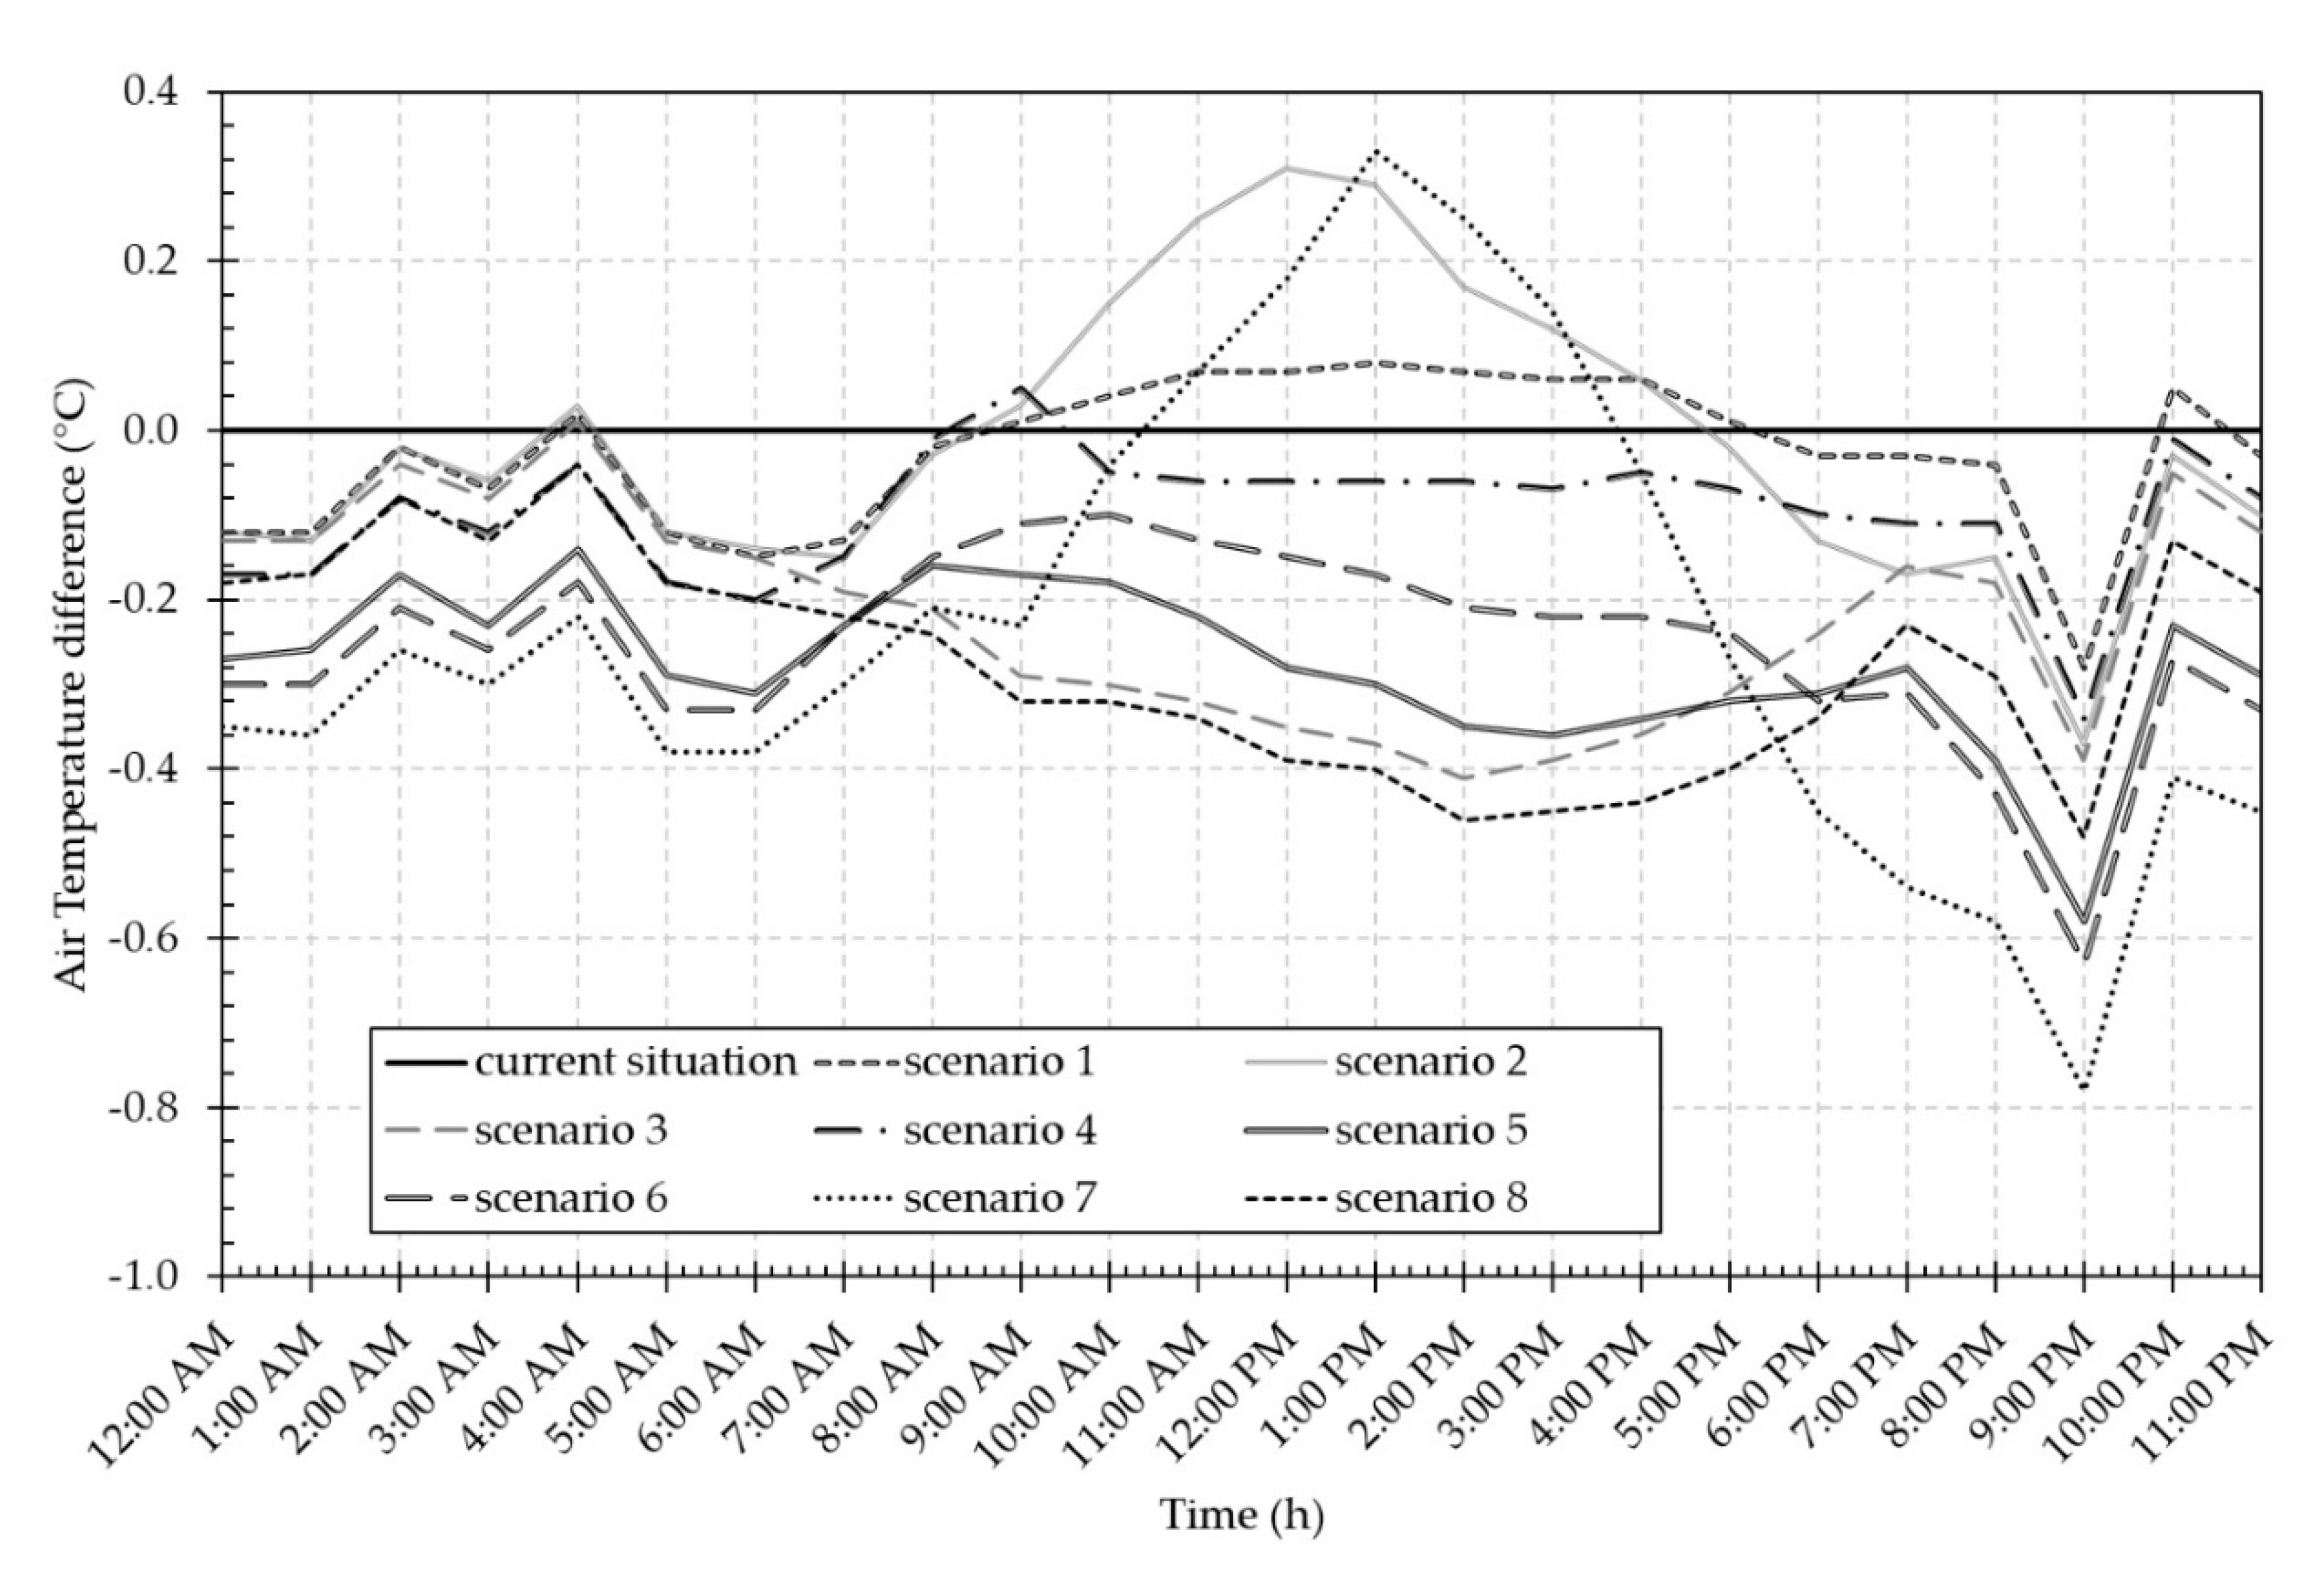
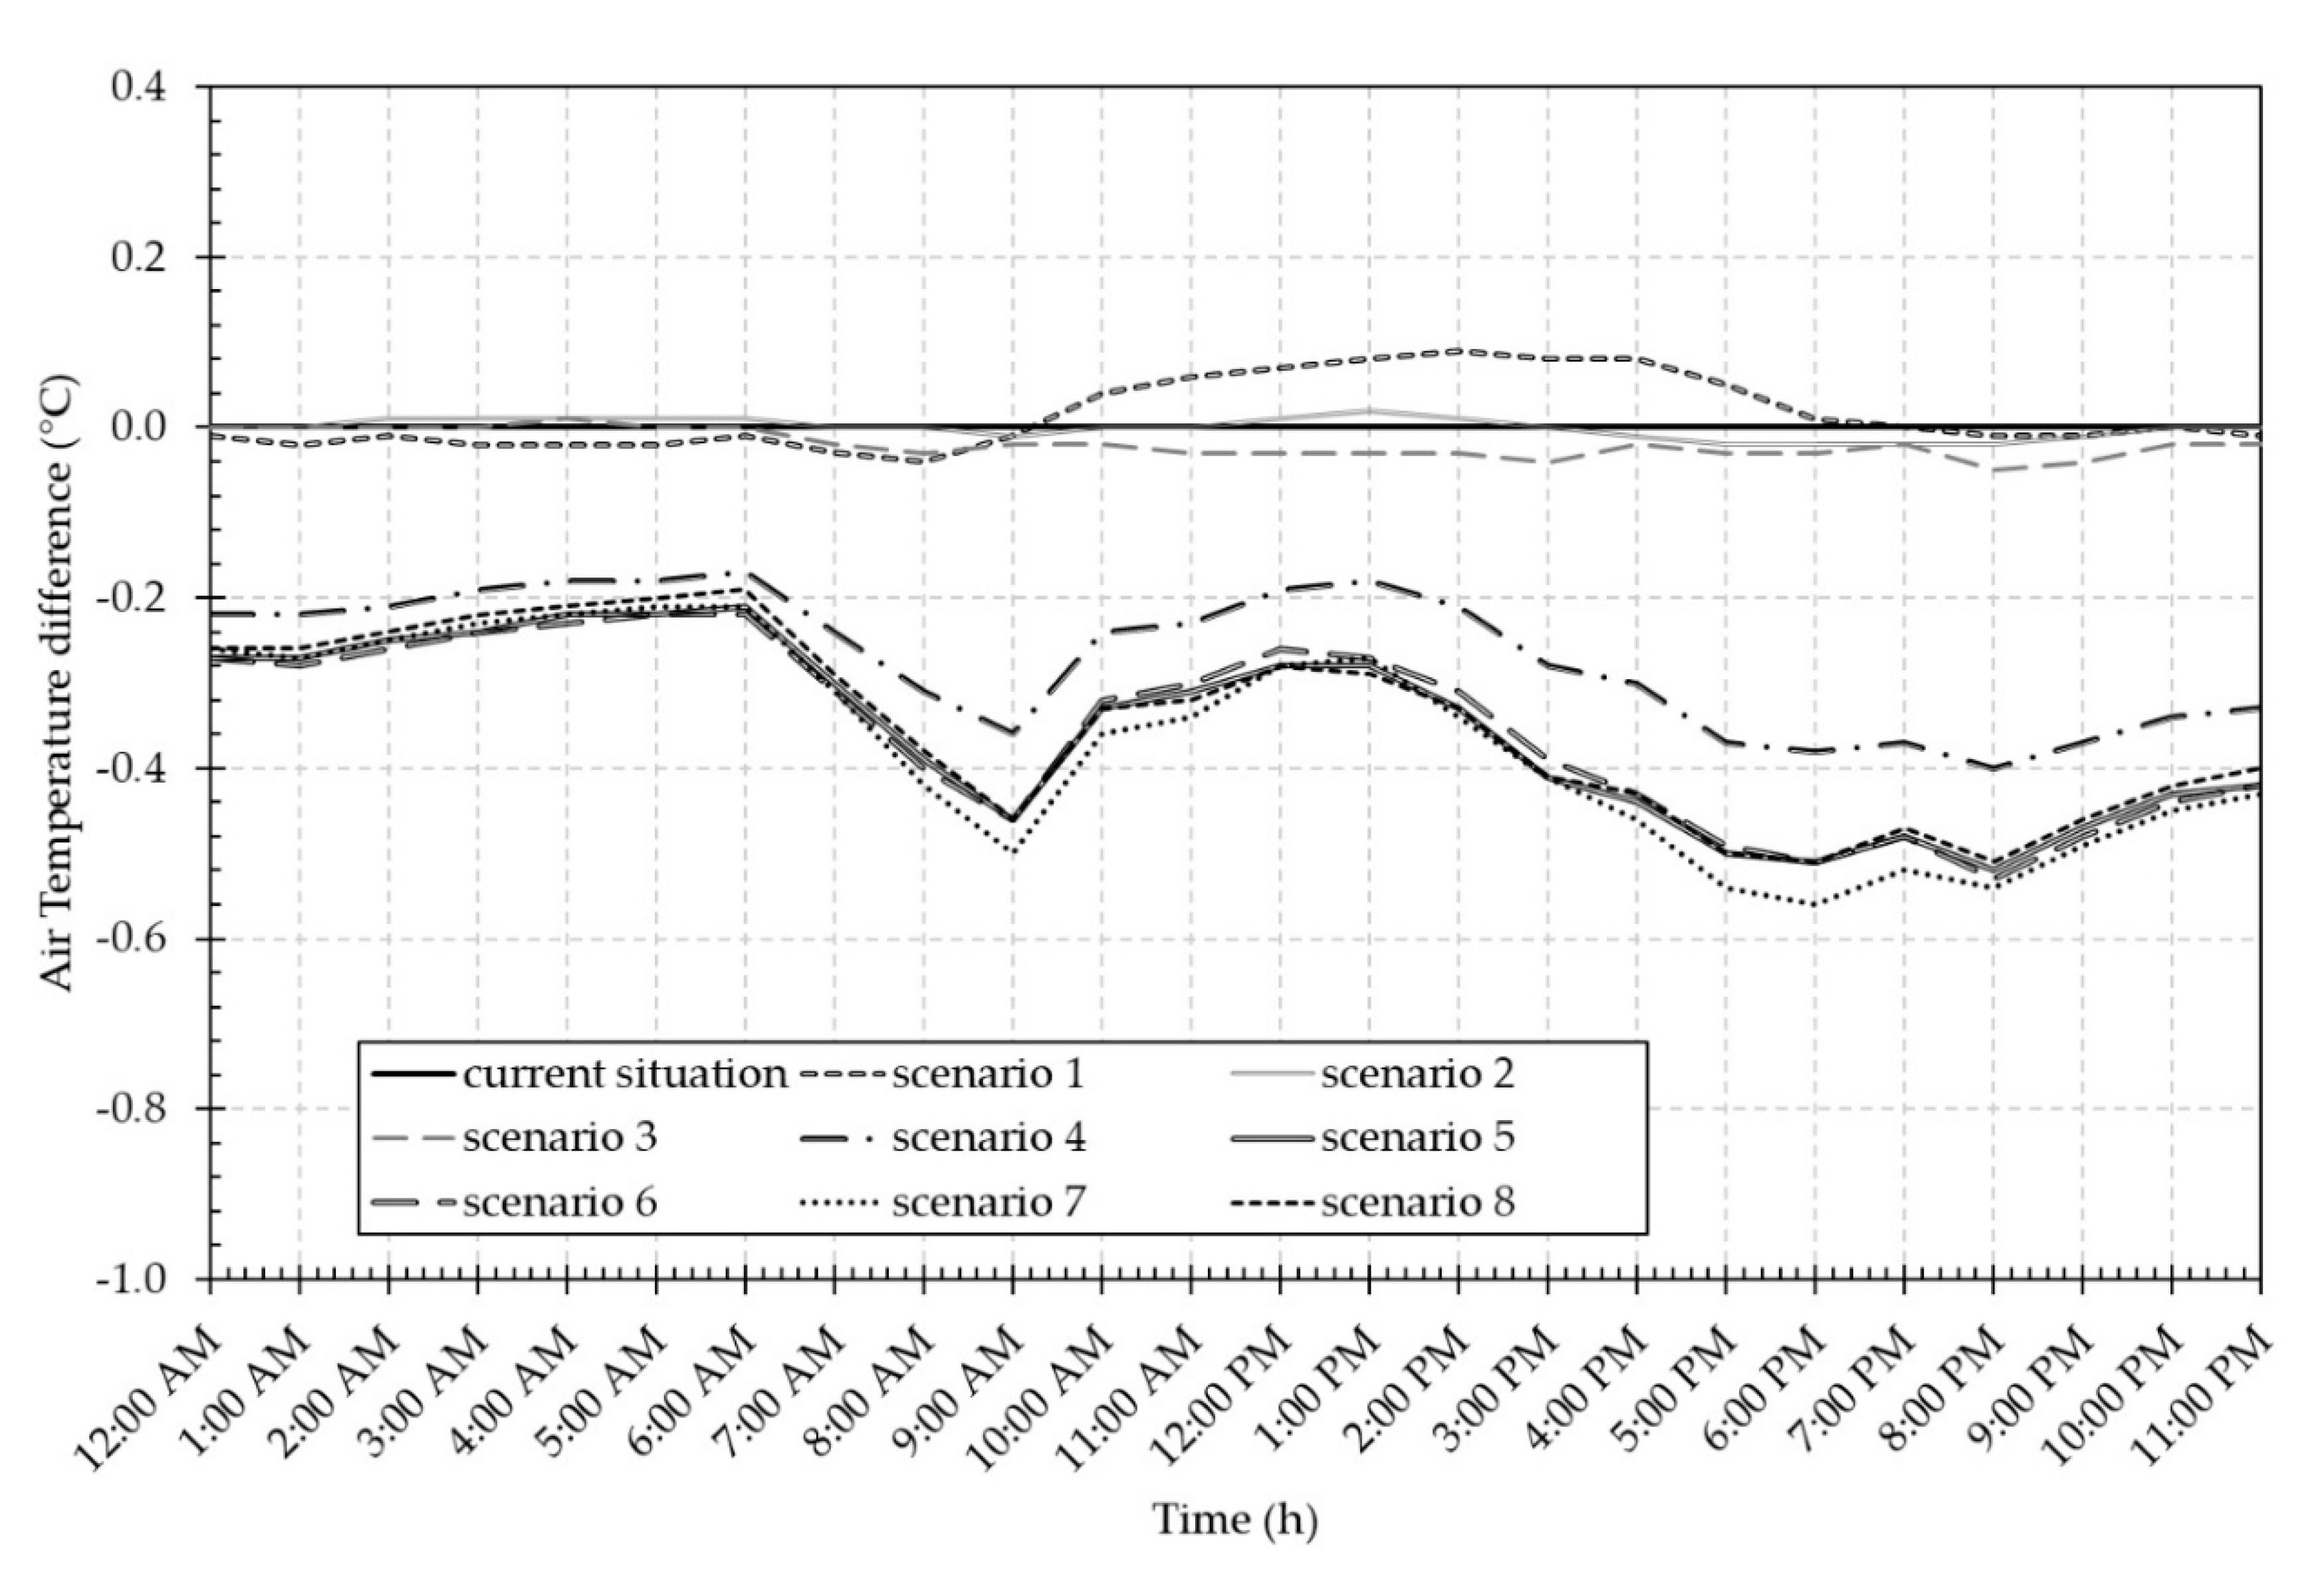
3.3. Air Temperature Spatial Variation

The obtained results concern the comparison between the current situation and the simulations with the selected mitigation techniques. Figure 11, Figure 12 and Figure 13 show the air temperatures at a height of 1.5 m above the ground, respectively, at 6 a.m., 12 a.m. and 6 p.m. In Figure 14 and Figure 15 are reported air temperature results on receptor T2 and T5. The average and maximum air temperature differences between the current situation and the specific scenario in the receptors T2 and T5 are listed in Table 4.
Focusing on the results related to the paved surface area, it is possible to notice that all the mitigation techniques led to a decrease of the air temperature in terms of daily average values. In particular, the results shown in Figure 11 and Table 4 allow to observe daily average air temperature decreases ranging from −0.28 °C to −0.03 °C, with maximum differences from −0.28 °C to 0.78 °C. During the hottest hours of the day (see Figure 10), it is possible to notice that the adoption of trees with a height of 5 or 15 m led to an increase of the air temperature due to their capability to hinder the wind, that in these hours, has more importance instead of their shading effects. The use of cool pavements decreased the daily average air temperature of −0.22 °C, reaching the maximum values during the hottest hours of the day. The use of a canopy in the parking area did not lead to a noteworthy air temperature variation on the paved surface area. The introduction of lawn (Scenario 5, Scenario 6 and Scenario 7), instead of the use of cool pavement, led to the air temperature reduction throughout the day and, despite Scenario 3, reached the maximum air temperature decrease during the evening.
Regarding the parking area, the use of trees and cool pavements in the near paved surface area did not lead to a significant variation of the air temperature. As a matter of fact, Figure 12 shows a slight air temperature variation despite the current situation and, in Table 4, it is possible to notice that both the average daily and the maximum air temperature differences for Scenario 1, Scenario 2 and Scenario 3 are approximately 0 °C. For the parking area, the use of a canopy can be considered the main solution for achieving a reduction of the air temperature. Scenario 4 led to a daily average air temperature decrease of −0.27 °C, with a maximum difference equal to −0.40 °C if compared to the current situation. The use of lawn in the paved surface area allowed the reduction of the air temperature also in the parking area, as demonstrated in Scenario 5, in which the average value is −0.36°C and the maximum difference is −0.52 °C. Lastly, the effect of the canopy is more evident in the evening, during which the air temperature difference compared to the current situation is maximum. This is due to the non-overheating of the parking pavement during the day.

4. Conclusions

An experimental and numerical investigation of the climatic conditions in a university area in Rome was achieved, along with evaluating the occurrence of the UHI phenomenon. A preliminary analysis of the UHI phenomenon was carried out and an average urban heat island index equal to 1.14 °C was identified, with a peak value equal to 5.9 °C. This preliminary assessment led to a more detailed investigation using a simulation code.
A calibrated model was generated through the software ENVI-met and different mitigation strategies were tested, in order to reduce the overheating of the area. So, eight different scenarios were compared with the actual state, testing the effects of trees, cool pavements and lawn, as well as considering combinations among them.
The obtained results allow to conclude that:
  • purposes during the design phase should account not only buildings but also external areas, and this aspect should also concern university campuses;
  • during the warmest hours of the day, trees with a height of 5 m or 15 m allowed to reach an air temperature increase due to their capability to hinder the wind (a more important effect instead of their shading capability);
  • cool pavements decreased the daily average air temperature of −0.22°C;
  • lawn, instead of cool pavement, led to an air temperature reduction throughout the day, reaching the highest air temperature reduction during the evening;
  • combined mitigation solutions allowed to reach better results in terms of air temperature reduction; considering the receptor T2 and a campus opening period from 8:00 a.m. to 8:00 p.m., the best solution is represented by Scenario 8. On the other hand, considering the receptor T5, the best solution is represented by Scenario 5. In both cases, the parking area canopy plays an important role for achieving an air temperature reduction.
Therefore, the analysis of this case study and the performed simulations led to the conclusion that careful choices must be made during the design phase of an area, even when it comes to universities. More in general, objectives and priorities in the design phase should concern not only buildings but also external areas, but this conceptual paradigm needs to be also applied for university areas. Therefore, during the requalification of urban areas involving both buildings and outdoor areas, different skills must be combined and applied.
The results obtained can be considered preliminary, as this investigation cannot be considered completed. Future developments will concern some aspects: a more detailed analysis of the local UHI; more detailed simulations, making on-site measurements of relative humidity and solar radiation for more than a day; the influence of these mitigation strategies on the thermal loads of the ex-towing tank building will be assessed, for better clarifying the effect of the obtained results on building energy performance; finally, an investigation on outdoor thermal comfort could be conducted which could be performed both numerically and experimentally.

Author Contributions

Conceptualization, G.B., L.E. and C.G.; methodology, G.B., L.E. and C.G.; software, G.B.; validation, G.B. and L.E.; investigation, G.B. and L.E.; resources, L.E., C.G., R.D.L.V., E.D.L.V. and F.A.; writing—original draft preparation, G.B., L.E., C.G., R.D.L.V., E.D.L.V. and F.A.; writing—review and editing, G.B., L.E., C.G., R.D.L.V., E.D.L.V. and F.A.; supervision, F.A. All authors have read and agreed to the published version of the manuscript.

Funding

This research received no external funding.

Conflicts of Interest

The authors declare no conflict of interest.

References

  1. Thompson, R.D.; Perry, A.; Oke, T.R. Urban Climates and Global Environmental Change. In Applied Climatology: Principles and Practice; Routledge: London, UK, 1997; pp. 273–287. [Google Scholar]
  2. Oke, T.R.; Johnson, G.T.; Steyn, D.G.; Watson, I.D. Simulation of surface urban heat islands under ‘‘ideal’’ conditions at night: Part 2. Diagn. Causat. Bound. Layer Meteorol. 1991, 56, 339–358. [Google Scholar] [CrossRef]
  3. Battista, G.; de Lieto, R.V.; Zinzi, M. Assessment of urban overheating mitigation strategies in a square in Rome, Italy. Solar Energy 2019, 180, 608–621. [Google Scholar] [CrossRef]
  4. IPCC. Climate Change 2007: Synthesis Report. Contribution of Working Groups I, II and III to the Fourth Assessment Report of the Intergovernmental Panel on Climate Change; IPCC: Geneva, Switzerland, 2007; p. 104. [Google Scholar]
  5. Van der Schriek, T.; Varotsos, K.V.; Giannakopoulos, C.; Founda, D. Projected Future Temporal Trends of Two Different Urban Heat Islands in Athens (Greece) under Three Climate Change Scenarios: A Statistical Approach. Atmosphere 2020, 11, 637. [Google Scholar] [CrossRef]
  6. Adachi, S.A.; Kimura, F.; Kusaka, H.; Inoue, T.; Ueda, H. Comparison of the impact of global climate changes and urbanization on summertime future climate in the Tokyo Metropolitan Area. J. Appl. Meteorol. Climatol. 2012, 51, 1441–1454. [Google Scholar] [CrossRef]
  7. McCarthy, M.P.; Harpham, C.; Goodess, C.M.; Jones, P.D. Simulating climate change in UK cities using a regional climate model, HadRM3. Int. J. Climatol. 2012, 32, 1875–1888. [Google Scholar] [CrossRef]
  8. Georgescu, M.; Moustaoui, M.; Mahalov, A.; Dudhia, J. Summer-time climate impacts of projected megapolitan expansion in Arizona. Nat. Clim. Chang. 2013, 3, 37–41. [Google Scholar] [CrossRef]
  9. Argueso, D.; Evans, J.P.; Fita, L.; Bormann, K.J. Temperature response to future urbanization and climate change. Clim. Dyn. 2014, 42, 2183–2199. [Google Scholar] [CrossRef]
  10. Founda, D.; Santamouris, M. Synergies between Urban Heat Island and Heat Waves in Athens (Greece), during an extremely hot summer (2012). Sci. Rep. 2017, 7, 1–11. [Google Scholar] [CrossRef] [Green Version]
  11. Heaviside, C.; Vardoulakis, S.; Cai, X.M. Attribution of mortality to the urban heat island during heatwaves in the West Midlands, UK. Environ. Health A Glob. Access Sci. Source 2016, 15 (Suppl. S1), 49–59. [Google Scholar] [CrossRef] [Green Version]
  12. Guattari, C.; Evangelisti, L.; Balaras, C.A. On the assessment of urban heat island phenomenon and its effectson building energy performance: A case study of Rome (Italy). Energy Build. 2018, 158, 605–615. [Google Scholar] [CrossRef]
  13. Santamouris, M. Cooling the cities—A review of reflective and green roof mitigation technologies to fight heat island and improve comfort in urban environments. Sol. Energy 2014, 103, 682–703. [Google Scholar] [CrossRef]
  14. Borbora, J.; Das, A.K. Summertime Urban Heat Island study for Guwahati City, India. Sustain. Cities Soc. 2014, 11, 61–66. [Google Scholar] [CrossRef]
  15. O’Malley, C.; Piroozfar, P.; Farr, E.R.; Pomponi, F. Urban Heat Island (UHI) mitigating strategies: A case-based comparative analysis. Sustain. Cities Soc. 2015, 19, 222–235. [Google Scholar] [CrossRef] [Green Version]
  16. Fabiani, C.; Pisello, A.L.; Bou-Zeid, E.; Yang, J.; Cotana, F. Adaptive measures for mitigating urban heat islands: The potential of thermochromic materials to control roofing energy balance. Appl. Energy 2019, 247, 155–170. [Google Scholar] [CrossRef]
  17. Farhadi, H.; Faizi, M.; Sanaieian, H. Mitigating the urban heat island in a residential area in Tehran: Investigating the role of vegetation, materials, and orientation of buildings. Sustain. Cities Soc. 2019, 46, 101448. [Google Scholar] [CrossRef]
  18. Taleghani, M.; Crank, P.J.; Mohegh, A.; Sailor, D.J.; Ban-Weiss, G.A. The impact of heat mitigation strategies on the energy balance of a neighborhood in Los Angeles. Solar Energy 2019, 177, 604–611. [Google Scholar] [CrossRef]
  19. Imran, H.M.; Kalab, J.; Nga, A.W.M.; Muthukumaran, S. Effectiveness of vegetated patches as Green Infrastructure in mitigating Urban Heat Island effects during a heatwave event in the city of Melbourne. Weather Clim. Extrem. 2019, 25, 100217. [Google Scholar] [CrossRef]
  20. He, B.J. Towards the next generation of green building for urban heat island mitigation: Zero UHI impact building. Sustain. Cities Soc. 2019, 50, 101647. [Google Scholar] [CrossRef]
  21. Lai, D.; Liu, W.; Gan, T.; Liu, K.; Chen, Q. A review of mitigating strategies to improve the thermal environment and thermal comfort in urban outdoor spaces. Sci. Total Environ. 2019, 661, 337–353. [Google Scholar] [CrossRef]
  22. Zhang, L.; Fukuda, H.; Liu, Z. Households’ willingness to pay for green roof for mitigating heat island effects in Beijing (China). Build. Environ. 2019, 150, 13–20. [Google Scholar] [CrossRef]
  23. Bruse, M.; Fleer, H. Simulating surface–plant–air interactions inside urban environments with a three dimensional numerical model. Environ. Model. Softw. 1998, 13, 373–384. [Google Scholar] [CrossRef]
  24. Tsoka, S.; Tsikaloudaki, A.; Theodosiou, T. Analyzing the ENVI-met microclimate model’s performance and assessing cool materials and urban vegetation applications–A review. Sustain. Cities Soc. 2018, 43, 55–76. [Google Scholar] [CrossRef]
  25. Lee, H.; Mayer, H.; Chen, L. Contribution of trees and grasslands to the mitigation of human heat stress in a residential district of Freiburg Southwest Germany. Landsc. Urban Plan 2016, 148, 37–50. [Google Scholar] [CrossRef]
  26. Karimi, A.; Sanaieian, H.; Farhadi, H.; Norouzian-Maleki, S. Evaluation of the thermal indices and thermal comfort improvement by different vegetation species and materials in a medium-sized urban park. Energy Rep. 2020, 6, 1670–1684. [Google Scholar] [CrossRef]
  27. Fikfak, A.; Lavtižar, K.; Grom, J.P.; Kosanović, S.; Zbašnik-Senegačnik, M. Study of urban greenery models to prevent overheating of parked vehicles in P + R facilities in Ljubljana, Slovenia. Sustainability 2020, 12, 5160. [Google Scholar] [CrossRef]
  28. Huang, J.-M.; Chen, L.-C. A Numerical Study on Mitigation Strategies of Urban Heat Islands in a Tropical Megacity: A Case Study in Kaohsiung City, Taiwan. Sustainability 2020, 12, 3952. [Google Scholar] [CrossRef]
  29. Morakinyo, T.E.; Lam, Y.F. Simulation study on the impact of tree-configuration, planting pattern and wind condition on street-canyon’s micro-climate and thermal comfort. Build. Environ. 2016, 103, 262–275. [Google Scholar] [CrossRef]
  30. Wang, Y.; Zacharias, J. Landscape modification for ambient environmental improvement in central business districts-A case from Beijing. Urban For. Urban Green 2015, 14, 8–18. [Google Scholar] [CrossRef]
  31. Kaloustian, N.; Aouad, D.; Battista, G.; Zinzi, M. Leftover Spaces for the Mitigation of Urban Overheating in Municipal Beirut. Climate 2018, 6, 68. [Google Scholar] [CrossRef] [Green Version]
  32. Ambrosini, D.; Galli, G.; Mancini, B.; Nardi, I.; Sfarra, S. Evaluating Mitigation Effects of Urban Heat Islands in a Historical Small Center with the ENVI-Met® Climate Model. Sustainability 2014, 6, 7013–7029. [Google Scholar] [CrossRef] [Green Version]
  33. Tsoka, S.; Tsikaloudaki, K.; Theodosiou, T. Coupling a Building Energy Simulation Tool with a Microclimate Model to Assess the Impact of Cool Pavements on the Building’s Energy Performance Application in a Dense Residential Area. Sustainability 2019, 11, 2519. [Google Scholar] [CrossRef] [Green Version]
  34. Chen, Y.; Zheng, B.; Hu, Y. Numerical Simulation of Local Climate Zone Cooling Achieved through Modification of Trees, Albedo and Green Roofs—A Case Study of Changsha, China. Sustainability 2020, 12, 2752. [Google Scholar] [CrossRef] [Green Version]
  35. Yuan, J.; Emura, K.; Farnham, C. Is urban albedo or urban green covering more effective for urban microclimate improvement? A simulation for Osaka. Sustain. Cities Soc. 2017, 32, 78–86. [Google Scholar] [CrossRef]
  36. Evangelisti, L.; Guattari, C.; Asdrubali, F.; de Lieto Vollaro, R. An experimental investigation of the thermal performance of a building solar shading device. J. Build. Eng. 2020, 28, 101089. [Google Scholar] [CrossRef]
  37. Nardi, I.; Paoletti, D.; Ambrosini, D.; de Rubeis, T.; Sfarra, S. Validation of quantitative IR thermography for estimating the u-value by a hot box apparatus. J. Phys. Conf. Ser. 2015, 655, 012006. [Google Scholar] [CrossRef]
  38. López-Cabeza, V.P.; Galán-Marín, C.; Rivera-Gómez, C.; Roa-Fernández, J. Courtyard microclimate ENVI-met outputs deviation from the experimental data. Build. Environ. 2018, 144, 129–141. [Google Scholar] [CrossRef]
Figure 1. Location of the city of Rome (a); location of the case study in Rome (b); the old (c) and the renewed (d) towing tank building (an elaboration from [36]).
Sustainability 12 07971 g001
Figure 2. On-site measurements (a,b); views of the paved surface (c,d); views of the ex-towing tank building (e,f). The arrows point out the areas examined in the plan.
Sustainability 12 07971 g002
Figure 3. Case study materials: asphalt (a); large bricks of the paved surface (b); small bricks of the paved area (c); external panels of the sheds in front of the ex-towing tank building (d); panels of the ex-towing tank building (e).
Sustainability 12 07971 g003
Figure 4. Flow-chart of the main steps applied in this study.
Sustainability 12 07971 g004
Figure 5. ENVI-met model: top view with receptors.
Sustainability 12 07971 g005
Figure 6. Air temperature, relative humidity, wind velocity and wind direction measured by the weather station located near the investigated area (about 1.5 km away) on 22 July 2019.
Sustainability 12 07971 g006
Figure 7. ENVI-met models: top views. Actual situation and improved proposed scenarios.
Sustainability 12 07971 g007
Figure 8. Comparison between external air temperatures registered in Roma TRE University and in a green neighborhood in Rome during the first measurement campaign conducted in June 2018 (a) and registered on 11 June 2018 (b).
Sustainability 12 07971 g008
Figure 9. Temperature comparison between the brick paving and the green area.
Sustainability 12 07971 g009
Figure 10. Comparison between the air temperature measured in the receptors T1, T2, T3 and T4 and the simulation used to calibrate the model on 22 July 2019.
Sustainability 12 07971 g010
Figure 11. Air temperature field at 1.5 m above the ground, at 6:00 a.m.
Sustainability 12 07971 g011
Figure 12. Air temperature field at 1.5 m above the ground, at 12:00 p.m.
Sustainability 12 07971 g012
Figure 13. Air temperature field at 1.5 m above the ground, at 6:00 p.m.
Sustainability 12 07971 g013
Figure 14. Comparison of the air temperature between the current situation and the proposed scenarios inside the paved surface area (point T2).
Sustainability 12 07971 g014
Figure 15. Comparison of the air temperature between the current situation and the proposed scenarios inside the parking area (point T5).
Sustainability 12 07971 g015
Table 1. Materials’ emissivity and reflectance.
MaterialEmissivity (-)Reflectance (-)
Asphalt (Figure 3a)0.940.10
Large brick (Figure 3b)0.930.30
Small brick (Figure 3c)0.850.60
Shed panel (Figure 3d)0.900.50
Ex-towing tank panel (Figure 3e)0.800.88
Table 2. Numerical analysis setting parameters.
ParameterValue
Air temperature at 2 m (°C)Forced
Relative humidity at 2 m (%)Forced
Wind speed (m/s)1.37
Wind direction (°)191 (South-West)
Specific humidity at 2500 m (gwater vapor/kgair)7
Roughness length at measurement site (m)0.01
Initial atmosphere temperature (°C)27.39
Simulation start date (-)21 July 2019
Simulation start time (h)18
Total hours of simulation (h)30
Table 3. Mean Absolute Error (MAE) and Root Mean Square Error (RMSE) calculated for the receptors T1, T2, T3 and T4.
T1T2T3T4Average
MAERMSEMAERMSEMAERMSEMAERMSEMAERMSE
Sim11.281.411.071.251.051.201.201.321.151.30
Sim20.901.000.680.750.630.680.800.880.760.83
Sim31.071.150.840.940.810.890.971.050.921.01
Sim40.340.450.310.420.180.230.220.300.260.35
Sim50.260.350.250.350.160.240.160.220.210.29
Sim60.180.250.210.300.220.310.170.220.200.27
Table 4. Average and maximum differences in air temperature between the current situation and the various scenarios, in receptors T2 and T5. Values are referred to in Figure 9 and Figure 10.
Scenarios
12345678
Average
difference (°C)
T2−0.03−0.01−0.22−0.10−0.28−0.26−0.23−0.28
T50.010.00−0.02−0.27−0.36−0.35−0.37−0.35
Maximum
difference (°C)
T2−0.28−0.37−0.41−0.34−0.58−0.63−0.78−0.48
T50.09±0.02−0.05−0.40−0.52−0.53−0.56−0.51

