Article

CEO Pay Sensitivity (Delta and Vega) and Corporate Social Responsibility

1
Department of Finance, Arizona State University, Tempe, AZ 85281, USA
2
Ivey Business School, University of Western Ontario, London, ON N6A 3K7, Canada
3
Department of Economics, University of Western Ontario, London, ON N6A 3K7, Canada
*
Author to whom correspondence should be addressed.
Sustainability 2020, 12(19), 7941; https://doi.org/10.3390/su12197941
Submission received: 16 August 2020 / Revised: 11 September 2020 / Accepted: 23 September 2020 / Published: 25 September 2020
(This article belongs to the Section Economic and Business Aspects of Sustainability)

Abstract

:
We use CEO pay sensitivity to stock performance (delta) and stock volatility (vega) to provide empirical evidence that CEO compensation structure influences firm Corporate Social Responsibility (CSR) performance. We find that delta has no significant effect on CSR, while vega has a strong, causal relationship with CSR. Our findings suggest that CEOs do not view CSR as value enhancing, but as a way to increase their own compensation through vega. Firms that want to improve their social performance should consider vega as an important compensation incentive for executives.

1. Introduction

This paper draws a causal relation between CEO compensation structure and firm corporate social responsibility (CSR). To draw our conclusions, we examine the sensitivity of CEO pay to both stock return volatility (vega) and stock returns (delta) using panel data spanning 1995–2013. CEO compensation has a profound influence on firm outcomes such as financial performance and investment and policy decisions; however, its effects on firm social performance are underexplored. The scarce literature examining the link between executive compensation and CSR has focused solely on the instruments of compensation as opposed to the underlying pay sensitivities that those instruments produce. Some use a lagged measure of long-term executive pay [1] or the percentage of salary from bonus and stock options [2]. McGuire et al. [3] use salary, bonus, and long-term incentives, while Deckop et al. [4] use percentage of short-term pay vs. long-term-pay to link CEO compensation with CSR levels. Although these studies address how CEO pay motivates CSR participation, they fail to address the reasons behind these investments. By using pay sensitivities, we can understand the underlying motivations behind CSR investment from the CEO’s perspective, not just whether the investment is made. Higher vega incentivizes CEOs to pursue policies that will increase stock price volatility, whereas higher delta motivates the CEO to increase the stock price. Understanding how CEOs respond to incentives related to CSR is crucial to designing compensation policies that not only maximize shareholder value but also promote corporate citizenship in operating environments that are increasingly impacted by societal perceptions.
Employing fixed effects models and controlling for firm size, risk level, and industry, we find that CSR standing is significantly positively related to measures of vega but not significantly related to measures of delta. This suggests that CEOs view CSR investing as a risky policy, similar to what the previous literature concludes about R&D spending [5], financial leverage, and concentrated product lines [6,7,8]. That is, CEOs generally perceive CSR projects as riskier than the average projects they are running. It is plausible that CSR investments are usually for new innovative projects and, more importantly, impose enormous uncertainty to stock performance and shareholder value. Delta has no significant effect on CSR levels, which suggests that a CEO’s decisions on CSR are independent of their pay sensitivity to the underlying stock price. Our findings indicate that stock option compensation significantly increases the likelihood of CSR initiatives, but only to the extent that the CEO’s pay sensitivity to the underlying volatility of the stock price is increased. This paper links the existing CEO compensation literature with the CSR literature in a way that has not previously been explored.
In an ideal world, CEO and shareholder interests would perfectly align. Every decision a CEO makes would maximize shareholder value. However, managers solve their own maximization problem with the goal of increasing their own utility; this is known as the agency problem [9,10]. Corporate governance policies aim to ensure that managers act in a manner consistent with shareholder value maximization, and part of this goal is achieved through compensation policy [9,10]. An optimal compensation contract is one that promotes the managerial decision making that maximizes shareholder value. This involves exposing the CEO to varying risk/reward incentive combinations via cash, stock, and options payments in an effort to mitigate the agency problem [11]. Jenson and Murphy [12] argue that CEO pay should be substantially linked to shareholder welfare. This idea gained significant traction throughout the 1990s, and Hall and Liebman [13,14] document a dramatic increase in equity-based CEO compensation throughout this period. CEO compensation includes three components: cash, stock, and options. According to optimal contracting theory, when company boards determine CEO compensation, they target a compensation mix that they believe will maximize shareholder value by reducing agency costs [15]. This raises the question: how do CEOs respond to varying risk/reward combinations across compensation packages?
Naturally, CEO pay relating to the present cash component of compensation is independent of future stock price movements. However, equity-based compensation exhibits varying return characteristics depending on the instruments used. Stock-based compensation will move linearly with the stock price, resulting in a delta of 1; however, the sensitivity of options compensation depends entirely on the structure of the contracts. Given that CEOs are risk-averse and almost always highly exposed to firm specific risk, it is not enough to simply structure compensation policy to mimic the pay sensitivity of the shareholder. Even if managers are incentivized to take actions that increase shareholder wealth, they may still choose suboptimal policies that reduce personal portfolio risk [16]. Therefore, we need to understand the risks that the CEO faces, and how these risks influence decision making.
There is extensive literature examining the effect of delta and vega on CEO decision making [6,7,11]; however, the effect of delta and vega on CSR levels has not previously been explored. This shareholder value-maximization problem is further complicated by the issue of whether CSR is indeed a value-enhancing investment opportunity for a given firm. There is much debate surrounding this question in the existing literature [17,18,19,20]. Although it is beyond the scope of this paper to answer this question definitively, we contribute to the existing literature by identifying vega as an avenue that shareholders can use to encourage CEOs to alter CSR standings.
The remainder of this paper is organized as follows. In the following section, we review relevant literature and develop hypotheses. Section 3 introduces our data sample, and Section 4 presents empirical findings and discussion. Section 5 concludes.

2. Literature Review and Hypothesis Development

This section serves as a review of existing literature relating to the topics of both CEO compensation and corporate social responsibility. We will begin by surveying the existing literature regarding CEO compensation, followed by the CSR literature, and conclude with a brief discussion of how we plan to link these literatures in a unique way to gain insight into how CEOs alter CSR levels in response to compensation incentives.
As a means to mitigate costs arising from agency concerns, Jensen and Murphy [12] argue that CEO compensation should be substantially linked to shareholder value. They argue that since managerial actions and investment opportunities are not perfectly observable to shareholders, equity-based compensation encourages managerial actions that increase shareholder wealth. In accordance with this assertion, throughout the 1990s, there was a dramatic increase in both stock option compensation [21,22] and the sensitivity of CEO pay to the firm’s stock price [14,23]. Perry and Zenner [22] raise the question of whether the increase in executive pay performance sensitivity is excessive, in that during bull markets (such as that of the 1990s), CEOs may be extracting excess rents from shareholders. This idea is built upon that by Bebchuk et al. [15], where the issue of CEO power is explored as a rationale for puzzling compensation practices, such as the lack of controls to filter out general market/sector factors influencing the share price when designing equity-based compensation packages. Bebchuk et al. [15] explore the idea that company boards are constrained when setting CEO compensation by CEO power. The argument is that powerful CEOs wield a degree of influence over the board and can use this influence to alter their own compensation structure, thereby extracting rents from shareholders. The CEO power approach to analyzing CEO compensation contracts contrasts the previous optimal contracting literature and has opened new avenues of study.
Much of the literature agrees that linking CEO compensation to shareholder wealth can reduce agency costs in many circumstances if implemented effectively. However, given the concerns surrounding imperfect information, ex-post contract enforcement feasibility, and the heterogeneity of both shareholders and CEOs, determining the appropriate compensation mix to maximize shareholder value is a contentious issue. A large problem with the idea of simply linking CEO compensation to shareholder wealth is that risk-averse CEOs are overly exposed to firm-specific risk because of equity-based compensation. This is a contrast to diversified shareholders who are owners of many firms and whose net worth is less sensitive to changes in the price of a given firm. Smith and Stulz [16] build on Ross [24] to demonstrate how risk-averse CEOs can be influenced to forgo positive NPV (net present value) projects when their total pay is linked to firm value. One solution to this problem is to mitigate the concavity of the utility of expected pay by using convex incentive schemes involving stock options. Guay [11] finds that providing managers with convex incentive schemes encourages managers to invest in risk-increasing, positive NPV projects. However, the question of how much convexity to provide to a given manager remains elusive. Indeed, Ross [25] proves that there exists no incentive schedule that renders all expected utility maximizers less risk averse.
There is a host of literature that details the responses of CEOs to the incentives created by options within a compensation structure. Defusco et al. [26] find that firms that approved executive stock options plans between 1978 and 1988 exhibited increased stock return variance. Ju et al. [27] show that usage of call options can induce either too much or too little risk-taking behavior. Jolls [28] shows that CEOs that are compensated with options are more likely to engage in stock repurchases rather than dividend issuance. Knopf et al. [8] show that the use of derivatives for hedging purposes within firms is negatively related to vega and positively related to delta. Ryan and Wiggins [5] find that stock option grants coincide with increases in R&D spending. The most intriguing findings are provided by Cohen et al. [6]. The authors augment the Hall–Liebman [13] database on executive options holdings and value the holdings using the Black–Scholes [29] method. They then compute the elasticity of CEO pay to changes in firm price volatility and find that executives respond to the incentives provided by options compensation. The authors further speculate, however, that as vega increases, CEOs may undertake negative NPV projects if they increase firm volatility. This is a key finding related to our paper because it raises the question of what CEOs may do in the face of uncertainty surrounding the profitability of investment projects.
Despite the extensive agreement in the literature that CEOs respond to the incentives created by compensation structure, there is often debate concerning the significance, magnitude and direction of various effects. There is a body of literature that takes advantage of the closed form solution of the Black–Scholes option-pricing model to take derivatives of option prices with respect to the underlying price (delta) and volatility (vega) [7,30,31,32]. However, how delta and vega fit into a given model has been interpreted in a wide variety of ways. Some studies try to use firm characteristics to estimate delta as a dependent variable [30,31], while others use delta as an independent variable [32]. Many studies omit vega altogether, partly because vega is difficult to compute and it is easier to find proxies for delta, such as number of options held, options granted, or the value of options at a point in time. To a large extent, this problem was remedied by Core and Guay [30] who developed a method to increase the accuracy of delta and vega estimates. Following this innovation, Coles et al. [7] reasoned that both vega and delta should be treated as independent variables that are chosen exogenously by shareholders to promote desired decision making in CEOs. They used the method of Core and Guay [30] to determine that higher vega results in the implementation of riskier firm policies, including higher R&D spending, less CAPEX, more concentrated product lines, and higher leverage. They also find that delta is generally inversely related to vega for these measures. From an optimal contracting perspective, the key point is that delta aligns the direction of managerial pay changes with that of the shareholders, while vega can be used to mitigate risk aversion.
All the above studies lead to a natural question: how is CSR as an investment perceived by CEOs? In order to answer this question, we need to obtain both an understanding of what CSR is and how to quantify it. Tsoutsoura [33] defines CSR as “a comprehensive set of policies, practices, and programs that are integrated into business operations, supply chains, and decision-making processes throughout the company and usually includes issues related to business ethics, community investment, environmental concerns, governance, human rights, the marketplace as well as the workplace”. However, the question of how to quantify CSR has been approached from multiple angles. Some studies use subjective measures such as surveys [34,35,36], while others use Fortune rankings [17,37,38]. Waddock and Graves [39] recognized the need for a more objective way to quantify CSR. They made use of the Kinder Lydenberg Domini (KLD) corporate social performance (CSP) rating system, which draws upon a combination of financial statements, press articles, academic journals, and government reports to assess CSP along eight dimensions. The advantage of this approach is that KLD is an independent ratings service (since acquired by MSCI) that applies objective criteria consistently across time. Using this improved method, Waddock and Graves [39] find that CSP is initially driven by slackness in the budget constraints of firms that have high financial performance, but that CSP itself also creates positive financial performance. These findings concur with the positive relationship between firm performance and CSP found in the past [17,40,41]. However, it contrasted with both the negative relation hypothesized by Friedman [42] and the findings of a neutral relation by Ullmann [43]. Therefore, we have the alternative hypotheses based on the literature:
Hypothesis 1a (H1a).
CEOs with higher pay-performance sensitivity improve CSR if they view CSR as value enhancing.
Hypothesis 1b (H1b).
CEOs with higher pay-performance sensitivity decrease CSR if they view CSR as value damaging.
Hypothesis 2a (H2a).
CEOs with higher pay-risk sensitivity improve CSR if they view CSR as risk enhancing.
Hypothesis 2b (H2b).
CEOs with higher pay-risk sensitivity decrease CSR if they view CSR as risk reducing.
CSR affects firms through other avenues besides accounting profitability. Gregory et al. [44] look at the risk-reducing effects of CSR, and Albuquerque et al. [45] examine how CSR diversifies risk within firms. The relationship between CSR and better access to financing, along with lower financing costs, is also explored [46,47,48]. Attig et al. [49] find that CSR leads to higher credit ratings. Servaes and Tamayo [50] consider how CSR raises firm value through increased customer awareness. The effects of CSR on corporate governance, firm value, and as a method of resolving conflicts between stakeholders is explored by Jo and Harjoto [51]. Jo and Harjoto [52] look at the causal effect of CSR on corporate governance. Hong et al. [53] and Ikram et al. [54] use hand collected compensation data to show that giving executives direct incentives related to CSR is effective at increasing CSP.
There is a wide body of literature indicating that CSR affects firms through a variety of channels. Part of this literature seeks to determine how executive compensation affects CSR [53,54]; however, this is performed by examining explicit incentives provided to executives. Our paper uses a new method to explore the relationship between CSR and compensation. Previous studies have focused on whether CEO compensation influences CSR ratings. Using pay sensitivities, we address the actual mechanism through which CEOs make their decision. We use the method of Coles et al. [7] to determine CEO delta and vega and then formulate a fixed effects model to estimate their effect on firm CSR ratings. As opposed to examining how CEOs respond to direct incentives, this approach examines how CEOs perceive CSR investment opportunities independent of other incentive frameworks.

3. Data

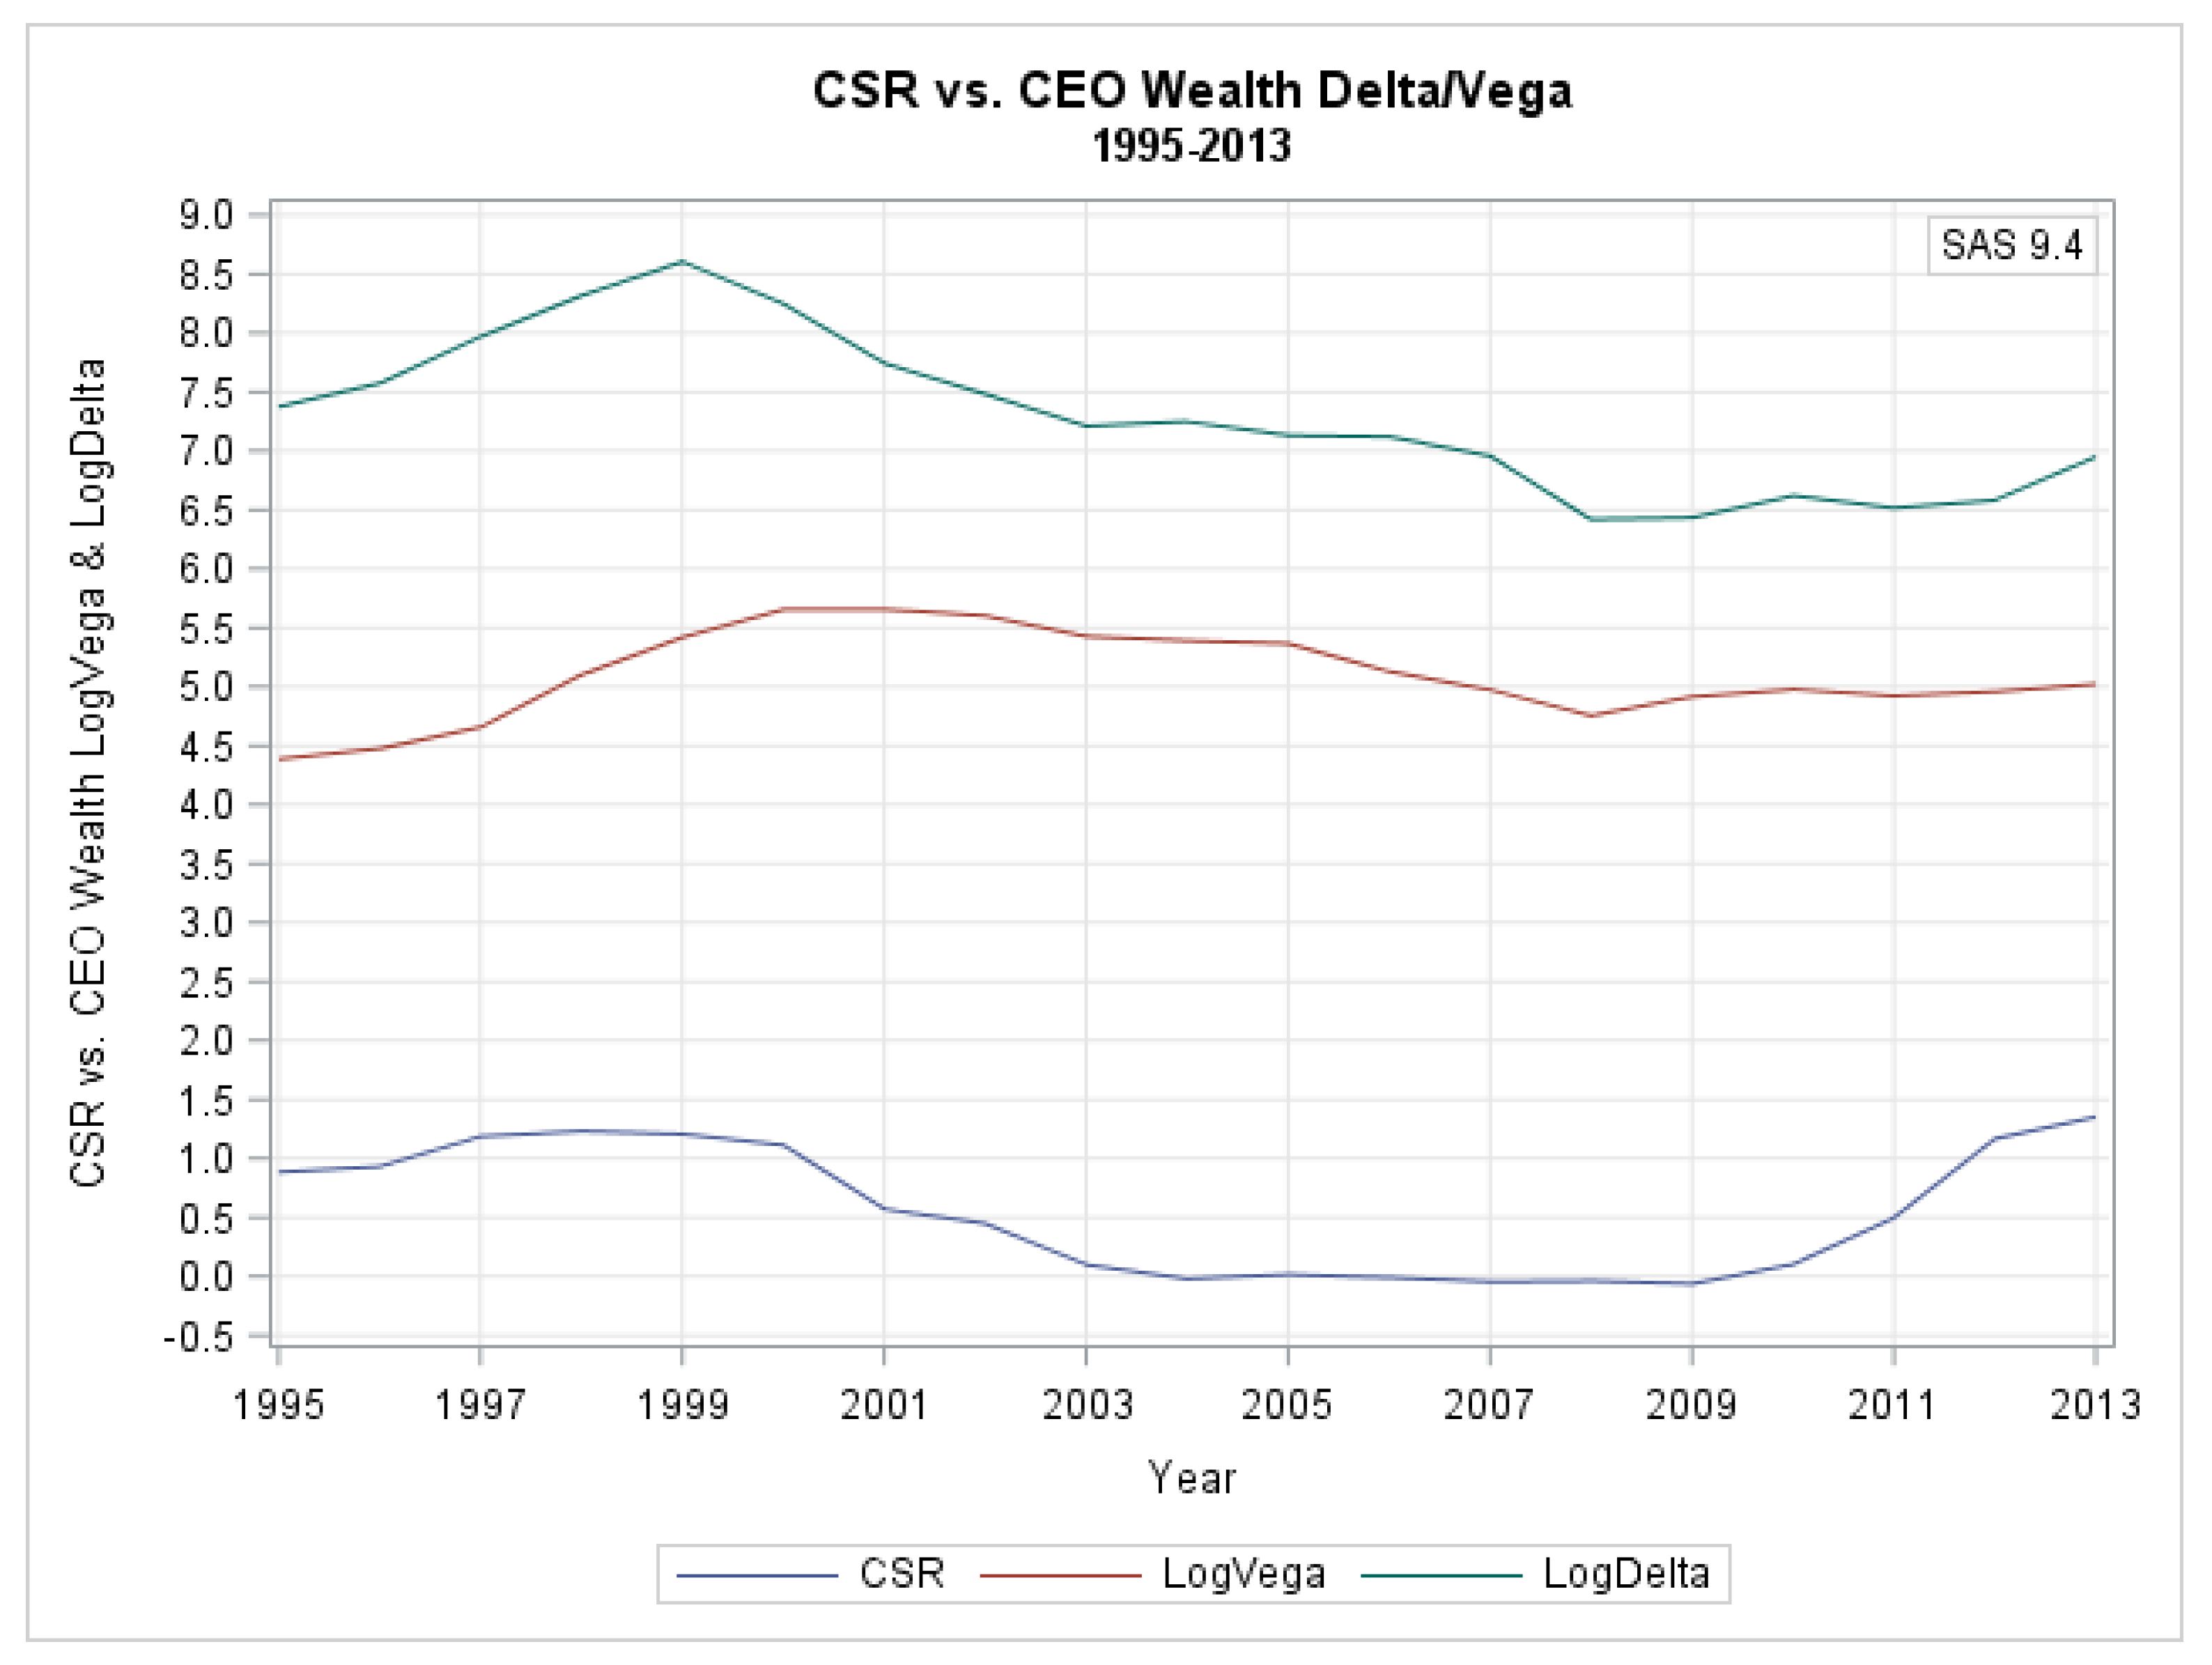
We created a panel dataset spanning 1995–2013 using firm fundamental data, executive compensation data, CSR ratings, and CEO pay sensitivity data. The firm fundamentals data were obtained using the Standard and Poor’s COMPUSTAT North America database which covers all public firms listed in the U.S. across all industries. This database contains detailed, up-to-date firm fundamentals information for North American securities. The database uses SEC (the U.S. Securities and Exchange Commission) filings to track firm balance sheet, income statement, and cash flow statement entries on an annual, quarterly, and year-to-date basis. We used firms’ unique identifier (GVKEY) to follow changes in firm fundamentals through time. We gather measures of Total Debt (DT), Total Assets (AT), Research and Development Expense (XRD), Total Sales (REVT), and Industry SIC Code (SIC). We then computed the variables Debt-to-Assets (DTA), LogAssets, LogSales, and LogR&D. These variables were later used as controls for firm size, firm risk, and industry when we constructed our model. For example, we used total sales and total assets as proxies for firm size in accordance with Tsoutsoura [33]; we controlled for R&D expenses following McWilliams and Siegel [55].
We obtained executive compensation data from the Standard and Poor’s EXECUCOMP database. This database provides detailed compensation data for the highest paid executives at over 3462 firms that are part of the S&P 1500 index or were once part of the index and whose securities remain publicly traded. This database allows us to separate annual CEO compensation into its cash, stock, and options components. The data start in 1992, but the post-1994 data contain a much larger number of firms due to expansion of the database’s mandate. The database also provides each executive with a permanent ID (EXECID), as well as each firm/executive combination with a unique identifier during their tenure (CO_PER_ROL). Data are reported on a fiscal year basis and contain information on cash awards, vested/unvested stock and options awards, deferred compensation, and pension awards. For a given year, a firm’s CEO can be identified using the CEOANN flag variable.
CSR data were obtained using the MSCI ESG Stats Data Set. This is the same Kinder, Lydenberg, and Domini (KLD) data used in the previous literature [33,39,56,57], but the dataset is now managed by MSCI, who acquired KLD in 2010. The KLD data are collected by a global team of over 140 research analysts. They assess how well companies manage environmental, social, and governance (ESG) risks using macro data, company disclosures, government databases, news articles, and NGO data. Each company is then assigned a positive or negative indicator for ESG performance, and firms are invited to verify the findings. The dataset contains yearly ESG indicators for over 2600 firms. For the purposes of constructing the CSR rating, an ESG strength was assigned a score of +1, while a concern was given a score of −1. We used six different ESG strength/concern criteria in our analysis: company, diversity, employee, environmental, human rights, and product. We excluded the corporate governance category, following the literature. In our research setting, corporate governance measures may well be the determinants of CEO incentives, which defeats our attempt to study how incentives lead to social performance. We then summed the total strengths and concerns for firms to obtain our CSR rating variable.
Since Waddock and Graves [39], KLD data as a measure of corporate social responsibility have become increasingly popular [33]. Tsoutsoura [33] measures CSR using both the KLD ratings data for S&P 500 companies and the Domini 400 Social index (DSI 400). She follows the method of McWilliams and Siegel [55] by creating a dummy variable for CSP that is equal to 1 if a firm is included in the DSI 400 and 0 otherwise. She also uses COMPUSTAT to find measures of firm performance through accounting measures such as return on assets (ROA), return on equity (ROE), and return on sales (ROS). She then creates a panel dataset spanning 1996–2000 and adds control variables to account for firm risk, size, and industry. Previous studies [17,39,41] find that CSR is positively related to firm profitability.
Data on CEO pay sensitivity to the underlying stock price (delta) and stock volatility (vega) are obtained via the Core et al. [30] and Coles et al. [7] datasets. The authors use EXECUCOMP data to determine the number of vested and unvested stock and options holdings of each executive, as well as the expiration dates of the options. They then use the closed form solution of the Black–Sholes option-pricing model to compute delta and vega estimates for each individual CEO. We merged this CEO pay sensitivity data with our COMPUSTAT, EXECUCOMP, and KLD data using YEAR and GVKEY variables. This gave us a dataset that provides a complete picture of CEO pay sensitivity, firm characteristics, and CSR ratings over time.

4. Analysis and Discussion

4.1. Univariate Analysis

Table 1, Table 2 and Table 3 provide summary statistics for CSR ratings, delta sensitivities, and vega sensitivities across our sample over time. Figure 1 presents a graphic representation of Log(Delta), Log(Vega), and firm CSR rating over time. Table 4 provides a correlation matrix for these variables.
From the results of our correlation matrix in Table 4, we can see that CSR was positively correlated with delta and vega measures. We can also see that CSR was negatively correlated with financial leverage (DTA) and positively correlated with our proxies for firm size (LogAssets and LogSales) as well as R&D expense (LogXRD) which we used as a proxy for firm type. These univariate results present contrasting information on how to perceive CSR. On one hand, positive correlation with R&D expense points us in the direction that CSR is perceived as a risky investment policy. On the other hand, negative correlation with financial leverage leads us to the opposite conclusion. One potential explanation to this discrepancy is that many firms with high CSR ratings are in industries where equity plays a greater role in the capital structure, but R&D is a crucial part of the business. The technology sector is one such industry. Many technology companies do not have the cash flow necessary to sustain a leveraged capital structure, and therefore, rely heavily on equity for financing. However, these companies must also spend considerable funds on R&D to stay competitive. In order to fully understand this type of problem, we must turn to multivariate analysis.

4.2. Multivariate Analysis

We created a model to determine how CEO pay sensitivity is linked to firm CSR ratings. Using fixed effect estimation, we constructed a model to test the causal relationship between delta, vega, and CSR ratings. Our first hypothesis was that if CEOs view CSR as a positive NPV investment, they will invest resources into CSR initiatives, which should increase the firm’s CSR rating. If CEOs view CSR as a nonpositive NPV investment, they will not invest resources into CSR initiatives, thereby decreasing or keeping constant the firm’s CSR rating. In our fixed effects model, this should result in a positive sign on the coefficient of the delta parameter since higher delta incentivizes CEOs to pursue positive NPV projects. Our second hypothesis is that if CEOs view CSR as an investment that increases firm risk, then they will pursue more CSR projects as vega increases. This should lead to a positive coefficient estimate on the vega parameter. We also used control variables to remove firm size, risk, and industry effects from our estimates. We computed a variety of models to test our hypotheses for different combinations of both current period and lagged values of delta and vega. Each model that we tested follows this basic structure:
CSR Rating = f(Delta, Vega, Assets, Sales, R&D Expenses, Debt-to-Assets Ratio)

4.2.1. Dependent Variables

Consistent with the prior executive compensation literature, we sought to link firm policy choices to CEO pay sensitivity using delta [30,32] and/or vega [7,30]. The noncontrol variables that we used in our analysis are Delta and Vega, as well as Delta_Lag and Vega_Lag, which are one period lags of Delta and Vega, respectively. We formulated various combinations of the model using these variables in order to determine how CEO pay sensitivity to these factors influences CSR at a given firm.

4.2.2. Control Variables

Firm risk, size, and industry have all been identified as factors that affect CSR [33,43,55]. We drew upon Tsoutsoura [33] and McWilliams and Siegel [55] to determine appropriate control variables for our model. Tsoutsoura [33] uses Debt-to-Assets (DTA) as a proxy for firm risk. She tests separate models using LogAssets and LogSales to proxy firm size and then classifies firms by industry to remove industry effects. We used this method apart from her solution for industry effects. Classifying firms by industry can be challenging, and as the number of industry classifications decreases, the averaging across firms makes for a less accurate inference. McWilliams and Siegel [55] note that R&D expense is a useful proxy for industry (i.e., firm type) once firm risk and size have been accounted for. This method allows us to avoid the averaging effect that industry classifications cause, resulting in stronger correlations and more powerful inferences. Therefore, as control variables, we tested separate models using both LogAssets (Model A) or LogSales (Model B) as proxy for size and used DTA to account for risk and R&D expense to account for firm type. In untabulated results, we controlled for a variety of additional firm, governance, and executive characteristics which we found did not change our main results.

4.3. Discussion

We computed 12 separate fixed effects models to properly understand the relationship between CSR and CEO pay sensitivity. Since the link between these two variables has not previously been studied, we felt it important to run several different models to properly determine the direction of the effects provided by delta and vega. The first point to note is that all 12 models were statistically significant at the 99% level as indicated by the F-test results. We ran each combination of Delta, Vega, Delta_Lag, and Vega_Lag using both LogAssets and LogSales as control variables for size. This is consistent with the method of Tsoutsoura [33]. We denoted the LogAssets models with an “A” and the LogSales models with a “B”. As per Table 5, Model A consistently outperformed Model B on an R-squared basis. For this reason, we viewed LogAssets as a superior proxy for size to LogSales for our purposes.
Both the Vega and Vega_Lag parameters were significant beyond the 99.99% level in every model in which they appeared. On the other hand, Delta was insignificant in every model in which it appeared with either Vega or Vega_Lag. Delta parameters were only ever significant in models in which they appeared alone without Vega parameters. From this, we conclude that CSR is primarily driven by Vega related parameters. Model 6A was the strongest of the 12 we produced. It used Vega_Lag as the noncontrol dependent variable and had an R-squared value of 0.103. The 12 models can be examined in further detail in Appendix B. In untabulated results, we also studied different CSR categories and CSR strength/concern separately. We found that the effects of CEO incentives were generally similar and consistent across different categories. We also found consistent results for CSR strength and concern; vega was positively related to strength and negatively to concern.
In summary, we found that Vega and Vega_Lag parameters are significant drivers of firm CSR ratings. Therefore, we conclude that vega related parameters belong in the true model. As delta related parameters only ever demonstrate significance when vega related parameters are removed, we believe that Delta and Delta_Lag do not belong in the model. Furthermore, as Delta and Delta_Lag are never significantly different than zero at higher confidence levels, it suggests that CEOs do not act as if investing in a higher CSR rating is a positive NPV project. From the CEO standpoint, a decision made independently of delta could be consistent with the neutral present value proposition from Ullmann [43]. However, it could also be reconciled with the viewpoint that CSR increases financial performance [17,40,41], because it could be argued that CEOs implement CSR measures when there is a clear benefit to the firm, regardless of delta exposure.
Most importantly, our findings draw a causal relation between CEOs’ pay sensitivity to vega and CSR ratings. This could indicate that CEOs perceive that CSR projects increase firm risk, which would be inconsistent with Attig et al. [49] and Albuquerque et al. [45]. This may be because CSR performance is difficult to quantify, and hence justify, to shareholders. It may also be due to the fact that the benefits of CSR are perceived as too distant to be of concern today. The other explanation is that CEOs simply do not know what the effects of CSR ratings will be on their firm’s value. This leads us to the most interesting conclusion of this paper: CEOs are motivated to invest in CSR through vega. CEOs may be unsure of the effect of CSR on shareholder wealth; however, they pursue CSR ratings as a way of increasing firm risk when incentivized by higher vega.

4.4. Endogeneity Issues

We adopted a variety of control variables and fixed effects models to address the omitted variable problem. The results are robust after controlling for observable firm and managerial characteristics, as well as for various unobservable characteristics such as time, industry, and firm fixed effects. Furthermore, we control for instances of lagged dependent variables for robustness checks. Lagged CSR is important because it contains all the information that determines CSR until the point of year t. Even after controlling for CSR at year t, CSR at t still provides incremental explanatory power to explain CSR at year t+1. This suggests that vega has explanatory power to predict future CSR even after controlling for current CSR level.

5. Conclusions

We developed a model to estimate CSR ratings as a function of CEO pay sensitivity to delta and vega. We used panel data spanning 1995–2013 to construct yearly firm CSR ratings and estimates of CEO pay sensitivity to firm stock price (delta) and volatility (vega). This was the longest sample period we were able to collect. The nineteen years were long enough for the statistically significant tests we conducted. In addition, to capture macro shocks in the sample period, we controlled for year fixed effects. We found that CSR ratings increased as CEOs were exposed to higher levels of vega, but not delta. This leads us to conclude that CEOs make CSR related decisions independent of their pay sensitivity to the underlying stock price, but that CEOs view CSR projects as a way of promoting stock volatility. Given that we should expect CSR ratings to have a positive relationship with delta if it is viewed as a value-enhancing policy, these results suggest that CEOs may be pursuing CSR projects simply to increase their own compensation through vega by increasing stock price volatility.
When interpreting these results, it is imperative not to infer conclusions regarding the actual effect of CSR on firm value. Our analysis only indicates how CEOs perceive CSR standings, not the actual effect these investments have on a firm’s financial performance. CEO actions are not always value maximizing from the shareholder’s perspective. Sometimes, this manifests itself through agency problems, but sometimes it is because CEOs do not have the necessary information to make ex-post value-maximizing decisions. The effects of CSR on financial performance are a major source of debate in the literature. Therefore, it is reasonable to assume that CEOs may also be unsure of how to make value-maximizing CSR investments. If we infer that CEOs are acting in the best interest of shareholders, then a decision made independently of delta could be consistent with the neutral present value proposition from Ullmann [43]. However, it could also be reconciled with the viewpoint that CSR increases financial performance [17,40,41], since it could be argued that CEOs implement CSR measures when there is a clear benefit to the firm, regardless of delta exposure.
Most importantly, our findings on the relation between CEOs’ pay sensitivity to vega and CSR ratings indicate that CEOs make CSR investments to increase firm risk, which would be inconsistent with [45,49]. One plausible explanation is that CEOs may simply view CSR as a way of increasing stock price volatility without having adverse effects on operational risk. For example, this could be achieved if many market participants have diverging views on the correct valuation methods to apply to CSR projects. Under these assumptions, a situation could be constructed where the expectation of the stock price remains unchanged with an increase in CSR standing while volatility of the stock price increases. Another potential explanation is that CEOs with higher vega exposure choose riskier CSR projects than other CEOs. Further research needs to be performed in this area in order to properly identify the source of this relationship. These findings have implications for both the executive compensation literature and the CSR literature. By understanding how CEOs respond to various compensation incentives, we can begin to formulate better compensation structures that minimize agency costs and simultaneously maximize shareholder and stakeholder value.
To better address the omitted variable bias that likely exists in this paper and any studies alike, future research should focus on better empirical proxies and theoretical frameworks for managerial risk aversion and talent. Empiricists should collect more detailed information, for instance, on CEOs’ background and personal experience. For theorists, it is important to model other forces aside from those in the agency framework. Developing new theories of how managerial attributes affect firm policy and outcomes and the contractual structure of managerial compensation can contribute to our understanding of the relationships between executive compensation and CSR.

Author Contributions

Methodology, T.M.; formal analysis, T.M.; resources, Z.L.; writing—original draft preparation, T.M.; writing—review and editing, A.I.; supervision, A.I. and Z.L. All authors have read and agreed to the published version of the manuscript.

Funding

This research received no external funding.

Conflicts of Interest

The authors declare no conflict of interest.

Appendix A. Variable Definitions

VariableDescription
CSRKLD scores for Corporate Social Responsibility (CSR); total strengths minus total concerns, aggregated across the categories of community, diversity, employee relations, environment, human rights, and product.
DeltaThe CEO’s pay sensitivity to the underlying stock price
VegaThe CEO’s pay sensitivity to the volatility of the underlying stock price
Delta_LagA 1-year lag of the Delta variable from our sample.
Vega_LagA 1-year lag of the Vega variable from our sample.
LogAssetsA control variable which takes the natural logarithm of total firm assets.
LogSalesA control variable which takes the natural logarithm of total firm sales.
LogXRDA control variable which takes the natural logarithm of firm research and development expense.
DTAThe debt-to-assets ratio of the firm.

Appendix B. Additional Tests for Robustness Check

Model 2 uses alternative firm size measures to check robustness of the relationship between Vega and CSR. Model 3 checks robustness of the relationship between Delta and CSR. Model 4 uses both Delta and Vega with one-year lag. Models 5 and 6 study lagged Delta and Vega, respectively.
Model 2
Independent Variable: Vega
Model 2AModel 2B
Firm Size Control: LogAssetsFirm Size Control: LogSales
SourceDFSum of SquaresMean SquareF ValuePr > FSourceDFSum of SquaresMean SquareF ValuePr > F
Model4.0010,690.252672.56520.22<0.0001Model4.008350.512087.63396.71<0.0001
Error17,90391,975.175.14 Error17,89194,148.455.26
Corrected Total17,907102,665.41 Corrected Total17,895102,498.96
R-SquareCoeff VarRoot MSECSR Mean R-SquareCoeff VarRoot MSECSR Mean
0.101370.822.270.17 0.081400.652.290.16
ParameterEstimateStandardt ValuePr > |t| ParameterEstimateStandardt ValuePr > |t|
Intercept−2.027960.08571−23.66<0.0001 Intercept−1.201870.09023−13.32<0.0001
vega0.001020.0000618.05<0.0001 vega0.001300.0000622.85<0.0001
LogAssets0.288620.0108026.73<0.0001 LogSales0.190860.0122215.62<0.0001
LogXRD0.030230.0019315.67<0.0001 LogXRD0.013920.001837.63< 0.0001
DTA−1.324070.10296−12.86<0.0001 DTA−1.672480.10481−15.96< 0.0001
Model 3
Independent Variable: Delta
Model 3AModel 3B
Firm Size Control: LogAssetsFirm Size Control: LogSales
SourceDFSum of SquaresMean SquareF ValuePr > FSourceDFSum of SquaresMean SquareF ValuePr > F
Model4.008869.002217.25423.82<0.0001Model4.005565.921391.48256.89<0.0001
Error17,31490,580.475.23 Error17,30293,717.395.42
Corrected Total17,31899,449.47 Corrected Total17,30699,283.32
R-SquareCoeff VarRoot MSECSR Mean R-SquareCoeff VarRoot MSECSR Mean
0.091340.102.290.17 0.061376.612.330.17
ParameterEstimateStandardt ValuePr > |t| ParameterEstimateStandardt ValuePr > |t|
Intercept−2.529890.08347−30.31<0.0001 Intercept−1.858230.08830−21.05<0.0001
delta0.000010.000004.02<0.0001 delta0.000010.000004.84<0.0001
LogAssets0.373920.0099637.53<0.0001 LogSales0.310290.0113627.30<0.0001
LogXRD0.035400.0019518.18<0.0001 LogXRD0.015180.001888.06<0.0001
DTA−1.269820.10532−12.06<0.0001 DTA−1.769720.10777−16.42<0.0001
Model 4
Independent Variables: Lag(1) delta and Lag(1) Vega
Model 4AModel 4B
Firm Size Control: LogAssetsFirm Size Control: LogSales
SourceDFSum of SquaresMean SquareF ValuePr > FSourceDFSum of SquaresMean SquareF ValuePr > F
Model5.0010,202.112040.42397.53<0.0001Model5.007769.691553.94295.02<0.0001
Error17,31288,858.235.13 Error17,30091,124.375.27
Corrected Total17,31799,060.34 Corrected Total17,30598,894.06
R-SquareCoeff VarRoot MSECSR Mean R-SquareCoeff VarRoot MSECSR Mean
0.101345.972.270.17 0.081376.722.300.17
ParameterEstimateStandardt ValuePr > |t| ParameterEstimateStandardt ValuePr > |t|
Intercept−2.115040.08631−24.51<0.0001 Intercept−1.307030.09107−14.35<0.0001
delta_lag0.000000.00000−0.610.54390 delta_lag0.000000.00000−0.870.38530
vega_lag0.000940.0000616.20<0.0001 vega_lag0.001210.0000620.54<0.0001
LogAssets0.300900.0108127.82<0.0001 LogSales0.207130.0122716.88<0.0001
LogXRD0.029750.0019615.21<0.0001 LogXRD0.012930.001866.95<0.0001
DTA−1.337130.10409−12.85<0.0001 DTA−1.709280.10600−16.13<0.0001
Model 5
Independent Variable: Lag (1) Delta
Model 5AModel 5B
Firm Size Control: LogAssetsFirm Size Control: LogSales
SourceDFSum of SquaresMean SquareF ValuePr > FSourceDFSum of SquaresMean SquareF ValuePr > F
Model4.008855.742213.93424.92<0.0001Model4.005547.511386.88257.05< 0.0001
Error17,31390,204.615.21 Error17,30193,346.545.40
Corrected Total17,31799,060.34 Corrected Total17,30598,894.06
R-SquareCoeff VarRoot MSECSR Mean R-SquareCoeff VarRoot MSECSR Mean
0.091356.092.280.17 0.061393.362.320.17
ParameterEstimateStandardt ValuePr > |t| ParameterEstimateStandardt ValuePr > |t|
Intercept−2.523700.08316−30.35<0.0001 Intercept−1.855950.08812−21.06<0.0001
delta_lag0.000010.000003.640.00030 delta_lag0.000010.000004.37<0.0001
LogAssets0.373220.0099237.61<0.0001 LogSales0.310020.0113427.34<0.0001
LogXRD0.035230.0019418.15<0.0001 LogXRD0.015080.001888.03<0.0001
DTA−1.281320.10481−12.22<0.0001 DTA−1.781670.10722−16.62<0.0001
Model 6
Independent Variable: Lag (1) Vega
Model 6AModel 6B
Firm Size Control: LogAssetsFirm Size Control: LogSales
SourceDFSum of SquaresMean SquareF ValuePr > FSourceDFSum of SquaresMean SquareF ValuePr > F
Model4.0010,543.262635.82511.32<0.0001Model4.008048.232012.06380.46< 0.0001
Error17,90292,282.635.15 Error17,89094,611.105.29
Corrected Total17,906102,825.89 Corrected Total17,894102,659.33
R-SquareCoeff VarRoot MSECSR Mean R-SquareCoeff VarRoot MSECSR Mean
0.101389.502.270.16 0.081421.022.300.16
ParameterEstimateStandardt ValuePr > |t| ParameterEstimateStandardt ValuePr > |t|
Intercept−2.096840.08493−24.69<0.0001 Intercept−1.293680.08965−14.43<0.0001
vega_lag0.000950.0000617.04<0.0001 vega_lag0.001210.0000621.44<0.0001
LogAssets0.299160.0106428.11<0.0001 LogSales0.205960.0120817.05<0.0001
LogXRD0.031190.0019216.21<0.0001 LogXRD0.014480.001837.92<0.0001
DTA−1.324490.10259−12.91<0.0001 DTA−1.692640.10447−16.20<0.0001

References

  1. Mahoney, L.S.; Thorn, L. Corporate social responsibility and long-term compensation: Evidence from Canada. J. Bus. Ethics 2005, 57, 241–253. [Google Scholar] [CrossRef]
  2. Mahoney, L.S.; Thorn, L. An examination of the structure of executive compensation and corporate social responsibility: A Canadian investigation. J. Bus. Ethics 2006, 69, 149–162. [Google Scholar] [CrossRef]
  3. McGuire, J.; Dow, S.; Argheyd, K. CEO incentives and corporate social performance. J. Bus. Ethics 2003, 45, 341–359. [Google Scholar] [CrossRef]
  4. Deckop, J.R.; Merriman, K.K.; Gupta, S. The effects of CEO pay structure on corporate social performance. J. Manag. 2006, 32, 329–342. [Google Scholar] [CrossRef]
  5. Ryan, H.E., Jr.; Wiggins, R.A., III. The interactions between R&D investment decisions and compensation policy. Financ. Manag. 2002, 31, 5–29. [Google Scholar]
  6. Cohen, R.B.; Hall, B.J.; Viceira, L.M. Do Executive Stock Options Encourage Risk-Taking; Harvard University: Cambridge, MA, USA, 2000; unpublished manuscript. [Google Scholar]
  7. Coles, J.L.; Daniel, N.D.; Naveen, L. Managerial incentives and risk-taking. J. Financ. Econ. 2006, 79, 431–468. [Google Scholar] [CrossRef]
  8. Knopf, J.D.; Nam, J.; Thornton, J.H., Jr. The volatility and price sensitivities of managerial stock option portfolios and corporate hedging. J. Financ. 2002, 57, 801–813. [Google Scholar] [CrossRef]
  9. Jensen, M.C.; Meckling, W.H. Theory of the firm: Managerial behavior, agency costs and ownership structure. J. Financ. Econ. 1976, 3, 305–360. [Google Scholar] [CrossRef]
  10. Fama, E.F. Agency Problems and the Theory of the Firm. J. Polit. Econ. 1980, 88, 288–307. [Google Scholar] [CrossRef]
  11. Guay, W.R. The sensitivity of CEO pay to equity risk: An analysis of the magnitude and determinants. J. Financ. Econ. 1999, 53, 43–71. [Google Scholar] [CrossRef]
  12. Jensen, M.C.; Murphy, K.J. Performance pay and top-management incentives. J. Polit. Econ. 1990, 98, 225–264. [Google Scholar] [CrossRef]
  13. Hall, B.J.; Liebman, J.B. Are CEOs really paid like bureaucrats? Q. J. Econ. 1998, 113, 653–691. [Google Scholar] [CrossRef] [Green Version]
  14. Hall, B.J.; Liebman, J.B. The taxation of executive compensation. Tax Policy Econ. 2000, 14, 1–44. [Google Scholar] [CrossRef]
  15. Bebchuk, L.A.; Fried, J.M.; Walker, D.I. Managerial Power and Rent Extraction in the Design of Executive Compensation; No. w9068; National Bureau of Economic Research: Cambridge, MA, USA, 2002. [Google Scholar]
  16. Smith, C.W.; Stulz, R.M. The determinants of firms’ hedging policies. J. Financ. Quant. Anal. 1985, 20, 391–405. [Google Scholar] [CrossRef]
  17. McGuire, J.B.; Sundgren, A.; Schneeweis, T. Corporate social responsibility and firm financial performance. Acad. Manag. J. 1988, 31, 854–872. [Google Scholar]
  18. Graves, S.B.; Waddock, S.A. Institutional ownership and control: Implications for long-term corporate strategy. Acad. Manag. Perspect. 1990, 4, 75–83. [Google Scholar] [CrossRef]
  19. Hillman, A.J.; Keim, G.D. Shareholder value, stakeholder management, and social issues: What’s the bottom line? Strat. Manag. J. 2001, 22, 125–139. [Google Scholar] [CrossRef]
  20. Mackey, A.; Mackey, T.B.; Barney, J.B. Corporate social responsibility and firm performance: Investor preferences and corporate strategies. Acad. Manag. Rev. 2007, 32, 817–835. [Google Scholar] [CrossRef]
  21. Murphy, K.J. Executive compensation. In Handbook of Labor Economics; Elsevier: Amsterdam, The Netherlands, 1999; pp. 2485–2563. [Google Scholar]
  22. Perry, T.; Zenner, M. CEO compensation in the 1990’s: Shareholder alignment or shareholder expropriation. Wake For. L. Rev. 2000, 35, 123. [Google Scholar]
  23. Hall, B.J. The Pay to Performance Incentives of Executive Stock Options; No. w6674; National Bureau of Economic Research: Cambridge, MA, USA, 1998. [Google Scholar]
  24. Ross, S.A. The economic theory of agency: The principal’s problem. Am. Econ. Rev. 1973, 63, 134–139. [Google Scholar]
  25. Ross, S.A. Compensation, incentives, and the duality of risk aversion and riskiness. J. Financ. 2004, 59, 207–225. [Google Scholar] [CrossRef]
  26. DeFusco, R.A.; Johnson, R.R.; Zorn, T.S. The effect of executive stock option plans on stockholders and bondholders. J. Financ. 1990, 45, 617–627. [Google Scholar] [CrossRef]
  27. Ju, N.; Leland, H.; Senbet, L.W. Options, option repricing in managerial compensation: Their effects on corporate investment risk. J. Corp. Financ. 2014, 29, 628–643. [Google Scholar] [CrossRef]
  28. Jolls, C. Stock Repurchases and Incentive Compensation; No. w6467; National Bureau of Economic Research: Cambridge, MA, USA, 1998. [Google Scholar]
  29. Black, F.; Scholes, M. The pricing of options and corporate liabilities. J. Polit. Econ. 1973, 81, 637–654. [Google Scholar] [CrossRef] [Green Version]
  30. Core, J.; Guay, W. Estimating the value of employee stock option portfolios and their sensitivities to price and volatility. J. Account. Res. 2002, 40, 613–630. [Google Scholar] [CrossRef] [Green Version]
  31. Bizjak, J.M.; Brickley, J.A.; Coles, J.L. Stock-based incentive compensation and investment behavior. J. Account. Econ. 1993, 16, 349–372. [Google Scholar] [CrossRef]
  32. Aggarwal, R.K.; Samwick, A.A. The other side of the tradeoff: The impact of risk on executive compensation-A reply. SSRN Electron. J. 2002. [Google Scholar] [CrossRef] [Green Version]
  33. Tsoutsoura, M. Corporate Social Responsibility and Financial Performance; Center for Responsible Business: Berkeley, CA, USA, 2004. [Google Scholar]
  34. Heinze, D.C. Financial correlates of a social involvement measure. Akron Bus. Econ. Rev. 1976, 7, 48–51. [Google Scholar]
  35. Moskowitz, M. Choosing socially responsible stocks. Bus. Soc. Rev. 1972, 1, 71–75. [Google Scholar]
  36. Aupperle, K.E. The use of forced-choice survey procedures in assessing corporate social orientation. Res. Corp. Soc. Perform. Policy 1991, 12, 479–486. [Google Scholar]
  37. Herremans, I.M.; Akathaporn, P.; McInnes, M. An investigation of corporate social responsibility reputation and economic performance. Account. Organ. Soc. 1993, 18, 587–604. [Google Scholar] [CrossRef]
  38. Preston, L.E.; O’Bannon, D.P. The corporate social-financial performance relationship. Bus. Soc. Rev. 1997, 36, 419. [Google Scholar] [CrossRef]
  39. Waddock, S.A.; Graves, S.B. The corporate social performance-financial performance link. Strat. Manag. J. 1997, 18, 303–319. [Google Scholar] [CrossRef]
  40. Cochran, P.L.; Wood, R.A. Corporate social responsibility and financial performance. Acad. Manag. J. 1984, 27, 42–56. [Google Scholar]
  41. Aupperle, K.E.; Carroll, A.B.; Hatfield, J.D. An empirical examination of the relationship between corporate social responsibility and profitability. Acad. Manag. J. 1985, 28, 446–463. [Google Scholar]
  42. Friedman, M. The social responsibility of business is to increase its profits. New York Times Magazine, 13 September 1970; 32–33, 122, 124, 126. [Google Scholar]
  43. Ullmann, A.A. Data in search of a theory: A critical examination of the relationships among social performance, social disclosure, and economic performance of US firms. Acad. Manag. Rev. 1985, 10, 540–557. [Google Scholar]
  44. Gregory, A.; Tharyan, R.; Whittaker, J. Corporate social responsibility and firm value: Disaggregating the effects on cash flow, risk and growth. J. Bus. Ethics 2014, 124, 633–657. [Google Scholar] [CrossRef] [Green Version]
  45. Albuquerque, R.A.; Durnev, A.; Koskinen, Y. Corporate social responsibility and firm risk: Theory and empirical evidence. Manag. Sci. 2019, 65, 4451–4469. [Google Scholar] [CrossRef] [Green Version]
  46. Chava, S. Socially responsible investing and expected stock returns. SSRN Electron. J. 2010. [Google Scholar] [CrossRef] [Green Version]
  47. El Ghoul, S.; Guedhami, O.; Kwok, C.C.; Mishra, D.R. Does corporate social responsibility affect the cost of capital? J. Bank. Financ. 2011, 35, 2388–2406. [Google Scholar] [CrossRef]
  48. Cheng, B.; Ioannou, I.; Serafeim, G. Corporate social responsibility and access to finance. Strat. Manag. J. 2014, 35, 1–23. [Google Scholar] [CrossRef]
  49. Attig, N.; El Ghoul, S.; Guedhami, O.; Suh, J. Corporate social responsibility and credit ratings. J. Bus. Ethics 2013, 117, 679–694. [Google Scholar] [CrossRef]
  50. Servaes, H.; Tamayo, A. The impact of corporate social responsibility on firm value: The role of customer awareness. Manag. Sci. 2013, 59, 1045–1061. [Google Scholar] [CrossRef] [Green Version]
  51. Jo, H.; Harjoto, M.A. Corporate governance and firm value: The impact of corporate social responsibility. J. Bus. Ethics 2011, 103, 351–383. [Google Scholar] [CrossRef]
  52. Jo, H.; Harjoto, M.A. The causal effect of corporate governance on corporate social responsibility. J. Bus. Ethics 2012, 106, 53–72. [Google Scholar] [CrossRef]
  53. Hong, B.; Li, Z.; Minor, D. Corporate Governance and Executive Compensation for Corporate Social Responsibility. J. Bus. Ethics 2015, 136, 199–213. [Google Scholar] [CrossRef] [Green Version]
  54. Ikram, A.; Li, Z.; Minor, D. CSR-Contingent Executive Compensation Contracts. J. Bank. Financ. 2019. [Google Scholar] [CrossRef]
  55. McWilliams, A.; Siegel, D. Corporate Social Responsibility: A Theory of the Firm Perspective. Acad. Manag. Rev. 2001, 26, 117–127. [Google Scholar] [CrossRef]
  56. Berman, S.L.; Wicks, A.C.; Kotha, S.; Jones, T.M. Does stakeholder orientation matter? The relationship between stakeholder management models and firm financial performance. Acad. Manag. J. 1999, 42, 488–506. [Google Scholar]
  57. Chatterji, A.K.; Levine, D.I.; Toffel, M.W. How well do social ratings actually measure corporate social responsibility? J. Econ. Manag. Strat. 2009, 18, 125–169. [Google Scholar] [CrossRef]
Figure 1. CSR vs. CEO Delta/Vega. This figure shows the relationship between CEO pay sensitivities and CSR over time. All variables are defined in the Appendix A and Appendix B.
Sustainability 12 07941 g001
Table 1. CSR over time. This table shows the summary statistics for the CSR variable over time. It contains the number of observations, the mean values, standard deviations, and min/max values of CSR for each year of our sample. All variables are defined in Appendix A.
Analysis Variable: CSR
Fiscal YearN ObsNMeanStd DevMinimumMaximum
1995359359.000.882.46−6.009
1996392392.000.932.37−8.009
1997423423.001.192.44−6.008
1998447447.001.232.60−7.009
1999492492.001.212.64−7.0011
2000517517.001.112.58−8.0011
2001864864.000.572.19−9.009
2002957957.000.452.22−9.009
200315771577.000.101.92−9.008
200416271627.00−0.022.12−8.0010
200516961696.000.022.26−8.0011
200618931893.00−0.012.31−8.0015
200721552155.00−0.052.28−9.0014
200821772177.00−0.042.30−9.0013
200921762176.00−0.062.30−9.0013
201022012201.000.102.95−7.0017
201121402140.000.503.27−7.0018
201221862186.001.172.47−5.0016
201323132313.001.353.02−6.0017.00
Table 2. Delta over time. This table shows the summary statistics for the Delta variable over time. It contains the number of observations, the mean values, standard deviations, and min/max values of Delta for each year of our sample. All variables are defined in Appendix A.
Analysis Variable: Delta
Fiscal YearN ObsNMeanStd DevMinimumMaximum
1995359344.001595.648108.592.11127,526.64
1996392365.001945.6810,685.862.25169,506.27
1997423388.002890.4818,284.741.73342,219.71
1998447419.004098.1029,621.632.18558,974.19
1999492454.005458.1542,013.393.94709,829.7
2000517472.003821.2915,309.136.95213,589.37
2001864812.002305.589090.890.00174,744.3
2002957915.001773.958467.230.39181,294.18
200315771491.001354.176155.970.00151,106.75
200416271542.001404.966444.140.00163,382.82
200516961613.001251.784049.330.00101,838.53
200618931721.001239.007222.910.00247,452.89
200721552037.001050.796912.260.00269,934.95
200821772070.00613.215422.340.00231,972.09
200921762066.00623.046045.210.00265,911.24
201022012102.00749.708706.470.00391,755.57
201121402062.00676.827004.180.00302,657.79
201221862096.00722.558610.730.00388,945.54
201323132206.001045.3510,752.030.00486,620.98
Table 3. Vega over time. This table shows the summary statistics for the Vega variable over time. It contains the number of observations, the mean values, standard deviations, and min/max values of vega for each year of our sample. All variables are defined in Appendix A.
Analysis Variable: Vega
Fiscal YearN ObsNMeanStd DevMinimumMaximum
1995359356.0080.27116.500.00902.91457
1996392377.0087.78205.580.003625.52
1997423407.00105.35218.370.003007.34
1998447439.00164.35274.080.003490.61
1999492482.00225.65306.730.003639.82
2000517501.00286.13650.700.0011,261.69
2001864853.00286.15448.480.003768.64
2002957947.00271.21367.790.002992.8
200315771541.00227.21388.250.004536.19
200416271581.00219.49387.290.004196.82
200516961660.00213.87393.190.003670.8
200618931748.00168.83311.750.003984.76
200721552038.00144.69276.920.003098.71
200821772075.00116.17227.360.003841.35
200921762075.00136.55260.500.005041.26
201022012111.00145.23272.670.004446.21
201121402066.00137.48294.560.007885.78
201221862097.00142.27331.510.009442.93
201323132208.00152.02329.930.009389.01
Table 4. Correlations between variables. This table shows correlations, significance levels, and the number of observations for the variables: CSR, Delta, Vega, Delta_Lag, Vega_Lag, LogAssets, LogSales, and LogXRD. All variables are defined in Appendix A.
Pearson Correlation Coefficients
Prob > |r| under H0: Rho=0
Number of Observations
CSRDeltaVegaDelta_LagVega_LagLogAssetsLogSalesLogXRDDTA
CSR10.06610.239850.062590.227340.25360.196160.03838−0.09042
<0.0001<0.0001<0.0001<0.0001<0.0001<0.0001<0.0001<0.0001
18,61717,32017,90917,31917,90818,61618,60418,61718,616
Delta0.066110.282390.783260.242690.104560.128480.03599−0.01331
<0.0001 <0.0001<0.0001<0.0001<0.0001<0.0001<0.00010.0798
17,32017,32017,32016,67317,01717,31917,30717,32017,319
Vega0.239850.2823910.254640.803980.410420.445440.049970.01701
<0.0001<0.0001 <0.0001<0.0001<0.0001<0.0001<0.00010.0228
17,90917,32017,90917,02017,59217,90817,89617,90917,908
Delta_Lag0.062590.783260.2546410.282380.10370.130010.03353−0.01191
<0.0001<0.0001<0.0001 <0.0001<0.0001<0.0001<0.00010.1171
17,31916,67317,02017,31917,31917,31817,30617,31917,318
Vega_Lag0.227340.242690.803980.2823810.386110.420250.045610.01619
<0.0001<0.0001<0.0001<0.0001 < 0.0001<0.0001<0.00010.0303
17,90817,01717,59217,31917,90817,90717,89517,90817,907
LogAssets0.25360.104560.410420.10370.3861110.76525−0.31739−0.10975
<0.0001<0.0001<0.0001<0.0001<0.0001 <0.0001<0.0001<0.0001
18,61617,31917,90817,31817,90718,61618,60418,61618,616
LogSales0.196160.128480.445440.130010.420250.765251−0.020620.09239
<0.0001<0.0001<0.0001<0.0001<0.0001<0.0001 0.0049<0.0001
18,60417,30717,89617,30617,89518,60418,60418,60418,604
LogXRD0.038380.035990.049970.033530.04561−0.31739−0.0206210.20639
<0.0001<0.0001<0.0001<0.0001<0.0001<0.00010.0049 <0.0001
18,61717,32017,90917,31917,90818,61618,60418,61718,616
DTA−0.09042−0.013310.01701−0.011910.01619−0.109750.092390.206391
<0.00010.07980.02280.11710.0303<0.0001<0.0001<0.0001
18,61617,31917,90817,31817,90718,61618,60418,61618,616
Table 5. Model comparison. This table compares the various models that we constructed to explain CSR scores using CEO pay sensitivities. For each model that we constructed, Model A used LogAssets as a proxy for firm size, while Model B used LogSales as a proxy for firm size. Further details on each model are contained within Appendix B. All variables are defined in Appendix A.
ModelAdj R-SqPr > FKey VariablesEstimatePr > |t|
Model 1A0.104<0.0001Delta0.000000.64570
Vega0.00102<0.0001
Model 1B0.082<0.0001Delta0.000000.46030
Vega0.00131<0.0001
Model 2A0.104<0.0001Vega0.00102<0.0001
Model 2B0.081<0.0001Vega0.00130<0.0001
Model 3A0.089<0.0001Delta0.00001<0.0001
Model 3B0.056<0.0001Delta0.00001<0.0001
Model 4A0.103<0.0001Delta_Lag,0.000000.54390
Vega_Lag0.00094<0.0001
Model 4B0.079<0.0001Delta_Lag0.000000.38530
Vega_Lag0.00121<0.0001
Model 5A0.089<0.0001Delta_Lag0.000010.00030
Model 5B0.056<0.0001Delta_Lag0.00001<0.0001
Model 6A0.103<0.0001Vega_Lag0.00095<0.0001
Model 6B0.078<0.0001Vega_Lag0.00121<0.0001
Note: Model A uses LogAssets and Model B uses LogSales as proxy for firm size. All Models use DTA and LogR&D to control for firm risk and type, respectively.

