Article

Culturally Driven Monitoring: The Importance of Traditional Ecological Knowledge Indicators in Understanding Aquatic Ecosystem Change in the Northwest Territories’ Dehcho Region

1
Department of Resource Economics and Environmental Sociology, University of Alberta, Edmonton, AL T6G2H1, Canada
2
Center for Environmental Studies and Research (NEPAM), University of Campinas, São Paulo CEP 13083-862, Brazil
*
Author to whom correspondence should be addressed.
Sustainability 2020, 12(19), 7923; https://doi.org/10.3390/su12197923
Submission received: 29 July 2020 / Revised: 15 September 2020 / Accepted: 19 September 2020 / Published: 24 September 2020

Abstract

:
There is growing concern about the sustainability of freshwater ecosystems in northern Canada that are under significant stress from climate change, resource development, and hydroelectric development, among others. Community-based monitoring (CBM) based on traditional ecological knowledge (TEK) has the potential to contribute to understanding impacts on the environment and community livelihoods. This paper shares insights about culturally driven monitoring, through collaborative research with Kátł’odeeche First Nation (KFN) in the Northwest Territories. This research was initiated in 2018 to improve understanding of the changes occurring in the Hay River and Buffalo River sub-basins, which extend primarily across the Alberta and Northwest Territories borders. Drawing on 15 semi-structured interviews conducted with KFN elders, fish harvesters, and youth, this paper illustrates the kinds of social–ecological indicators used by KFN to track changes in the health of aquatic systems as well as the fishing livelihoods of local people. Utilizing indicators, fishers observe declines in fish health, water quality, water quantity, and ice thickness in their lifetime. Community members perceive these changes to be a result of the cumulative effects of environmental stressors. The indicators as well as trends and patterns being observed and experienced can contribute to both social learning in the community as well as the governance of the larger Mackenzie River Basin.

1. Introduction

In Canada’s subarctic and boreal regions, environmental stressors such as climate change and resource development are adversely impacting freshwater lakes and rivers [1]. The cumulative effects of stress over the last 50 years have created new kinds of uncertainties for Indigenous peoples who depend on these ecosystems for their livelihood and well-being. Community-based monitoring (CBM) offers opportunities for communities to learn and adapt in ways that ensure the long-term sustainability of both the environment and community.
In the literature, scholars broadly define CBM as an approach whereby “concerned citizens, government agencies, industry, academia, community groups and local institutions collaborate to monitor, track and respond to issues of common community concern” [2] (p. 410). In northern Canada, there are a growing number of CBM programs focused on issues of climate change [3,4,5], resource development [5,6], and changes in various aspects of wildlife health (e.g., contaminants, surveillance of caribou movements) [6]. With the purpose of informing resource management, Indigenous-led CBM initiatives frequently involve the monitoring of species, habitats, and ecosystems [7]. There is also growing recognition of the value of Indigenous knowledge in monitoring as expressions of land rights, governance, and sovereignty are asserted through CBM and Guardian programs [8]. What tends to be unique about Indigenous-led programs is their holistic approach to tracking both social and ecological change in ways that are culturally appropriate and address local needs.
With the aim of understanding how a social–ecological approach to community-based monitoring is useful to Indigenous communities in the Mackenzie River Basin (MRB), Canada, this paper shares outcomes of collaborative qualitative research with Kátł’odeeche First Nation (KFN). This research is part of a larger CBM research project called Tracking Change, which seeks to document the voices and traditional ecological knowledge (TEK) of Indigenous peoples situated across the MRB and other freshwater basins in Thailand and Brazil [9]. The purpose of this paper is to demonstrate how narratives about cultural landscapes can inform the development of meaningful indicators for monitoring at local and regional scales. In addition, this research aims to address knowledge gaps in existing MRB monitoring efforts, specifically in the Hay River and Buffalo River basins through the documentation of KFN’s TEK. This paper first explores key TEK literature in the broader context of environmental monitoring and then engages with literature focusing on indicators, CBM, and governance in the MRB. Next, the study area and methods are outlined in detail, followed by the presentation, discussion, and conclusion of the research findings.

1.1. Traditional Ecological Knowledge and the Social–Ecological Lens

The social–ecological lens of Indigenous communities is critical to the value of TEK in monitoring. Numerous scholars have articulated the value of this complex systems approach in improving environmental management and sustainability outcomes at various scales [10,11]. A social–ecological approach to monitoring moves away from thinking about people and nature as separate from one another and monitoring the task of objective and technical surveillance of a pool of resources. Rather, social–ecological approaches conceive the environment as a cultural landscape that has different dynamics and values to various peoples. TEK helps us to understand all of the unique dimensions, values, uses, relationships associated with being or dwelling in a particular place [12]. It is this richness of dwelling in place that underpins the TEK of Kátł’odeeche First Nation and the indicators developed through this research project.
TEK is defined by “a cumulative body of knowledge, practice, and belief, evolving by adaptive processes and handed down through generations by cultural transmission, about the relationship of living beings (including humans) with one another and with their environment” [13] (p. 1252). TEK is increasingly recognized as invaluable in environmental monitoring by scientists, researchers, and resource managers. Moreover, TEK is considered fundamental in the understanding of ecological change [14], including cumulative effects such as climate change [3,4,5], resource development [5,6], and hydroelectric development [5]. Indigenous people who live off of the land and its resources witness and experience environmental changes long before scientists [15]. Furthermore, people who rely on local resources for their livelihoods have a vested interest in learning from their environment and assessing ecosystem health in ways not considered by outsiders [16]. Because of local peoples’ long-term or diachronic view, they can easily distinguish between natural ecological variability and anthropogenic change [17,18]. Although some scientists and institutions (e.g., resource management, environmental impact assessments) have been disregarding the knowledge and views of Indigenous peoples [19], there is increasing recognition that TEK can fill “gaps in scientific knowledge, offer alternate interpretations of observations, and provide a more holistic and long-term understanding of the environment” [6,20,21].

1.2. Indicators Based on Traditional Ecological Knowledge

In the last 50 years, scientists have grown increasingly interested in the development and application of ecological indicators to assess the condition of the environment [22]. In the discipline of ecology, there exist many definitions of indicators. Despite a substantial body of literature related to ecological indicators, criticism has emerged from social science disciplines stating that scientific indicators are often too technical and of little interest or relevance to local communities [23]. In this context, there is a growing body of work and an area of practical research related to the development of culturally ground community-based indicators that reflect the values and knowledge-related needs of local peoples, including Indigenous peoples [24]. In much of the TEK literature, scholars refer to indicators as signs and signals used by Indigenous peoples to identify ecological change and communicate about such change [14,17,21]. Māori peoples, for example, have developed indicators to monitor forest health in New Zealand [25]. Local indicators for monitoring the impacts of climate change and, in turn, changes to biophysical and socioeconomic systems are also increasingly cited in Canadian and international literature [26,27,28,29,30,31].
There are a variety of indicators that have been developed to describe ecological change in the MRB. These range from indicators related to water quality, water quantity, and ice regime, to fish health, wildlife health, and population [17,32,33,34,35,36]. With the aim of co-producing knowledge and developing a more holistic approach to environmental monitoring and resource management, recent literature in the MRB has focused on blending or braiding TEK with Western science-based indicators [32,35]. Less attention, however, has been paid to social, economic, and cultural indicators and how these are interrelated with ecological change in the MRB, and Hay River and Buffalo River basins in particular. Critical studies of these indicators and their ontological meaning and context has not been well-developed. The interconnections among these indicators, their use in monitoring, and the governance of the river basin are also major gaps in the literature.

1.3. Governance

The extent to which indicators and systems of CBM are interconnected with governance varies across programs, resources, and jurisdictions. Historically, in colonized countries across the globe, governments exerted power over Indigenous peoples and their territories and excluded Indigenous peoples in resource management decision-making. Natural resource management systems and associated monitoring consequently rely heavily on Western science [37]. This is changing, in some countries faster than others, with increased recognition of TEK and community-based resource management [14].
In Canada, CBM programs are supported by, or are outcomes of, collaboration with government. More specifically, a CBM program supported by the Government of the Northwest Territories (NWT) was developed to help address community concerns about water quality and is a strong part of the implementation of the NWT Water Stewardship Strategy. Similarly, the Dehcho Aboriginal Aquatics Resources and Oceans Management is another collaborative CBM program that has received federal support from the Department of Fisheries and Oceans [38]. In other regions monitoring programs have developed as alternatives to government-led programs. For example, in the oil sands region of Alberta, Mikisew Cree First Nation created its own monitoring program as a result of lack of trust in government and industry-generated data about the health of the Athabasca River [39]. What these programs suggest is that one-size-fits-all approaches to monitoring are not as useful as place-based approaches that reflect the knowledge, needs, and interests of local communities and have tight feedback loops to local decision-making.
One important opportunity for linking outcomes of monitoring by Kátł’odeeche First Nation is the Mackenzie River Basin Transboundary Master Agreement [40], specifically the Alberta–NWT Bilateral Water Management Agreement [41]. One of the major objectives of the agreement is to develop biological indicators for the monitoring of transboundary water basins and the recognition of different knowledge systems (i.e., TEK and Western science) in the development of indicators [42].

2. Materials and Methods
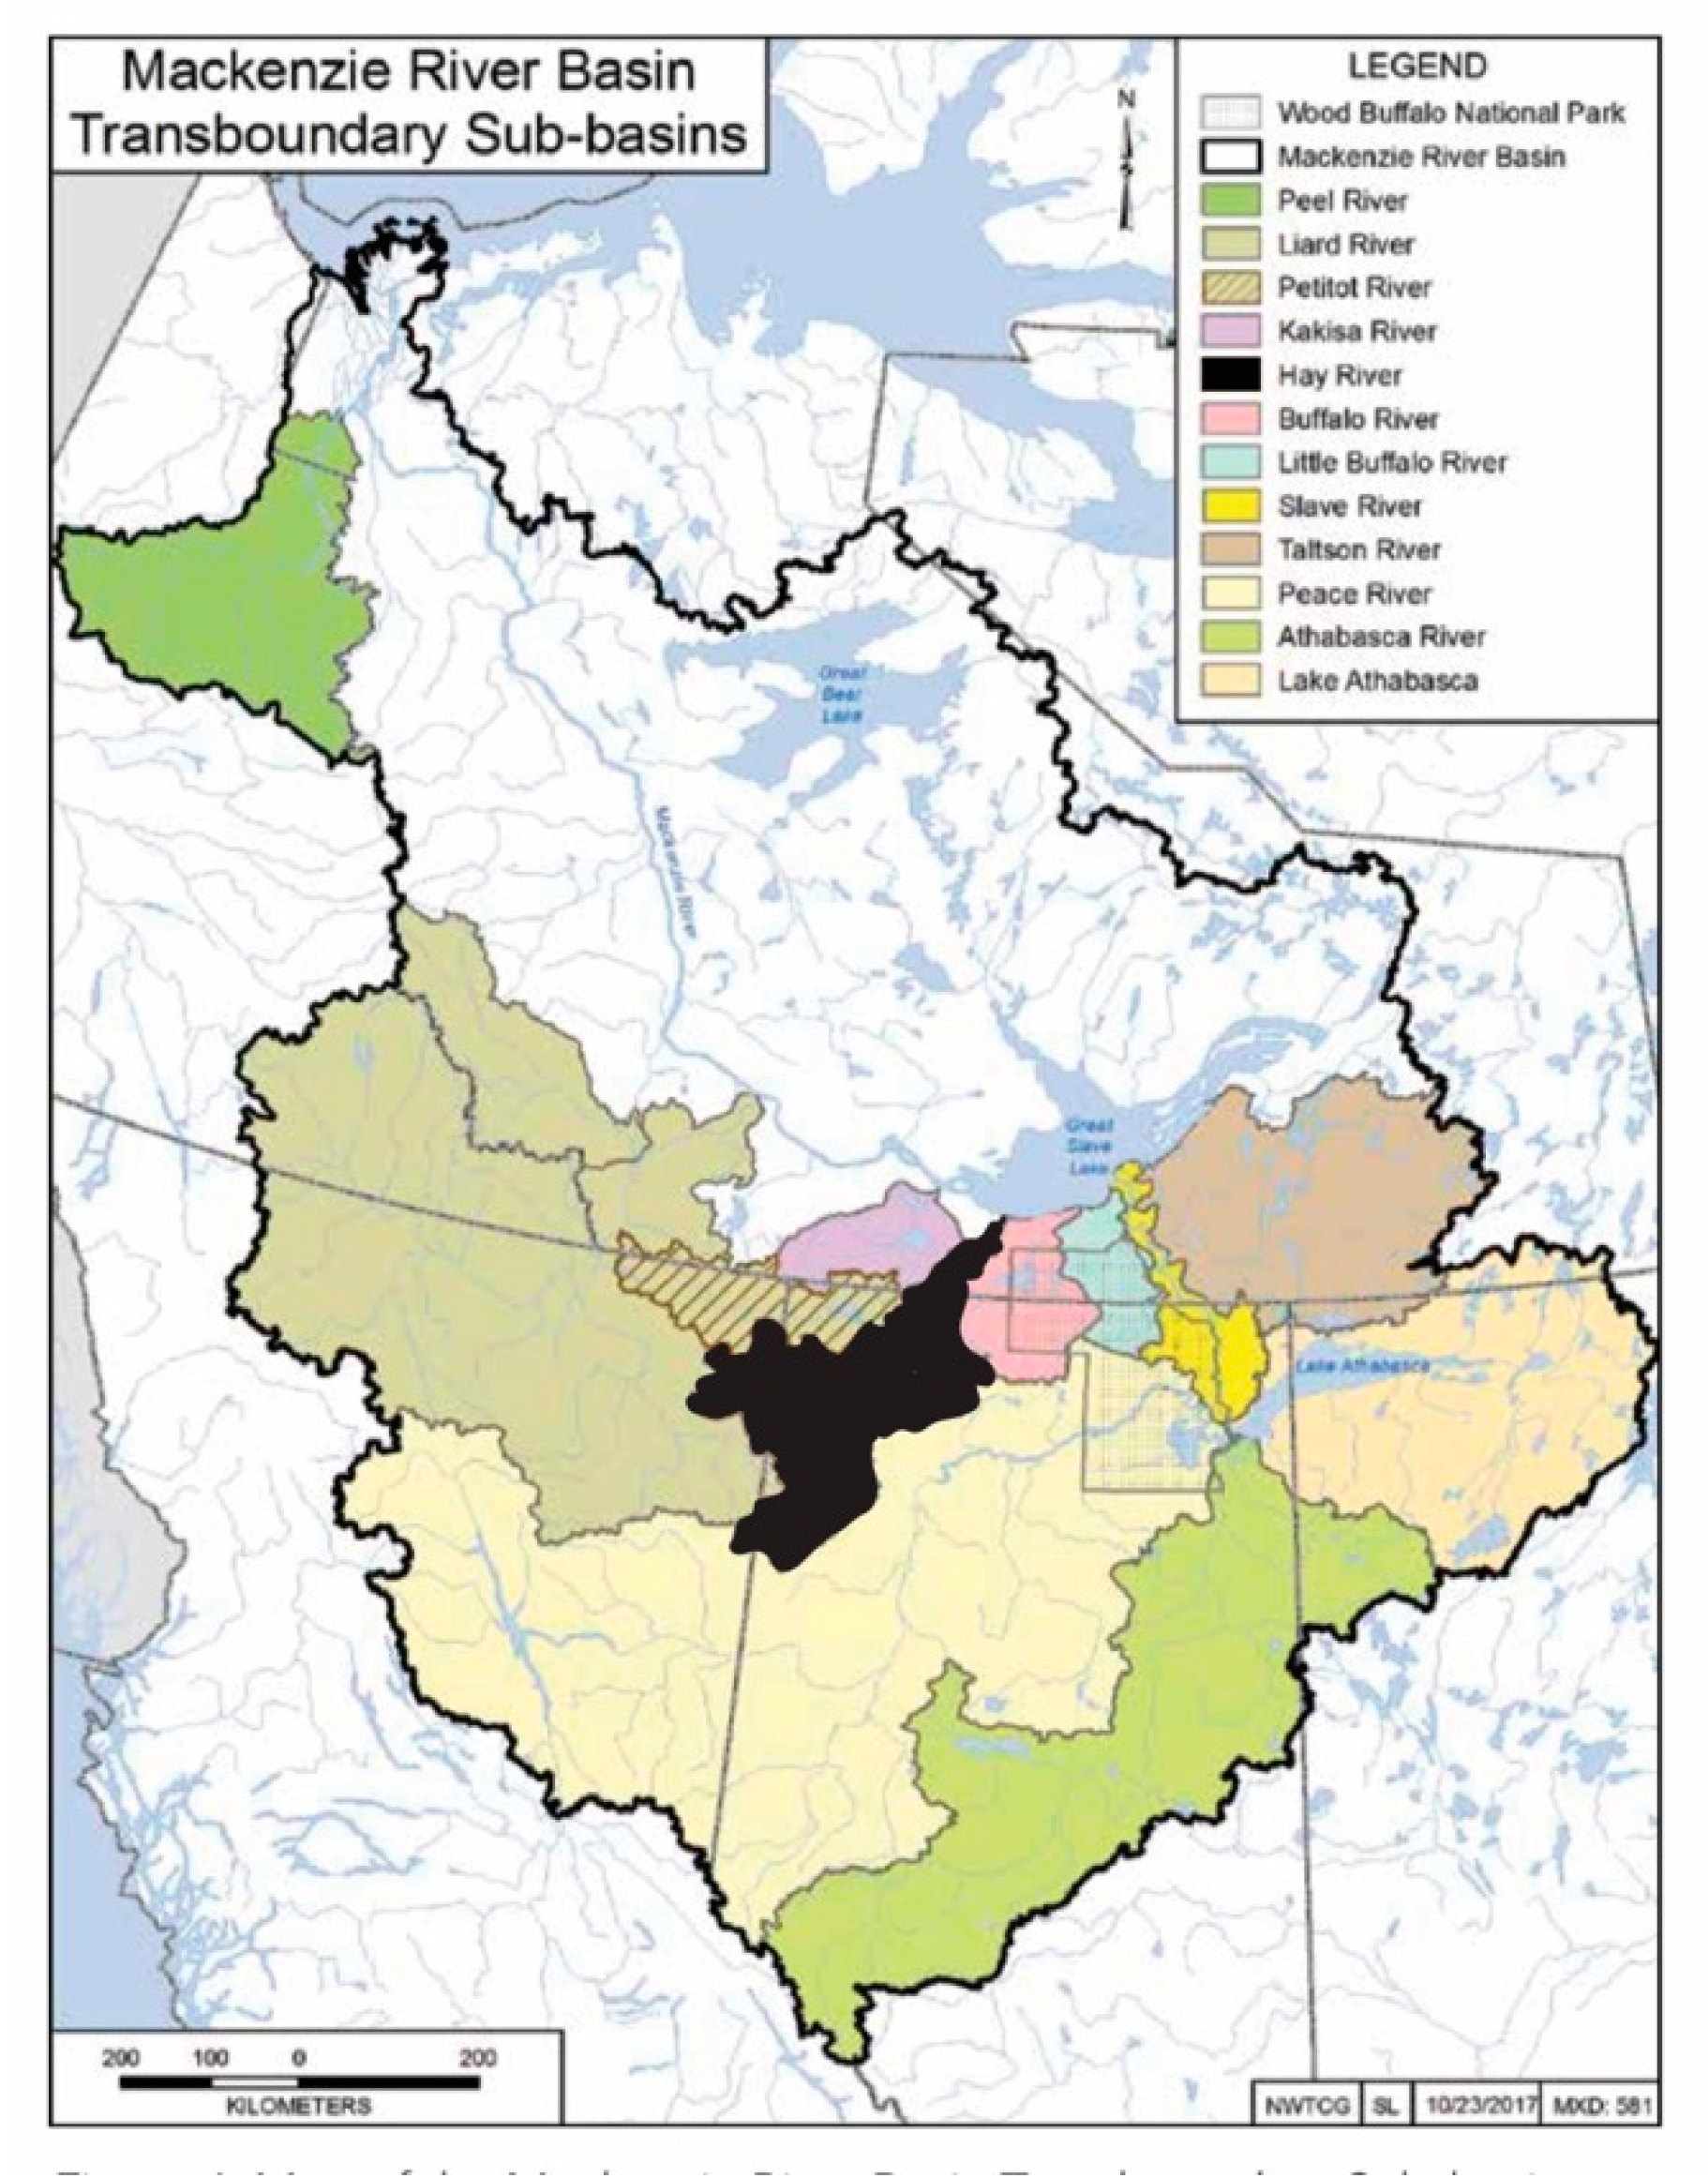
2.1. Study Area

Kátł’odeeche First Nation (KFN) have occupied lands in their traditional territory of the Northwest Territories’ Dehcho region for thousands of years and have passed on traditional ecological knowledge (TEK) through the practices of fish harvesting and monitoring. There are approximately 309 people currently residing on the Hay River Dene Reserve [43], the majority of whom self-identify as First Nation (i.e., South Slavey Dene) [44]. While more Dene are participating in the wage economy in the present day, KFN continues to practice traditional activities such as hunting, trapping, fishing, and the gathering of berries and medicinal plants [44]. There are both commercial and subsistence fishers in the community, as well as fishers who participate in environmental monitoring activities led by KFN, government, and academic researchers. As signatories of a treaty with the Government of Canada and the First Nations of the region (Treaty 8), members of KFN have the rights to hunt, trap, and fish on their traditional lands [45].
Figure 1 depicts a map of the study area. The Buffalo River basin is located directly to the right of the Hay River basin on the map. These sub-basins reside within the larger Mackenzie River Basin (MRB) [46]. The MRB signifies the largest river basin in Canada [47], as it occupies one-sixth the area of the country and comprises five jurisdictions [48]. Kátł’odeh (Hay River), Tucho (Great Slave Lake), Tagáa (Sandy Creek), Ejıe Túé Dehé (Buffalo River), and Ejıe Túé (Buffalo Lake) are socially, economically, culturally, and spiritually significant bodies of water to KFN, as relationships with these bodies of water shape their identity, well-being, and livelihoods. As the Hay River and its tributaries flow from the south, there is increasing concern among KFN members regarding the impacts of cumulative effects (e.g., oil and gas development, hydroelectric development, climate change) on the health of aquatic ecosystems for future generations. In turn, KFN is developing a community-based monitoring (CBM) program to assert control over the monitoring of their lands.

2.2. Monitoring Activities in the Hay River and Buffalo River Basins

There has been increasing efforts to embrace TEK in freshwater and fisheries monitoring across the MRB (e.g., Northwest Territories’ Community-Based Water Monitoring Program, the Transboundary Rivers Monitoring Program on the Hay River, and the Aboriginal Aquatic Resource and Oceans Management CBM program in the Dehcho region). Despite these efforts, the extent to which TEK is included in monitoring programs varies. Moreover, while TEK may inform the design of scientific monitoring programs, fewer programs are based exclusively on TEK indicators. The NWT’s water monitoring inventory emphasizes the dominance of scientific parameters and technical indicators in current monitoring systems in both the MRB and Dehcho region [49].
In terms of existing research in the Hay River basin, there are few studies assessing aquatic biota and no long-term monitoring of the basin’s aquatic health [50]. In addition, there is limited baseline data to assist in identifying and monitoring potential changes in the Hay River basin that are a result of anthropogenic change and/or climate change [50]. To date, research and monitoring activities in the Hay River basin continue to be predominantly scientific [51]. Few publications exist that document the TEK of communities located throughout the lower Hay River and Buffalo River basins. Evidently, more comprehensive assessments of the basin are needed to improve watershed management and address knowledge gaps.

2.3. Methodological Approach

The research approach was inspired by the previous work of Indigenous scholars [52,53] and non-Indigenous scholars [54,55], who have extensive experience building ethical research relationships with Indigenous communities. A community-based participatory research (CBPR) approach [55] and insurgent research approach, which aims to guide researcher responsibility back to the community [53], were adopted in order to engage in ethical research with KFN and generate mutually beneficial research outcomes. KFN guided all aspects of the research project, including decisions about research focus, research design, interviewee selection, community researcher engagement, interpretation of findings, and reporting. In addition to academic outcomes, plain languages materials and culturally appropriate outputs were created for the community (i.e., book of stories). Given the researcher (lead author) was an “outsider” to the community and given budget constraints, which allowed the lead author to spend only a short period of time in the community to learn from a small sample of interviewees, the outcomes should be considered exploratory. More research is needed to more deeply inform the development of the CBM program such that it meaningfully reflects the histories, relationships to the land, and practices of KFN.

2.4. Semi-Structured Interviews

Fifteen semi-structured interviews were conducted in English with KFN elders, harvesters, and youth in October 2018 in Hay River, Northwest Territories. The Lead of Negotiations and Consultation for KFN, the Environmental Program Manager, and a community researcher identified interview participants, including key Traditional Knowledge holders and community members engaged in fish harvesting. A community researcher supported the lead author in carrying out the interviews (Table 1).
Nearly all of the fishers identified by our KFN research partners were interviewed. According to our community research partners, fewer community members are practicing fish harvesting in the present day. The purpose of the interviews was to document KFN observations, experiences, and diverse perspectives related to the Hay River, Great Slave Lake, Sandy Creek, Buffalo River, and Buffalo Lake areas. Given the nature of the research, a qualitative approach and semi-structured interview method were employed in order to capture the rich narratives of TEK holders and community members engaged in fish harvesting. The semi-structured interview was deemed an effective tool by researchers in the “accurate and comprehensive” documentation of TEK [56]. Most importantly, interviews were determined to be a culturally appropriate research method for the study by KFN. The semi-structured interview guide included questions such as: how do you know if the fish is healthy; how do you know if the water is healthy and safe to drink; what signs do you look for; are you observing any changes in the health of the water and fish? Although the focus of the interviews was on aquatic ecosystem health, interviewees also spoke more broadly about social and ecological change. The interviews were also place-based; in addition to research–interviewee interactions on the land, many of the narratives shared by interviewees had a spatial reference (i.e., focused on a specific river, lake, etc.).
Community members had the opportunity to provide in-depth reflection on various topics and communicate their knowledge through stories and lived experiences. While it was necessary to guide the discussion at moments, it was important to allow interviewees time to share stories, as some led to information and connections that may not have otherwise emerged. Each individual was given the opportunity to talk about one or more bodies of water. Although some interviewees were comfortable focusing on a specific place, we were reminded by elders that Dene people naturally see all elements of the environment as connected, not separate. Therefore, allowing community members to freely discuss lakes, rivers, and creeks and other wildlife in no particular order was important, as their memories were flooded with rich ecological knowledge while they recalled in detail travelling across their traditional territory and harvesting fish at different times of the year.

2.5. Content Analysis

Consent was granted by all 15 community members for the interviews to be audio recorded and transcribed. Following conventional content analysis [57], transcripts were coded by minor themes and later grouped into core themes. Based on preliminary analysis, the initial categories identified were descriptive of the health of freshwater systems and local values and use of these systems. Subsequent analysis resulted in the identification of the indicators or signs and signals used by interviewees to describe specific changes in water quality, water quantity, fish health, ice conditions, and stressors such as resource development, hydroelectric development, and climate change.

3. Results

3.1. The Significance of Freshwater Systems to Kátł’odeeche First Nation

According to Kátł’odeeche First Nation (KFN), the health of freshwater systems is imperative for the survival of human and animal populations and the continuation of KFN cultural traditions. The connection was highlighted by KFN elders: “That’s where our great grandfathers they lived … People settled here because of the lake. They did their fishing, that’s how they made a living, that’s how they survived” (Elder 6). Another elder added, “the water’s important you know. You can’t do anything without water … everything is connected to water” (Elder 7). Similarly, youth took pride in explaining the historical importance of freshwater bodies to their community:
My people are from Buffalo River and they would live over the winter in Buffalo River, but they would come to the delta here, or along the banks of the Great Slave Lake to set nets and dry fish for the winter … The water is very important to us logistically, as well as locally. This is our entire existence right here, our entire history.
(Youth 1)
Elders specifically emphasized the importance of fish for historical modes of transportation: “Water gives us food and gives food to our dogs because at that time our dogs were all we had … We didn’t have skidoos … Dogs were our main transportation …” (Elder 8). While chuckling, an elder recalled that “water used to be our highway down to Buffalo Lake” (Elder 7). The continued practice of subsistence fish harvesting and the reliance on fish as a traditional food source in the present day were also expressed by community members. An active fisher in the community explained that “Sandy Creek has always provided us with everything that we need and if people want stuff they just go over there and get what they need … It’s just like our [grocery] store” (Harvester 1).
While community members linked the importance of water and fish to their survival and traditional way of life, they also conveyed the spiritual meaning associated with freshwater systems:
I have got to eat fish, I have got to have fish. I crave for fish … That’s our life out there, the [Great Slave] lake is part of us, it’s part of me. I think the lake is part of our spirit because even me I go out on the beach and sit there. I can heal myself by doing that … the lake it’s powerful … the air, the lake, the smell. You know it’s beautiful. It makes you strong again.
(Elder 6)
Ultimately, freshwater systems are deeply connected to KFN’s well-being and the historical value of these bodies of water has been passed on for generations. Interviewees expressed that fishing has brought them a lot of joy in their lifetimes and discussed the importance of sharing knowledge with youth in order to provide them with the knowledge necessary to monitor ecological change and engage in environmental stewardship.

3.2. Perceptions of Fish Health

A KFN elder with decades of experience commercial fishing on Great Slave Lake emphasized the value of TEK in understanding and interpreting ecological change, specifically contrasting the long-term nature of his knowledge with scientific research:
If you do the things that I do over the last 50 years or so and you get to see all these changes … Like say research started 5 years ago and they tell you all this and that … They think that everything’s normal because it’s only 5 years back and not the 50 years that I know.
(Elder 5)
Drawing on the TEK of KFN, Table 2 displays common TEK indicators of change and fishers’ observations. While the most common observations reported by interviewees are documented in Table 2, it is important to note that variation exists among interviewees’ observations associated with each indicator. Thus, indicator frequency does not necessarily correspond to the number of interviewees who reported an observation. Instead, the indicator frequency refers to the number of interviewees who mentioned the indicator.
Indicators (i.e., ways of monitoring) are commonly shared across the community. While some indicators are more general, others have temporal, spatial, and seasonal dimensions and are linked to specific fish populations. Inspired by the work of Parlee et al. [17], the observations corresponding to each indicator were transformed into questions by the authors with the aim of being used for future monitoring in the community. Not all indicators outlined in Table 2 will be discussed in detail. Rather the key indicators that are linked to social–ecological change by KFN will be analysed. It is important to note that although texture and colour of fish gills were reported by the community as meaningful indicators, community members specifically linked gill texture and colour to the freshness of fish and not necessarily to the overall health. No observations associated with changes in gill texture and colour were mentioned by interviewees.
Depending on the season, KFN focuses its harvest on specific fish populations and in a particular area. For example, whitefish (Coregonus clupeaformis) are known to spawn up the Hay River in the fall, while there is a coney run, also known as inconnu (Stenodus leucichthys), on the Buffalo River in the spring. According to KFN, spawning typically indicates the best time to harvest fish, as the fish are considered to be a healthy size and many are filled with eggs. An elder noted that in the past spawning time periods were consistent, meaning fish spawned up the river during a select few days in the fall time. However, nowadays the elder noted difficulties in predicting spawning periods and associated this observation with climate change, specifically altering weather patterns: “People would say the fish are going up [the river] in basically 2 or 3 days … but now I notice it’s 2 to 3 weeks … I think climate change has got a lot to do with what is happening out there” (Elder 5).
In terms of community members’ perceptions of fish health across freshwater bodies, the majority of interviewees shared observations related to the Hay River and Great Slave Lake. Fewer interviewees discussed Sandy Creek, Buffalo River, and Buffalo Lake. According to community members, fish populations in KFN’s traditional territory were perceived to be generally healthy. However, some observations provided by interviewees were also consistent with KFN indicators of poor fish health. The variation in interviewees’ responses are further discussed. Nonetheless, in comparison to the past, increased caution was given to the consumption of fish, as external and internal changes to the condition of fish were observed:
I guess years ago, I don’t think you really had to worry about fish being different, or infected … I remember in my younger days, you go to Buffalo Lake, you go to Fish Point, you go to Buffalo River and when you catch a fish, it’s always a clean fish. There’s no mark on the fish … That’s how it used to be, but now … it’s different altogether … it’s different than what it used to be like years ago …
(Elder 7)
While many TEK indicators used by KFN to determine fish health have been passed on for generations, new descriptive indicators developed, as distinctive and abnormal changes in the physical condition of fish were observed.
Based on interviews, there was increasing concern among fishers regarding the temporal differences in fish health, as more fish being caught in Great Slave Lake and Hay River are exhibiting indicators of poor health in recent years than in the past. Changes were noted specifically with regards to fish aesthetics (i.e., condition of fish), including the appearance of scars, growth, or puncture wounds with pus. According to KFN interviewees, the presence of abnormalities and deformities on the body of the fish signified indicators of declining fish health:
The ones that you watch for are the ones that have a puncture wound … they form some kind of pus inside … When I opened it up the pus just burst open and started leaking … There’s lots of growth on some on them from inside. Even those [fish] I won’t give to the people. I always watch stuff like that. If they’re scarred or really bad I just throw the fish away.
(Harvester 1)
The catching of fish with abnormalities resulted in the automatic disposal of the fish, as they were deemed unsafe to consume for both humans and dogs. The harvester further explained that mainly whitefish in comparison to other fish species were exhibiting these abnormalities (Harvester 1). Similarly, others explained feelings of uncertainty with regards to the quality of fish caught in the Hay River, as some community members perceived the river fish to be unsafe to consume: “[Lately] people don’t think it’s good to fish in the [Hay] river here and eat the fish” (Elder 7). While some fishers reported catching healthy fish, their perceptions were influenced by other fishers’ experiences, as monitoring information is shared within the community and regionally with other communities. Despite evidence of declining fish health, other fishers recognized the general health of fish populations, as they based their perceptions upon the frequency of catching sick fish, which appeared to be relatively small to date:
I’m fishing all the time [in the Hay River], so I see the fish that are coming in … I see that they’re healthy … I ran into a few here and there that were getting some growth and stuff on them, but nothing majorly … I mean that’s one out of maybe 5000 fish, so I know everything is still pretty healthy.
(Harvester 4)
An elder who commercially fished on Great Slave Lake deemed the fish to be generally healthy as well, referencing the high fat content and pale colour of the whitefish: “Right now to my knowledge I know the whitefish are very healthy … The fat content of it and the inside is basically just white inside … I didn’t catch any really terrible fish, or anything like that. They’re just nice whitefish” (Elder 5).
Although fish were reported to be fairly healthy, spatial differences in the health of fish caught in Great Slave Lake versus the Hay River were discussed by several fishers. An elder explained that “the river fish and the lake fish are different … Whitefish from the lake is pale and white, but the river fish is darker” (Elder 1). Another fisher supported these observations, stating that he/she preferred to travel further out on Great Slave Lake to set net, as this fisher perceived the fish to be healthier in the lake in comparison to the river:
We’ll go out 5 km for nice fish, so it’s not river fish where it’s dirty and has silt and stuff inside the stomach. It would have a nice clean and clear stomach content … It tastes better being from the lake, as opposed to the river. It tastes soapy in the river … the whole fish smells funny, it tastes funny … It seems like the further you go out, the cleaner the fish.
(Harvester 3)
Evidently, multiple senses beyond the visual appearance of fish, such as taste and smell, were used by KFN interviewees in the detection of abnormalities and monitoring of fish health.
In terms of perceptions of change, one of the elders clarified that scarring and punctures found on the bodies of fish could be caused by predatory fish (Elder 5). However, KFN interviewees primarily associated declining fish health with contamination resulting from extractive industries (Harvester 1) and acknowledged the concerns of poor fish health in communities living further upstream near oil sands development. Nonetheless, given that freshwater systems are interconnected, and water flows from the south, KFN members were growing concerned for the future health of aquatic ecosystems: “We’re still good so far in this area for fishing … we’re just concerned about it. If it continues the way it is right now people are going to feel it years from now …” (Elder 7).

3.3. Perceptions of Water Quality, Quantity, and Ice Thickness

Table 3 depicts meaningful social–ecological indicators of freshwater system health according to the TEK of KFN elders, harvesters, and youth. The indicators of change were framed around several themes: water levels, water quality, and ice thickness. Again, interviewees’ observations and indicators were predominantly centred around Hay River and Great Slave Lake.

3.3.1. Deteriorating Water Quality: Spatial and Temporal Differences

Interestingly, numerous community members’ perceptions of water quality were determined by the health of the fish and wildlife in their traditional territory, as the health of animals and freshwater were interconnected (Harvester 1). One harvester discussed how he/she relied on the health of the fish to verify assessments of water quality: “If the water is healthy, the fish are going to be healthy. If the fish are starting to get sick and somebody is telling me well the water is fine, well I will find it hard to believe” (Harvester 4).
Other common indicators used by KFN interviewees to assess water quality included changes to the colour and clearness of the water. Furthermore, water described as dirty, murky, and dark was considered to be of poor quality and perceived as unsafe to drink, whereas water that was clear was perceived as clean and safe to drink. Altogether, spatial differences existed in community members’ perceptions of water quality. More specifically, interviewees drew comparisons between the conditions of the Hay River and Great Slave Lake. For example, youth contrasted the dirtiness of the river water and shoreline of Great Slave Lake to the clear water found further out on Great Slave Lake, away from the mouth of Hay River:
The water in the river is dirty … On the lake, along the shores it’s really dirty … I remember going swimming here in the Great Slave Lake along the beach and me and my sister were pretending to be mermaids at the time. We were so young, and we opened our eyes underneath the water and we couldn’t see each other like at all … It was really dirty, like really brown, but once you go out into the lake it actually gets really clear … The water looks blueish in the middle of the lake.
(Youth 2)
Interestingly, interviewees’ observations related to the differences in water quality on the Hay River and Great Slave Lake were shared across generations. Evidently, signs coinciding with turbidity were strong indicators of water quality.
In terms of perceptions of drinking water, more than half of community members perceived the water on Great Slave Lake to be safe to drink without purifying or boiling it, but emphasized the safest and cleanest drinking water was located closer to the middle of the lake:
If you go far enough out to the lake, away from where the Hay River, or Buffalo River, or Slave River feeds into the lake and you get out to the open water [where] it’s more clear, you can just take water from there and drink it.
(Youth 1)
Furthermore, in order to access safe drinking water, community members were now required to travel greater distances out on Great Slave Lake, away from the mouth of the Hay River. An elder reflected on the changes observed in her lifetime:
The water quality has changed since I was a kid … You can tell when you are getting closer back to the [Hay] river … the water starts to change colour and it gets almost yellowish. But when you’re out there, you can grab a glass and drink it … it’s ice cold and it’s amazing and it’s so clean! … [But] now you probably have to travel quite a ways out [on the lake]. I’m going to say maybe about 3 km, but before it was just over here, not very far …
(Elder 4)
In stark contrast, water from the Hay River in the present day was generally perceived as unsafe to drink, although several community members boiled it to make tea and/or coffee.
In terms of seasonal indicators, interviewees commented on the appearance of algae in the summertime, which was commonly referred to as “green stuff.” The presence of algae deterred KFN members from drinking the water. An elder recalled an experience on the Hay River with her husband:
One year when we were in the river I told him to get some water for me to make coffee and when he brought that water up, he said I don’t think you should make coffee because all over in the river there was little tiny green stuff.
(Elder 2)
In addition, temporal differences in water quality on the Hay River were also discussed by community members. For instance, three elders reported witnessing changes in the colour of the water on the Hay River in their lifetime. One elder explained that “the water changed colour. It used to be just about clear and now it’s just like tea …” (Elder 8). Moreover, a harvester recalled drinking water from the Hay River as a child, noting the water was less murky in the past: “[W]hen I was younger growing up on the Reserve we used to get our drinking water right from the [Hay] River … because it used to be clear” (Harvester 2). Ultimately, various observations contributed to an understanding that Hay River water quality has deteriorated over time and perceptions regarding water quality have changed. Reinforcing these changes, KFN youth spoke about personal observations, along with the knowledge and stories passed on from older generations: “People have said that Hay River used to be clean, or used to be clear when they were children, but in my lifetime, the river has always been brown and murky” (Youth 1). Despite variation in temporal observations of the water quality in the Hay River, there was consensus among interviewees that water conditions in the Hay River have deteriorated over time and the river water was of poor quality to date.
Explanations for deteriorating water quality were connected to those linked to declining fish health. Moreover, KFN members deemed resource development activities (e.g., oil sands) in the south to be responsible for downstream contamination of freshwater systems, specifically the Hay River, Slave River, and Great Slave Lake:
Nowadays there’s so many things that get in our water system … all that stuff that’s coming through from the mines up there [from the south] … I know people are concerned here … what happens when that stuff starts getting into our lake, how do we stop it from getting it into our lake?
(Harvester 2)
Evidently, community members’ perceptions regarding access to safe drinking water from natural freshwater sources were influenced by their awareness of industrial activities upstream. For example, some community members avoided drinking water from the Hay River, as they considered the water to be contaminated from pulp mills that are located along the river’s tributaries:
Well I was always told that you never drink any water unless it’s from some place way far out. I wouldn’t trust drinking anything on the Hay River, just because of the simple fact that I know that there’s a lot of different water basins that empty into it. Like I know the Chinchaga River empties into it and I know up that way there’s [pulp] mills …
(Harvester 4)
Moving forward, community members proposed increased testing of the water and fish in order to identify linkages between poor water quality, sick fish, and human health.

3.3.2. Declining Water Levels

Of the four themes, declining water levels generated the strongest consensus among interviewees. Although no interview questions purposely inquired about observations related to water levels, more than half of the interviewees reported decreasing water levels in recent years as a major concern. The Hay River, Great Slave Lake, Sandy Creek, Buffalo River, and smaller streams and creeks were bodies of water referenced by interviewees in connection to declining water levels. Access to traditional hunting areas, the drying up of creeks and streams, changing shorelines, and the appearance of islands, sandbars, and rocks represented social–ecological indicators used by KFN to assess changes in water levels. For example, an elder spoke about the low water levels, specifically the drying up of a creek near Buffalo Lake in the month of December:
It seems like we’re losing more water every year and I noticed creeks that used to flow, they no longer flow at all … I go out to Buffalo Lake and there’s one spot where that little creek overflows just before I think it’s in December … there’s no water there now … The water’s going to be a big problem I think in the future.
(Elder 5)
Community members blamed low water levels for their inability to access certain areas by boat. Elders shared common concerns and stated that reduced water levels in the fall time impeded navigation and access to traditional hunting areas, as there was high risk for motor boats to become trapped on sandbars. An elder recounted a recent experience on the Buffalo River: “The water goes so low that we can’t do the actual hunt that I used to do … go up the river and hunt for moose … I hit a sand bar and had to spend a night on the boat” (Elder 5). Other community members noted a drop in the shoreline along the Great Slave Lake, indicating lower water levels on the lake. More significant changes, however, were observed to be on the rivers. Referring to the Hay River, a harvester recalled in the past being able to travel to Alexandra Falls, a place of cultural and spiritual significance to the community: “I remember the water being so high you could take boats way up to the falls. Now you can’t because there’s so many rocks … the water levels are really low” (Harvester 3). The appearance of islands on the Hay River, near the mouth, were also repeatedly mentioned by interviewees:
The problem is the water is getting lower and lower every year … In the past I used to just go out and I didn’t see any islands. Now I go out there and on the other side of the river, there’s a big island way over there … trees are growing on there. I never saw that when I was growing up.
(Elder 1)
Although interviewees were not prompted to provide explanations for the decreasing water levels, four elders and harvesters perceived the low water levels to be connected to hydroelectric development upstream: “I know they’re building dams in BC and that’s where our water’s coming from … it goes into Athabasca and Slave River, and then it comes through this way” (Elder 5). Again, KFN members emphasized the interconnectedness of freshwater systems, as they flow across jurisdictions. Another elder spoke more generally about the perceived impacts of hydroelectric dams on water levels in the region:
I think that the hydro dams they’re putting up … they’re talking about [site] C dam in the newspaper and Slave River I think at Fort Smith … It’s going to be more of a problem if there is no water … Even now I used to go fall hunt, but the water is so low I couldn’t go to Buffalo Lake, to go hunt moose in the fall. The water is so low, so if they put up the dam pretty soon we’ll be able to walk across the river.
(Elder 8)
While the elder voiced his concern for the future building of dams, he did not attribute the reduced water levels specifically observed on the Buffalo River to current hydroelectric development. The elder further distinguished between the socioeconomic benefits for the south and the anticipated consequences for the north, as communities that depend on northern freshwater systems, including KFN, attributed declining water levels in recent years to hydroelectric development. Concerns regarding the availability of freshwater for future generations were shared and expressed by community members:
Water is a living thing. The way it flows, it’s alive. If it’s not flowing, what is it going to be like? … You know I think about my great grandchildren … I won’t be around to see, but what are they going to have? … I pity my grandkids … Now all those guys who are fighting to put a pipeline into the north or wherever … My grandkids … my great grandkids are going to fight for a water pipeline to go that way [from here to BC someday]. It’s sad …
(Elder 1)
All in all, the KFN community voiced strong concerns related to declining water levels and provided numerous examples of indicators used to monitor and assess changes.

3.3.3. Decreasing Ice Thickness

Lastly, community members who engaged in ice fishing reported changes to the condition of the ice in recent years, specifically on the Great Slave Lake. An elder who grew up ice fishing on Great Slave Lake described changes to the measurements of ice thickness in his lifetime:
Now today, the lake doesn’t freeze. When I started going with my uncle … when he set nets there was just about 7 feet of ice. He used to kneel on his knee … he used to try to get to the bottom. Today he’s lucky … he won’t even hit 3 feet of ice now. When I grew up, oh I tell you, it was 30, 40 [degrees Celsius] below every day. Today, it gets to 20 [degrees Celsius below] sometimes, but not often … It’s a lot warmer …
(Elder 1)
Similarly, a fisher who frequently ice fishes on the lake with her family expressed tremendous concern for recent changes in ice thickness:
It’s not as thick as it used to be. I remember a hole being 7 feet down … like to jig a hole and to drill it out and everything. It was like 7 feet thick and now it’s … you’ll be lucky if you get 2 feet. That’s how it was last year and I’ve never seen that before in my life.
(Harvester 3)
The fisher added that the freeze up and weather conditions, specifically snowfall, in that particular year were contributing factors to the decreased ice thickness, as snow insulates the water below. KFN fishers further linked thinner ice to the effects of climate change, including warming temperatures. Evidently, the depth of ice served as an important quantitative indicator in the monitoring of climate change in KFN’s traditional territory.

4. Discussion and Conclusions

There is increasing interest in community-based monitoring (CBM) in many parts of the world, including northern communities in Canada [3,38,58]. Traditional ecological knowledge (TEK) is also increasingly recognized as an important source of knowledge for learning about and understanding complex ecosystem change [14,59]. Within this context, a research project was carried out with Kátł’odeeche First Nation (KFN) in the Northwest Territories to determine what kinds of indicators would be more meaningful and culturally appropriate in the development of a CBM program in this region, specifically the Hay River and Buffalo River basins of the Mackenzie River Basin (MRB).
The outcomes of the research, which included 15 interviews with elders, harvesters, and youth, identified key indicators and observations of change linked to fish health, water quality, water levels, ice conditions, as well as a range of other aspects of aquatic ecosystem health. As the quotes suggest, interviewee narratives were strongly connected to place and land-based practices (e.g., traditional fish harvesting). The work was consistent with previous research findings [17,18] in reaffirming that elders and fishers have a detailed understanding of the dynamics of their local ecosystems. Their temporal insights are not short term in nature but speak to very long-term patterns of change.
Furthermore, elders were able to distinguish variability in ecological events that were not previously seen before. These included climate-related events as well as resource development impacts. For instance, the presence of abnormalities such as growth and sores on fish have been observed in recent years, whereas in the past these signs, which indicate poor fish health, neither were necessary nor did they exist, as elders recalled growing up and observing healthy fish absent of any abnormalities.
Although exploratory, the outcomes of the research with KFN may be useful in informing the development of a local TEK-driven CBM program that is tied to broader monitoring in the Northwest Territories and Alberta, as well as the implementation of the bilateral agreements for monitoring and management of the Hay River watershed. The absence of long-term scientific monitoring of the aquatic health in the Hay River and limited baseline data [50] further emphasize the importance of TEK in addressing temporal knowledge gaps and generating baseline information that can be used to monitor future changes to the basin.
In addition to these outcomes, the monitoring program can be more than a tool for describing ecological change; it can also “become [a] tool for ongoing learning and communication with the elders and harvesters that hold and have ownership of this knowledge” [17] (p. 168). Currently, indicators in this study are used by KFN to monitor fish health, water quality, water levels, and ice depth and directly inform local decision-making with regards to the consumption of fish, drinking water, safety, and navigation. KFN fishers, for example, assess water levels utilizing indicators (i.e., observations of islands, sandbars, rocks) and, in turn, are able to make decisions related to navigation (i.e., their ability to access traditional hunting areas safely by boat). While CBM governance structures and the extent of Indigenous participation within CBM programs vary [8], CBM may signify an expression of Indigenous governance if communities have direct control over the social–ecological monitoring of freshwater systems and are leaders in the design of monitoring methods and outcomes. Externally and scientifically driven monitoring programs led by government or industry will not capture the TEK and place-based knowledge of local peoples.
Finally, on a regional scale, KFN indicators of change seek to contribute to the intended outcomes of the Alberta–Northwest Territories Bilateral Water Management Agreement [41], which aims to strengthen transboundary governance and management of the MRB through the development of indicators for monitoring. The process of developing indicators through direct collaboration with KFN contributes to the environmental monitoring and governance literature, as the process of identifying social–ecological indicators based on fishers’ observations, knowledge, and experiences can inform collaborative governance and the transboundary management of watersheds. Future research that documents TEK indicators of other communities living throughout the Hay River and Buffalo River sub-basins, along with the larger MRB, is needed to further explore relationships between social and ecological change, understand local communities’ adaptation strategies to change and inform watershed governance.

Author Contributions

Conceptualization, S.S. and B.P.; methodology, S.S., B.P. and C.S.; formal analysis, S.S.; investigation, S.S. and B.P.; resources, B.P.; data curation, S.S. and B.P.; writing—original draft preparation, S.S.; writing—review and editing, B.P. and C.S.; validation, S.S.; supervision, B.P. and C.S.; project administration, B.P.; funding acquisition, B.P. and S.S. All authors have read and agreed to the published version of the manuscript.

Funding

This Tracking Change research project was funded by the Social Sciences and Humanities Research Council, SSHRC PG 895-2015-1024. The Northern Scientific Training Program (NSTP) and University of Alberta North Research Awards also provided funding for fieldwork activities. C.S. Seixas was supported by The São Paulo Research Foundation (FAPESP) Grant No. 2018/08839-3.

Acknowledgments

The authors would like to extend a heartfelt máhsi cho (thank you) to Kátł’odeeche First Nation (KFN). Sydney Stenekes would like to thank KFN elders, harvesters, and youth, whom she was fortunate to meet during her visits to the community. Thank you to everyone who welcomed Sydney into their community and homes. The knowledge and stories that were graciously shared will not be forgotten. Sydney is also extremely grateful for the tremendous guidance and in-kind support that she received from Peter Redvers, KFN Director of Lands, Resources and Negotiations, and Patrick Riley, KFN Environmental Program Manager. Their support was integral throughout the duration of the research project. Finally, Sydney would like to thank Doug Lamalice and Anne Marie Kasper for the time they devoted to the project as community researchers. Their knowledge and community connections were invaluable. It was a pleasure working with them and learning about their beautiful traditional territory.

Conflicts of Interest

The authors declare no conflict of interest. The funders had no role in the design of the study; in the collection, analyses, or interpretation of data; in the writing of the manuscript; or in the decision to publish the results.

References

  1. Schindler, D.W.; Smol, J.P. Cumulative effects of climate warming and other human activities on freshwaters of Arctic and subarctic North America. Ambio 2006, 35, 160–168. [Google Scholar] [CrossRef]
  2. Whitelaw, G.; Vaughan, H.; Craig, B. Establishing the Canadian community monitoring network. Environ. Monit. Assess. 2003, 88, 409–418. [Google Scholar] [CrossRef] [PubMed]
  3. Kouril, D.; Furgal, C.; Whillans, T. Trends and key elements in community-based monitoring: A systematic review of the literature with an emphasis on Arctic and Subarctic regions. Environ. Rev. 2015, 24, 151–163. [Google Scholar] [CrossRef] [Green Version]
  4. Herrmann, T.M.; Royer, M.J.S.; Cuciurean, R. Understanding subarctic wildlife in Eastern James Bay under changing climatic and socio-environmental conditions: Bringing together Cree hunters’ ecological knowledge and scientific observations. Polar Geogr. 2012, 35, 245–270. [Google Scholar] [CrossRef]
  5. Carver, M.; Maclean, B. Community-Based Water-Depth Monitoring in the Peace-Athabasca Delta: Insights and Evaluation; ACFN Creek First Nation and Athabasca Chipewyan First Nation: Wilmington, DE, USA, 2016; p. 54. [Google Scholar]
  6. Parlee, B.L.; Goddard, E.; First Nation, Ł.K.D.; Smith, M. Tracking Change: Traditional Knowledge and Monitoring of Wildlife Health in Northern Canada. Hum. Dimens. Wildl. 2014, 19, 47–61. [Google Scholar] [CrossRef]
  7. Yarnell, P.; Gayton, D. Community-Based Ecosystem Monitoring in British Columbia: A Survey and Recommendations for Extension; FORREX Series: 13; FORREX: Kamloops, BC, Canada, 2003; ISBN 1894822196. [Google Scholar]
  8. Wilson, N.J.; Mutter, E.; Inkster, J.; Satterfield, T. Community-Based Monitoring as the practice of Indigenous governance: A case study of Indigenous-led water quality monitoring in the Yukon River Basin. J. Environ. Manag. 2018, 210, 290–298. [Google Scholar] [CrossRef]
  9. Tracking Change. Available online: www.trackingchange.ca (accessed on 10 March 2020).
  10. Berkes, F.; Folke, C.; Colding, J. Linking Social and Ecological Systems: Management Practices and Social Mechanisms for Building Resilience; Cambridge University Press: Cambridge, UK, 1998; ISBN 0521591406. [Google Scholar]
  11. Ostrom, E. A general framework for analyzing sustainability of social-ecological systems. Science 2009, 325, 419–422. [Google Scholar] [CrossRef]
  12. Ingold, T. The Perception of the Environment: Essays on Livelihood, Dwelling and Skill; Routledge: London, UK, 2000; ISBN 041522831. [Google Scholar]
  13. Berkes, F.; Colding, J.; Folke, C. Rediscovery of Traditional Ecological Knowledge as Adaptive Management. Ecol. Appl. 2000, 10, 1251. [Google Scholar] [CrossRef]
  14. Berkes, F. Sacred Ecology, 4th ed.; Routledge: New York, NY, USA, 2018; ISBN 9781351628303. [Google Scholar]
  15. Lawe, L.B.; Wells, J.; Cree, M. Cumulative effects assessment and EIA follow-up: A proposed community-based monitoring program in the Oil Sands Region, northeastern Alberta. Impact Assess. Proj. Apprais. 2005, 23, 205–209. [Google Scholar] [CrossRef]
  16. Lauer, M.; Matera, J. Who Detects Ecological Change after Catastrophic Events? Indigenous Knowledge, Social Networks, and Situated Practices. Hum. Ecol. 2016, 44, 33–46. [Google Scholar] [CrossRef]
  17. Parlee, B.; Manseau, M.; Lutsël K’e Dene First Nation. Understanding & Communicating About Ecological Change: Denesołine indicators of ecosystem health. In Breaking Ice: Renewable Resource and Ocean Management in the Canadian North; Berkes, F., Huebert, R., Eds.; University of Calgary Press: Calgary, AB, Canada, 2005; ISBN 1552381595. [Google Scholar]
  18. McDonald, M.A.; Arragutainaq, L.; Novalinga, Z. Voices from the Bay: Traditional Ecological Knowledge of Inuit and Cree in the Hudson Bay Bioregion; Canadian Arctic Resources Committee: Yellowknife, NT, Canada, 1997; ISBN 0919996752. [Google Scholar]
  19. Ellis, S.C. A Review of Traditional Consideration? Knowledge Meaningful in Environmental Decision Making. Arctic 2012, 58, 66–77. [Google Scholar]
  20. McKay, A.J.; Johnson, C.J. Confronting barriers and recognizing opportunities: Developing effective community-based environmental monitoring programs to meet the needs of Aboriginal communities. Environ. Impact Assess. Rev. 2017, 64, 16–25. [Google Scholar] [CrossRef]
  21. Berkes, F.; Berkes, M.K.; Fast, H. Collaborative integrated management in Canada’s North: The role of local and traditional knowledge and community-based monitoring. Coast. Manag. 2007, 35, 143–162. [Google Scholar] [CrossRef]
  22. Niemi, G.J.; McDonald, M.E. Application of ecological indicators. Annu. Rev. Ecol. Evol. Syst. 2004, 35, 89–111. [Google Scholar]
  23. Parlee, B.L. Dealing with Ecological Variability and Change: Perspectives from the Denesoline and Gwich’in of Northern Canada. Ph.D. Thesis, University of Manitoba, Winnipeg, MB, Canada, 2006. [Google Scholar]
  24. Mwesigye, F. Indigenous language use in grassroots environment indicators. In Grassroots Indicators for Desertification: Experience and Perspectives from Eastern and Southern Africa; Hambly, H.V., Angura, T.O., Eds.; International Development Research Centre: Ottawa, ON, Canada, 1996. [Google Scholar]
  25. Lyver, P.O.B.; Timoti, P.; Jones, C.J.; Richardson, S.J.; Tahi, B.L.; Greenhalgh, S. An indigenous community-based monitoring system for assessing forest health in New Zealand. Biodivers. Conserv. 2017, 26, 3183–3212. [Google Scholar] [CrossRef]
  26. Kupika, O.L.; Gandiwa, E.; Nhamo, G.; Kativu, S. Local ecological knowledge on climate change and ecosystem-based adaptation strategies promote resilience in the middle Zambezi Biosphere Reserve, Zimbabwe. Scientifica 2019. [Google Scholar] [CrossRef] [Green Version]
  27. Reyes-García, V.; Fernández-Llamazares, Á.; Guèze, M.; Garcés, A.; Mallo, M.; Vila-Gómez, M.; Vilaseca, M. Local indicators of climate change: The potential contribution of local knowledge to climate research. Wiley Interdiscip. Rev. Clim. Chang. 2016, 7, 109–124. [Google Scholar]
  28. Dinero, S.C. Indigenous perspectives of climate change and its effects upon subsistence activities in the Arctic: The case of the Nets’aii Gwich’in. GeoJournal 2013, 78, 117–137. [Google Scholar]
  29. Pearce, T.; Smit, B.; Duerden, F.; Ford, J.D.; Goose, A.; Kataoyak, F. Inuit vulnerability and adaptive capacity to climate change in Ulukhaktok, Northwest Territories, Canada. Polar Rec. 2010, 46, 157–177. [Google Scholar]
  30. Tam, B.Y.; Gough, W.A.; Edwards, V.; Tsuji, L.J.S. The impact of climate change on the well-being and lifestyle of a First Nation community in the western James Bay region. Can. Geogr. 2013, 57, 441–456. [Google Scholar]
  31. Boissière, M.; Locatelli, B.; Sheil, D.; Padmanaba, M.; Sadjudin, E. Local perceptions of climate variability and change in tropical forests of Papua, Indonesia. Ecol. Soc. 2013, 18. [Google Scholar] [CrossRef] [Green Version]
  32. Mantyka-Pringle, C.S.; Jardine, T.D.; Bradford, L.; Bharadwaj, L.; Kythreotis, A.P.; Fresque-Baxter, J.; Kelly, E.; Somers, G.; Doig, L.E.; Jones, P.D.; et al. Bridging science and traditional knowledge to assess cumulative impacts of stressors on ecosystem health. Environ. Int. 2017, 102, 125–137. [Google Scholar] [CrossRef] [Green Version]
  33. Parlee, B.L.; Geertsema, K.; Willier, A. Social-Ecological Thresholds in a Changing Boreal Landscape. Ecol. Soc. 2012, 17, 20. [Google Scholar] [CrossRef] [Green Version]
  34. Parlee, B. Traditional Knowledge Overview for the Athabasca River Watershed. Contributed to the Athabasca Watershed Council State of the Watershed Phase 1 Report; Athabasca Watershed Council: Hinton, AB, Canada, 2011; pp. 1–57. [Google Scholar]
  35. Baldwin, C.; Bradford, L.; Carr, M.K.; Doig, L.E.; Jardine, T.D.; Jones, P.D.; Bharadwaj, L.; Lindenschmidt, K.E. Ecological patterns of fish distribution in the Slave River Delta region, Northwest Territories, Canada, as relayed by traditional knowledge and Western science. Int. J. Water Resour. Dev. 2018, 34, 305–324. [Google Scholar] [CrossRef]
  36. Wilson, N.J.; Harris, L.M.; Joseph-Rear, A.; Beaumont, J.; Satterfield, T. Water is medicine: Reimagining water security through Tr’ondëk Hwëch’in relationships to treated and traditional water sources in Yukon, Canada. Water 2019, 11, 624. [Google Scholar] [CrossRef] [Green Version]
  37. Nadasdy, P. The politics of Tek: And “integration” of knowledge. Arctic Anthropol. 2012, 36, 1–18. [Google Scholar]
  38. Fresque-Baxter, J.; Kelly, E. Going to the Well: Water as a Community Builder. In The Human Face of Water Security; Devlaeminck, D., Adeel, Z., Sandford, R., Eds.; Springer International Publishing: Cham, Germany, 2017; pp. 173–196. ISBN 978-3-319-50161-1. [Google Scholar]
  39. Parlee, B. Mobilizing to address the impacts of oil sands development: First nations in environmental governance. First World Petro-Politics Polit. Ecol. Gov. Alberta 2016, 329–355. [Google Scholar]
  40. Government of Canada; Government of British Columbia; Government of Alberta; Government of Saskatchewan; Government of the Yukon; Government of the Northwest Territories. Mackenzie River Basin Transboundary Waters Master Agreement. 1997. Available online: http://www.mrbb.ca/uploads/files/general/19/mackenzie-river-basin-transboundary-waters-master-agreement.pdf (accessed on 5 April 2019).
  41. Government of Alberta; Government of Northwest Territories. Mackenzie River Basin Bilateral Water Management Agreement between the Government of Alberta and the Government of the Northwest Territories; Government of Alberta (GA): Edmonton, AB, Canada; Government of the Northwest Territories (GNWT): Yellowknife, NT, Canada, 2015. Available online: https://www.enr.gov.nt.ca/sites/enr/files/ab-nwt_water_management_agreement_final_signed_2.pdf (accessed on 5 April 2019).
  42. Government of Alberta; Government of Northwest Territories. Working Together to Manage Our Shared Waters. Alberta-Northwest Territories Bilateral Management Committee Annual Report to Ministers 2015–2016. 2017. Available online: http://aep.alberta.ca/water/education-guidelines/documents/Alberta-NWT-BMC-AnnualReport-Nov2017.pdf (accessed on 5 April 2019).
  43. Statistics Canada. Census Profile, 2016 Census: Hay River Dene 1, Indian Reserve. Available online: https://www12.statcan.gc.ca/census-recensement/2016/dppd/prof/details/page.cfm?Lang=E&Geo1=CSD&Code1=6104017&Geo2=PR&Code2=61&Data=Count&SearchText=Hay%20River%20Dene%201&SearchType=Begins&SearchPR=01&B1=All&GeoLevel=PR&GeoCode=6104017&TABID=1 (accessed on 7 April 2019).
  44. Kátł’odeeche Fırst Natıon. Kátł’odeeche Fırst Natıon History and Traditional Lands. Available online: https://www.katlodeeche.com/index.php/38-rokstories/rokstories-frontpage/94-katlodeeche-first-nation-history (accessed on 10 April 2019).
  45. Eagle-Eye Concepts. Kátł’odeeche Fırst Natıon Traditional Knowledge Assessment. Available online: http://reviewboard.ca/upload/project_document/EA0607-002_Katlodeeche_First_Nation_Traditional_Knowledge_Study.pdf (accessed on 1 May 2019).
  46. Government of Alberta; Government of Northwest Territories. Map of Mackenzie River Basin. Available online: https://open.alberta.ca/dataset/04bd459d-1ce3-441c-a882-7eade555822e/resource/1276a5a4-f257-4443-bde2-b8338b0f2a62/download/alberta-nwt-bmc-annualreport-nov2017.pdf (accessed on 10 April 2019).
  47. Creery, R.A. Avoiding Further Downstream Crises: The Mackenzie River Basin Committee. Can. Water Resour. J. 1979, 4, 60–66. [Google Scholar] [CrossRef] [Green Version]
  48. Lewis, G.D.; Milburn, D.; Smart, A. The Challenge of Interjurisdictional Water Management in the Mackenzie River Basin. Can. Water Resour. J. 2010, 16, 381–390. [Google Scholar] [CrossRef]
  49. Government of the Northwest Territories. NWT Water Monitoring Inventory. Available online: https://www.nwtwaterstewardship.ca/sites/water/files/resources/628750_-_water_strategy_-_water_monitoring_inventory_-_updated_feb2014_for_website.pdf (accessed on 3 March 2020).
  50. Stantec. State of the Aquatic Knowledge for the Hay River Basin; Government of Northwest Territories, 2016. Available online: http://www.enr.gov.nt.ca/sites/enr/files/aquatic_knowledge_hay_river_basin.pdf (accessed on 20 April 2019).
  51. The Hay River: Water Monitoring Activities in the Hay River Region; Aboriginal Affairs and Northern Development Canada: Gatineau, QC, Canada, 2014; ISBN 9781100233420.
  52. Smith, L.T. Decolonizing Methodologies: Research and Indigenous Peoples, 2nd ed.; Zed Books: New York, NY, USA, 1999; ISBN 9781848139503. [Google Scholar]
  53. Gaudry, A.J.P. Insurgent Research. Wicazo Sa Rev. 2011, 26, 113–136. [Google Scholar] [CrossRef]
  54. Castleden, H.; Morgan, V.S.; Lamb, C. “I spent the first year drinking tea”: Exploring Canadian university researchers’ perspectives on community-based participatory research involving Indigenous peoples. Can. Geogr. 2012, 56, 160–179. [Google Scholar] [CrossRef]
  55. Fletcher, C.M. Community-based participatory research relationships with Aboriginal communities in Canada: An overview of context and process. Pimatziwin J. Aborig. Indig. Community Health 2003, 1, 27–62. [Google Scholar]
  56. Huntington, H.P. Observations on the utility of the semi- directive interview for documenting traditional ecological knowledge. Arctic 1998, 51, 237–242. [Google Scholar] [CrossRef]
  57. Hsieh, H.F.; Shannon, S.E. Three approaches to qualitative content analysis. Qual. Health Res. 2005, 15, 1277–1288. [Google Scholar] [CrossRef] [PubMed]
  58. Thompson, K.-L.; Reece, N.; Robinson, N.; Fisher, H.-J.; Ban, N.C.; Picard, C.R. “We monitor by living here”: Community-driven actualization of a social-ecological monitoring program based in the knowledge of Indigenous harvesters. Facets 2019, 4, 293–314. [Google Scholar] [CrossRef] [Green Version]
  59. Peloquin, C.; Berkes, F. Local knowledge, subsistence harvests, and social-ecological complexity in James Bay. Hum. Ecol. 2009, 37, 533–545. [Google Scholar] [CrossRef]
Figure 1. Map of Study Area—Hay River and Buffalo River Sub-basins.
Sustainability 12 07923 g001
Table 1. Interviewee Sample.
IntervieweesMaleFemale
Elders62
Harvesters22
Youth21
Table 2. Fish Health Indicators and Observations of Social–Ecological Change.
IndicatorIndicator Frequency (# of Interviewees Who Referenced Indicator)Observations (Most Commonly Reported by Interviewees)Questions for Future Monitoring
Spawning and Fish Eggs 6Recent changes in fish spawning patterns (e.g., difficult to predict when fish spawn up the Hay River in the fall time).Are the fish spawning in different areas, at different times of year? Are fish spawning up the Hay River in the fall time? Are there eggs in the fish? Are there more or less than normal? What colour are they? Are they bigger or smaller in size than usual?
Abundance and Fish Populations4A lot of healthy whitefish are being caught in the Hay River. More trout are being caught in the Great Slave Lake in recent years. Are there more or less fish (whitefish, jackfish, pickerel, trout etc …)? Are there new fish species? Are there more trout, pickerel being caught in recent years?
Size4The fish appear to be round and fat in Sandy Creek.Are the fish skinny/bony? Are the fish round/fat?
Presence of Abnormalities/Deformities7Increasing numbers of fish are being caught with abnormalities in Great Slave Lake. Fish with pus are not being consumed by humans or being fed to the dogs.Are there any scars, sores, bruising, puncture wounds (pus), growth, worms, and bugs found outside or inside of the fish? Are the fish safe for humans to consume? Are the fish safe to feed to dogs?
External and Internal Colour5Whitefish in the Hay River are darker than in the Great Slave Lake. Whitefish are pale/white in the lake.Are the whitefish pale/white? Is the meat or liver discoloured?
Fat Content4The whitefish in Great Slave Lake appear to have a high fat content.Do the fish have more or less fat than normal?
Texture4No reported observations. Is the flesh of the fish firm or soft?
Colour of Fish Gills4No reported observations. Are the fish gills dark pink/red?
Smell3The fish caught in the Hay River smell funny. Do the fish smell funny? Do the fish smell like diesel?
Taste2The fish taste soapy from the Hay River, in comparison to Great Slave Lake.Do the fish taste soapy?
Stomach Content2The fish in Hay River appear to be dirtier and have more silt in their stomachs than the fish found further out in the Great Slave Lake.Is the stomach of the fish clean? Is there dirt or silt in the stomach?
Table 3. Freshwater System Indicators and Observations of Social–Ecological Change.
IndicatorIndicator Frequency (# of Interviewees Who Referenced Indicator)Observations (Most Commonly Reported by Interviewees)Questions for Future Monitoring
Access to Clean and Safe Drinking Water 12The water is safe to drink further out on Great Slave Lake, towards the middle. People are now having to travel further out, away from Hay River, to access clean drinking water. The water is not safe to drink during the spring ice break-up.Do you have to travel further to access clean and safe drinking water on Great Slave Lake? How many kms from the mouth of Hay River? Where and when is it safe to drink water? Are there times and places where it is no longer safe to drink the water? Does the water have to be boiled before it is safe to drink?
Colour of Water and Clearness11The water is darker, murkier, and less clear in the Hay River than it once was.Has the colour or clearness of the water changed? Is the water dark, murky, dirty or yellow?
Perceived Risk of Contamination11Diesel surfaced when puncturing a hole in the ice on Great Slave Lake. Increased concerns regarding the health of freshwater systems located downstream of resource development.Is the body of water in close proximity or downstream of industry? Are contaminants like diesel present in the water?
Algae Growth4More “green stuff” or algae is present in Hay River and Great Slave Lake near the shore.Is there “green stuff” or algae on the water?
The Health of Fish and Other Animals4The fish are not dying (e.g., floating dead in the water).Are other animals (fish, wildlife) healthy?
Taste
Temperature
2
1
The water tastes the best further out on Great Slave Lake.
No reported observations.
Does the water taste fresh?
Is the water temperature warming?
Water Levels8Creeks and streams are drying up and water levels are declining in Great Slave Lake, Hay River and Buffalo River. There are more sandbars in Hay River and Buffalo River and more shoreline appearing on Great Slave Lake. Islands and rocks are emerging in the Hay River. There is increased concern regarding the impacts of climate change and hydroelectric development on water levels.Are water levels declining in rivers and lakes? Are small creeks and streams drying up? Are there new sandbars/islands appearing in the Hay River, on Buffalo River? Is the shoreline changing on Great Slave Lake? Are certain traditional areas difficult to access (e.g., Alexandra Falls, Buffalo River)? Are you able to walk across certain rivers in the summertime? Is the body of water located downstream of hydroelectric development?
Ice Thickness2The ice thickness is decreasing on Great Slave Lake. It used to be 7 feet, now it’s closer to 2-3 feet.Is ice thickness decreasing? Are winter temperatures warming?

