Article

Hysteretic Response of Tilt-Up Concrete Precast Walls with Embedded Steel Plate Connections

1
Department of Architectural Engineering, Chungnam National University, Daejeon 34134, Korea
2
K-Water Ltd., Daejeon 34350, Korea
3
Department of Architectural Engineering, Gachon University, Gyeonggi-do 13120, Korea
*
Author to whom correspondence should be addressed.
Sustainability 2020, 12(19), 7907; https://doi.org/10.3390/su12197907
Submission received: 12 August 2020 / Revised: 21 September 2020 / Accepted: 21 September 2020 / Published: 24 September 2020

Abstract

:
Many connection systems are available that can transfer tension and shear loads from a precast concrete wall panel to a floor slab. However, due to the insufficient anchor depth in relatively thin precast concrete panels, it is difficult to attain adequate ductility and stiffness to ensure structural integrity. Based on the authors’ previous research results, the supplementary reinforcement of embedded steel plates in precast concrete wall panels can enhance stiffness while maintaining allowable displacement and ductility. In this study, three full-size tilt-up precast concrete panels with embedded steel plates were fabricated. Lateral cyclic loads were applied to full support structures consisting of a precast concrete wall panel and a foundation. The test results were compared with the results predicted using existing code equations found in the American Concrete Institute 318-14 and the Prestressed Concrete Institute Handbooks. The test results confirm that the supplementary reinforcement of thin precast concrete wall panels can provide (i) the required strength based on current code equations, (ii) sufficient ductility, and (iii) the energy dissipation capacity to resist cyclic loading.

1. Introduction

Precast concrete wall panels typically have weak planes because the panels are relatively thin, and so their design is a critical consideration in determining the strength, stability, and integrity of the building in which they are used. Specifically, the seismic behavior of a precast sandwich panel structure depends significantly on the connection between the wall panel system and the foundation [1,2,3,4]. However, current design codes do not address the seismic design of precast sandwich panel connections. A Prestressed Concrete Institute (PCI) committee report includes examples of details for connecting sandwich panels to foundations, to other framing members of the structure, and to other sandwich panels, but does not mention seismic considerations despite the fact that the seismic performance of tilt-up wall construction is closely related to its connection system [5,6,7]. Therefore, the design engineer faces difficulty in ensuring that the connection details provide sufficient stiffness to resist service loading within allowable deformation limits while also ensuring that each connection has sufficient ductility, energy dissipation capacity, and stability to resist seismic loads [8,9]. Adequate stiffness, ductility, and energy dissipation capacity in the connection system of thin precast concrete wall panels are critical to the structure’s integrity [10,11,12].
Among the connection systems, the embedded steel plate in the wall panel shows fairly rigid performance in the strength and inelastic phase, with some degree of energy dissipation capacity through ductile deformation [13,14]. Alternatively, headed shear stud connectors attach fully at the steel frame around the perimeter of each wall panel for steel frames with partially restrained connections and reinforced concrete infill walls [15].
Anderson and Meinheit investigated the behavior of grouted anchors installed in cracked concrete and tested in tension [16,17]. They thoroughly tested a variety of products, anchor configurations, installation conditions, edge distances, and group anchor spacing. The equations adopted in the PCI Handbook, 6th edition, were formulated using the function of the effective embedment depth of the headed stud (hef) and stud diameter (d) [18]. The PCI Handbook proposes Equation (1) for a group of anchors:
V c p g = 26.4   λ   n   f c ( d ) 1.5 ( h e f ) 0.5
where Vcpg is the nominal pry-out shear strength (N), λ is a concrete unit weight factor found in the American Concrete Institute (ACI) 318 provisions, and n is the total number of anchors in the connection.
ACI 318M-14 proposes Equations (2) and (3) as the prediction equations:
V c p g = k c p N c b g
N c b g = 16.75 f c ( h e f ) 1.5
where kcp is the coefficient for pry-out strength and Ncbg is the concrete breakout strength in tension.
In a previous work, Choi et al. [19] concluded that deformation at the ultimate load and ductility both increased with respect to the amount of supplementary reinforcement. The strain level of the reinforcement showed that supplementary reinforcement helped to increase the shear strength as well as ductility. Thus, supplementary reinforcement is needed in thin precast concrete wall panels in order to enhance structural performance. These results also indicated that the use of supplementary reinforcement and deeper embedment (hef) of the headed stud can lead to ductile behavior. Alternatively, the diagonal reinforcement in the precast wall system provides ultimate effectiveness of reinforcement tensile strength that can be distributed for better performance of wall panels under earthquake loads [20].
In this research, three full-scale precast concrete tilt-up wall panels with embedded steel plates were fabricated and connected to foundations. Tests were performed to investigate the seismic performance of the connections under reversed cyclic loads at different combined flexure and shear rates. This study also investigated the effects of longitudinally reinforced bars welded to the embedded steel plates and the effects of gauge steel plates that were used to center each concrete tilt-up sandwich panel.

2. Experimental Program

2.1. Fabrication

The tests were designed to employ supplementary steel reinforcement as a parameter to assess the performance of the connection between a concrete wall and its foundation. Table 1 presents the identification designations (P1, P2, and P3) of the three precast wall panels used in this study and details about the embedded steel plates used for the connections. Each specimen was connected to the foundation using four headed studs. The depth-to-diameter ratio (h/d = 4.77) used was relatively small. Figure 1a shows an embedded steel plate with four headed studs (ϕ 22 mm) for specimen P1. Two D10 rebars were attached to the embedded steel plates as supplementary reinforcement for specimens P2 and P3, as shown in Figure 1b. For specimen P3, shown in Figure 1c, a gauge steel plate was inserted between the embedded steel plate and the foundation to reflect field construction conditions.
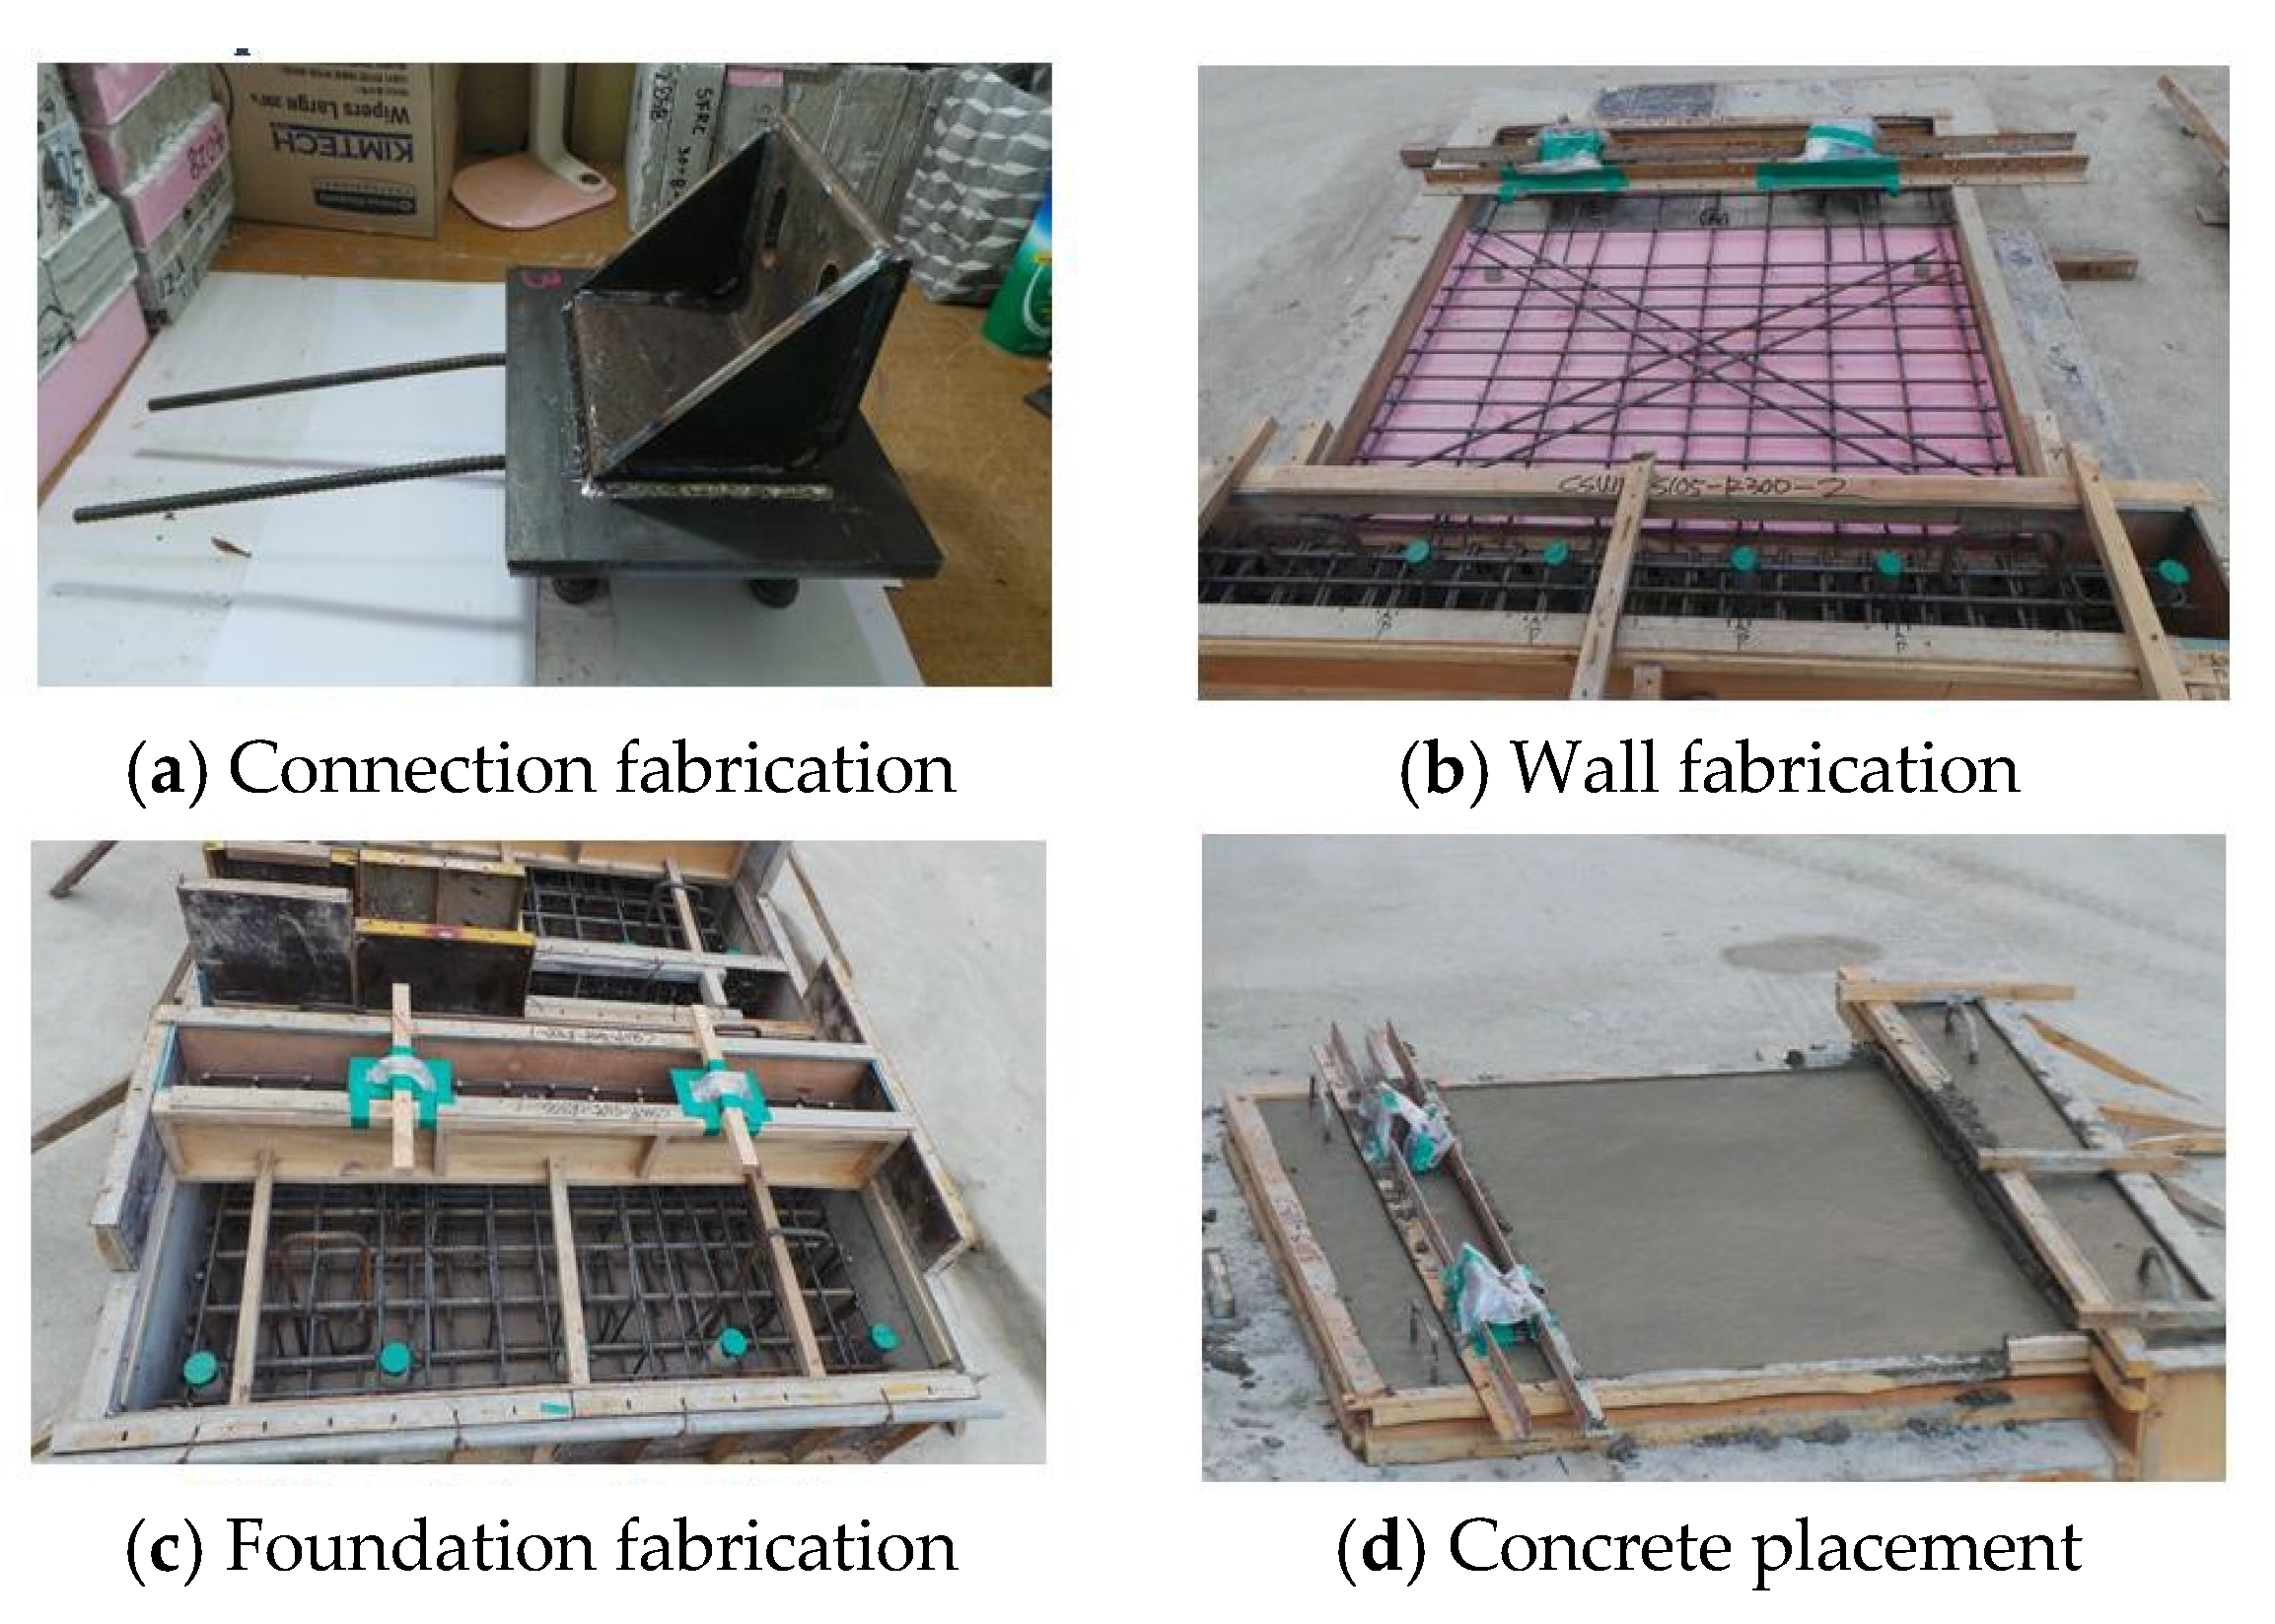
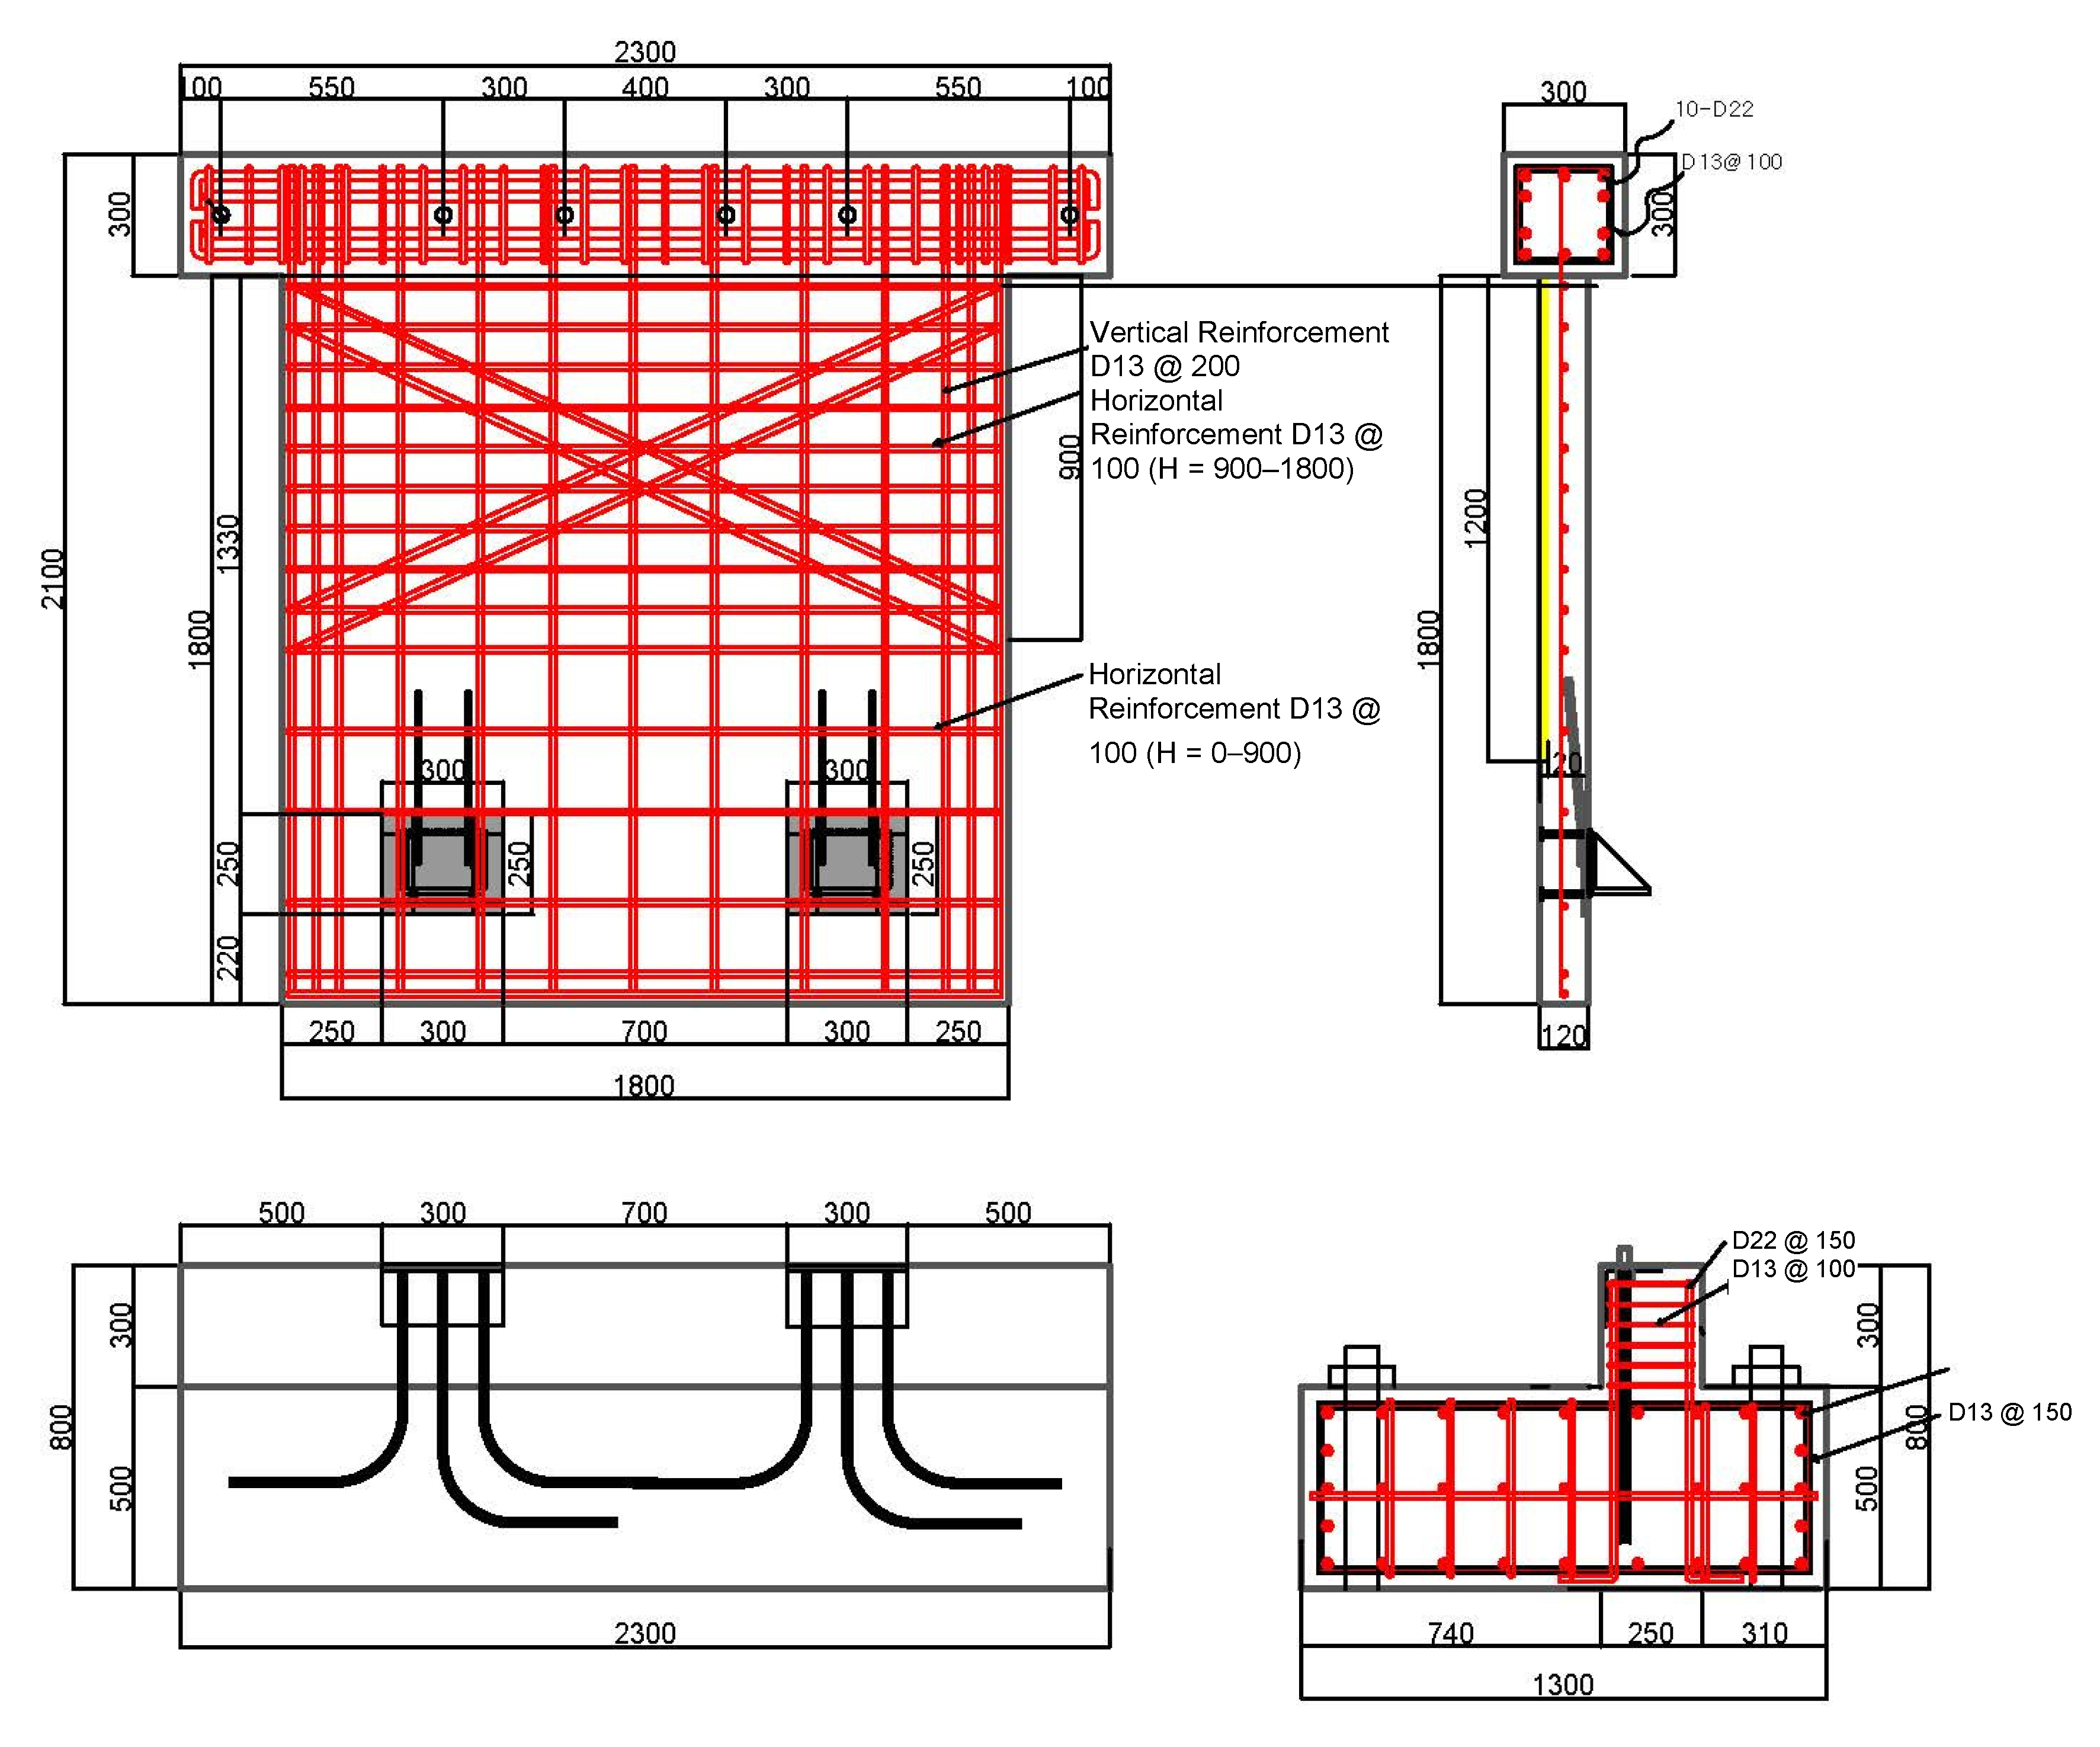
To fabricate each specimen, the studs and shearing bolts were welded onto the embedded plate to secure the connection, as shown in Figure 2a. Next, the formwork was fabricated, the reinforcement was assembled, and the connections were installed, as shown in Figure 2b,c. The concrete used in Figure 2d had a design compressive strength of 24 MPa and was air-cured prior to testing. The tilt-up process was conducted by raising the wall foundation after grouting and after the joints were fixed. Each of the three wall panel specimens was connected using four headed studs with the embedment depth of 150 mm, and the connection between the wall panel and the foundation was made using a hook anchor reinforcement of 3-D25 (ϕ 25 mm). The lateral and vertical reinforcements (D13 ϕ 13 mm) were spaced 200 mm apart. Figure 3 shows the layout of the reinforcement details. Detailed information related to the fabrication and test setup can be found in Kim [20].

2.2. Loading Procedure

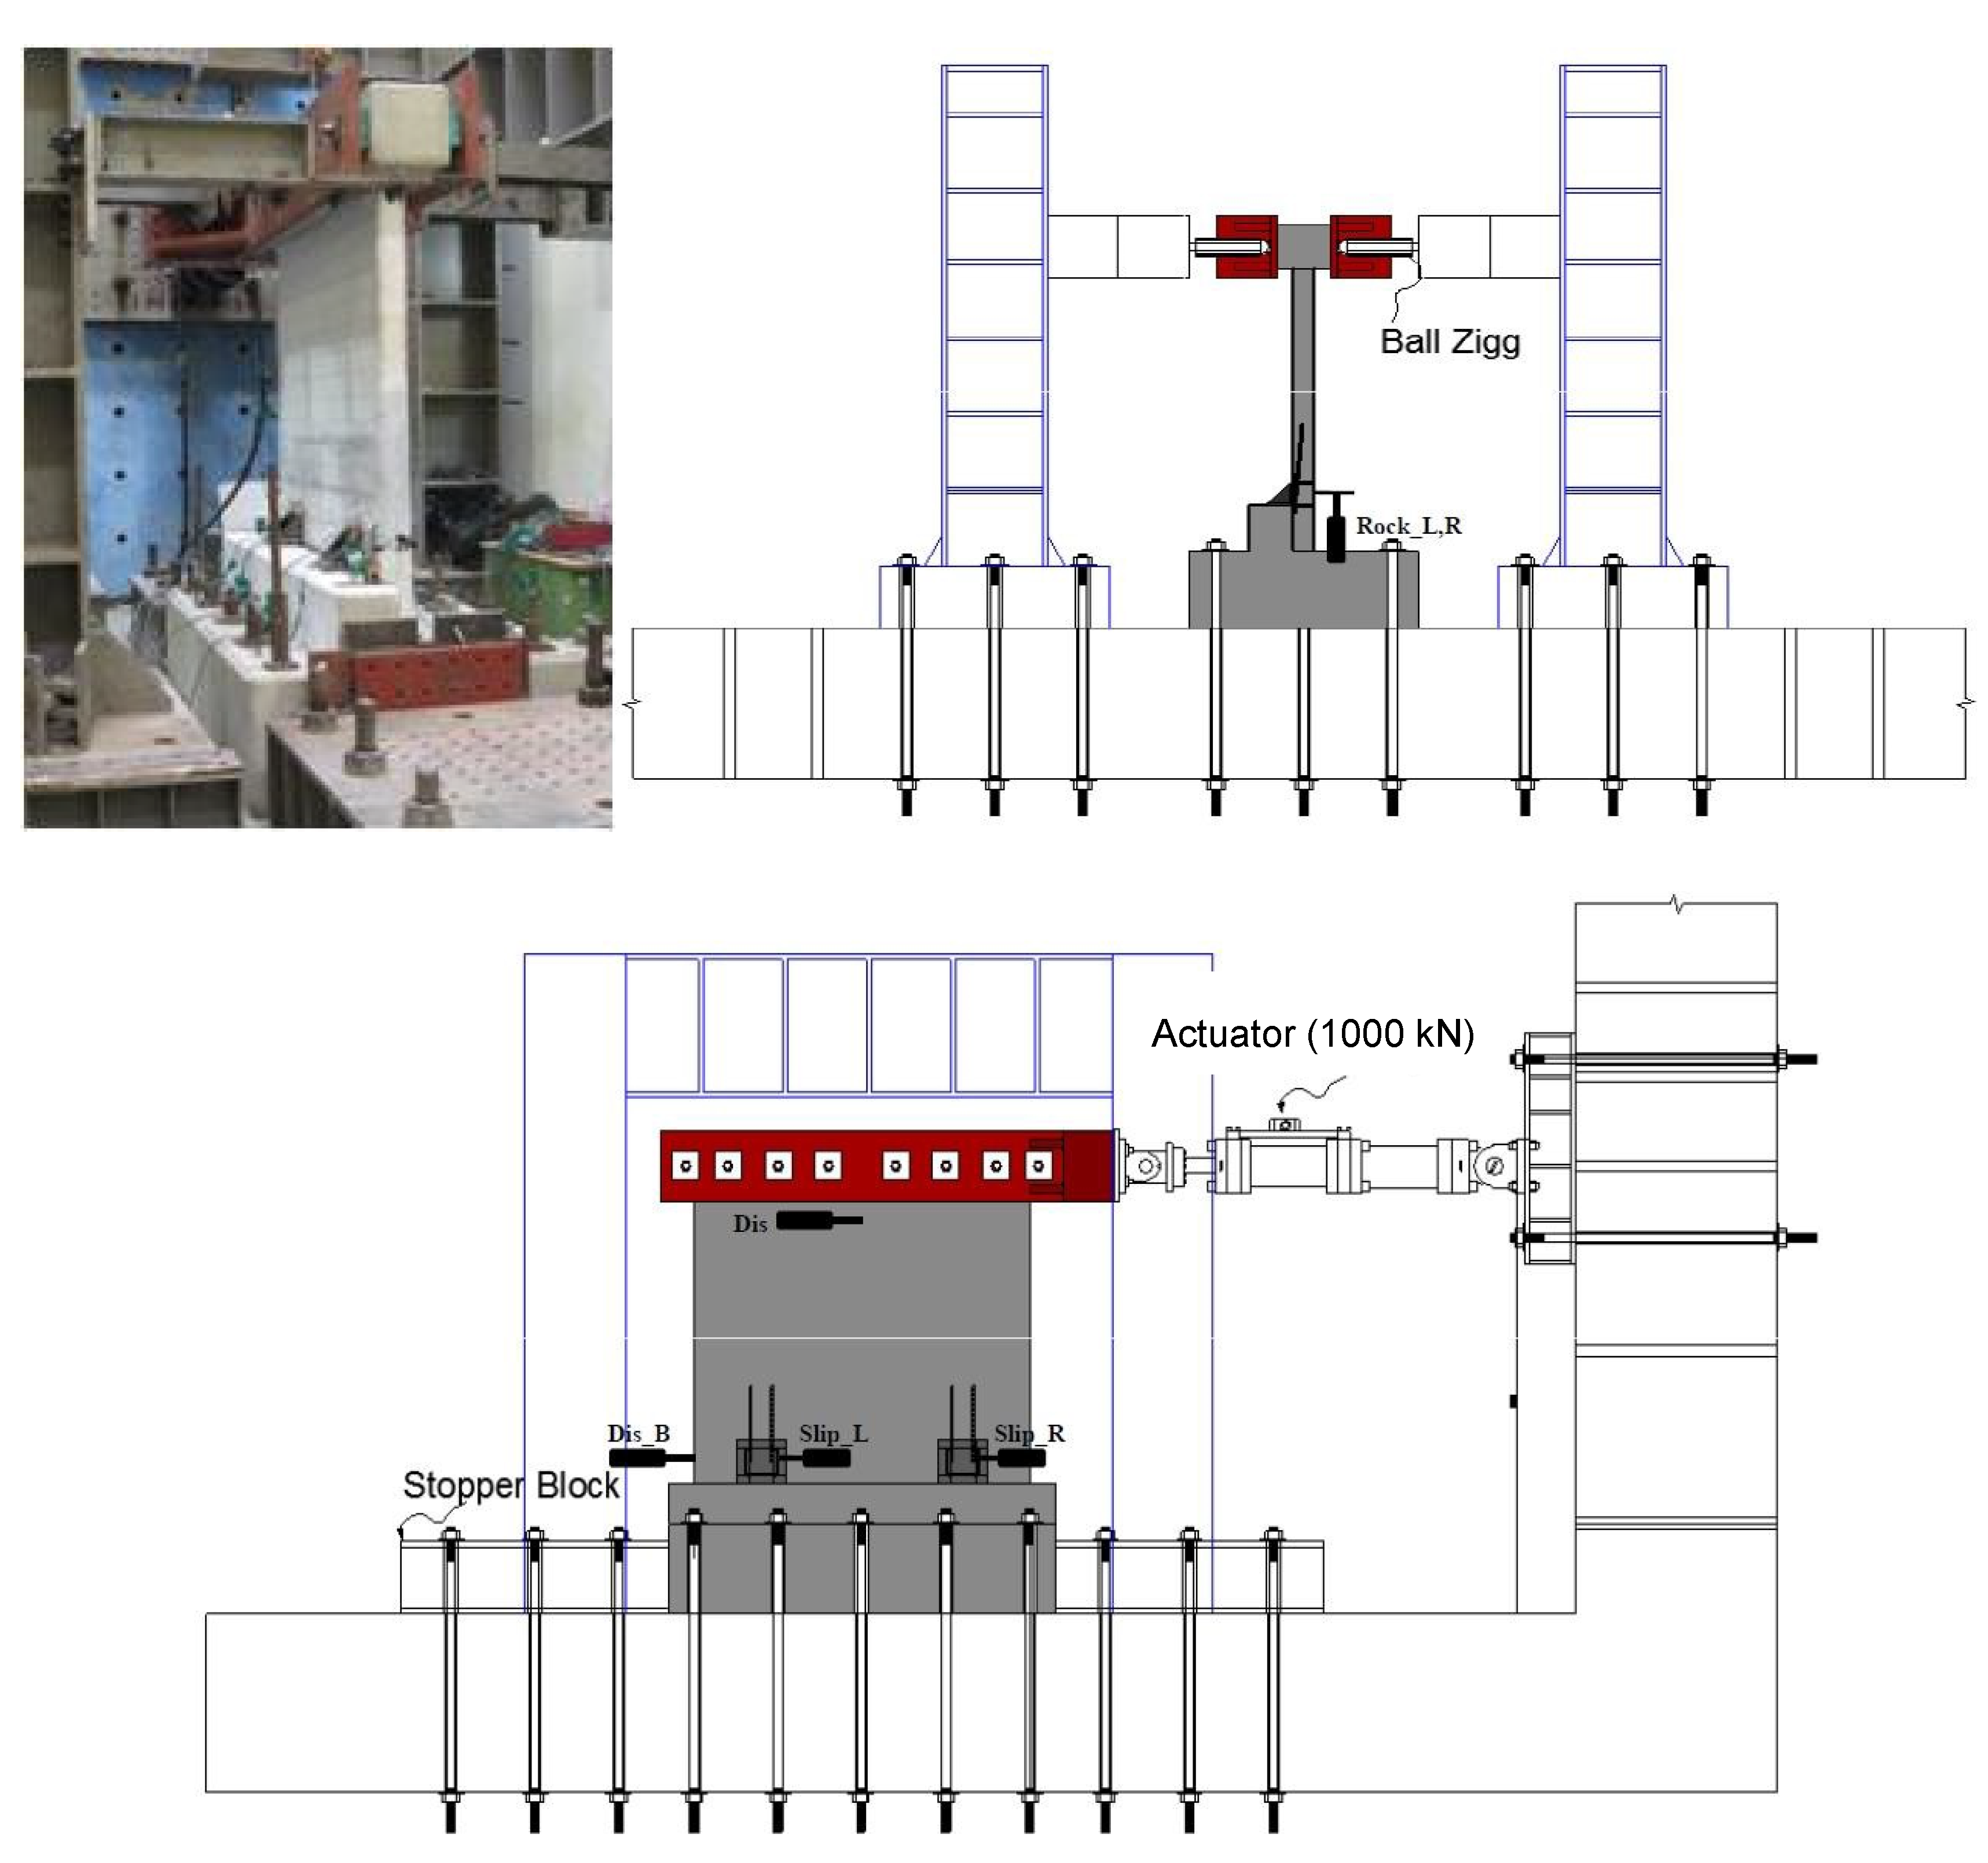
The foundation was fixed on a reaction frame in order to evaluate the performance of the steel plate connection within the tilt-up insulated precast concrete wall. After fixing the guide frame, the load beam was cyclically loaded in displacement control mode by employing an actuator with 1000 kN capacity. Figure 4 and Figure 5 show the installation status and loading details of a specimen, respectively. Shear force was applied to the wall panel and achieved by fabricating the load frame with four-point rounded ends.
The load–displacement relationship, which was based on the imposed load, was determined based on the displacement that was measured for each load applied to the static dissipative tile installed at the center of the wall. Loading was applied repeatedly in accordance with load cycles. The displacement for each cycle of loading was recorded in order to determine the status based on the load imposed at the main rebar of the boundary member and the vertical rebar of the wall. A wire strain gauge was installed at these locations prior to measuring the strain. Gauges were also installed at the top and bottom of the wall to measure the horizontal drift, slippage, and shear displacement of each specimen at locations outside the plane. A dial gauge was also installed at the top and the bottom of the wall in order to measure shear deformation.

3. Results and Discussion

3.1. Cyclic Load–Displacement Curve and Failure Model

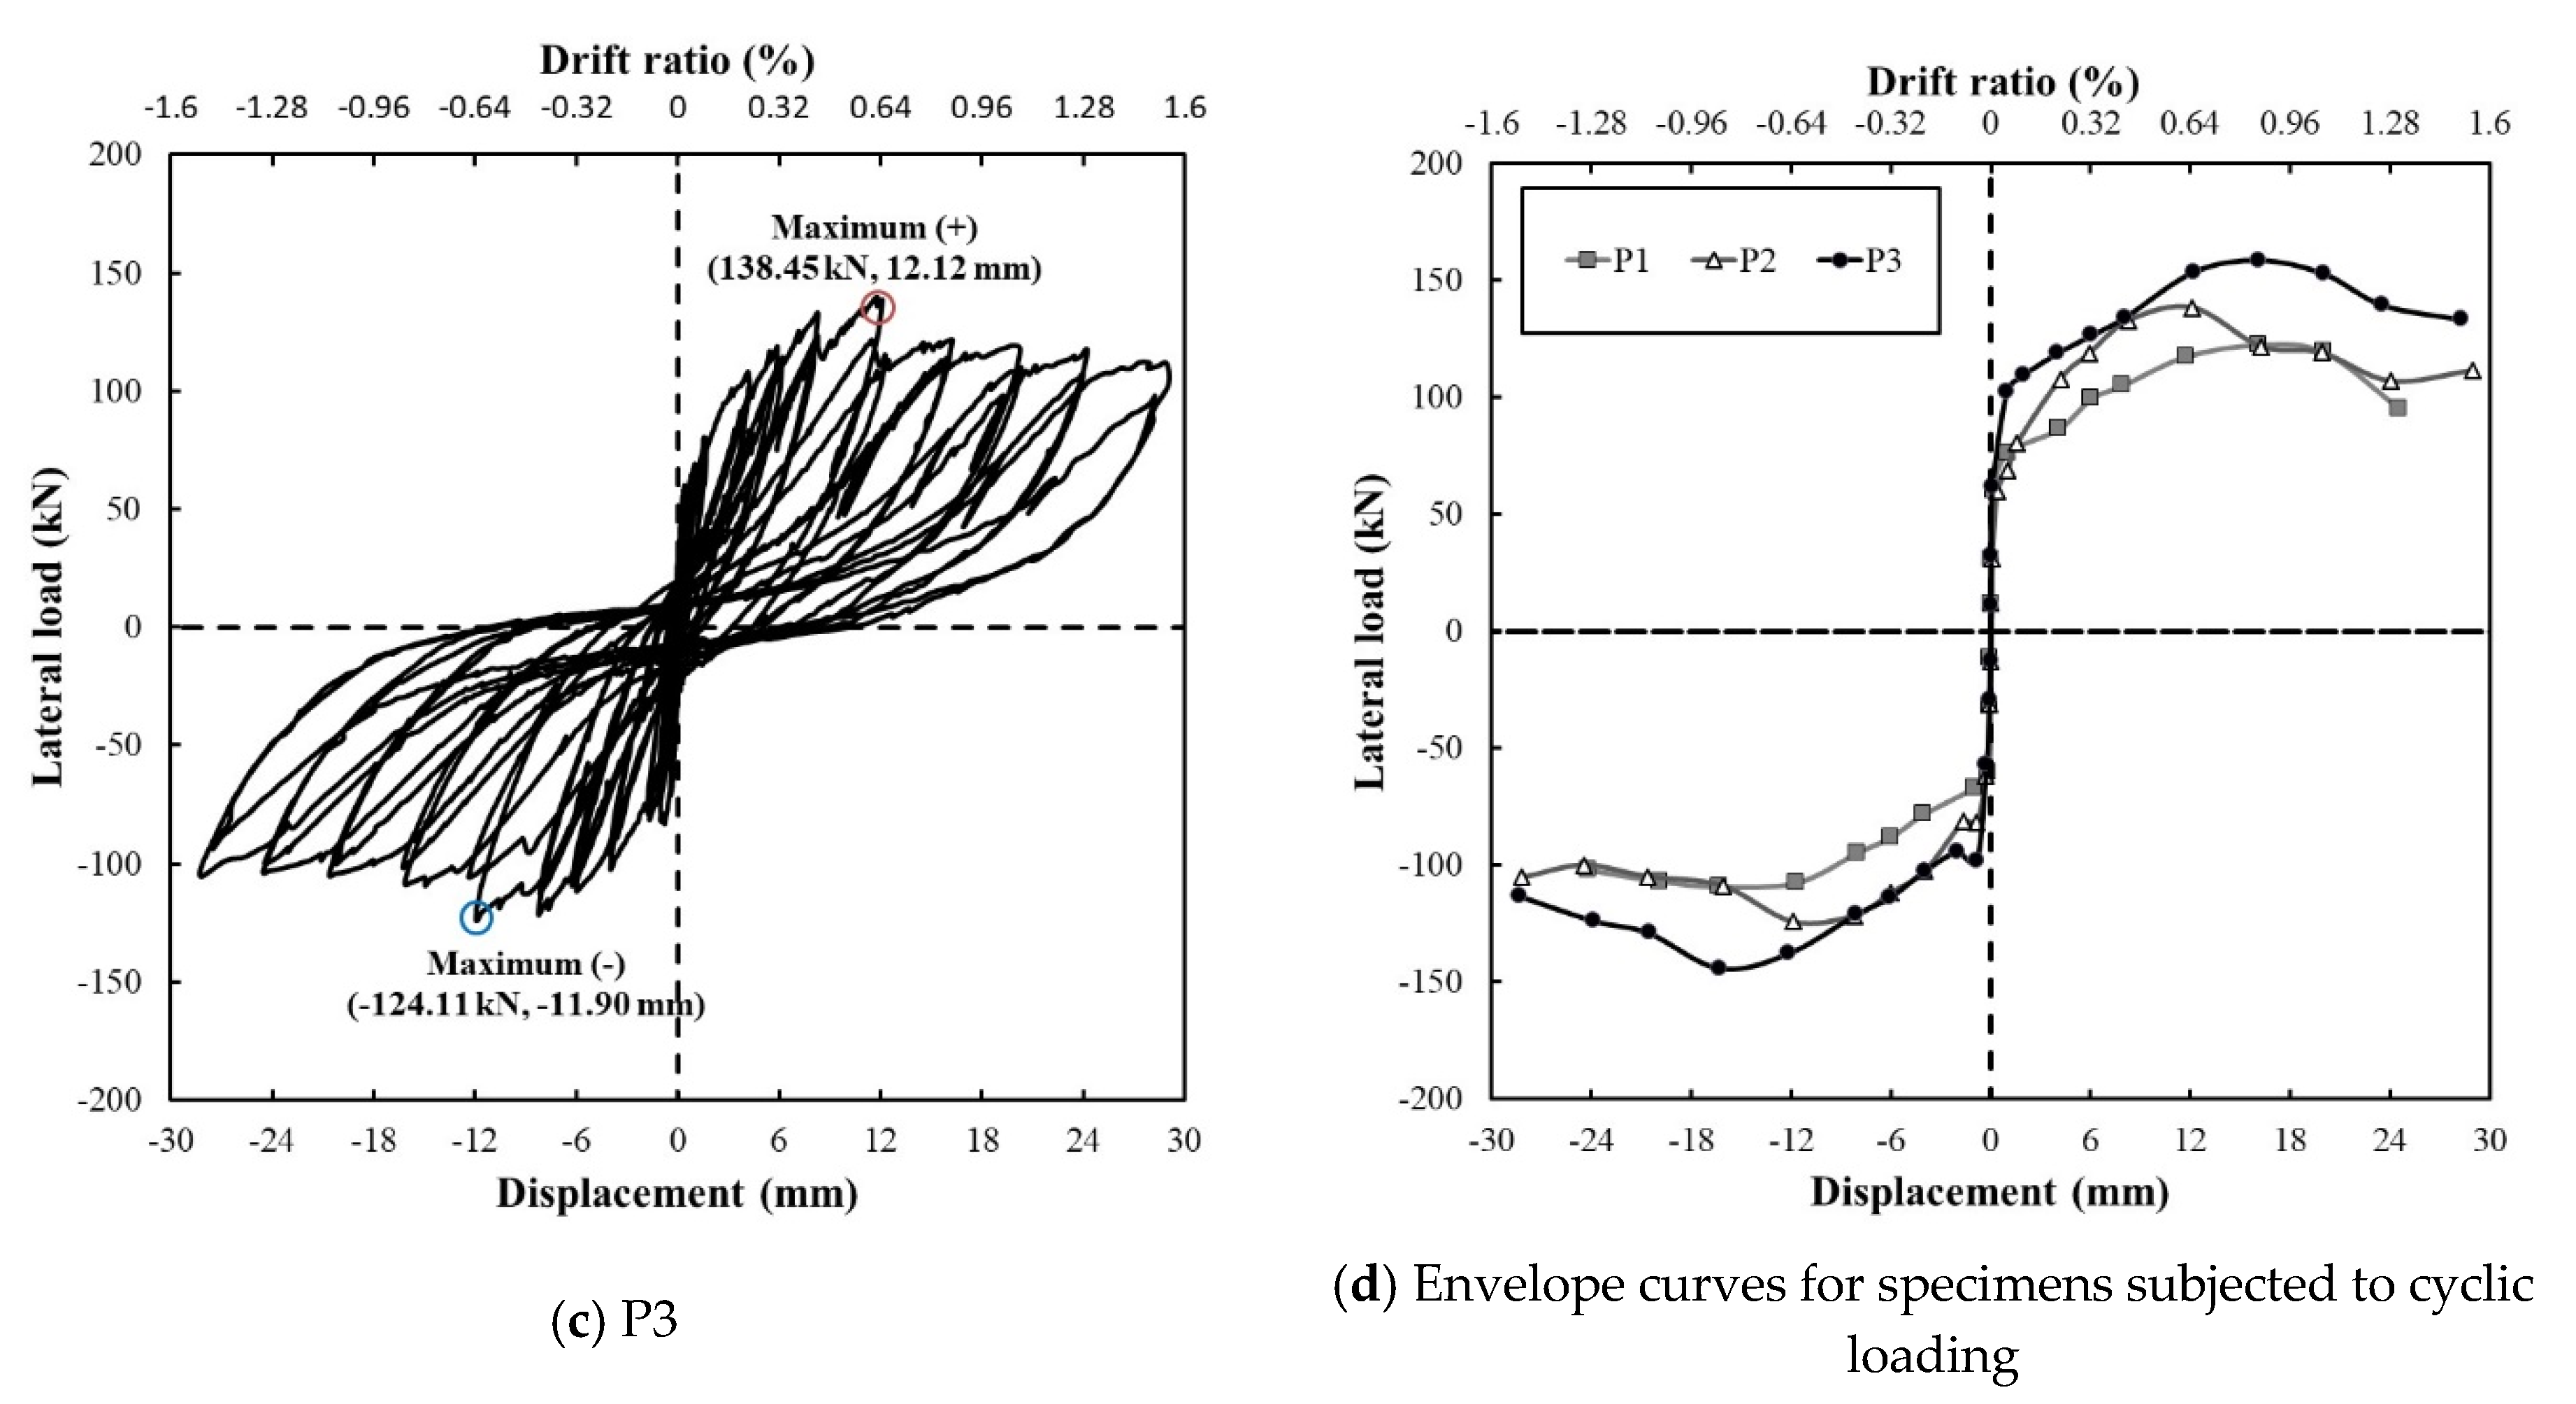
The relationship between load and displacement in accordance with reversed cyclic loading is shown in Figure 6. The figures include the maximum load for each specimen and the corresponding displacement.
With regard to the load–displacement relationship of specimen P1 shown in Figure 6a, the displacement was 16.16 mm upon positive loading, which corresponds to a maximum load of 122.73 kN. Upon negative loading, the displacement was −16.32 mm with a corresponding maximum load of −109.23 kN. Thereafter, the load decreased rapidly.
For specimen P2, shown in Figure 6b, the displacement was 16.12 mm upon positive loading, which corresponds to a maximum load of 158.79 kN. Upon negative loading, it was −16.28 mm with a corresponding maximum load of −144.03 kN following a slow decrease of the load. The specimen yielded a load that was approximately 23% greater than that of specimen P3 and approximately 13% greater than that of specimen P1. Based on these findings, it was determined that these specimen P2 loads were greater than those of their counterparts due to the contribution of the vertical reinforcements of the connections.
For specimen P3, shown in Figure 6c, the displacement was 12.12 mm upon positive loading, which corresponds to a maximum load of 138.45 kN. Upon negative loading, the displacement was −11.90 mm, with a corresponding maximum load of −124.11 kN. The load decreased rapidly and then stabilized. The specimen yielded a 4-mm displacement sooner than specimen P1. In addition, the load was approximately 11% greater than that of specimen P1. Specimen P3 also exhibited pinching that was greater than that for the other two specimens. This outcome was attributed to the slippage of the bracket and to the inserted steel plate.
Figure 6d shows the envelope curves for all the specimens, which connect the maximum loads of each cycle based on the load–displacement relationship curve. As explained for the load–displacement relationship curves, specimen P2 experienced greater resistance than the other two specimens. Specimen P3 exhibited a slightly lower load value compared to P2. However, the variations of their displacements were similar up to 8 mm. After the maximum load, a rapid load reduction occurred due to the failure and fall-off of the non-shrinkage mortar. Specimen P1 yielded after a rapid load decrease and there was a 2 mm displacement due to cracking in the connection. However, thereafter, the connection showed a somewhat stable envelope response curve.
The ductility of a shear wall is strongly related to its shear behavior and connection system to avoid such a brittle failure [21]. Failure patterns for the specimens during loading that generally take the form of premature connection cracking, breakage of the grout, pull-out of the stud bolt, and breaks in the connection, respectively, are shown in Figure 7a–d.
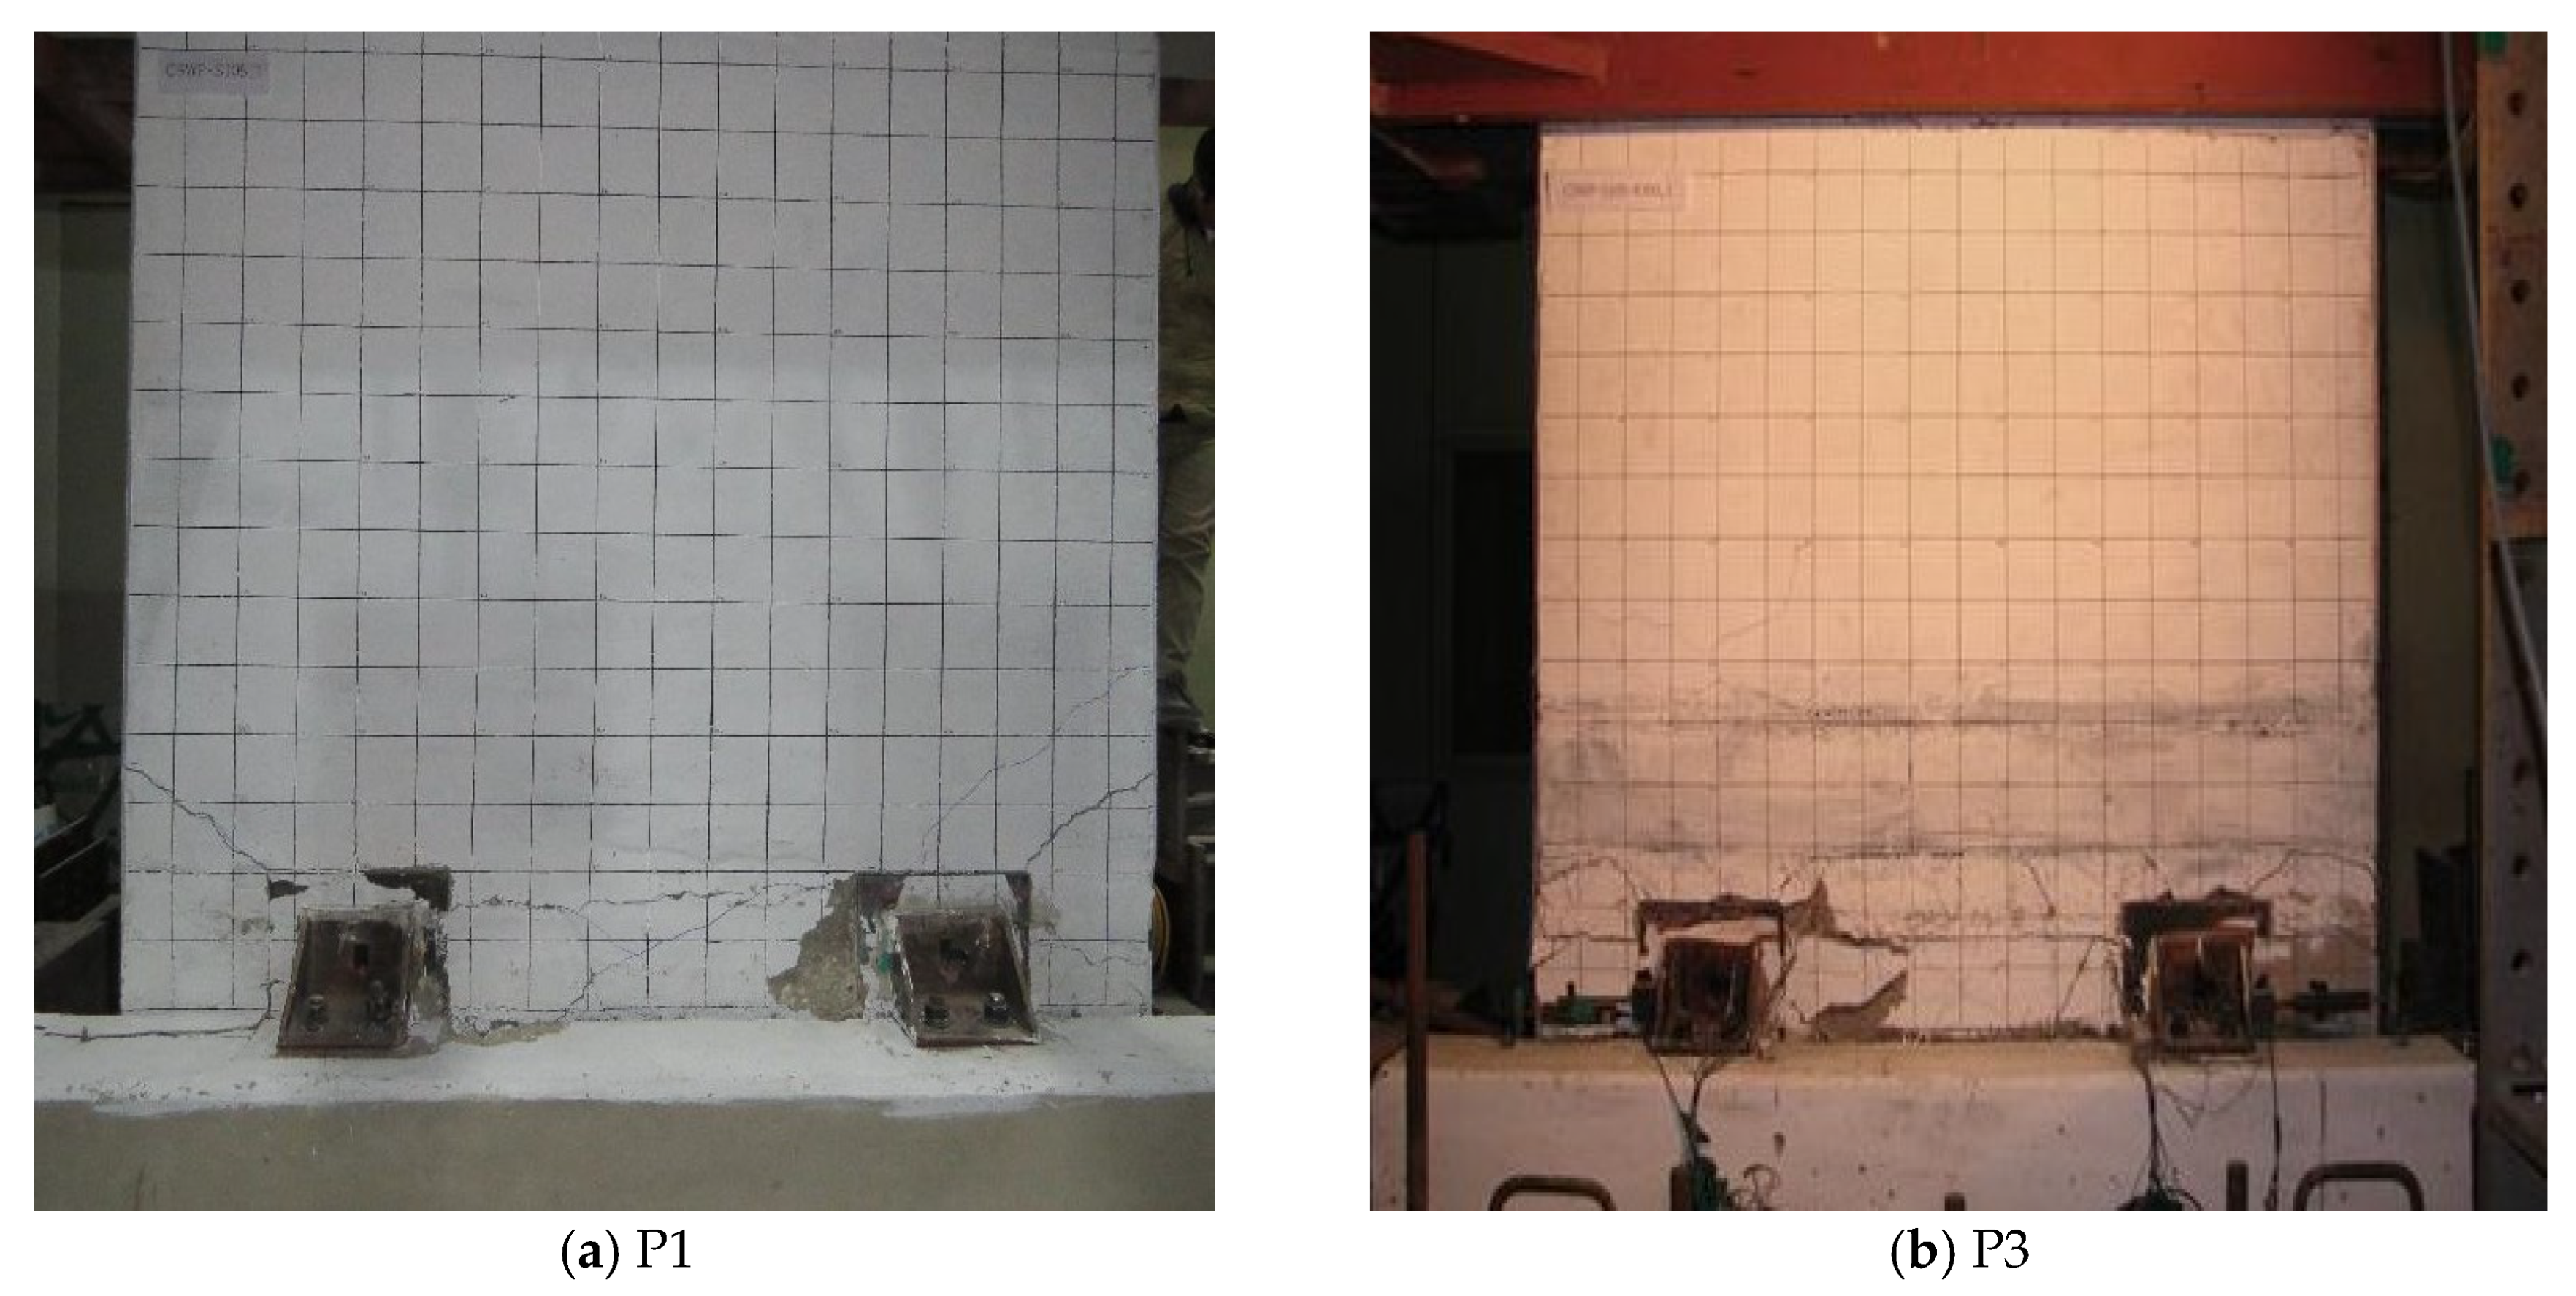
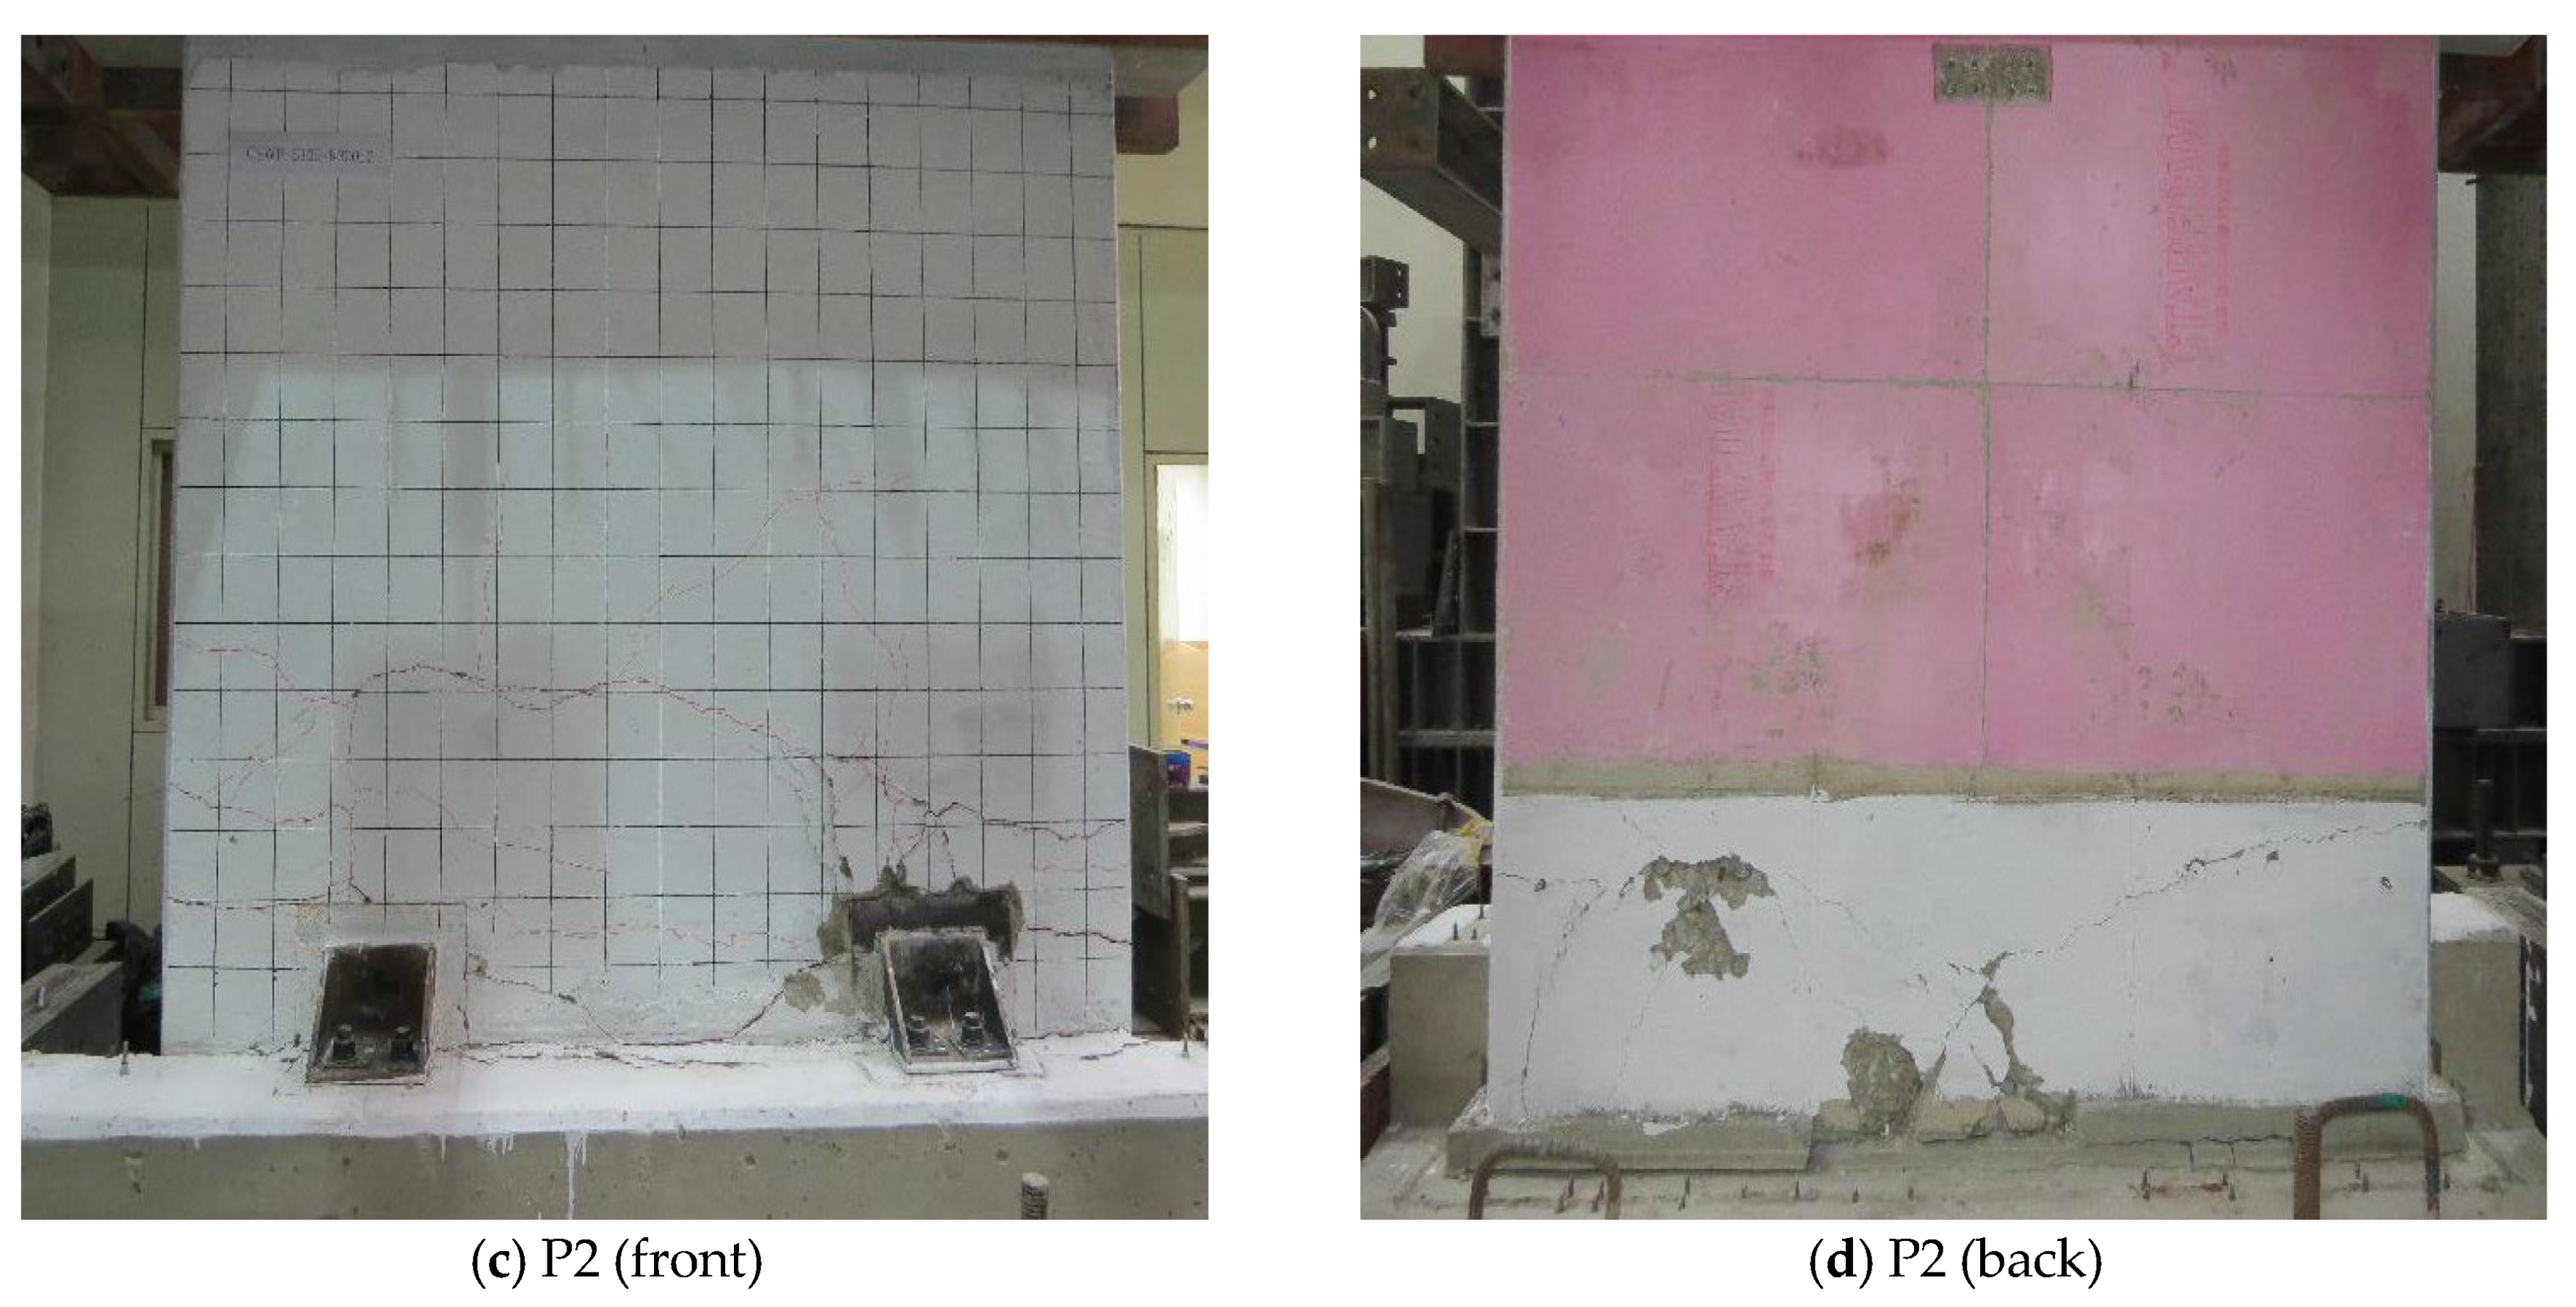
The cracks of specimen P1 without supplementary reinforcement, shown in Figure 8a, were localized around the embedded steel plate, whereas the cracks in specimen P3 were broadly distributed over the specimens until failure, as shown in Figure 8b. Figure 8c,d shows that cracking originated on the back of the concrete panel (P2) due to the panel being relatively thin.

3.2. Summary of Test Results

Table 2, Table 3 and Table 4 show the test results for each loading phase for each specimen, P1, P2, and P3, respectively, including failure and load–displacement curve information as well as the characteristics of the rigidity degradation and energy dissipation for each specimen. Energy dissipation was computed in terms of the cumulative amount of energy using the displacement of each specimen in each cycle. The energy dissipation capacity value can be used to assess the seismic performance of a structure. It represents the capability to dissipate or absorb energy until a member fails, and it is evaluated by the area that surrounds the load–displacement curve.

3.3. Normalized Peak-To-Peak Stiffness Curve

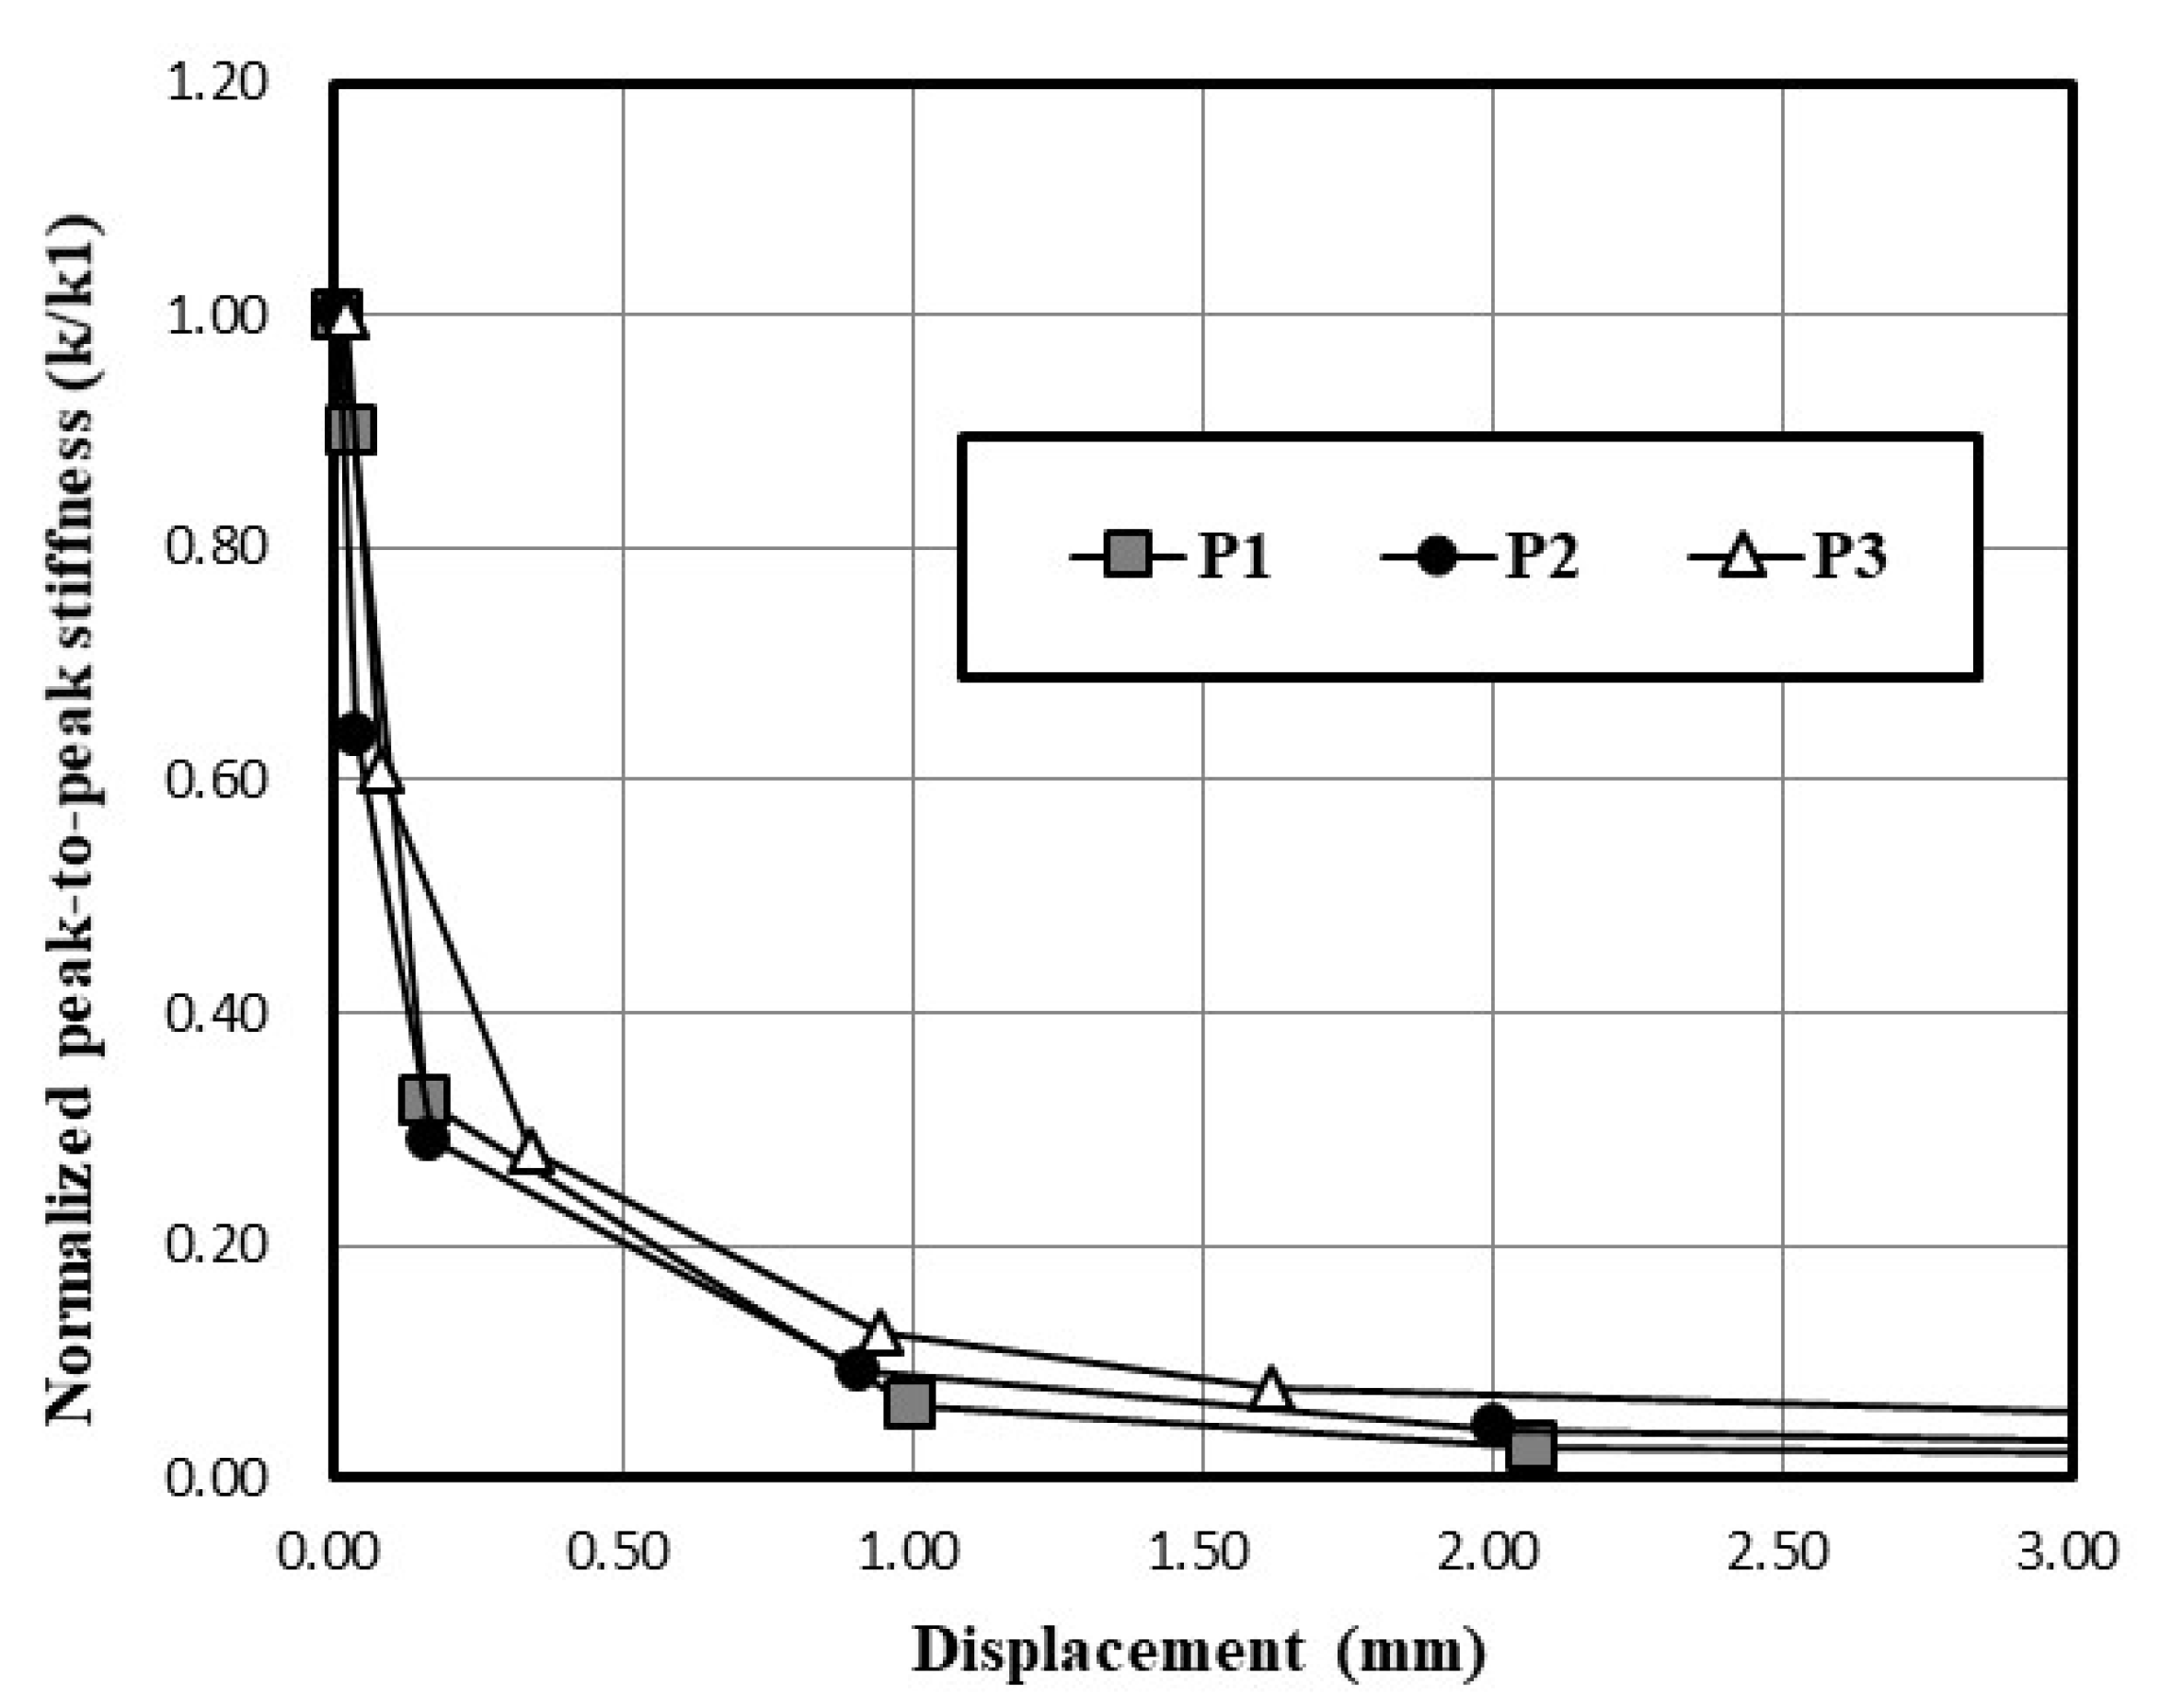
The stiffness value of each specimen was calculated by dividing the sum of the absolute values of the maximum loads (positive and negative loading separately) at each cycle by the value of the corresponding displacement, so that the degradation ratio of the stiffness value could be normalized by dividing the initial stiffness value by the overall stiffness value. Figure 9 shows that the initial stiffness values were calculated as 1161 kN/m, 1203 kN/mm, and 636.75 kN/mm for specimens P1, P2, and P3, respectively. Specimens P1 and P2 exhibited similar initial stiffness values; however, specimen P3 showed stiffness that was approximately 47% less than that of the other specimens. The low initial stiffness value for P3 is attributable to the slippage between the bracket and the inserted steel plate. The decrease in the initial stiffness value for all the specimens tends to indicate similar behavior. The degradation rate of the initial stiffness at a displacement of 1 mm follows in the order of P2, P3, and P1. The stiffness values slowly decreased after a displacement of 1 mm. Many cracks developed in the specimens after a displacement of around 2 mm.

3.4. Dissipation Energy Curve

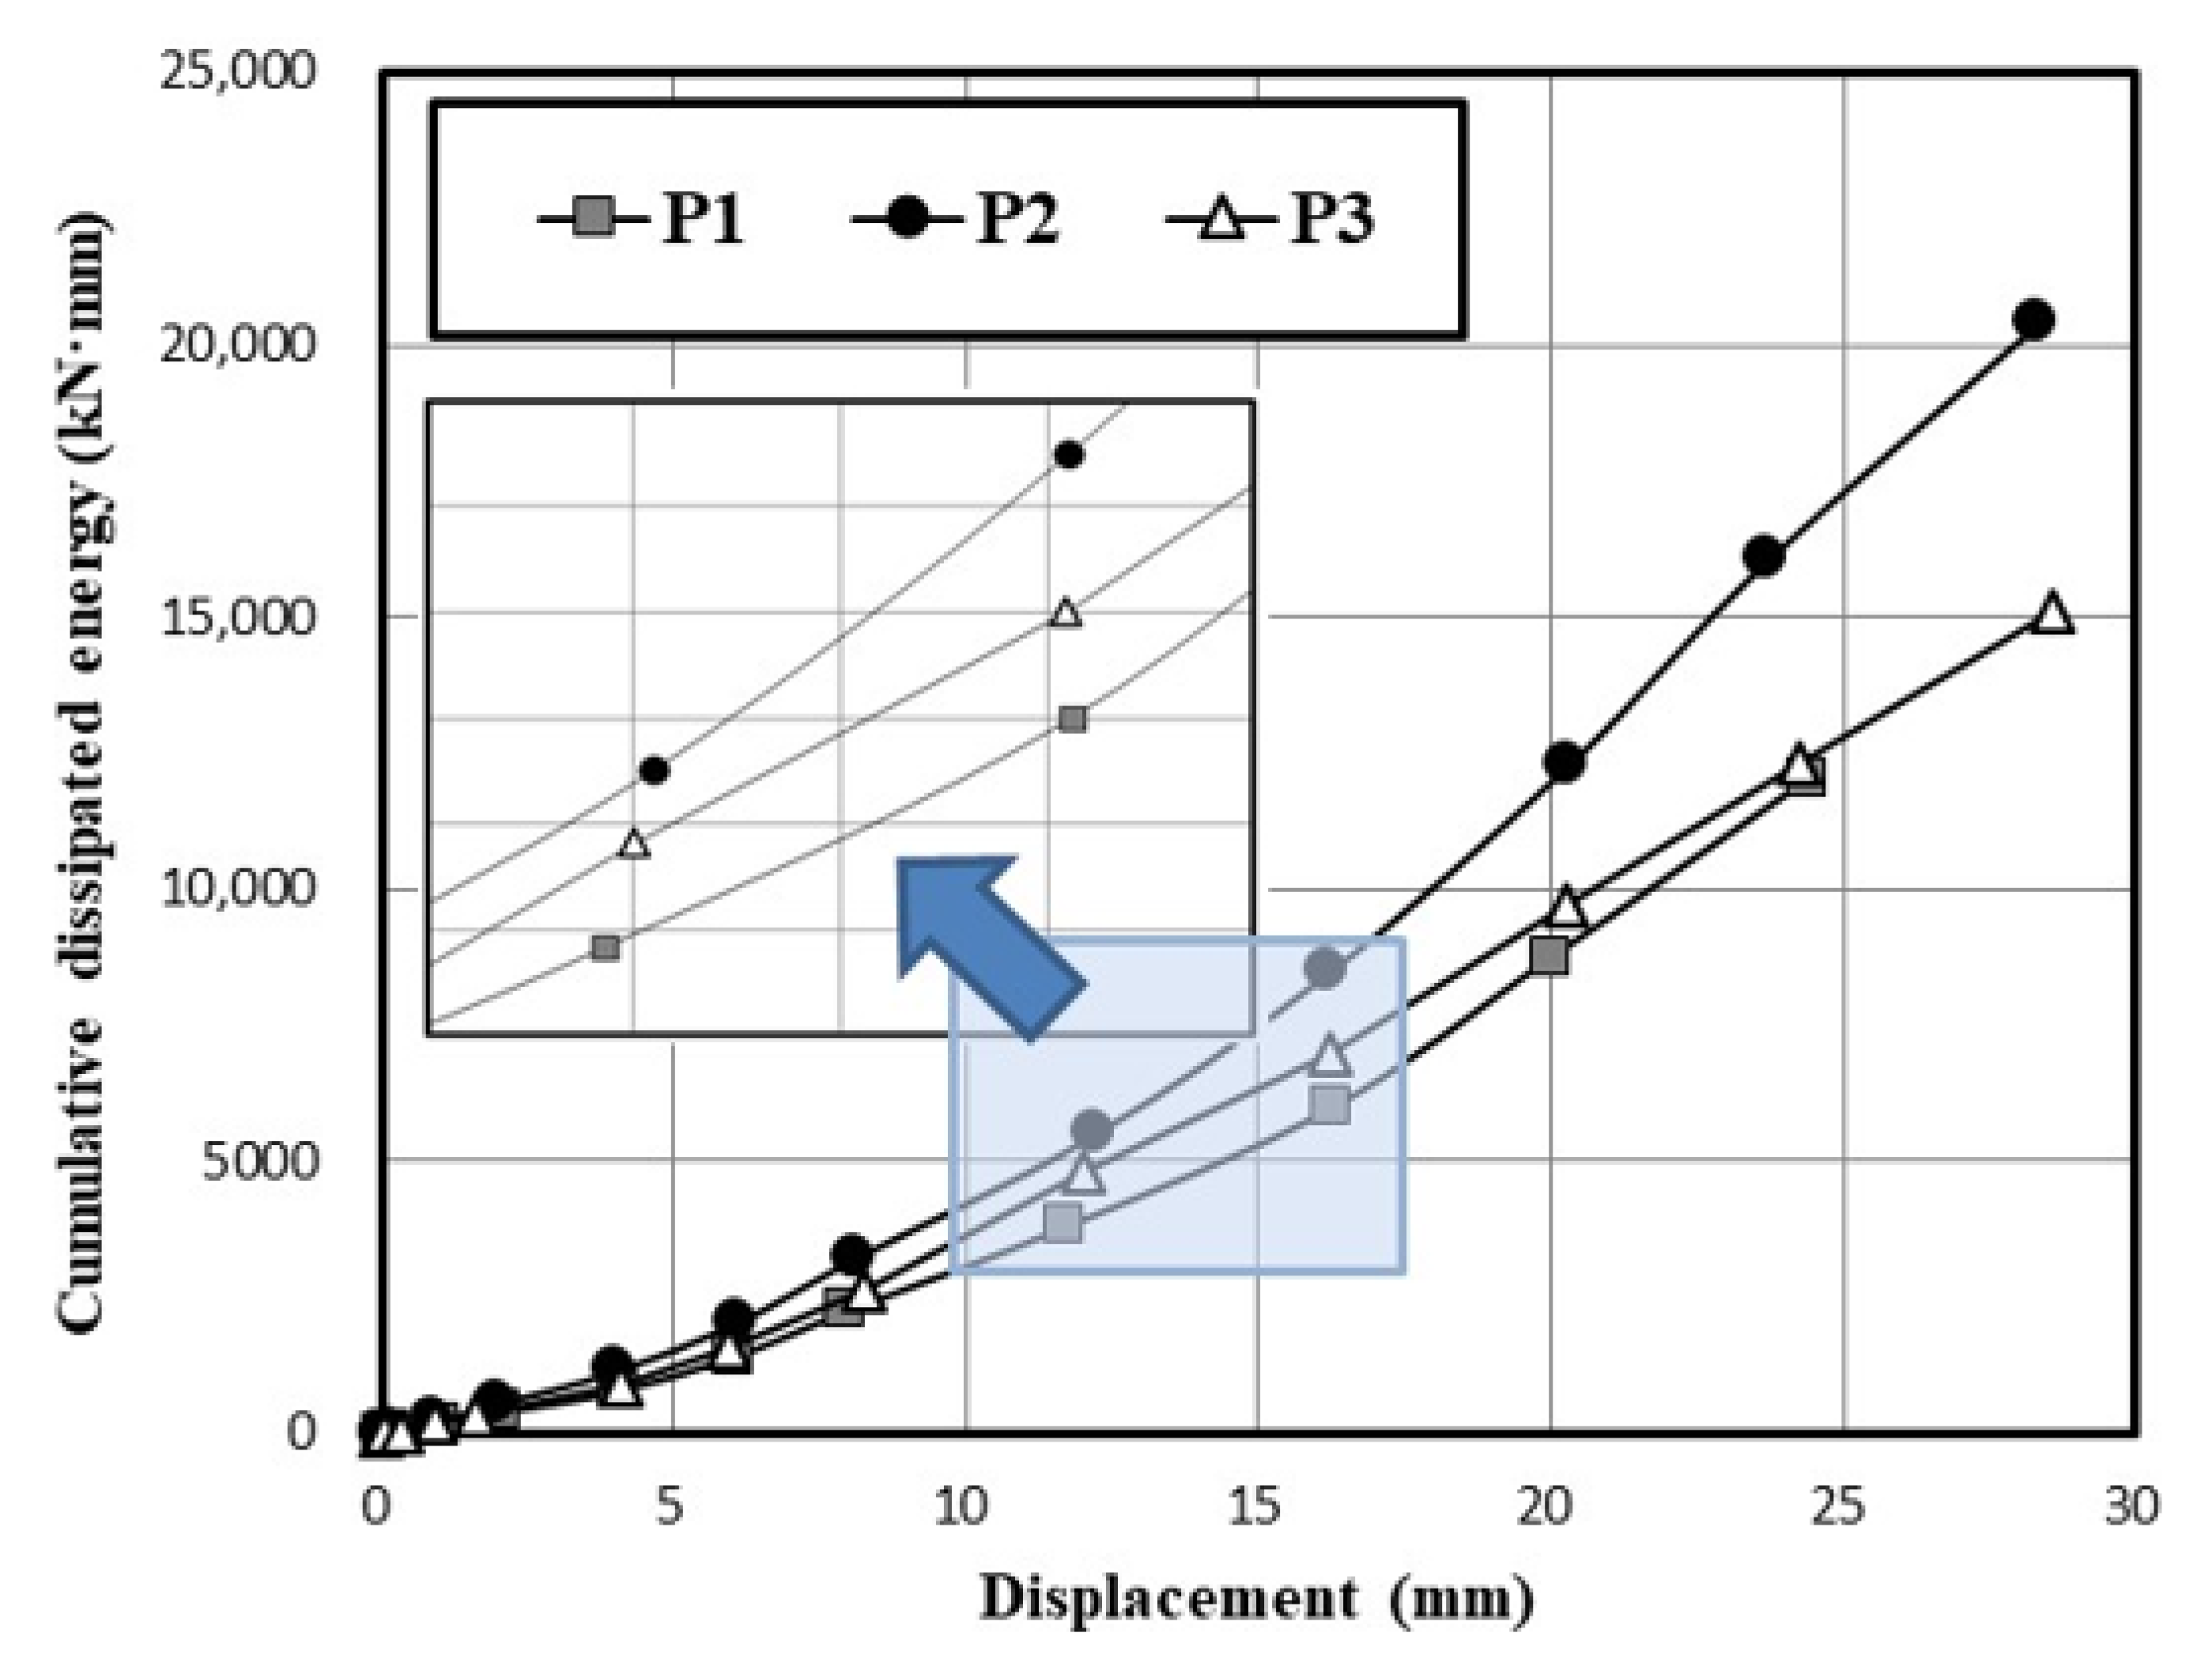
The accumulated amount of dissipated energy for the three specimens is shown in Figure 10. The energy dissipated rapidly after each specimen developed several cracks at the displacement of approximately 8 mm. Specimens P1 and P3 showed similar amounts of cumulative dissipated energy at a displacement of 24 mm, whereas P2 had about a 25% higher dissipated energy than the other specimens. In short, specimen P2 exhibited superior deformability and energy dissipation capacity compared with the other two specimens. This result for P2 was due to the supplementary reinforcement that allowed a high capacity for deformation and energy dissipation. However, the use of gauge steel plates in field construction may reduce the energy dissipation capacity due to bond slippage. These results confirm that a lower hef/d ratio (hef/d < 2.5) and/or supplementary reinforcement can lead to ductile behavior [8].

3.5. Comparison to Existing Code Equations

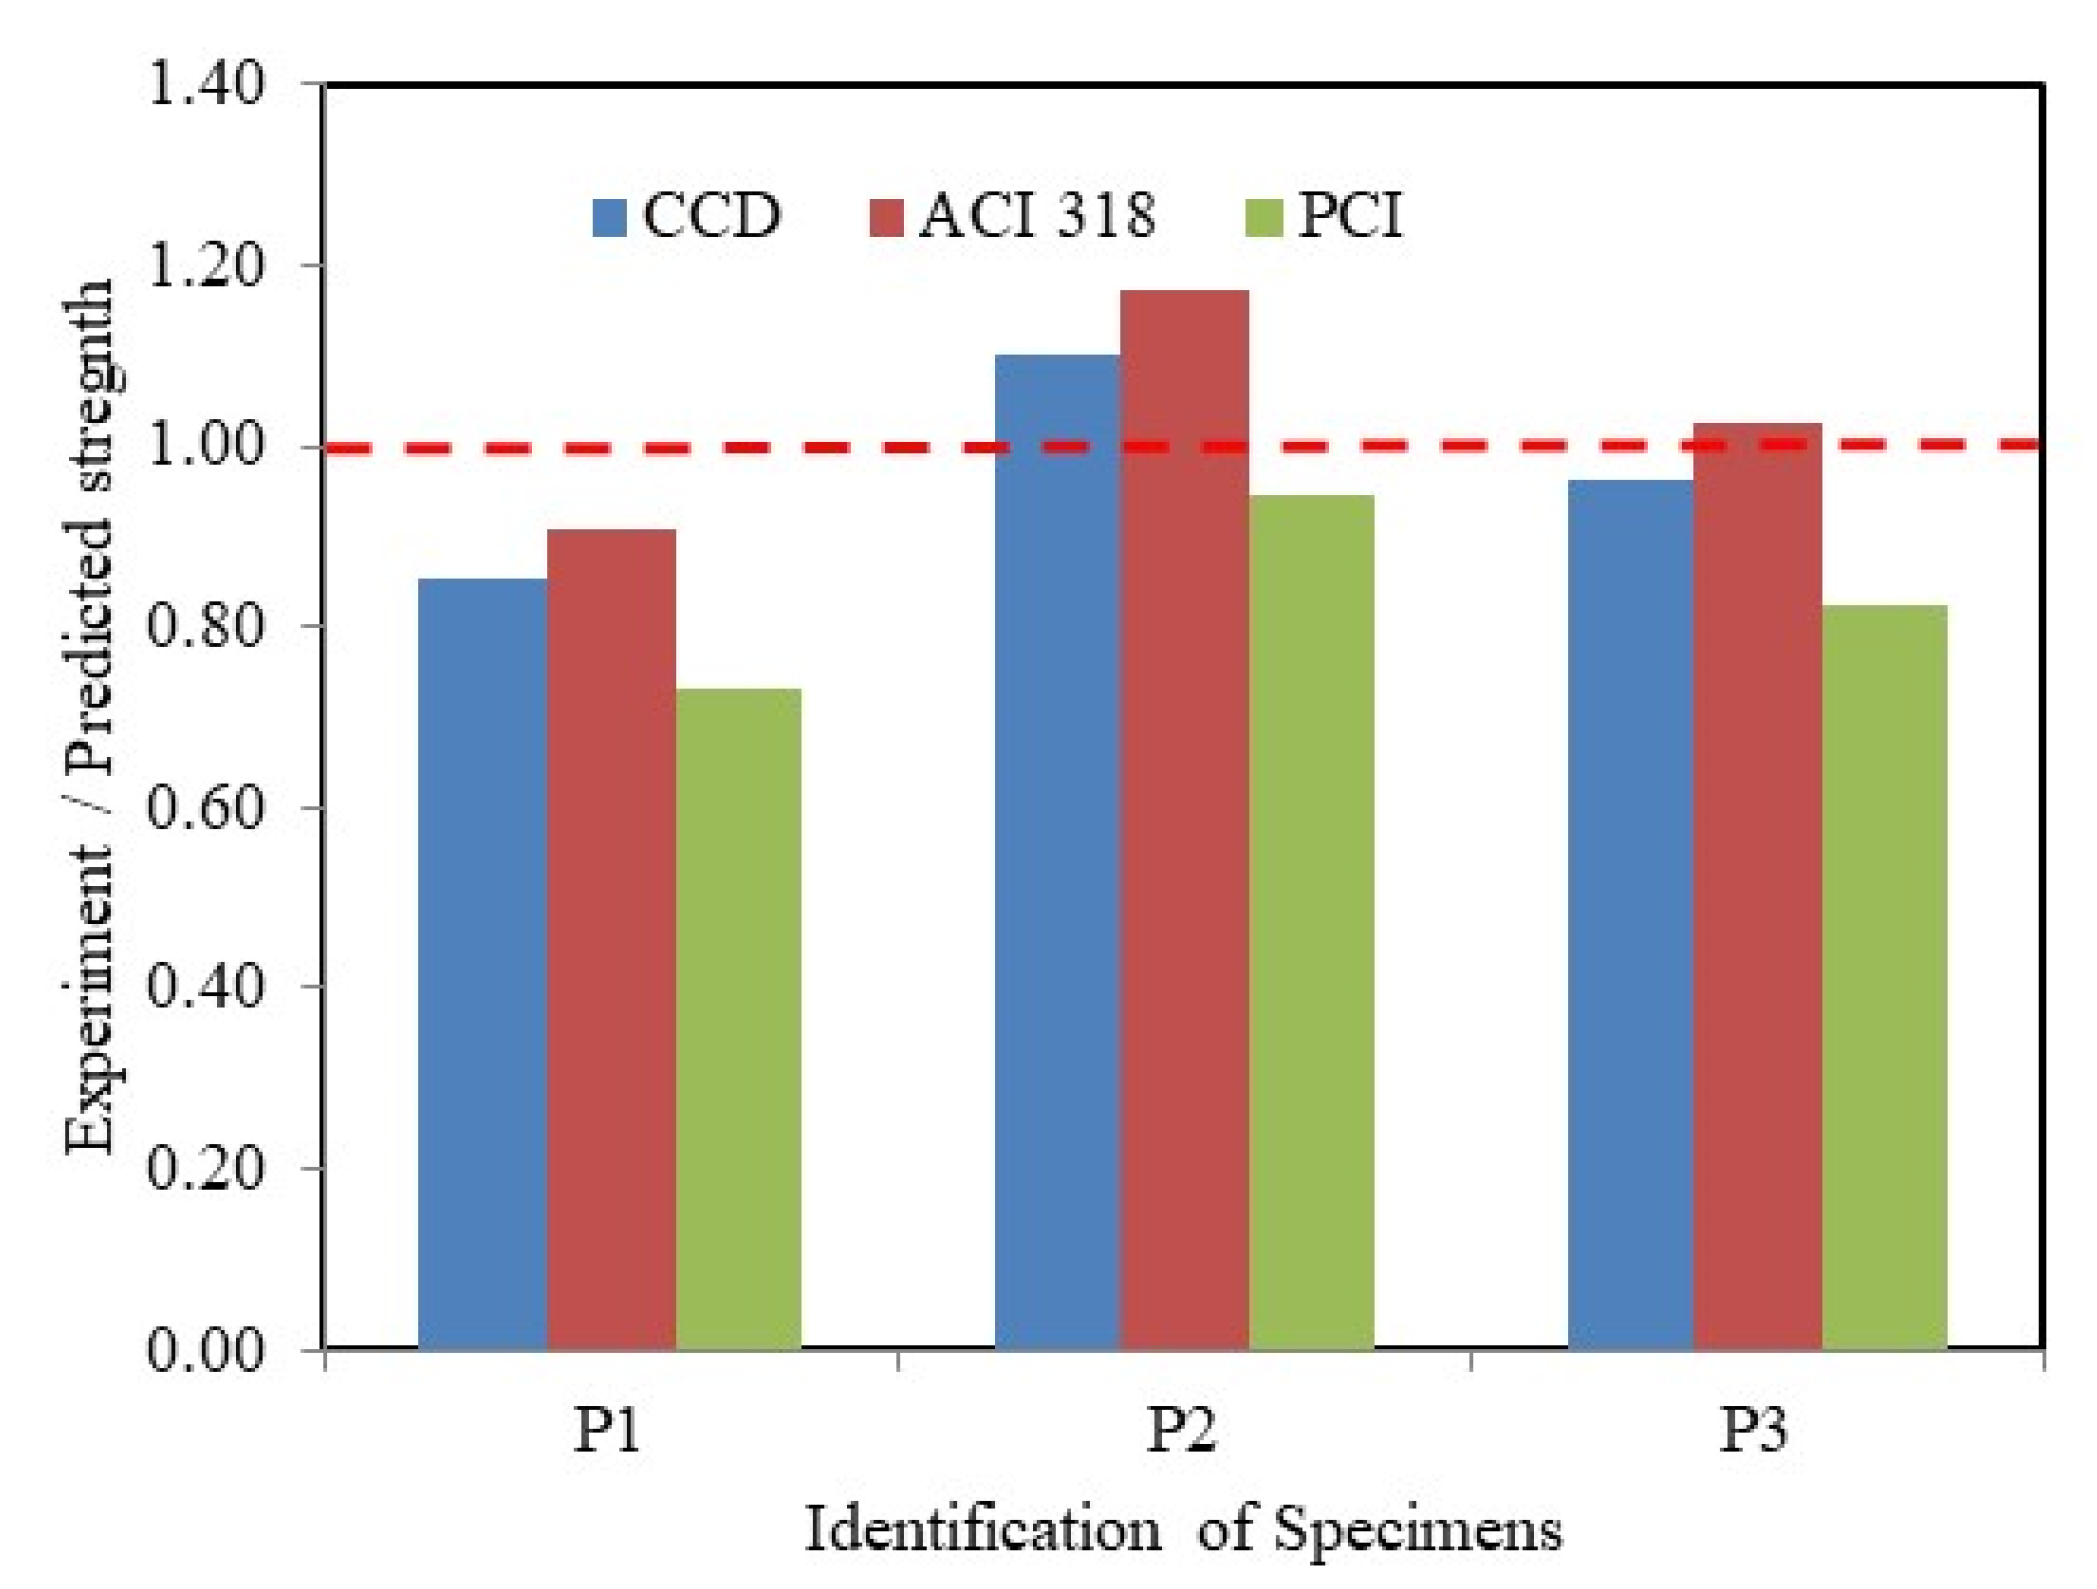
The test data were compared with the results predicted according to the existing code equations found in the literature, such as the concrete capacity design method [22], ACI 318-14 [23], and the PCI Handbook [18]. Figure 11 presents the comparative results confirming that the ACI 318-14 predictive equation for capacity is clearly conservative and underestimated true strength with low embedment depth-to-diameter ratios [24]. In contrast, the PCI-predicted results overestimated the strength compared to the measured results obtained in this study. In short, in this study, the PCI equation predicted the strength within a range of 0.73–0.95. Therefore, the current ACI 318-14 equation is feasible regardless of the supplementary reinforcement in the concrete wall panel.

4. Conclusions

This study investigated and reviewed connection systems between precast tilt-up concrete wall panels and their foundations to provide sufficient connection strength, ensuring that each connection has sufficient ductility, energy dissipation capacity, and stability to resist seismic loads in concrete precast wall panels.
Regarding the degradation of the initial stiffness value, all specimens presented similar behavior. The degradation of the initial stiffness value at a displacement of 1 mm followed the order of P2, P3, and P1. All specimens exhibited numerous cracks at a displacement of 2 mm. Thereafter, the reduction of the rate of stiffness slowly decreased.
The reason for these findings can be attributed to the low initial stiffness values that were due to the slippage of the bracket and gauge steel plate. At a displacement of 24 mm, specimens P1 and P2 presented similar amounts of cumulative dissipated energy. However, specimen P2 had approximately 25% higher cumulative dissipated energy than P1. Therefore, specimen P2 is considered to have excellent deformability and energy dissipation capacity, which are due to the contribution of longitudinal stiffening reinforcement without any slippage of the bond. In short, the supplementary reinforcement of thin precast concrete wall panels can provide (i) the required strength based on current code equations, (ii) sufficient ductility, and (iii) the energy dissipation capacity to resist cyclic loading.

Author Contributions

Conceptualization, H.-D.Y.; formal analysis, H.-D.Y., H.-R.K. and W.-C.C.; writing-original draft preparation, H.-R.K.; validation, H.-R.K. and W.-C.C.; writing-review and editing, W.-C.C.; project administration and supervision, H.-D.Y. All authors have read and agreed to the published version of the manuscript.

Funding

This research received no external funding.

Conflicts of Interest

The authors declare no conflict of interest.

References

  1. Ujianto, M.; Ali, A.Z.M.; Solikin, M. Structural behavior of precast concrete wall panels due to dynamic load: A review. In Proceedings of the AIP Conference Proceedings, Bali, Indonesia, 25–28 August 2019; Volume 2114, p. 050013. [Google Scholar]
  2. Nurchasanah, Y.; Ujianto, M.; Gagah; Winoto, A.T. Diagonal reinforcement as strengthening to increase the stiffness and strength of concrete frame. Adv. Sci. Lett. 2018, 24, 9098–9103. [Google Scholar] [CrossRef] [Green Version]
  3. Tiong, P.L.Y.; Chiew, S.P.; Teow, B.H. Case study of load-bearing precast wall system subject to low seismic intensity by linear and nonlinear analyses. Case Stud. Struct. Eng. 2016, 6, 11–21. [Google Scholar] [CrossRef] [Green Version]
  4. Hamid, N.H.A.; Mohamad, N.M.; Hamid, Z.A.; Ghani, S.H.A. Seismic behavior of precast shear key wall under in-plane lateral cyclic loading. Malaysian Constr. Res. J. 2014, 15, 63–73. [Google Scholar]
  5. Crisafulli, F.J.; Restrepo, J.I.; Park, R. Seismic design of lightly reinforced precast concrete rectangular wall panels. PCI J. 2002, 47, 104–121. [Google Scholar] [CrossRef]
  6. Labib, M.; Sheu, W.; Ayoub, A.; Mo, Y.L. Embedded steel plate supports in concrete tilt-up precast walls. Mag. Concr. Res. 2014, 66, 627–642. [Google Scholar] [CrossRef]
  7. Fleischman, R.; Naito, C.J.; Restrepo, J.I. Seismic design methodology for precast concrete diaphrams part 1: Design framework. PCI J. 2005, 50, 68–83. [Google Scholar] [CrossRef]
  8. Precast/Prestressed Concrete Institute (PCI). PCI Design Handbook for Precast and Prestressed Concrete, 8th ed.; PCI: Chicago, IL, USA, 2017. [Google Scholar]
  9. Zhi, Q.; Xiong, X.; Yang, W.; Liu, S.; Xiong, J. Experimental study on the shear behavior of precast wall concrete joints with/without dowel reinforcement. Materials 2020, 13, 1726. [Google Scholar] [CrossRef] [PubMed] [Green Version]
  10. Zhou, X.; Mickleborough, N.; Li, Z. Shear strength of joints in precast concrete segmental bridges. ACI Struct. J. 2005, 102, 901–903. [Google Scholar]
  11. Koliou, M.; Masoomi, H.; Van De Lindt, J.W. Performance assessment of tilt-up big-box buildings subjected to extreme hazards: Tornadoes and earthquakes. J. Perform. Constr. Facil. 2017, 31, 04017060. [Google Scholar] [CrossRef]
  12. Sritharan, S.; Aleti, S.; Thomas, D.J. Seismic Analysis and Design of Precast Concrete Jointed Wall Systems; ISU-ERI-Ames Report No. ERI-07404; Iowa State University: Ames, IA, USA, 2007; p. 10. Available online: http://lib.dr.iastate.edu/ccee_reports/10?utm_source=lib.dr.iastate.edu%2Fccee_reports%2F10&utm_medium=PDF&utm_campaign=PDFCoverPages (accessed on 24 September 2020).
  13. Devine, F.; Olund, O.; Elwood, K.; Adebar, P. Seismic performance of concrete tilt-up buildings: Current wall-to-slab connections. In Proceedings of the 14th World Concrete on Earthquake Engineering, Beijing, China, 12–17 October 2008. [Google Scholar]
  14. Kim, H.R. Seismic Performance of Embedded Steel Plate Connections in Tilt-Up Concrete Precast Wall. Master’s Thesis, Chungnam National University, Daejeon, Korea, 2014. [Google Scholar]
  15. Ebead, U.; Marzouk, H. Strengthening of two way slabs using steel plates. ACI Struct. J. 2002, 99, 23–31. [Google Scholar]
  16. Anderson, N.S.; Meinheit, D.F. Design criteria for headed stud groups in shear: Part 1—Steel capacity and back edge effects. PCI J. 2000, 45, 46–75. [Google Scholar] [CrossRef]
  17. Anderson, N.S.; Meinheit, D.F. A review of headed-stud design criteria in the sixth edition of the PCI design handbook. PCI J. 2007, 52, 82–100. [Google Scholar] [CrossRef] [Green Version]
  18. Precast/Prestressed Concrete Institute (PCI). PCI Design Handbook for Precast and Prestressed Concrete, 6th ed.; PCI: Chicago, IL, USA, 2004. [Google Scholar]
  19. Choi, W.; Jang, S.-J.; Kim, S.-H.; Yun, H.-D. Shear performance of embedded anchor plates in reinforced concrete tilt-up panels under monotonic and cyclic loadings. Arch. Civ. Mech. Eng. 2018, 18, 430–441. [Google Scholar] [CrossRef]
  20. Saloniklos, T.N. Analytical prediction of the inelastic response of RC walls with low aspect ratio. J. Struct. Eng. 2007, 133, 844–854. [Google Scholar] [CrossRef]
  21. Xiong, C.; Chu, M.; Liu, J.; Sun, Z. Shear behavior of precast concrete wall structure based on two-way hollow-core precast panels. Eng. Struct. 2018, 176, 74–89. [Google Scholar] [CrossRef]
  22. American Concrete Institute (ACI). ACI 349.2R-07 Guide to the Concrete Capacity Design (CCD) Method-Embedment Design Examples (Reapproved 2014); ACI: Farmington Hills, MI, USA, 2014. [Google Scholar]
  23. American Concrete Institute (ACI). ACI 318-14: Building Code Requirements for Structural Concrete and Commentary (ACI 318-14); ACI: Farmington Hills, MI, USA, 2014. [Google Scholar]
  24. Jebara, K.; Ožbolt, J.; Hofmann, J. Pryout failure of single headed stud anchor: 3D numerical FE analysis. Mater. Struct. 2016, 49, 4551–4563. [Google Scholar] [CrossRef]
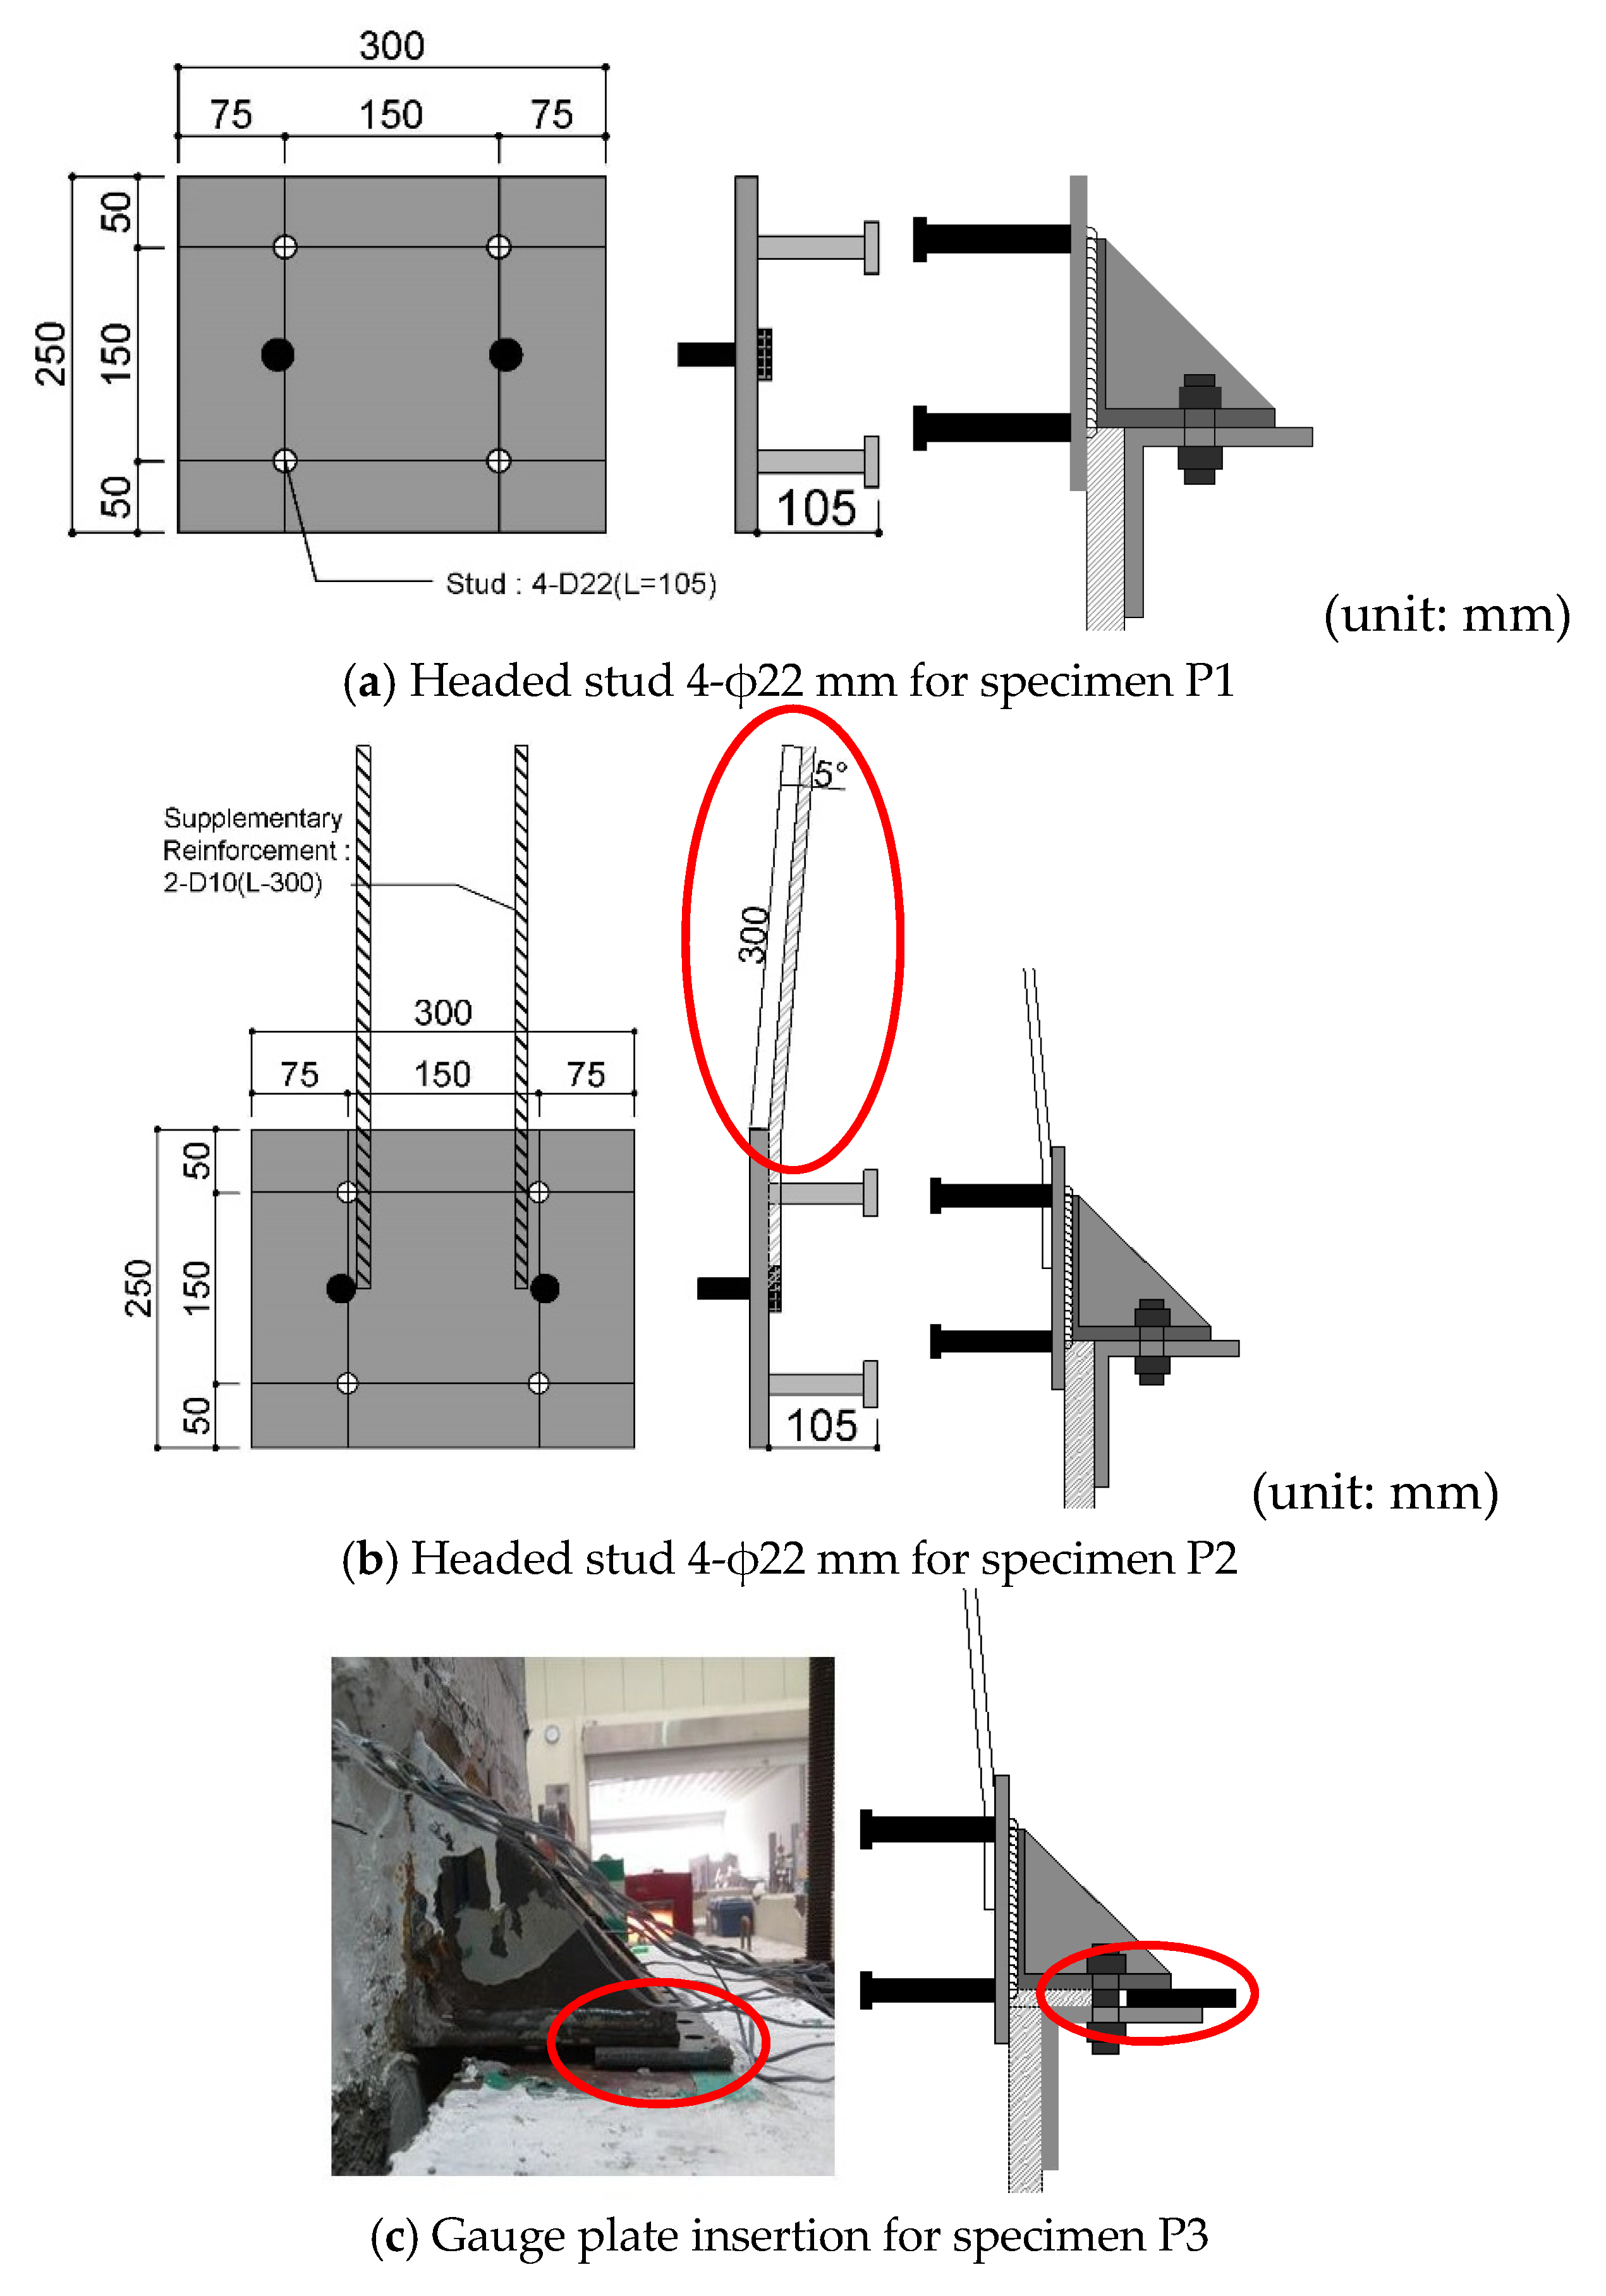
Figure 1. Embedded steel plate details.
Sustainability 12 07907 g001
Figure 2. Specimen fabrication procedures.
Sustainability 12 07907 g002
Figure 3. Reinforcement details for the specimens.
Sustainability 12 07907 g003
Figure 4. Schematics showing the test method adopted for specimen testing.
Sustainability 12 07907 g004
Figure 5. Load history for the quasi-static reversed cyclic load test for the wall panel.
Sustainability 12 07907 g005
Figure 6. Cyclic load–displacement curves and envelope curves.
Sustainability 12 07907 g006aSustainability 12 07907 g006b
Figure 7. Failure patterns for the specimens.
Sustainability 12 07907 g007
Figure 8. Final crack distributions of the specimens.
Sustainability 12 07907 g008aSustainability 12 07907 g008b
Figure 9. Normalized peak-to-peak stiffness curves.
Sustainability 12 07907 g009
Figure 10. Cumulative dissipated energy of the specimens.
Sustainability 12 07907 g010
Figure 11. Comparison results of measured strength and predicted strength.
Sustainability 12 07907 g011
Table 1. Identification of specimens and embedded steel plate details.
SpecimenEmbedded Depth of Stud (mm)Thickness of Embedded Steel Plate (mm)Embedment Depth-to-Diameter Ratio (h/d)Supplementary Rebar (mm)Stud Type
P1105204.77NoneHeaded stud
4-Φ22
P2105204.772-D10(V), L = 300Headed stud
4-Φ22 + 2 − D10(V)
P3105204.772-D10(V), L = 300Headed stud
4-Φ22 + 2 − D10(V)
Table 2. Test results for specimen P1.
SpecimenCycleLoad DirectionP (kN)δ (mm)Δ (%)Peak-to-Peak StiffnessDissipation Energy (kN·mm)
k (kN/mm)k/k1EiEt
P11+11.8200.0001161.501.0000.070.07
−11.41−0.02−0.001
2+30.670.040.0031045.500.9004.324.38
−32.06−0.02−0.001
3+60.050.180.012376.160.32435.0239.40
−60.32−0.14−0.009
4+76.401.020.06771.580.062176.95216.35
−66.75−0.98−0.064
5+68.392.060.13532.600.028206.34422.70
−66.57−2.08−0.136
6+86.704.10.26820.270.017369.4819.10
−78.29−4.04−0.264
7+99.766.060.39615.570.013616.891435.99
−88.05−6.00−0.392
8+105.167.900.51612.580.011832.442268.43
−94.58−7.98−0.522
9+117.6711.720.7669.620.0081561.453829.88
−107.61−11.70−0.765
10+122.7316.161.0567.140.0062174.436004.31
−109.23−16.32−1.067
11+119.5220.041.3105.670.0052748.108752.40
−106.89−19.90−1.301
12+95.3524.581.6074.050.0033270.0912,022.49
−102.11−24.14−1.578
Table 3. Test results for specimen P2.
SpecimenCycleLoad DirectionP (kN)δ (mm)Δ (%)Peak-to-Peak StiffnessDissipation Energy (kN·mm)
k (kN/mm)k/k1EiEt
P21+11.360.020.0011203.001.0000.070.07
−12.7000.000
2+32.210.020.001767.630.6383.193.26
−29.1−0.06−0.004
3+61.790.10.007349.470.29031.1534.41
−57.03−0.24−0.016
4+102.450.980.064110.180.092209.36243.76
−98.08−0.84−0.055
5+109.7620.13150.760.042332.05575.82
−94.31−2.02−0.132
6+119.074.040.26427.750.023589.011164.82
−102.35−3.94−0.258
7+126.666.080.39719.830.016878.392043.21
−113.73−6.04−0.395
8+134.368.080.52815.790.0131188.33231.51
−121.12−8.1−0.529
9+153.8412.220.79911.960.0102276.845508.35
−137.76−12.16−0.795
10+158.7916.121.0549.350.0082980.918489.25
−144.03−16.28−1.064
11+153.0520.001.3076.950.0063779.4012,268.65
−128.88−20.54−1.342
12+139.5423.541.5395.560.0053779.816,048.40
−123.73−23.84−1.558
13+133.3528.321.8514.350.0044340.4320,388.83
−113.11−28.32−1.851
Table 4. Test results for specimen P3.
SpecimenCycleLoad DirectionP (kN)δ (mm)Δ (%)Peak-to-Peak StiffnessDissipation Energy (kN·mm)
k (kN/mm)k/k1EiEt
P31+12.460.020.001636.751.0000.070.07
−13.01−0.02−0.001
2+31.190.10.007388.630.6106.927.00
−30.990.060.004
3+59.970.40.026178.630.28149.3656.35
−61.50−0.28−0.018
4+69.001.040.06880.260.126137.00193.33
−81.88−0.84−0.055
5+80.391.580.10349.940.078179.40372.74
−81.41−1.66−0.108
6+107.914.180.27325.840.041520.06892.80
−102.433.960.259
7+118.725.90.38619.400.030707.291600.01
−111.69−5.98−0.391
8+133.008.30.54215.410.0241041.912642.00
−121.52−8.22−0.537
9+138.4212.120.79210.930.0172174.874816.87
−124.11−11.9−0.778
10+121.6616.261.0637.120.0112179.746996.60
−108.73−16.12−1.054
11+119.1819.881.2995.530.0092717.789714.38
−104.81−20.62−1.348
12+107.0424.021.5704.270.0072607.7312,322.11
−99.89−24.46−1.599
13+111.5228.961.8933.790.0062753.2615,075.37
−105.28−28.18−1.842