Article

Responses of Anammox Granular Sludge to Long-Term Rare Earth Element Feeding: Lanthanum as a Case

1
School of Resource, Environmental and Chemical Engineering, Nanchang University, Nanchang 330031, China
2
Key Laboratory of Poyang Lake Environment and Resource Utilization, Ministry of Education, School of Resources Environmental & Chemical Engineering, Nanchang University, Nanchang 330031, China
*
Author to whom correspondence should be addressed.
Sustainability 2020, 12(19), 7887; https://doi.org/10.3390/su12197887
Submission received: 23 August 2020 / Revised: 18 September 2020 / Accepted: 21 September 2020 / Published: 24 September 2020
(This article belongs to the Section Hazards and Sustainability)

Abstract

:
A tremendous input of ammonium and rare earth elements (REEs) has entered the surroundings on account of the discharge and leak of leaching agents during rare earth in-suit leaching mining, which has threatened various organisms. Anammox has the potential to release nitrogen contamination, but the potential impacts of REEs on anammox bacteria remain unclear. In this study, La (III) was chosen as a case to explore the long-term impacts on anammox granular sludge. The 5 mg L−1 La (III) which was examined hardly affected the anammox granulates because of the defense of extracellular polymeric substances. The high La concentrations (10–50 mg L−1) caused intercellular accumulation and the significant inhibition of nitrogen removal performance and dehydrogenase activity, especially a decrease in the relative abundance of Ca. Kuenenia. Moreover, it also induced patently oxidative damage and affected cell membrane integrity. Notably, extracellular polymeric substances have a limited defense capability; neither La3+ nor Ca2+/Mg2+ efflux-related genes aggravated the intracellular accumulation of La.

1. Introduction

Ion-adsorption rare earth deposits, as a primary type of rare earth elements (REEs, see Nomenclatures) reserves, can be readily exchanged by ammonium via an in-situ leaching process [1]. The use of a large amount of ammonium-containing eluent led to excessive ammonium (NH4+), nitrite (NO2), and nitrate (NO3) released to the watershed nearby [2]. Several cases of aqueous ammonium exceeding 150 mg L−1 and nitrate of 90–468 mg L−1 were documented in neighboring areas to REEs mines practiced with in situ leaching [3,4]. The Chinese National Standard for Groundwater Quality (III grade) for NH4+ and NO3 limits by comparison are only 0.50 and 20.00 mg L−1, respectively [5]. The enrichment of NH4+ and NO3 poses a remarkable threat to the integrity of surrounding ecosystems and the safety of water resources [6]. Therefore, it is urgent to alleviate the water nitrogen pollution faced by rare earth mining areas.
The conventional nitrification-denitrification process (CNDP) was previously used to remove NH4+ (NO2 and NO3) in rare earth mining areas [7,8]. Nevertheless, as the treated water is often depleted in dissolved oxygen and organic carbon, the successful operation of CNDP necessitates intensive aeration and the supplement of extra organic carbon. Anaerobic ammonium oxidation (ANAMMOX) is an alternative biological nitrogen removal technology [9], in which ammonium reacts with nitrite or nitrate to form nitrogen gas under anaerobic conditions [10]. By virtue of chemoautotrophic anammox bacteria, the ANAMMOX process does not require organic carbon addition and yields less sludge than CNDP [11]. These features make ANAMMOX a candidate for nitrogen pollution control in rare earth mining areas than CNDP, as it has lower organic carbon and energy consumption.
However, concerns still exist when the application of ANAMMOX in rare earth mining areas is considered as to whether the activity of these microbial consortia would be sensitive to coexistent contaminants, such as REEs. “REEs are not rare.” In fact, the REEs have become the dominant metallic pollutant in the waters in proximity to many REEs mining areas [6]. Reportedly, the contents of REEs in streams close to REEs mines were even above 20 mg L−1 due to a poor recovery rate of REEs from leachate [2,12]. At such high concentrations, REEs could affect the growth, transformation, and gene expression of many types of microorganisms [13,14]. For instance, the growth of T. atroviride and T. harzianum were significantly inhibited after exposure to an REEs mixture (containing lanthanum, cerium, praseodymium, neodymium, and gadolinium) with total concentrations from 1 to 10 mM [15]. With regard to E. coli, its transformation efficiency to absorb external DNA diminished remarkably upon the addition of a similar range of lanthanum levels (0.5–30 mg L−1) [16]. Additionally, the expression of genes annotated to metabolite-biosynthetic functions in Streptomyces coelicolor was activated at 200 μM of scandium or 1900 μM of lanthanum [17]. In contrast to fungi and E. coli, the toxicity of REEs to anammox bacteria has not yet received enough attention, although obtaining comprehensive knowledge in this area is indispensable for improving the performance of ANAMMOX in the treatment of rare-earth-mining-impacted waters.
Since the majority of REEs have chemical properties comparable to those of lanthanum (La) due to their similar electronic configurations [18], La was selected herein as a representative REE to study the long-run impacts of REEs on the anammox bacteria. We studied the nitrogen removal efficiency (NRE), La distribution, and microbial community dynamics to explore the potential effects of La on anammox bacteria. We further inspected the roles of extracellular polymeric substance (EPS) and enzymatic activities’ response to the perturbation of La. More specifically, we predicted the functional pathways of La inhibition within anammox bacteria through 16S rRNA sequencing, aiming to explain the cytotoxic mechanism at multiple metabolic levels. This mechanism would guide the mitigation of the risk of REEs to anammox bacteria as well as facilitate the process operations of ANAMMOX.

2. Materials and Methods

2.1. Reactor Setup and Operation

We harvested the anammox seeding sludge from a sequencing batch reactor (SBR), whose scale is like a laboratory and full of synthetic wastewater comprising substrates, minerals and trace elements. The operating history of the parent reactor has exceeded one year at a steady nitrogen removal rate of about 5.04 kgN·m−3·d−1 with the specific anammox activity (SAA) of 649.0 ± 56.65 mg total nitrogen (TN) g−1 VSS d−1. The applied anammox granules were those that cannot pass through 10-mesh sieves (diameter > 2.00 mm) when the EPS content was 287.9 ± 14.3 mg g−1 VSS.
The glass bottles (working and total volume, 1000 and 1200 mL, respectively) comprising seeding sludge and inorganic synthetic media (presented in Table S1 in the Supplementary Materials) with La (III) added in need were flushed with 95% argon and 5% carbon dioxide, enclosed with a silica gel stopper and a PP cap, and put in an incubator shaker at 160 rpm, 35 ± 0.5 °C, under dark conditions. The original MLVSS content within the bottles was set as 2000 mg L−1. We allowed the biomass settling once per 24 h (for 0.5 h). The glass bottle was subsequently opened, and the peristaltic pump was used to pump out the supernatant to prevent inhibitory compound accumulation and make the settled biomass remain inside of the bottles. Later, we used a new nutritive mineral medium to refill the bottles, which were then sealed and flushed with 95% argon and 5% carbon dioxide. The exchanged liquid volume in the process of replacing the mineral medium was approximately 80%, which is higher than those commonly regarded in anammox SBRs [11,19].
Based on the fact that the REE content in the stream water nearby mineral areas was close to 20 mg L−1 [6], and considering that the REE environmental release might intensify due to the potential centralized massive production, the potential impacts of higher concentrations (50 mg L−1) were also explored in this study. Thus 0, 5, 10, 20 and 50 mg L−1 La (III) were set to study the effects on anammox sludge. Lanthanum chloride (LaCl3·6H2O, 99.99% metals basis, Macklin, China) stock solution (10,000 mg L−1 La (III)) was adopted to supply La ions in the media at 5 mg L−1 concentration during S1 (16th–30th day) and subsequently rise to 10 mg L−1 in S2 (31st–45th day), 20 mg L−1 in S3 (46th–60th day) and 50 mg L−1 in S4 (61st–75th day).
Besides this, batch exposure experiments were conducted (Text S1 in the Supplementary Materials).

2.2. EPS Extraction and Characterization

The extraction process of EPS was described in Zhang et al. [20]. The extracted EPS was used to quantitatively analyze the content of protein (PN) according to the Bradford method, with bovine serum albumin being the standard protein. Polysaccharide (PS) concentration was also detected through the phenol-sulfate method and glucose was employed as a standard. The fluorescence spectrophotometer, purchased from Cary Eclipse, Australia, was utilized to determine the three-dimensional excitation–emission matrix (3D-EEM) fluorescence spectra of the extracted EPS. To distinguish the actual fluorescence spectra from the 3D-EEM fluorescence spectra, the DOM Fluor toolbox (www.models.life.ku.dk) and MATLAB R2017b software were utilized. Then, the EPS extractions were subjected to lyophilization and freeze dried into a powder at −40 °C for 48 h by a vacuum freeze-dryer (YB-FD-1, SHYB, China). Subsequently, a Nicolet 5700 FTIR spectrometer (Thermo Fisher Nicolet, USA) was used to obtain the freeze-dried EPS’s Fourier transform infrared (FTIR) spectra. We performed two-dimensional correlation spectroscopy (2D-COS) analyses to demonstrate EPS’s major functional groups with 2Dshige (version 1.3, http://sci-tech.ksc.kwansei.ac.jp/~ozaki/), as well as their interaction with La (III). The detailed parameters and procedures were performed as previously reported [21].

2.3. La Distribution

The dynamics of the La were also tracked (Figure 1). The liquid sample, withdrawn from the reactor, was collected before the everyday replacement of the medium and then filtrated through a 0.22-μm filter for the La concentration analysis, marked as the dispersed La in the outlet of wastewater. Finally, after being filtered with an intermediate speed quantitative filter paper, the sludge sample L4 was obtained, which was later rinsed using 0.8% saline for three times before the extraction of EPS. The La in the sludge was recognized as absorbed La, including La captured by EPS and intracellular accumulation. The anammox sludge after EPS extraction was also collected after three-fold washing with the 0.8% saline to determine the amount of La accumulated into cells as intracellular La. The difference between La in the sludge before and after the EPS extraction was considered as La captured by EPS. Thus, the La distribution in the reactor could be grouped into four kinds: dispersed La, La captured by EPS, intracellular La, and deposited La in the reactor. Deposited La in the reactor was calculated in a way which the amount of La added in the reactor minus the total of dispersed and absorbed La. A plasma-optical emission spectrometry (ICP-OES; iCAP 7400, Thermo Scientific, Waltham, MA, USA) that is inductively coupled was used to determine the La in samples after mixed-acid digestion, modified as previously specified [22]. Every experiment was conducted in triplicate, and the data obtained were given as mean ± standard deviation.

2.4. Other Analytical Procedures

Based on standard methods, the concentrations of TN, NO2, NO3, NH4+ in inlet and outlet, volatile suspended solids (VSS), suspended solids (SS), and pH were determined [23]. We withdrew sludge samples from the reactor on Day 15, 30, 45, 60, and 75 when each exposure period ended and marked them as L0, L1, L2, L3, and L4, respectively.
The previously stated method was used to determine extracellular lactate dehydrogenase (LDH) activity and reactive oxygen species (ROS) [21], and dehydrogenase activity (DHA) was illustrated in Text S2 in the Supplementary Materials. Each test was conducted in triplicate; the data obtained were presented as mean ± standard deviation.
An E.Z.N.ATM Mag-Bind Soil DNA Kit (OMEGA, M5635-02, Norcross, Georgia, GA, USA) was utilized to extract DNA from sludge samples. The 16S rRNA gene’s V4 region was high-throughput sequenced by a commercial service provider (Sangon Biological Engineering Co., Shanghai, China). The sequences of 16S rRNA were stored in NCBI (accession number, SRR10567086-SRR10567090). For more details, please refer to Text S3 in the Supplementary Materials.

2.5. Data Processing

According to the results of high-throughput sequences of 16S rRNA, identified genes were assigned KEGG Orthology numbers according to the latest release of KEGG (Kyoto Encyclopedia of Genes and Genomes, https://www.genome.jp/kegg/). Then, the relative enrichment or underrepresentation of KGEE categories were ranked using. According to Formula (1), OR is calculated, where L denotes the La (III), φ represents the KEGG pathways’ abundance and A, B refer to the different La (III) levels. Then, the differences in the KEGG pathways are defined using Ln of the OR of one given pathway in the KEGG pathways, where positive Ln means upregulated pathway, whereas negative Ln is indicative of a downregulated pathway [24].
O R L A / L B = φ A / ( 1 φ A ) φ B / ( 1 φ B )
Besides this, the software SPSS (version 23, Almonk, New York, NY, USA) was used in the cluster analysis. To conduct principal component analysis (PCA), CANOCO 4.5 programming (Microcomputer Power Co., Ithaca, New York, NY, USA) was utilized. To test distinctions between the control group (S0) and samples, GLM style analysis of variation (ANOVA), redundancy analysis (RDA), cluster analysis and t-test were processed with the help of SAS (version 9.4, North Carolina, NC, USA), where 0.05 was set as a threshold value. When p < 0.05, it was considered statistically significant.

3. Results

3.1. NRE in Response to La (III) Feeding

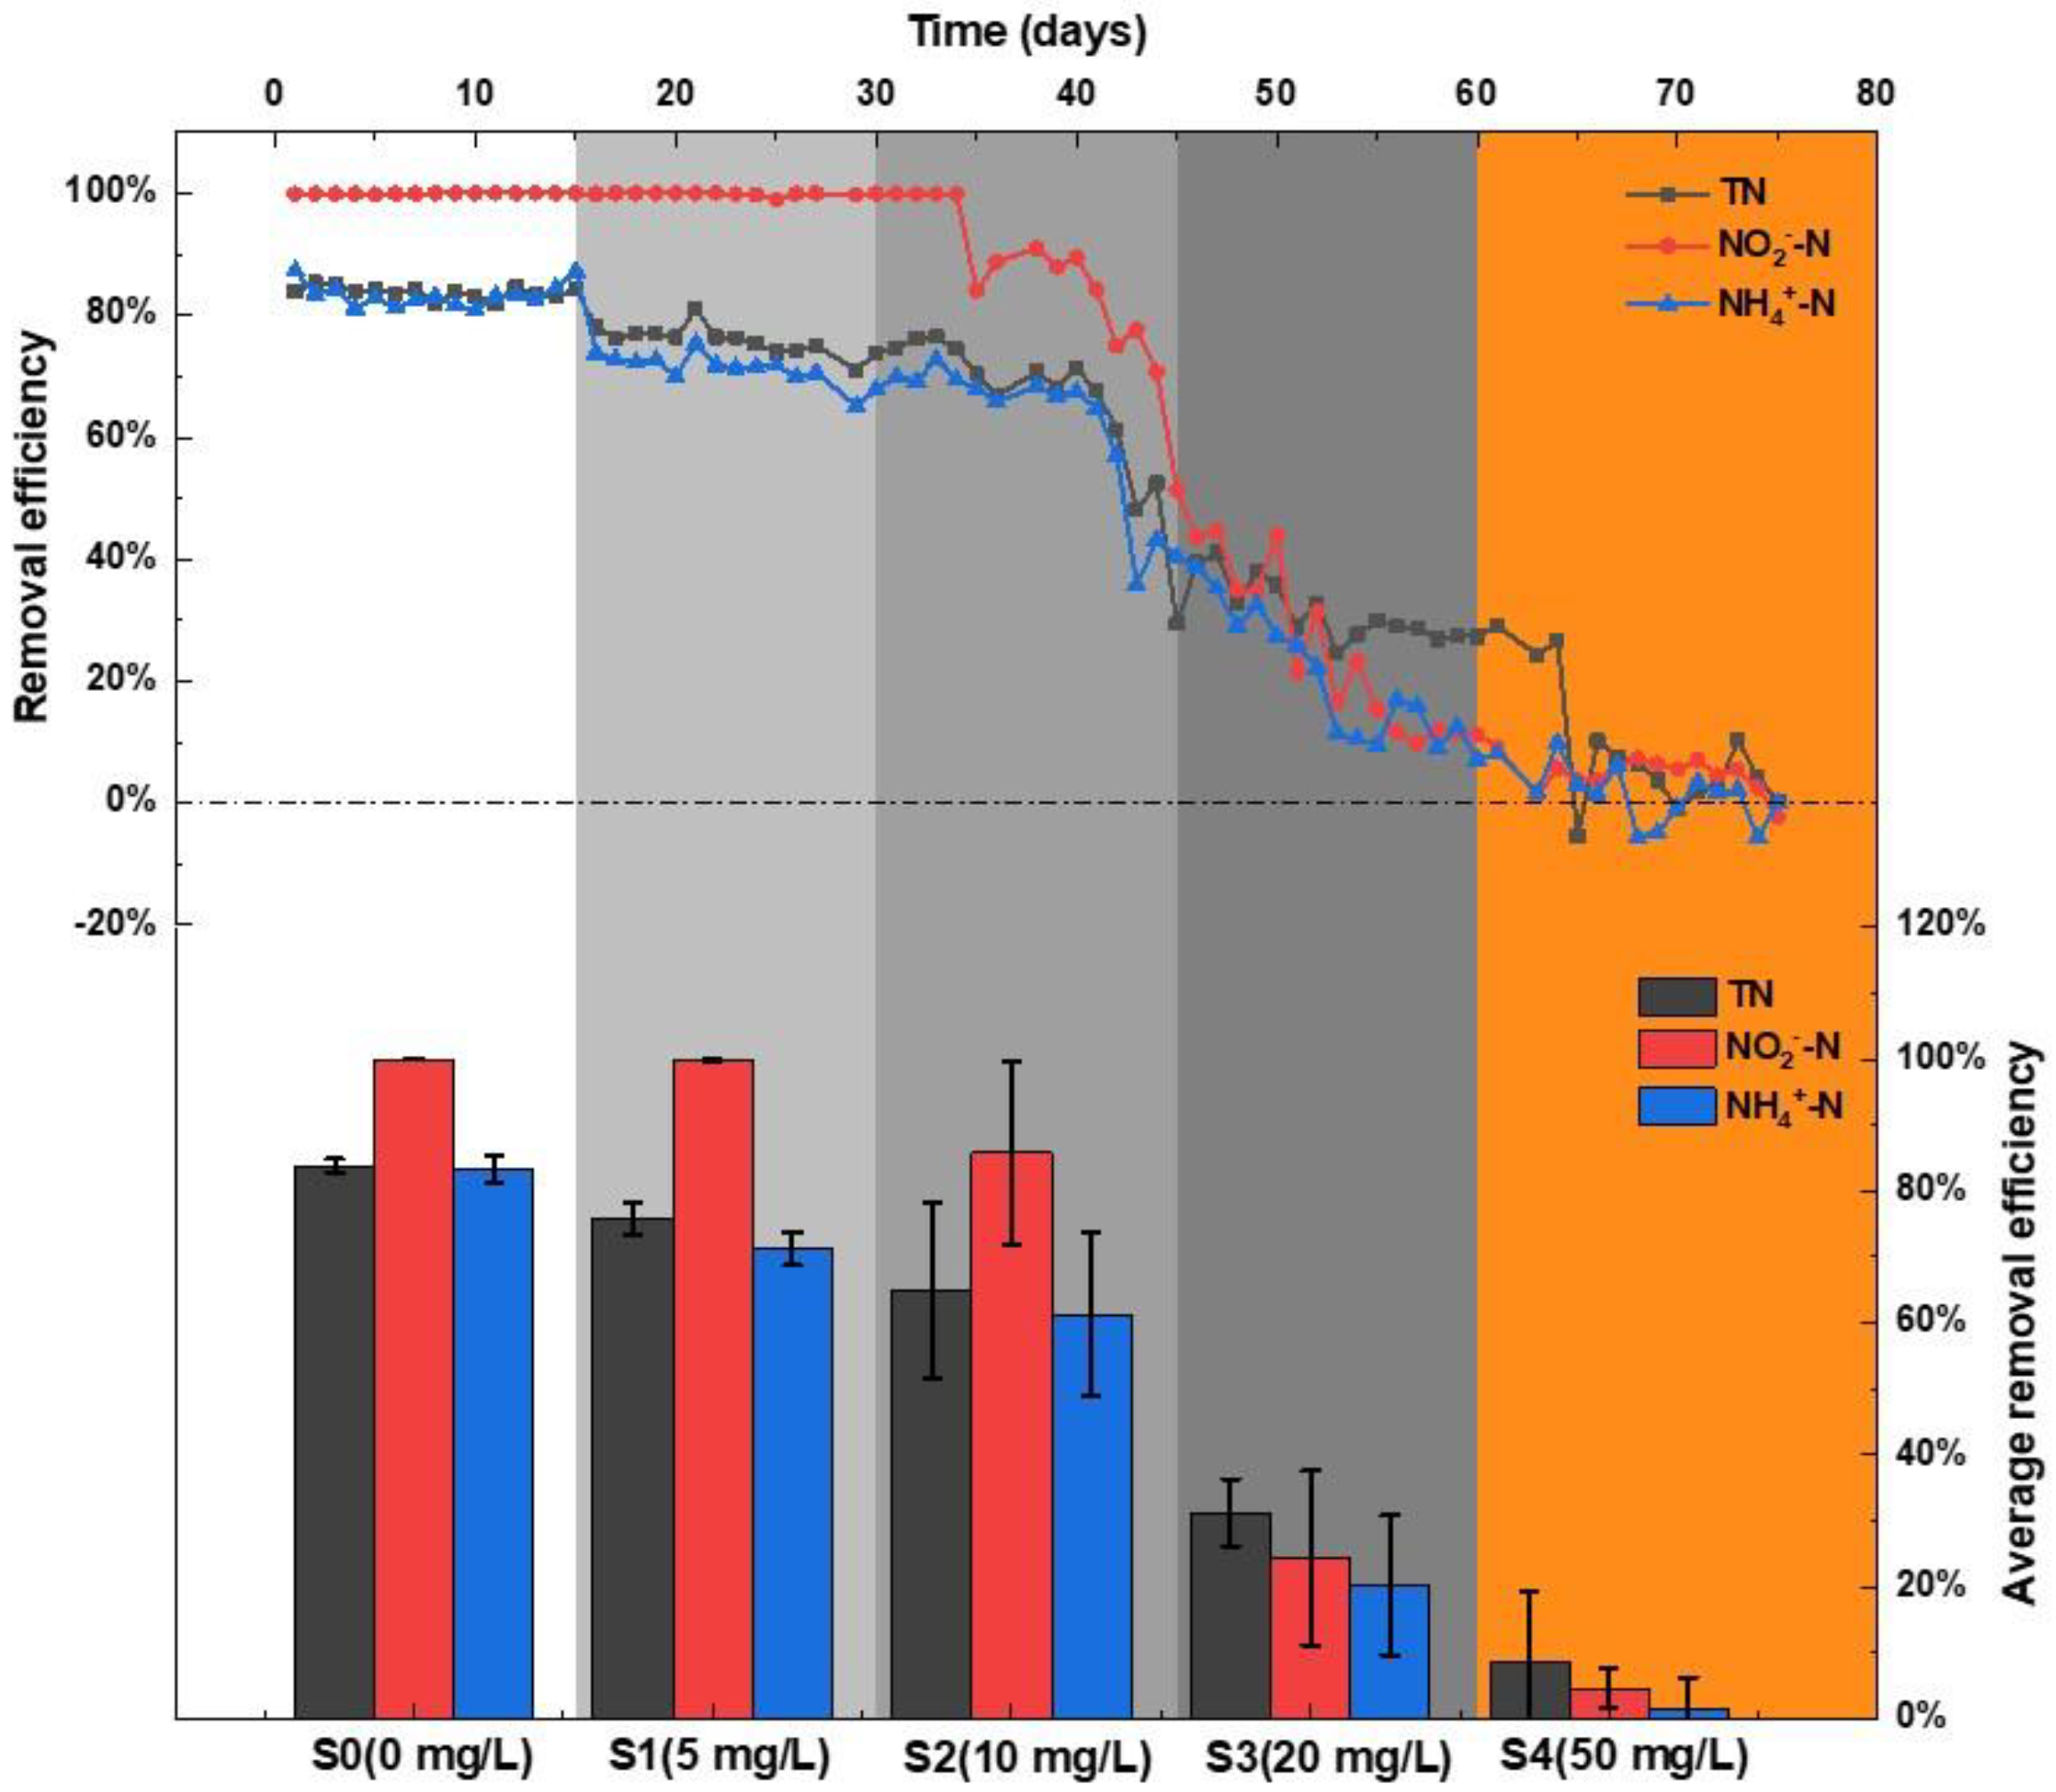
No significant effects of La (III) feeding on anammox NRE were observed in the batch exposure experiments on the NO2-N, NH4+-N and TN removal efficiency (Figure S1 in the Supplementary Materials). The long-term nitrogen removal performance of the anammox reactor is displayed in Figure 2. The first period (S0) of the operation was characterized by an average TN removal efficiency of over 83.79%. During the following four stages when the influent La (III) concentration was gradually increased from 5.0 to 50 mg L−1, the NRE showed significant differences with that of the reference state (p < 0.05, t-test). In S1, the TN and NH4+-N removal efficiency fluctuated with a slight decrease while NO2-N removal efficiency was still stable at as high as 99.87% which was virtually impervious to the perturbation caused by the influent La (III) of 5 mg L−1 (p > 0.05). Then, in S2, the TN average removal efficiency steeply decreased with the increase in La (III) to 10 mg L−1 (p < 0.05). Notably, the removal efficiency in NH4+-N and NO2-N swings downward synchronously under the further La (III) level at 20 mg L−1 (p < 0.05). Even worse, there was bare NRE when the La (III) addition reached 50 mg L−1 and it even was negative in some days due to the intrinsic NH4+-N release. Nonetheless, it is noteworthy that the average removal efficiency of TN in periods S3 and S4 were slightly higher than those of both NH4+-N and NO2-N (p < 0.05), which were totally different from the cases affected by low La (III) stress. Those phenomena indicated the coexistence of multitudinous nitrogen removal pathways besides anammox reaction in the reactor. In addition, other denitrification reactions, rather than anammox, made a more important contribution to the TN removal efficiency considering the difference between TN and NH4+-N as well as NO2-N removal efficiency.

3.2. Variations in the Amount and Composition of EPS

From the results analyzed above, it can be seen that the introduction of La (III) into wastewater at 5 mg L−1 La (III) had a slight difference, although La concentrations of 10–50 mg L−1 posed threats to the anammox system. The interaction between metal ions and microbial cells implied that La (III) must meet the extracellular EPS matrix then complete the transmembrane transport before reaching the cytoplasm and being accumulated intracellularly [20]. In other words, the EPS produced by the anammox granules was the first barrier that La (III) in the culture had to overcome. Hence, biochemical analyses were carried out on the EPS change and its interaction with La (III) using 3D-EEM and FTIR methods.
Generally, anammox granules are embedded with massive amount of EPS that primarily consist of PS and PN [25]. The anammox granule’s EPS content without adding La (III)(S0) was 292.9 ± 17.5 mg g−1 VSS (Table 1), and long-term exposure to La (III) influenced the EPS content. Firstly, the EPS content was greatly increased at 5 mg L−1 La (III) (p < 0.05), 36.0% higher than that of S0, then it decreased gradually after contacting with 10–50 mg L−1 La (III). However, the deviation of PN/PS ratio implied that they showed a difference in answer to the perturbation of La (III). The content of PN demonstrated a sharp increase in S1 and then decreased gradually from S2 to S4, even lower than that before the addition of La (III) (S0) when anammox granules were subjected to exposure to 50 mg L−1 La (III) (S4), while the PS content experienced a slight increase and then fluctuated with the elevated levels of La (III) in the surroundings. Thus, in Table 1, anammox consortia was likely to produce more PS and PN to extracellular space in answer to the simulation of low concentration of the La (III)-bearing medium, but the intensifying burden of La (III) in the surroundings might affect the EPS content.
For a further understanding of the shift in PS and PN in response to La (III), EPS’s fluorescent groups were shown in 3D-EEM spectroscopy (Figure 3). Basically, three noticeable peaks were apparently recognized in the EEM fluorescence map of EPS, which were indicative of protein-like substances in Region I (Ex/Em: 225/300–330 nm) and Region II (Ex/Em: 225/350 nm) and soluble microbial product-like material in Region III (Ex/Em: 275/325–375 nm), respectively [26]. Notably, the fluorescence intensity of three peaks was enhanced as the responses of anammox granular to the environment mutation with the initial exposure of low concentrations of La (III), which may be caused by the increase in EPS content, as analyzed above. Different from other La (III)-obtaining stages, the increase in aromatic protein related with Region I in S1, was prominently observed compared with other two peaks, which could be proved by the variation in the relative intensity proportions of the three peaks, as shown in Table S2 in the Supplementary Materials. These results confirmed the aforementioned result: more protein-like substances were possible coping strategies which likely are adopted by anammox consortia under La (III) threat. Moreover, exposure to La (III) made the position of the peak in Region III drift to a shorter wavelength, whereas those of Region I and Region II were shifted to the opposite direction after 10 mg L−1 La (III) was added.
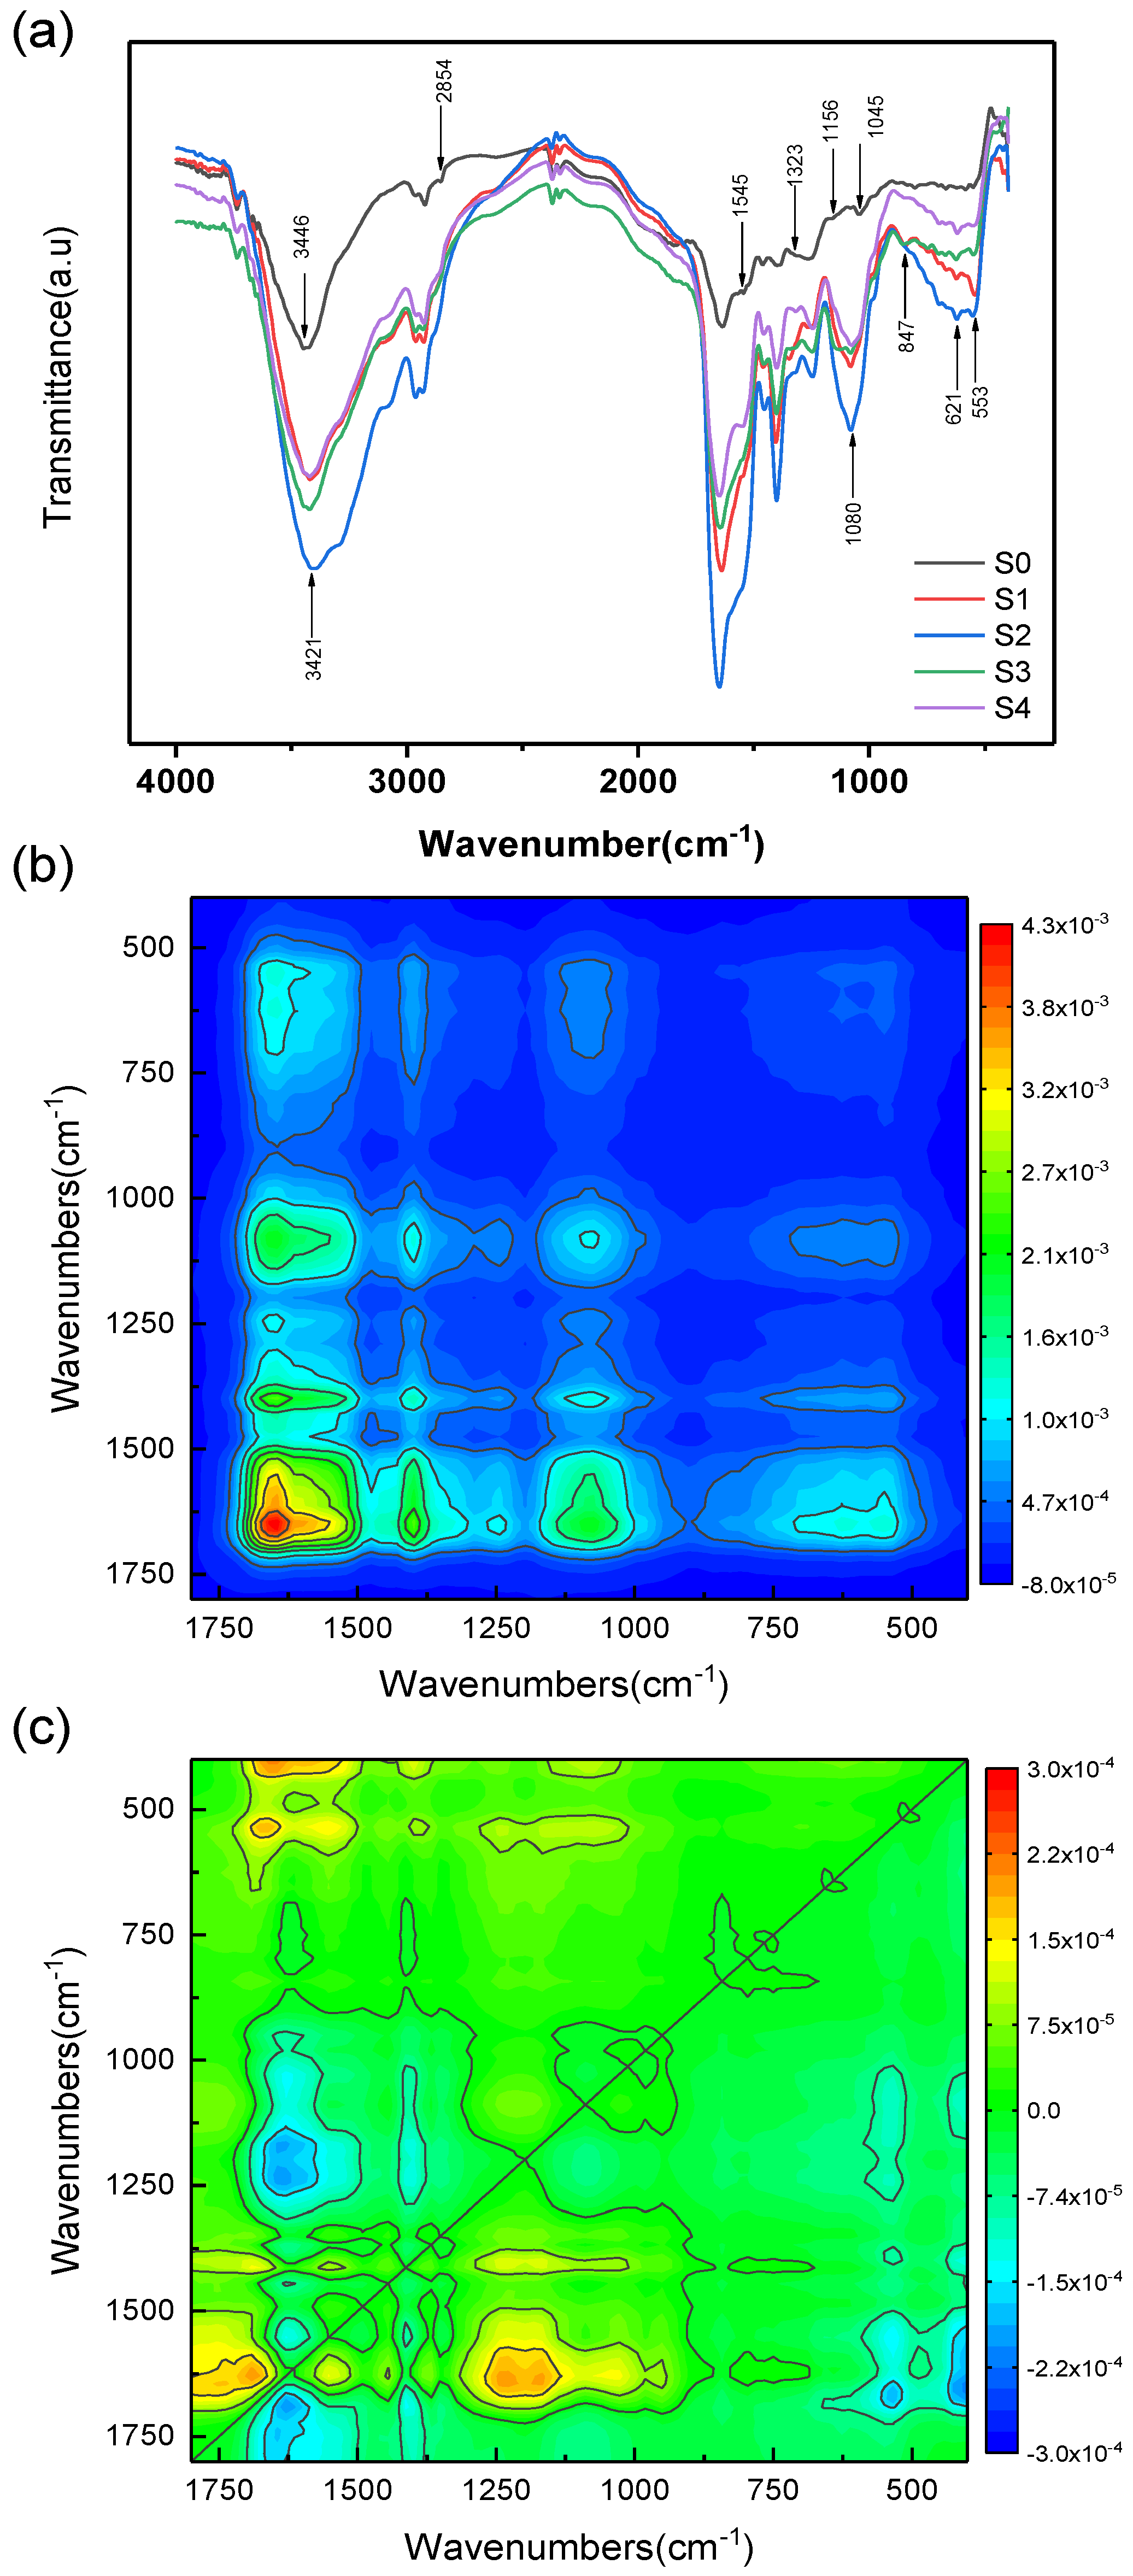
Then, FTIR spectroscopy was evaluated to demonstrate the major EPS functional groups, which are presented in Figure 4a and Table S3 in the Supplementary Materials. Noticeably, a new peak, 553 cm−1, associated with vibrations of La-O appeared after the reaction between EPS and La (III), which can be considered as direct evidence of the binging between EPS with La (III) [27]. Besides, the peak at 847 cm−1 distributed to the asymmetric ester O-P-O in nucleic acids was enhanced, which might have been caused by the powerful adsorption of La (III) onto the phosphate group’s oxygen atom [28]. Furthermore, peaks of groups in amide I (1637 cm−1), amide II (1545 cm−1), and amide III (1460 cm−1) also demonstrated obvious vibration, indicating that groups in the protein participated in the adsorption reaction of La (III), and the atoms of C and N have made important contributions. Moreover, the wide band, ranging within 1043 and 1080 cm−1, was merged to one main peak ranging at around 1080 cm−1, revealing that glycosidic (C-O-C) in the polysaccharides made a contribution to the capture of La (III). In addition, the C = O groups in carboxylates (1405 cm−1) and the C = O in carboxylic acids (1260 cm−1) were also involved in the reaction, as well as OH into that of polymeric compounds and amine (3446 cm−1).
To recognize the inconspicuous functional group’s responses to the different levels of La (III), two-dimensional maps were visualized with the FTIR regions from 1800 to 900 cm−1, from which we obtained important information of main functional groups, such as amides, carboxylic acids, and carbohydrate groups (Figure 4b,c). From the synchronous maps (Figure 4b), six significant characteristic autopeaks (at the diagonal position) were present at around 1650, 1545, 1452, 1404, 1244, and 1080 cm−1, which are related to amide I, amide II, amide III, carboxylates, carboxylic acids, and polysaccharides, respectively. The greatest intensity occurred in the autopeaks located at 1637 cm−1, followed by those around 1545,1404, 1080, 1452, and 1244 cm−1, indicating that amide I’s relative adsorption sensitivity is greater than other functional groups. Moreover, the whole positive cross-peaks on the synchronous maps showed that all the changes at six peaks covaried with each other in response to the perturbation of La (III). According to Noda’s rule [29], the signs of cross-peaks in the synchronous and asynchronous maps illustrate the sequence in which the corresponding functional groups interact and bind with perturbation, which allowed us to estimate the different roles exerted by the functional groups in the produce gained. The asynchronous map (Figure 4c) showed that the order in which the spectral regions come into interaction with La (III) is 1244→1081→1452→1545→1650 cm−1, showing that the order in which the corresponding EPS functional groups interact and bind with La (III) is carboxylic acids > polysaccharides > amide III> amide II > amide I. Therefore, considering all the results of FTIR, this indicated that carboxylic acids, polysaccharides and proteinaceous groups (amide I, II, and III) dominated in the functional groups reacted with La (III), and carboxylic acids had priority. Further, PN had a more intense response to the perturbation of La (III), though PS has a swifter one.
In summary, increased secretion of EPS under 5 mg L−1 La (III) is an adaptive defense mechanism of anammox granules against the introduction of La (III) in this study. Anammox-consortia benefits much from the multiple-layer structure secreta due to the important defensive role it plays, which agrees with high-performance nitrogen removal during S1, although 5 mg L−1 La (III) was enough to cause a reduction in NRE in SBR [30].

3.3. Fate and Behavior of La in Anammox Reactor

For long-term intermittent feeding strategy adopted, the content of La within the effluent was not detected even with the adding of 50 mg L−1 La (Table 1), which could be on account of the considerable amounts of HCO3 coexisting in the medium which could dramatically precipitate La and impair the bioavailability. Notably, stereoscopic images revealed the presence of visible white depositions stuck to the anammox granule’s surface, particularly from the exposure of 20 mg L−1 La (III) on, but such a deposition was not detected in the granule’s interior when hollows were not connected (Figure S3). At the end of the exposure experiment, the quantities of La (III) associated with the cells and bound to EPS were measured. The La concentrations in sludge before and after EPS extraction, as well as those bonded with EPS, were 37.91 ± 1.31, 46.74 ± 1.43, and 7.49 ± 0.97 mg g−1 VSS, respectively, indicating that quality ratio of intracellular La reached as high as 95.55 ± 0.91% when the EPS quality was taken into account.

3.4. ROS Generation, Extracellular LDH Release, and DHA Change

REE-induced ROS has been revealed as an underlying cause of its toxicity, as it is a strong oxidant that reacts quickly with most biological molecules, and can damage cells and DNA by oxidative stress [31,32]. Hence, in this research, an attempt to illuminate the potential mechanism of La (III) influencing the ROS production and LDH release as well as DHA release (to signify the cell membrane integrity and oxidative stress as well as to indicate the activity of anammox, respectively) was also made on days of 15th, 30th, 45th, 60th, and 75th.
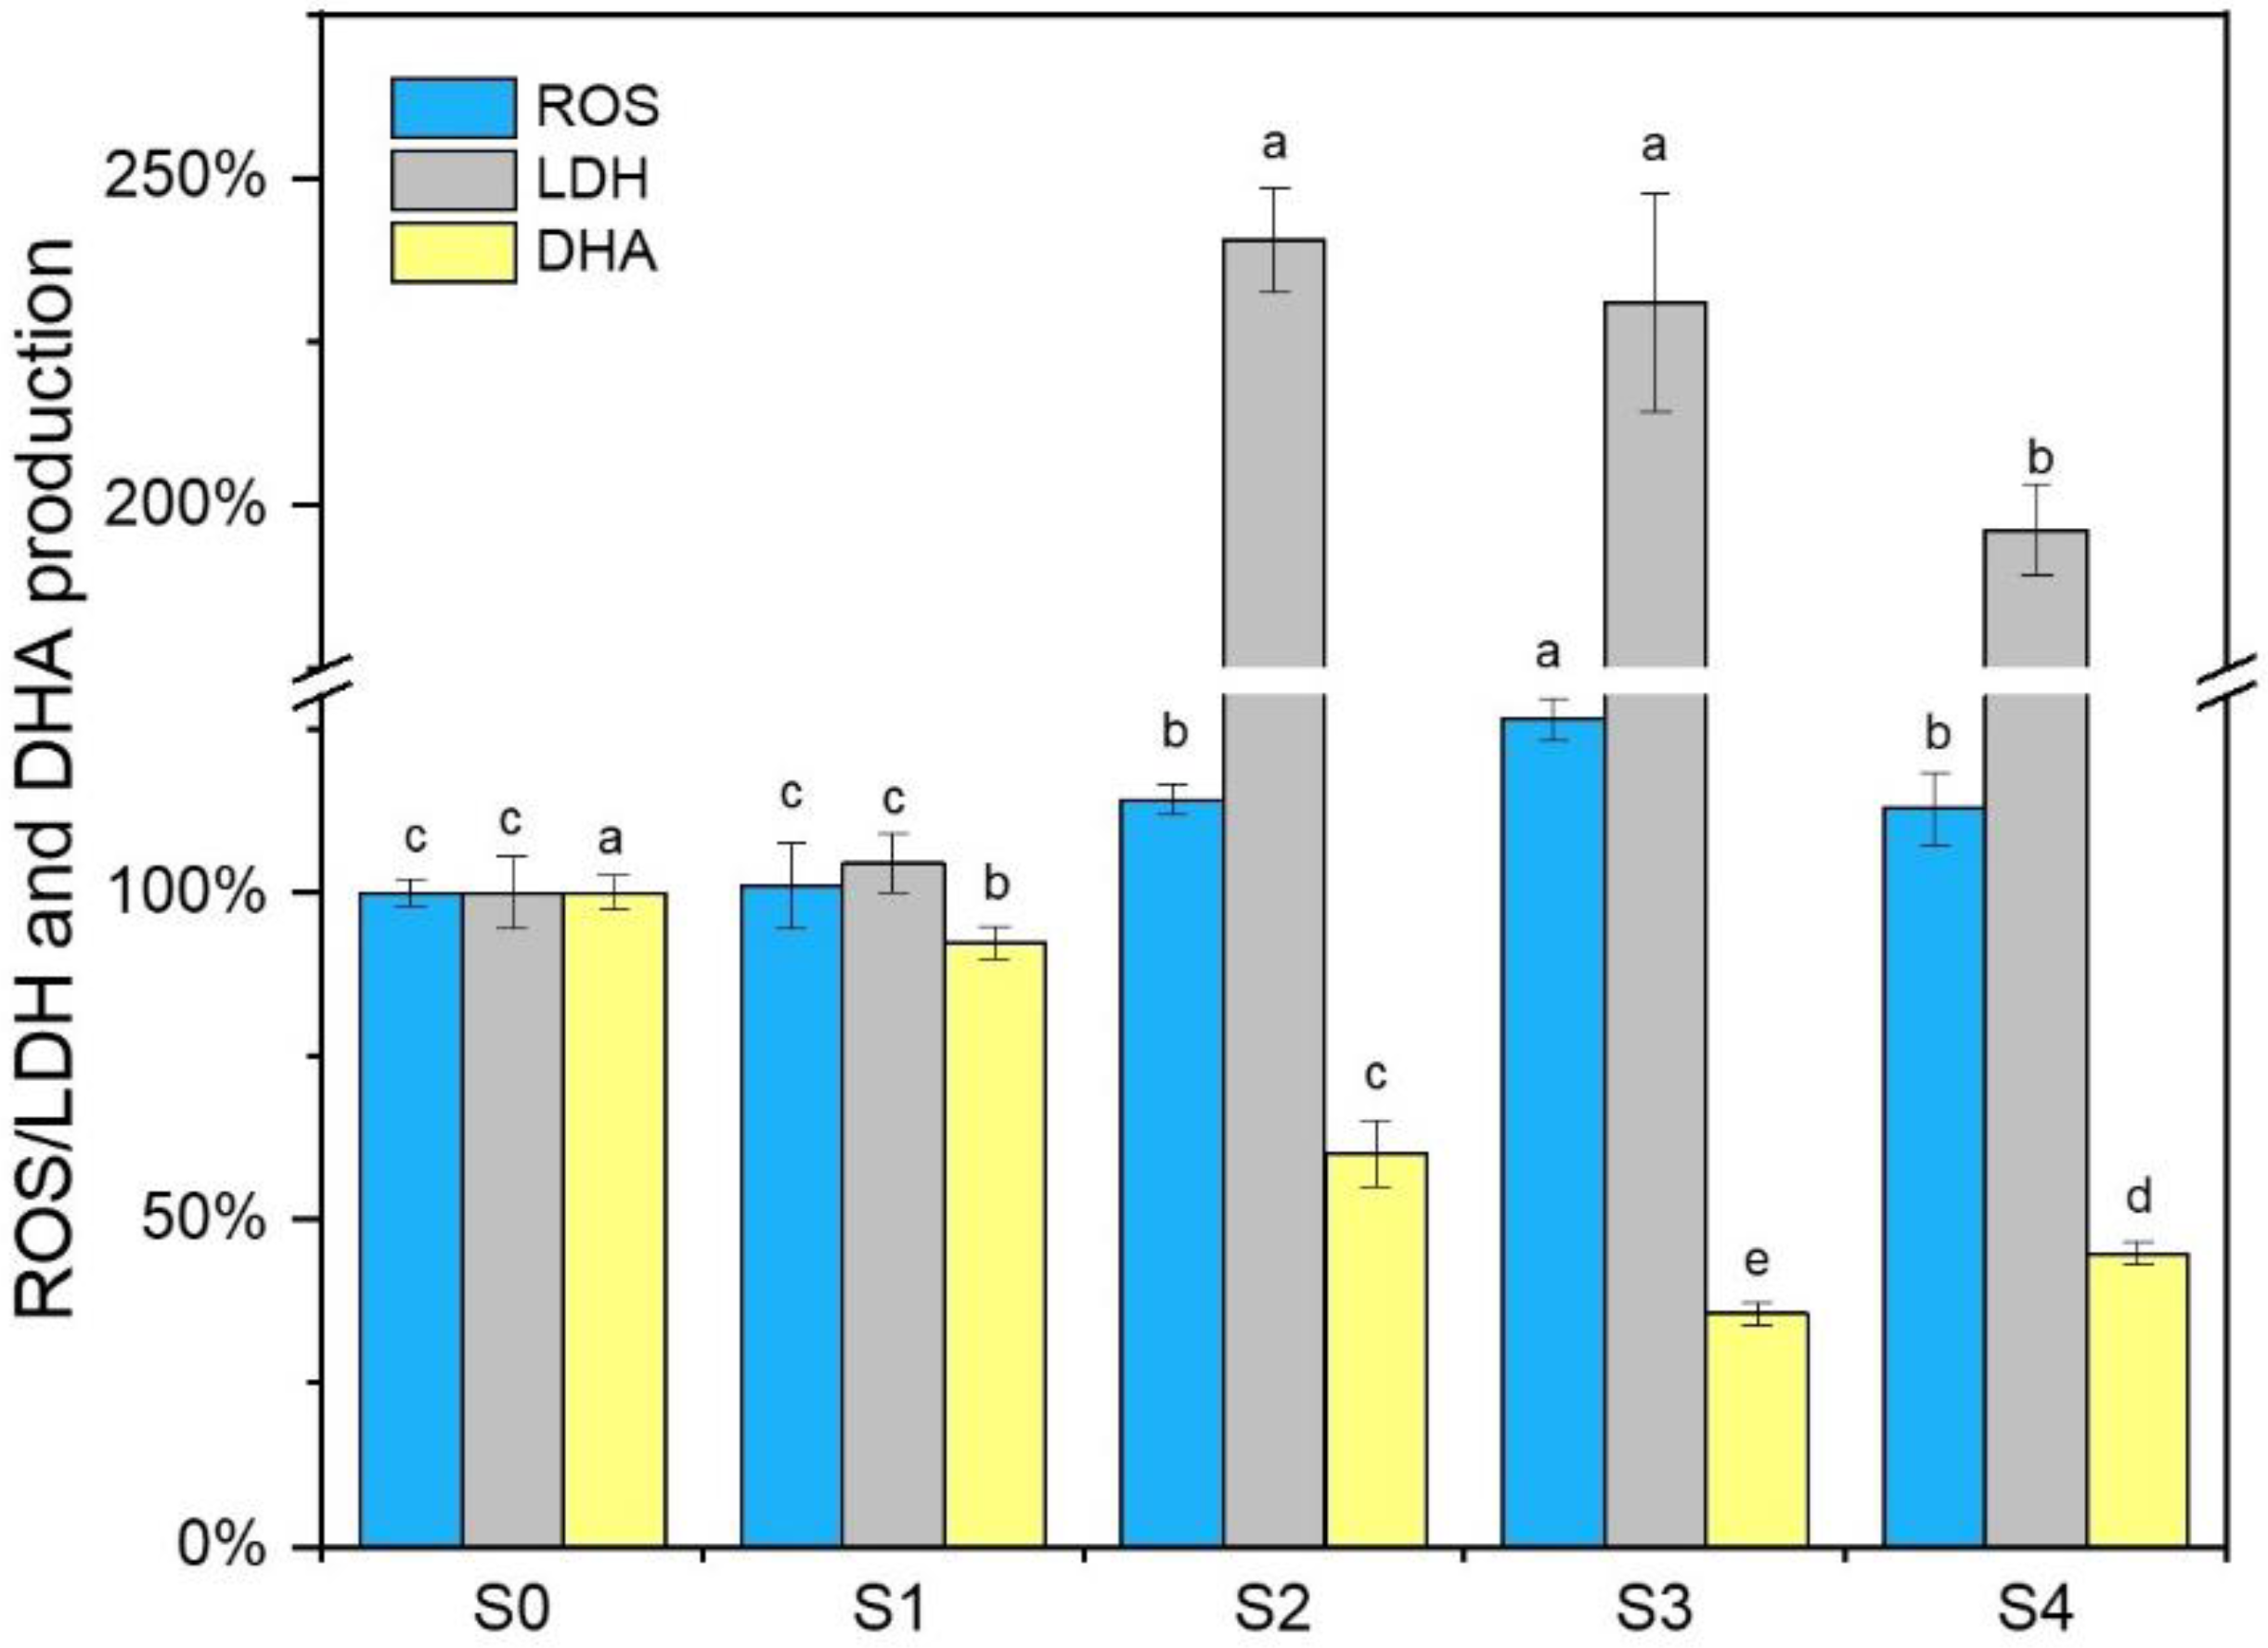
As can be seen in Figure 5, the ROS production at low La (III) burden (5 mg L−1) exhibited no difference with the control period (S0) (p > 0.05), whereas a high concentration of La (III) (10–50 mg L−1) showed a threat to the whole anammox system. Thanks to the barrier for metals which built up with EPS, most La3+ was captured by functional groups of EPS during S1, leading to no direct contacts of La and anammox bacteria, which is in line with the results of EPS, shown above. However, it was detected that ROS production markedly skyrocketed with the increase in La (III) concentration (p < 0.05). Aside from oxidative damage, La (III)-induced cell membrane damage was also considered as a possible explanation for La (III) toxicity. In this research, the low La (III) concentration slightly influenced the extracellular LDH release, while 10 mg L−1 La (III) significantly amounted to 240.59 ± 7.98% (Figure 5) (p < 0.05) and remained in a high position at 20 and 50 mg L−1 La (III). The abovementioned results are in line with the ROS generation shown above. Furthermore, the DHA, which exerted a strong influence on nitrogen removal performance, was used to measure the activity of biomass. It deteriorated with the accumulation of La (III) in the wastewater, which nearly bottomed to a third part at 20 mg L−1 La (III). Adverse condition and oxidant injury induced by ROS generation, as a result, would subsequently occur, even a decrease in the viability of anammox bacteria.
Thus, the results shown above indicate that the produced EPS, limited by the number of functional groups and binding site, was unable to block all La (III) under a high load, and a long-term La (III) feeding strategy was implemented in this study, leading to the following entrance of some ions into the microbial cells, which can be proven by the La’s intracellular accumulation at the experiment end, and later make chemicals bound to enzymes, finally leading to the disruption of enzymatic activities.

3.5. Microbial Community Analysis

3.5.1. Microbial Community Composition and Diversity

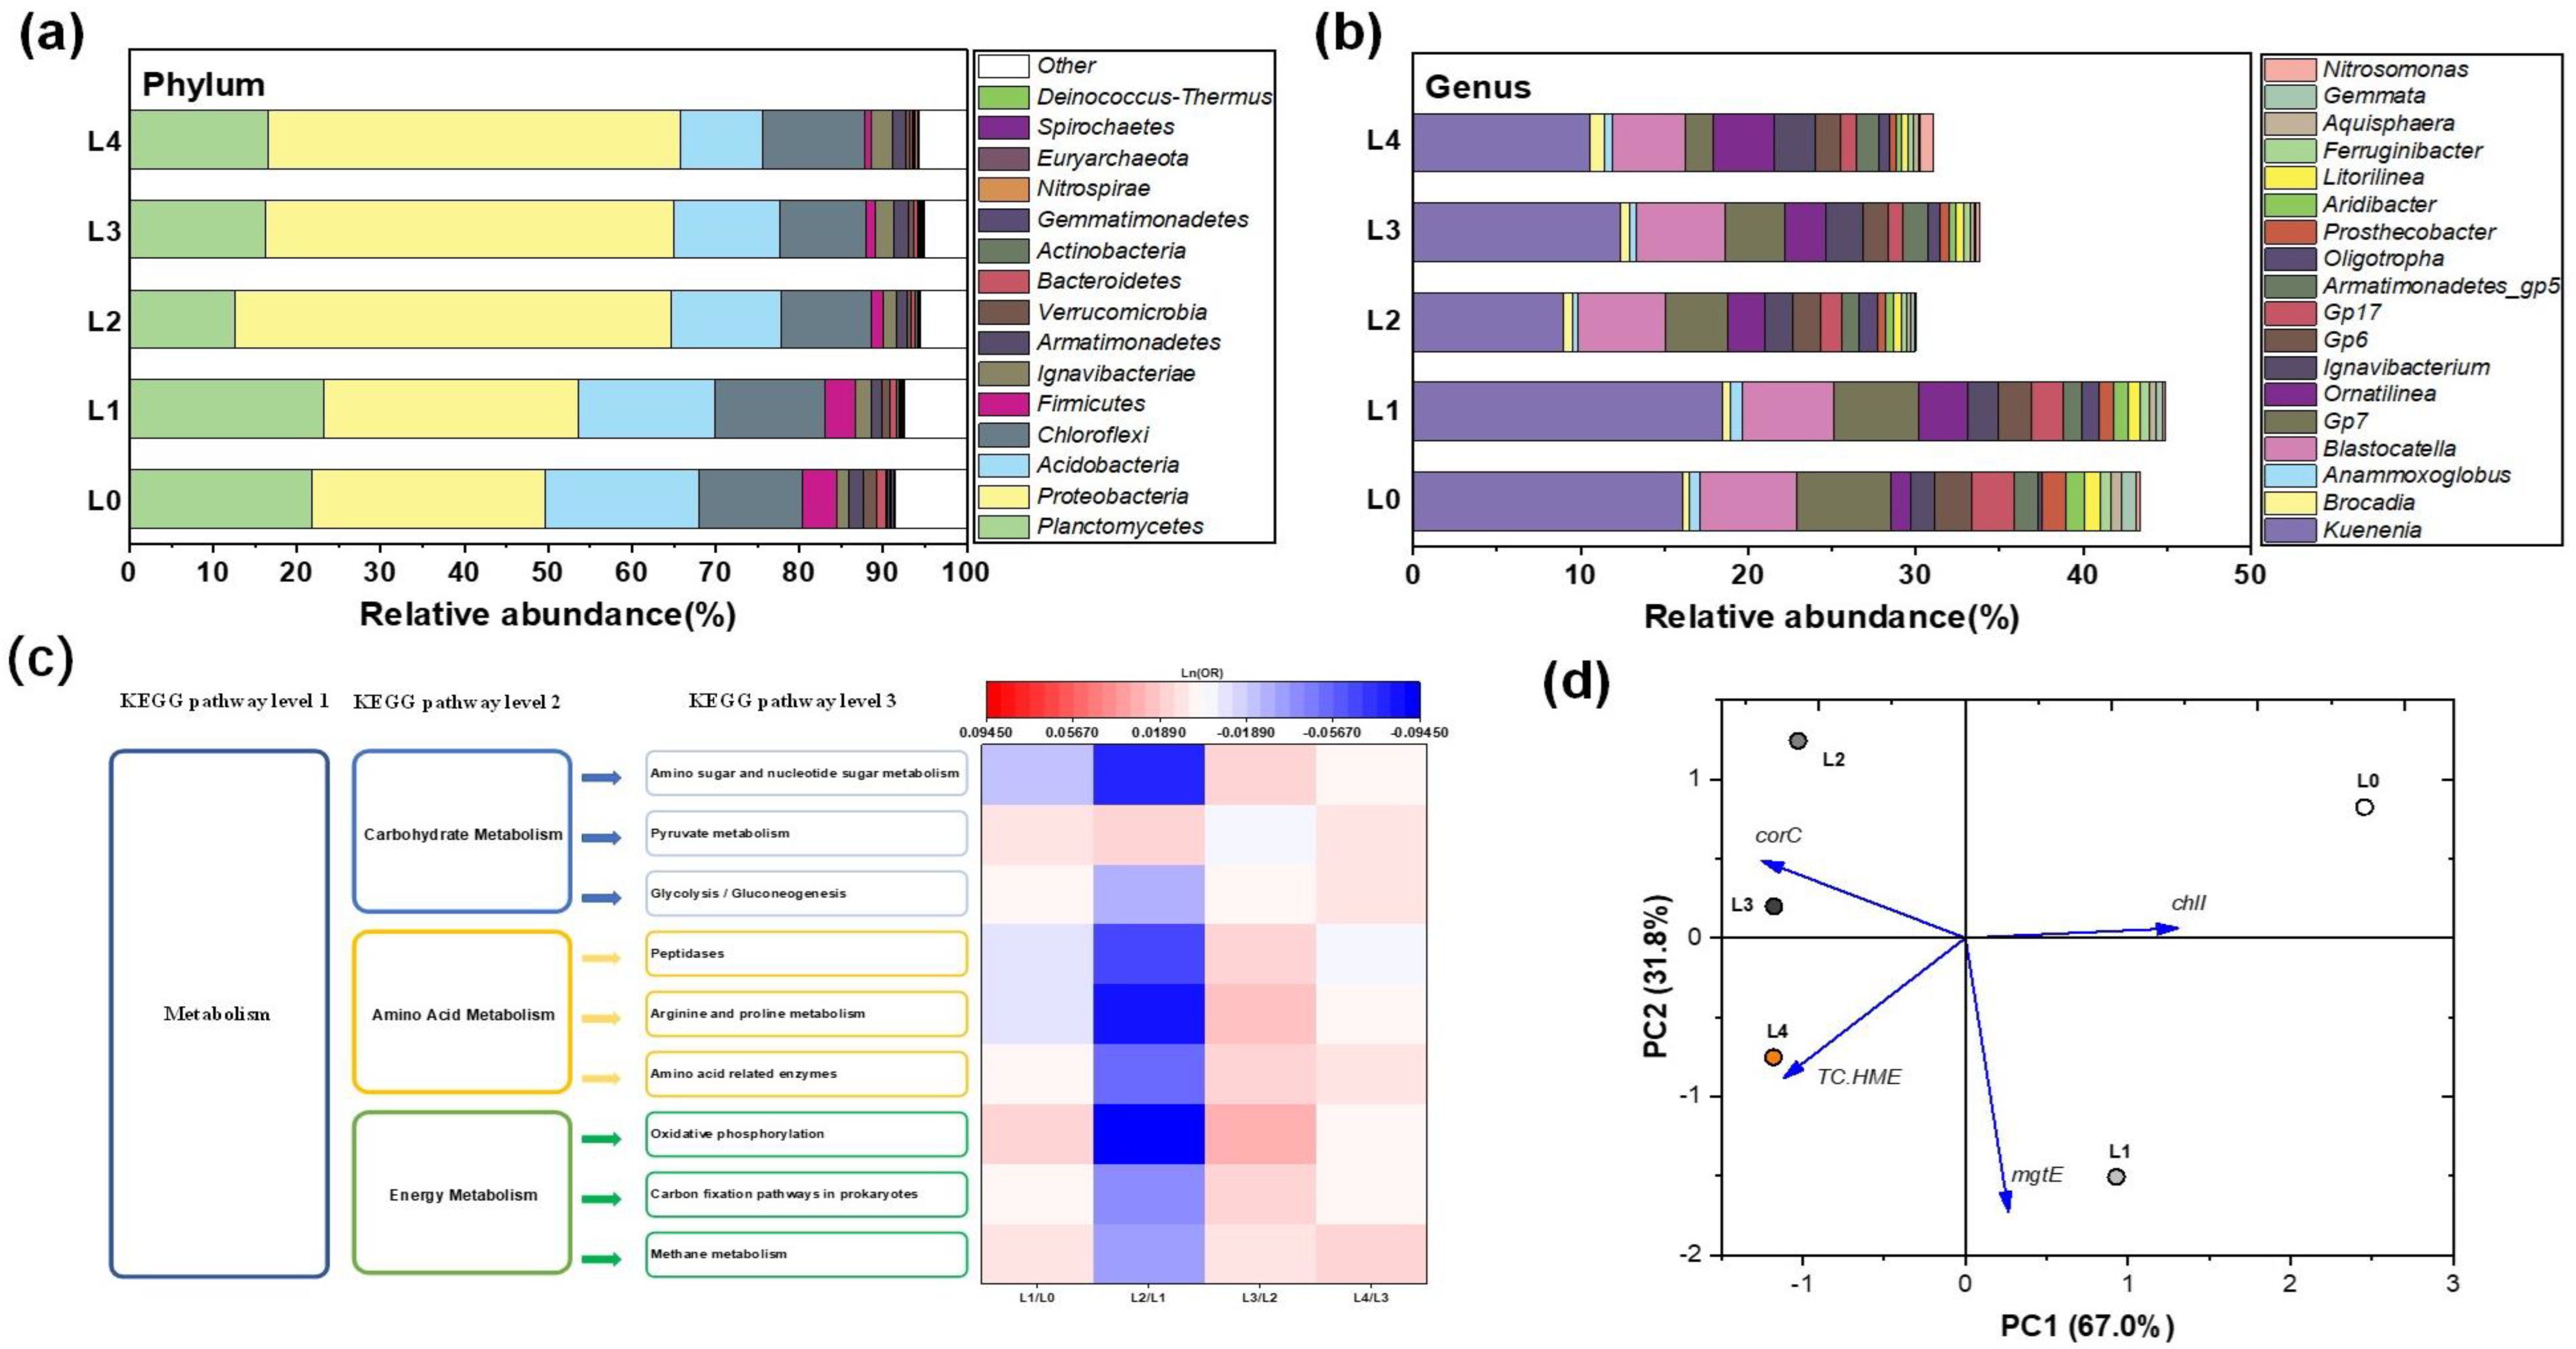
A 16S rRNA high-throughput sequencing was used to confirm the bacterial community structure of anammox sludge samples withdrawn at the end of each period. As displayed in Figure 6a, sixteen primary phyla with a relative abundance >0.05% were recognized in five samples, and Planctomycetes, Proteobacteria, Acidobacteria, Chloroflexi, Ignavibacteria, Firmicutes, Bacteroidetes, Armatimonadetes, Verrucomicrobia, Actinobacteria, Nitrospirae, Gemmatimonadetes, Euryarchaeota, Spirochaetes, Deinococcus−Thermus, and Chlamydiae were included. Notably, the exposure of anammox granular sludge to a small La (III) concentration (5 mg L−1) caused a slight increment in the relative abundance of Planctomycetes in L1 (from 21.69% to 23.21%), whereas the further elevation of the concentration caused a rapid decrease to 12.63% in L2, which might be in line with the sharp decline in the nitrogen removal rate, as mentioned above. However, Proteobacteria presented remarkable increases and peaked at the end of S2 in 10 mg L−1 La (III). In addition, the relative abundance of Chloroflexi fluctuated within a narrow range, whereas the abundance of Acidobacteria was progressively diminished. Furthermore, as indicated by the diversity index, including the Chao1, Ace, Simpson and Shannon indices (Table S4), La (III)’s appearance with 10–50 mg L−1 La (III) exerted opposite effects on the bacterial community’s richness and diversity in granules.

3.5.2. Potential Dominant Genera Driven by La (III)

The top 18 species, whose relative abundance exceeds 0.05%, are demonstrated in Figure 6b. Three genera of bacteria involved with the anammox reaction in the reactor, including Kuenenia, Brocadia and Aanammoxoglobus, were detected and Kuenenia had the highest abundance among them although La (III)-feeding slightly augmented Brocadia availability. Exposure to 5 mg L−1 La (III) enhanced Kuenania, making it dominant in the results, but the high concentration inhibited its growth, which is in line with the nitrogen removal performance mentioned above. Other functional bacteria, such as nitrifiers Oligotropha and Nitrosomonas, were also proven to coexist in the anammox granules. Redundancy analysis (RDA) revealed the curve of community development and the correlation between the variation of La (III) and functional species in Figure S2 in the Supplementary Materials. The locations of L3 and L4 indicated that La (III) concentration exerted a significant influence on communities’ composition of both samples and obviously decreased abundance of the genus Gemmata and Planctomicrobium, separating both L3 and L4 from the other three samples. Furthermore, regarding to the difference among L0, L1, and L2, the increased Oligotrp played a role in the variation. Besides, the drift in Brocadia and Nitrosomonas showed their adjustability to the La (III) addition, while Armatimonadetes gp5 and Blastochloris slightly affected the distribution in the five samples, showing that they are resistant to the La (III) addition.

3.5.3. Functional Genes Associated with EPS Production

To gain insight into the vibration of the molecular functions in bacterial communities, PICRUSt was employed using KEGG database. In view of the huge number of metabolic pathways, we only analyzed highly abundant (>1%) pathways (Figure 6c). The values of LnOR in two contiguous stages were calculated: under the conditions of 5 mg L−1 La (III) compared with 0 mg L−1 La (III)(L1/L0), 10 mg L−1 La (III) compared with 5 mg L−1 La (III)(L2/L1), 20 mg L−1 La (III) compared with 10 mg L−1 La (III)(L3/L2) and 50 mg L−1 La (III) and 20 mg L−1 La (III) (L4/L3), several third-level pathways associated with EPS production had remarkable distinctions in the second-level metabolism pathway, which could be categorized into two parts: intracellular material metabolism (amino acid metabolism and carbohydrate metabolism) and energy conversion (energy metabolism).
In terms of intracellular material metabolism, carbohydrate metabolism, characterized by amino sugar and nucleotide sugar metabolism, pyruvate metabolism and glycolysis/gluconeogenesis in this study, is crucial to the production of polysaccharide [33]. Among them, downregulated amino sugar and nucleotide sugar metabolism at L1/L0 and L2/L1 indicated more polysaccharide production, because nucleotide sugars, one of the important substrates for the enzyme glucosyltransferases, played an essential role in polysaccharide synthesis [34]. Except for this, pyruvate metabolism and glycolysis/gluconeogenesis third-level pathways were upregulated, which revealed the suppression of intracellular carbohydrate metabolism. Besides, amino-acid metabolism also characterizes the intracellular material metabolism. Arginine and proline metabolism and peptidases third-level pathway in the amino-acid metabolism, which played an important role in the synthesis of protein [35,36] and were potentially engaged in the breakdown of EPS [37], respectively, were downregulated at L1/L0, indicating the weakened degradation of extracellular protein. While increased La (III) were applied in the system, both were upregulated at L3/L2 and L4/L3, which indicated the enhanced decomposition of EPS. This is supported by the decreases in EPS content and the anammox bacterial relative abundance. However, amino-acid metabolic enzyme, another second-level pathway in the amino-acid metabolism, was considerably upregulated due to the amino acid’s conversion into carbohydrates to meet the demand for energy under La (III) stress (5 mg L−1) [24]. Obviously, the changes in predicted functional genes related to EPS secretion were in line with the vibration of PN and PS in EPS, as mentioned above.
Concerning the energy conversion, the third-level pathways (oxidative phosphorylation, methane metabolism, and carbon fixation pathways in prokaryotes) in energy metabolism second-level pathway shared a synchronous fluctuation trend, in which they were upregulated when the system was faced with the minor perturbation of 5 mg L−1 La (III) but significantly downregulated after being subjected to exposure to 10 mg L−1 La (III). For anammox bacteria, the dominant functional bacteria in the reactor are chemoautotrophic microorganisms, which gain energy mainly through nitrogen metabolism. It can be speculated that obstacles in the energy metabolism under high La (III) concentration are coupling with the nitrogen removal performance. However, the third-level pathways in the energy metabolism second-level pathway were upregulated at L3/L2 and L4/L3. This might be because the enhanced decomposition of EPS produced by anammox bacteria offered the main organic carbon source supporting heterotrophic growth in anammox granules, which is in line with the dynamic of the microbial community.

3.5.4. Metal Transport Genes Predicted by PICRUSt

Except for EPS, the microbial cell wall also can act as a barrier for metals. However, in the existing literature on the interactions between La and microorganisms, the limited research investigated neither the transport of La3+ by anammox bacterial cells nor La’s fate at the intracellular level. As reported previously, since REE’s ionic radius is extremely approximate to that of Ca and Mg ions, La is assumed to promote the Ca and Mg displacement or replacement in various cell functions [38,39]. Indeed, it is also well known that La ions can block Ca ionic channels in higher plant cells [40]. Therefore, this may affect the uptake of nutrient ions through Ca channels.
In this study, using PICRUSt, a suite of Ca/Mg-related genes was speculated in the anammox consortia, primarily including heavy-metal exporter TC.HME (K07239), magnesium transporter corA (k03284), corC (K06189) and mgtE (K06213), Mg2+ transporter mgtC (K07507), magnesium chelatase family protein and subunit comM (K07391), chlD (K03404) and chlI (K03405), Mg2+-transporting ATPase mgtA (K01531), Ca2+-transporting ATPase ATP2C (K01537), Ca2+:H+ antiporter chaA (K07300). With the help of cluster analysis, the Ca/Mg-related genes were clustered into four clusters (Figure S4). Then TC.HME, corC, mgtE and chlI were chosen for following PCA analysis. As illustrated in Figure 6d, the Ca/Mg-related genes were completely divergent from the initial anammox sludge (L0), exposed to La (III) (L1, L2, L3 and L4). Furthermore, the five samples were separated into two sets: low-La (III) cluster (L0, L1) and high-La (III) cluster (L2, L3, and L4). Thus, this indicated that the increase in La (III) distinguished the transport genes. Notably, the relative abundances of corC and TC. HME were markedly enhanced in answer to 50 mg L−1 La (III) (L4), whereas the abundances of mgtE and chlI were considerably decreased compared with L0, indicating that both ions’ transport genes might have contributed to the completeness of the transmembrane transport. Unfortunately, no genes related to La3+ or Ca2+/Mg2+ efflux transporter were found according to the PICRUSt.

4. Discussion

From the aforementioned analysis, it can be concluded that the long-term introduction of La (III) into medium at concentrations between 5–50 mg L−1 caused the intercellular accumulation of La (III). This phenomenon indicated that most of the La (III) might have managed to accumulate intracellularly after extracellular sorption and transmembrane transport, which is inconsistent with the findings of a previous study on Mixococcus xanthus [41] and Trichoderma [15]. In those reports by Merroun et al. and d’Aquino et al. [15,41], REEs were found largely in the external matrix of biomass and less crossed the cell wall and the plasma membrane, reaching the cytoplasm due to the large capacity of EPS. This difference might have been caused by the La-feeding strategies. In the present study, REE was supplied at a changeable concentration for a long time (60 days), while the experiments were conducted in the cases of Mixococcus xanthus and Trichoderma at a one-time REEs addition for a much shorter time period (2–3 days). The long-term La-feeding strategy offered not only more time but also more total La ions for the reaction between La (III) and microorganisms, which were key parameters for the La transmembrane transport.
Generally, an EPS consisting primarily of PS and PN is the first barrier that La (III) must cross before touching the anammox bacteria. In this study, after long-term exposure at 5 mg L−1 La (III), the system showed a stronger resistance than that reported in a previous study on NRE [30], where the total inorganic nitrogen removal efficiency decreased after the exposure to La of more than 1 mg L−1. This higher nitrogen removal efficiency during S1 might benefit from the variations in the amount and composition of EPS, and a large number of depositions containing La were observed in the outer layer of anammox granules. Long-term 5 mg L−1 La (III) feeding stimulated the anammox consortia to secrete more EPS to the extracellular space, which is confirmed by the changes in predicted functional genes related to EPS secretion. Besides, the structural modification of EPS was also observed in 3D-EEM spectra, where the position of peak associated with soluble microbial product-like material drift to a shorter wavelength, whereas those related to protein-like substances were shifted to opposite direction after 10 mg L-1 La (III) was added. However, those related to protein-like substances were shifted to the opposite direction after 10 mg L−1 La (III) was added. This result was similar to the ones obtained earlier by Zhang et al. [21]: the interaction of EPS with AgNPs was investigated; the fluorescence of both PN-like peaks was significantly influenced by AgNPs. This phenomenon might have been caused by the structural alteration in tryptophan-containing proteins. With the help of FTIR, this indicated that carboxylic acids, polysaccharides and proteinaceous groups (amide I, II, and III) dominated in the functional groups reacted with La (III), and carboxylic acids had priority. Further, PN had a more intense response to the perturbation of La (III), although PS had a swifter one.
As discussed previously, transmembrane transport is the second step in the uptake process of metal [21]. Since the ionic radius of REEs is extremely close to that of Ca and Mg ions, La is assumed to promote the displacement or replacement of Ca and Mg in different cell functions [42,43]. In this study, a suite of Ca/Mg-related genes was speculated, among which were corC and TC. HME might have contributed to the completeness of the transmembrane transport. However, neither genes related to La3+ nor to Ca2+/Mg2+ efflux transporter were found according to the PICRUSt. Thus, this indicates that gene-based regulation of ion transport detoxification mechanism like Ag (I) efflux transporters [21] has not been found to date. As a result, most of La fails to flow out from the intracellular space to the extracellular space, thus La is accumulated in the cells.
As a result of La (III) addition, La was accumulated intercellularly and reacted with enzymes associated with diverse metabolisms. ROS production was stimulated by the introduction of La (III). The ROS generation might be due to La cations absorbed on the negatively charged bacteria cell wall, since oxygen cannot be produced internally by the anammox metabolism [21,44]. A similar ROS generation induced by ZnO NPs and zinc cation itself released was reported by Zhao et al. [45]. However, they are inconsistent with the studies of Zhao et al. and Zheng et al., where no obvious increase in LDH release, but ROS generation was observed when anammox granules were affected by ZnO NPs for 24 and 4.5 h [45,46]. This difference might be due to the diverse exposure time. As a result, the DHA, a key index of nitrogen removal performance, was significantly inhibited after La (III) addition, which is in line with the decline in NRE in a macro perspective. Further, La (III) exerted adverse effects on the richness and diversity of the bacterial community in granules. This phenomenon is totally different when it comes to the AgNPs, where releases of the Ag icon and nano-particle special character increase the proliferation of a typical sulfate-reducing bacterium [47] and Kuenenia [21], as some key functional bacteria are responsible for the anammox reaction in this study.

5. Conclusions

Most La (III) accumulated intracellularly by extracellular sorption and transmembrane transport. The increased stress of La (III) (10–50 mg L−1) exerted adverse effects on the nitrogen removal performance and DHA, as well as the on relative abundance of Ca. Kuenenia. Meanwhile, the production of intracellular ROS, the activity of extracellular LDH, and intracellular accumulation of La were significantly promoted. However, no adverse effects were observed at the low concentration (5 mg L−1) of La (III) and in the batch experiment. Therefore, our results suggested that massive amounts of EPS were embedded on the anammox granules and acted as a protective barrier that captured La (III) by reaction with the functional groups at the low concentration. Finally, most of the La quantity broke down the EPS matrix and reacted with enzymes associated with diverse metabolism, resulting in NRE suppression.

Supplementary Materials

The following are available online at https://www.mdpi.com/2071-1050/12/19/7887/s1, Text S1: Batch exposure experiments; Text S2: Dehydrogenase activity (DHA) assay; Text S3: PCR amplification and Illumina MiSeq sequencing; Table S1: Concentration and composition of the synthetic wastewater; Table S2: Main fluorescence peaks in the EEM spectra of EPS extracted from anammox granules; Table S3: Main functional groups involved in the reaction between EPS and La (III); Table S4: Bacterial diversity indices of sludge samples exposed to 0, 5, 10, 20 and 50 mg L−1La(III); Figure S1: (a) Short-term effects of La (III) on ammonia removal performance; (b) Short-term effects of La (III) on nitrite removal performance; (c) Short-term effects of La (III) on TN removal performance; Figure S2:Redundancy analysis (RDA) of potential dominant genera driven by La (III); Figure S3: Images of anammox granules after exposure to 20 mg L−1 La (III). General view (a) showed white depositions of La (III) attached to the surface of the anammox granules; (b) Stereoscope images of the sectional view displaying white depositions of La (III) attached to the surface of the anammox granules; (c) Stereoscope images of sectional view revealed no depositions in the interior of granules without the connection of hollows (the black pot may be other incorporation of impurities brought from parent reactor); Figure S4: Cluster analysis of Ca/Mg-related genes.

Author Contributions

Conceptualization, validation, resources, data curation, funding acquisition, writing—review and editing supervision, project administration, investigation, D.W.; methodology, software, formal analysis, visualization, writing—original draft preparation, S.H. All authors have read and agreed to the published version of the manuscript.

Funding

The authors are thankful to the Ministry of Science and Technology of China(2017ZX07301005-001) and the National Key Research and Development Program of China (No.2017YFD0800900) for their financial support of this study.

Acknowledgments

The authors would like to express their gratitude to Ren Xiaoyan from the Institute of Translational Medicine, Nanchang University (Nanchang, Jiangxi, PR China) for her assistance in the experiments.

Conflicts of Interest

The authors declare no conflict of interest.

Nomenclatures

2D-COStwo-dimensional correlation spectroscopy
3D-EEMthree-dimensional excitation-emission matrix
ANAMMOXAnaerobic ammonium oxidation
CNDPconventional nitrification-denitrification process
DHAdehydrogenase activity
EPSextracellular polymeric substance
FTIRFourier transform infrared
Lalanthanum
LDHlactate dehydrogenase
NREnitrogen removal efficiency
ORodds ratio
PCAprincipal component analysis
PNprotein
PSPolysaccharide
REErare earth element
RDAredundancy analysis
ROSreactive oxygen species
SAAspecific anammox activity
SBRsequencing batch reactor
SSsuspended solids
TNtotal nitrogen
VSSvolatile suspended solids

References

  1. Yang, X.J.; Lin, A.; Li, X.L.; Wu, Y.; Zhou, W.; Chen, Z. China’s ion-adsorption rare earth resources, mining consequences and preservation. Environ. Dev. 2013, 8, 131–136. [Google Scholar] [CrossRef]
  2. Hao, X.; Wang, D.; Wang, P.; Wang, Y.; Zhou, D. Evaluation of water quality in surface water and shallow groundwater: A case study of a rare earth mining area in southern Jiangxi Province, China. Environ. Monit. Assess. 2016, 188, 24. [Google Scholar] [CrossRef] [PubMed]
  3. Huang, X.; Zhang, G.; Pan, A.; Chen, F.; Zheng, C. Protecting the environment and public health from rare earth mining. Earths Future 2016, 4, 532–535. [Google Scholar] [CrossRef]
  4. Liu, Y. Present Situation and Countermeasures of Soil and Water Conservation for mining areas using advanced rare earth mining technology. Water Resour. Dev. Res. 2002, 2, 30–32. [Google Scholar]
  5. State Environmental Protection Administration of China and General Administration of Quality Supervision. Standards for Underground Water Quality (GB/T14848-2017); Inspection and Quarantine of China: Beijing, China, 2017.
  6. Liu, W.S.; Guo, M.N.; Liu, C.; Yuan, M.; Chen, X.T.; Huot, H.; Zhao, C.M.; Tang, Y.T.; Morel, J.L.; Qiu, R.L. Water, sediment and agricultural soil contamination from an ion-adsorption rare earth mining area. Chemosphere 2019, 216, 75–83. [Google Scholar] [CrossRef]
  7. Luo, Z.J. MBR Process for Treatment of Rare Earth High-Salt and Ammonia-Nitrogen Wastewater; Jiangxi University of Science and Technology: Nanchang, China, 2018. [Google Scholar]
  8. Gao, L.Q.; Han, J.H.; Fan, B.H. The pretreatment of rare earth wastewater by UASB reactor. J. Inn. Mong. Univ. Sci. Technol. 2010, 29, 69–72. [Google Scholar]
  9. Zhang, Z.Z.; Cheng, Y.F.; Xu, L.Z.J.; Bai, Y.H.; Xu, J.J.; Shi, Z.J.; Zhang, Q.Q.; Jin, R.C. Transient disturbance of engineered ZnO nanoparticles enhances the resistance and resilience of anammox process in wastewater treatment. Sci. Total Environ. 2018, 622, 402–409. [Google Scholar] [CrossRef]
  10. Strous, M.; Heijnen, J.J.; Kuenen, J.G.; Jetten, M.S.M. The sequencing batch reactor as a powerful tool for the study of slowly growing anaerobic ammonium-oxidizing microorganisms. Appl. Microbiol. Biotechnol. 1998, 50, 589–596. [Google Scholar] [CrossRef]
  11. Hu, Z.; Lotti, T.; Kreuk, M.; Kleerebezem, R.; Loosdrecht, M.; Kruit, J.; Jetten, M.S.M.; Kartal, B. Nitrogen Removal by a Nitritation-Anammox Bioreactor at Low Temperature. Appl. Environ. Microbiol. 2013, 79, 2807–2812. [Google Scholar] [CrossRef] [Green Version]
  12. Luo, J.; Huo, Y.; Shen, Y.; Hu, J.; Ji, H. Effects of colloidal particle size on the geochemical characteristics of REE in the water in southern Jiangxi province, China. Environ. Earth Sci. 2016, 75, 81. [Google Scholar] [CrossRef]
  13. Gonzalez, V.; Vignati, D.A.L.; Leyval, C.; Giamberini, L. Environmental fate and ecotoxicity of lanthanides: Are they a uniform group beyond chemistry? Environ. Int. 2014, 71, 148–157. [Google Scholar] [CrossRef] [PubMed]
  14. Wang, L.; Li, J.; Zhou, Q.; Yang, G.; Ding, X.L.; Li, X.; Cai, C.X.; Zhang, Z.; Wei, H.Y.; Lu, T.H.; et al. Rare earth elements activate endocytosis in plant cells. Proc. Natl. Acad. Sci. USA 2014, 111, 12936–12941. [Google Scholar] [CrossRef] [PubMed] [Green Version]
  15. d’Aquino, L.; Morgana, M.; Carboni, M.A.; Staiano, M.; Antisari, M.V.; Re, M.; Lorito, M.; Vinale, F.; Abadi, K.M.; Woo, S.L. Effect of some rare earth elements on the growth and lanthanide accumulation in different Trichoderma strains. Soil Biol. Biochem. 2009, 41, 2406–2413. [Google Scholar] [CrossRef]
  16. Li, W.; Zhao, R.; Xie, Z.; Chen, X.; Shen, P. Effects of La3+ on Growth, Transformation, and Gene Expression of Escherichia coli. Biol. Trace Elem. Res. 2003, 94, 167–178. [Google Scholar]
  17. Tanaka, Y.; Hosaka, T.; Ochi, K. Rare earth elements activate the secondary metabolite–biosynthetic gene clusters in Streptomyces coelicolor A3(2). J. Antibiot. 2010, 63, 477–481. [Google Scholar] [CrossRef]
  18. Li, J.; Verweij, R.A.; van Gestel, C.A.M. Lanthanum toxicity to five different species of soil invertebrates in relation to availability in soil. Chemosphere 2018, 193, 412–420. [Google Scholar] [CrossRef]
  19. Connan, R.; Dabert, P.; Khalil, H.; Bridoux, G.; Béline, F.; Magrí, A. Batch enrichment of anammox bacteria and study of the underlying microbial community dynamics. Chem. Eng. J. 2016, 297, 217–228. [Google Scholar] [CrossRef] [Green Version]
  20. Zhang, Z.Z.; Xu, J.J.; Shi, Z.J.; Cheng, Y.F.; Ji, Z.Q.; Deng, R.; Jin, R.C. Short-term impacts of Cu, CuO, ZnO and Ag nanoparticles (NPs) on anammox sludge: CuNPs make a difference. Bioresour. Technol. 2017, 235, 281–291. [Google Scholar] [CrossRef]
  21. Zhang, Z.Z.; Cheng, Y.F.; Xu, L.Z.J.; Bai, Y.H.; Jin, R.C. Anammox granules show strong resistance to engineered silver nanoparticles during long-term exposure. Bioresour. Technol. 2018, 259, 10–17. [Google Scholar] [CrossRef]
  22. Helmeczi, E.; Wang, Y.; Brindle, I.D. A novel methodology for rapid digestion of rare earth element ores and determination by microwave plasma-atomic emission spectrometry and dynamic reaction cell-inductively coupled plasma-mass spectrometry. Talanta 2016, 160, 521–527. [Google Scholar] [CrossRef]
  23. APHA; AWWA; AEF. Standard Methods for the Examination of Water and Wastewater, 21st ed.; American Public Health Association: Washington, DC, USA, 2005. [Google Scholar]
  24. Wang, H.; Li, H.X.; Fang, F.; Guo, J.; Chen, Y.P.; Yan, P.; Yang, J.X. Underlying mechanisms of ANAMMOX bacteria adaptation to salinity stress. J. Ind. Microbiol. Biotechnol. 2019, 46, 573–585. [Google Scholar] [CrossRef] [PubMed]
  25. Hou, X.; Liu, S.; Zhang, Z. Role of extracellular polymeric substance in determining the high aggregation ability of anammox sludge. Water Res. 2015, 75, 51–62. [Google Scholar] [CrossRef] [PubMed]
  26. Xia, Q.; Liang, R.; Hong, Y.; Ding, L.; Ren, H.; Mao, Y.; Zhao, M. Effects of La, Ce on nitrogen removal in sequencing batch reactor. Front. Environ. Sci. Eng. 2009, 3, 369–374. [Google Scholar] [CrossRef]
  27. Balboul, B.; El Roudi, A.M.; Samir, E.; Othman, A.G. Non-isothermal studies of the decomposition course of lanthanum oxalate decahydrate. Thermochim. Acta. 2002, 387, 109–114. [Google Scholar] [CrossRef]
  28. Moriwaki, H.; Koide, R.; Yoshikawa, R.; Warabino, Y.; Yamamoto, H. Adsorption of rare earth ions onto the cell walls of wild-type and lipoteichoic acid-defective strains of Bacillus subtilis. Appl. Microbiol. Biotechnol. 2013, 97, 3721–3728. [Google Scholar] [CrossRef] [PubMed] [Green Version]
  29. Noda, I.; Dowrey, A.E.; Marcott, C.; Story, G.M.; Ozaki, Y. Generalized two-dimensional correlation spectroscopy. Appl. Spectrosc. 2000, 54, 236A–248A. [Google Scholar] [CrossRef]
  30. Wei, D.; Li, M.; Wang, X.; Han, F.; Li, L.; Guo, J.; Ai, L.; Fang, L.; Liu, L.; Du, B.; et al. Extracellular polymeric substances for Zn (II) binding during its sorption process onto aerobic granular sludge. J. Hazard. Mater. 2016, 301, 407–415. [Google Scholar] [CrossRef]
  31. Li, X.; Chen, Z.; Chen, Z.; Zhang, Y. A human health risk assessment of rare earth elements in soil and vegetables from a mining area in Fujian Province, Southeast China. Chemosphere 2013, 93, 1240–1246. [Google Scholar] [CrossRef] [Green Version]
  32. Pagano, G.; Aliberti, F.; Guida, M.; Oral, R.; Siciliano, A.; Trifuoggi, M.; Tommasi, F. Rare earth elements in human and animal health: State of art and research priorities. Environ. Res. 2015, 142, 215–220. [Google Scholar] [CrossRef]
  33. Zhang, Z.Z.; Cheng, Y.F.; Liu, Y.Y.; Zhang, Q.; Zhu, B.Q.; Jin, R.C. Deciphering the evolution characteristics of extracellular microbial products from autotrophic and mixotrophic anammox consortia in response to nitrogen loading variations. Environ. Int. 2019, 124, 501–510. [Google Scholar] [CrossRef]
  34. Li, J.; Wang, N. The gpsX gene encoding a glycosyltransferase is important for polysaccharide production and required for full virulence in Xanthomonas citri subsp. citri. BMC Microbiol. 2012, 12, 31. [Google Scholar] [CrossRef] [Green Version]
  35. Lv, Y.; Pan, J.; Huo, T.; Zhao, Y.; Liu, S. Enhanced microbial metabolism in one stage partial nitritation-anammox system treating low strength wastewater by novel composite carrier. Water Res. 2019, 163, 114872. [Google Scholar] [CrossRef]
  36. Nagatani, H.; Shimizu, M.; Valentine, R.C. The mechanism of ammonia assimilation in nitrogen fixing bacteria. Arch. Für Mikrobiol. 1971, 79, 164–175. [Google Scholar] [CrossRef]
  37. Lawson, C.E.; Wu, S.; Bhattacharjee, A.S.; Hamilton, J.J.; McMahon, K.D.; Goel, R.; Noguera, D.R. Metabolic network analysis reveals microbial community interactions in anammox granules. Nat. Commun. 2017, 8, 15416. [Google Scholar] [CrossRef]
  38. Lansman, J.B. Blockade of current through single calcium channels by trivalent lanthanide cations. Effect of ionic radius on the rates of ion entry and exit. J. Gen. Physiol. 1990, 95, 679–696. [Google Scholar] [CrossRef] [Green Version]
  39. Liu, P.; Xiao, H.; Li, X.; Zhang, C.; Liu, Y. Study on the toxic mechanism of La3+ to Escherichia coli. Biol. Trace Elem. Res. 2006, 114, 293–299. [Google Scholar]
  40. Lewis, B.D.; Spalding, E.P. Nonselective Block by La3+ of Arabidopsis Ion Channels Involved in Signal Transduction. J. Membr. Biol. 1998, 162, 81–90. [Google Scholar] [CrossRef]
  41. Merroun, M.L.; Ben Chekroun, K.; Arias, J.M.; González-Muñoz, M.T. Lanthanum fixation by Myxococcus xanthus: Cellular location and extracellular polysaccharide observation. Chemosphere 2003, 52, 113–120. [Google Scholar] [CrossRef]
  42. Evans, C.H. Interesting and useful biochemical properties of lanthanides. Trends Biochem. Sci. 1983, 8, 445–449. [Google Scholar] [CrossRef]
  43. Das, T.; Sharma, A.; Talukder, G. Effects of lanthanum in cellular systems. Biol. Trace Elem. Res. 1988, 18, 201–228. [Google Scholar] [CrossRef]
  44. Choi, O.; Hu, Z. Size Dependent and Reactive Oxygen Species Related Nanosilver Toxicity to Nitrifying Bacteria. Environ. Sci. Technol. 2008, 42, 4583–4588. [Google Scholar] [CrossRef]
  45. Zhao, J.; Zhang, B.; Zuo, J. Response of anammox granules to ZnO nanoparticles at ambient temperature. Environ. Technol. Innov. 2019, 13, 146–152. [Google Scholar] [CrossRef]
  46. Zheng, X.; Wu, R.; Chen, Y. Effects of ZnO Nanoparticles on Wastewater Biological Nitrogen and Phosphorus Removal. Environ. Sci. Technol. 2011, 45, 2826–2832. [Google Scholar] [CrossRef] [PubMed]
  47. Chen, Y.; Chen, H.; Zheng, X.; Mu, H. The impacts of silver nanoparticles and silver ions on wastewater biological phosphorous removal and the mechanisms. J. Hazard. Mater. 2012, 15, 88–94. [Google Scholar]
Figure 1. Lanthanum (La) distribution. La added in the reactor was captured by extracellular polymeric substance (EPS) secreted by anammox granulates, accumulated then in the cells, partly deposited with special anions and dispersed in the media.
Sustainability 12 07887 g001
Figure 2. Nitrogen removal efficiency and average removal efficiency of five anammox process. Error bars: mean ± S.D. of fifteen concentration data during the stage.
Sustainability 12 07887 g002
Figure 3. Variations in the amount and composition of fluorescence components in EPS. Excitation–emission matrix (EEM) fluorescence spectra of EPS extracted from anammox granules exposed to 0 (a), 5 (b), 10 (c), 20 (d), and 50 mg L−1 (e) La (III).
Sustainability 12 07887 g003
Figure 4. Variations in the amount and composition of functional groups in EPS. FTIR spectrum (a) of EPS extracted from anammox granules exposed to 0, 5, 10, 20, and 50 mg L−1 La (III); synchronous (b) and asynchronous (c) maps of 2D FTIR correlation spectra of EPS in the region of 1800–900 cm−1: red represents the positive correlation, and blue represents the negative correlation; a higher color intensity indicates a stronger correlation.
Sustainability 12 07887 g004
Figure 5. Production of reactive oxygen species (ROS) and lactate dehydrogenase (LDH) released by anammox biomass exposed to La (III) in the reactor and its dehydrogenase activity (DHA). Different letters (a, b, c, d and e) indicate significant difference between treatments at p < 0.05. Error bars: mean ± S.D. of three replicates.
Sustainability 12 07887 g005
Figure 6. Microbiological community perturbance and functional genes vibration driven by La (III). The microbial community taxonomic compositions at the phylum (a) or genus (b) level were defined as the number of sequences assigned to a given taxon divided by the total number of sequences per sample; the relative abundance of the predicted functional genes associated with EPS production based on PICRUSt analysis where pathways lower than 1% were excluded (c). Principal component analysis (PCA) revealed the evolution of the Ca/Mg-related genes (d).
Sustainability 12 07887 g006
Table 1. EPS content of the anammox granules exposed to La (III) (0, 5, 10, 20, 50 mg L−1) and La concentration.
StageDaysLa AddedDispersed LaPNPSTotal EPSPN/PS
mg L−1mg L−1mg·g−1 VSSmg·g−1 VSSmg·g−1 VSS
S00–150ND260.9 ± 20.4 (n = 3) b32.0 ± 2.9 (n = 3) b292.9 ± 17.5 (n = 3) b8.2
S116–305ND363.0 ± 26.7 (n = 3) a35.3 ± 1.2 (n = 3) a398.3 ± 26.8 (n = 3) a10.3
S231–4510ND273.4 ± 37.8 (n = 3) b50.6 ± 4.5 (n = 3) b324.0 ± 40.4 (n = 3) b5.4
S346–6020ND192.8 ± 16.6 (n = 3) c39.4 ± 4.3 (n = 3) c232.2 ± 20.9 (n = 3) c4.9
S461–7550ND180.1 ± 18.3 (n = 3) c45.0 ± 3.0 (n = 3) c225.1 ± 17.5 (n = 3) c4
Note: PN: Protein. PS: Polysaccharide. EPS: Extracellular polymeric substances. ND: Not detected. n: number of replicates. The values are the mean ± S.D. (error bars) of three replicates. Different letters (a, b and c) indicate significant difference between treatments at p < 0.05.