Abstract
This study aims to conceptualise, develop, purify and validate a multiple-item scale to measure a sustainable consumption (SC) construct from the perspective of developing countries, particularly Malaysia. Interview, a focus group and survey methods were used to collect qualitative and quantitative data from respondents. Content Analysis, Exploratory Factor Analysis (EFA) and Confirmatory Composite Analysis (CCA) using Partial Least Square (PLS) were used to explore and predict the data. The EFA output generated three dimensions with 21 items. The dimensions are cognitive SC, affective SC and a conative SC that reflects the notion of sustainable consumption. The result of the CCA confirmed the EFA result. Based on the reliability and validity check results, it is apparent that the scale demonstrates good psychometric properties. This is a pioneer study that developed a new scale to measure sustainable consumption behaviour in a non-Western context. In addition, this study conceptualised sustainable consumption behaviour as a multi-dimensional attitudinal construct determined by the cognitive, affective and conative aspects of the mind.
1. Introduction
“Sustainable development” is a buzzword which is often considered as the panacea for the sustainability of humanity [1]. Sustainable development is defined as individuals’ ability and capacity to meet their present needs without affecting the needs of future generations [2,3]. It is well documented that sustainable consumption (SC) is a way to attain sustainable development [4,5,6,7,8]. It is related to social and ecological aspects of the consumption, use and disposal of products. For a country to achieve a high level of sustainable development, the sustainable consumption trends demonstrated by citizens are essential [9].
The notion of SC began to receive international attention during the 1992 UN Earth Summit in Rio, which discussed the formulation of the action plan Agenda 21 [10]. After this summit, over-consumption was increasingly seen as a direct cause of environmental damage and un-sustainability. Led by pressure from environmental groups and the public, governments and companies began promoting eco-friendly consumption patterns that promote a more sustainable way of living.
In recent years, the increased environmental pollution and depletion of natural resources made consumers aware of the notion of SC [11,12,13]. Nowadays, consumers are concerned about the biodegradability of packaging, green labels, natural ingredients, organic food and so on. Such concerns show the public’s willingness to adopt a more environmentally significant consumption behaviour [14]. Consequently, concepts like “green marketing” [15], “ecological consumer” [16], “socially responsible consumer” [17]) and “ethical consumer behaviour” [18] have emerged. However, the scales to measure these constructs predominantly focus on the “behavioural” aspect and ignore other aspects, like the cognitive, affective and conative domains. Nonetheless, the behavioural aspect alone does not provide sufficient information about an individual’s firm commitment and future actions towards the environment. This view is in line with Premack and Woodruff’s [19] theory of mind (ToM), which refers to individuals’ unique understanding of their surroundings [20]. It supports the idea of considering individuals’ cognitive process in order to understand their behavioural pattern. More specifically, ToM suggests the consideration of different states of mind, namely cognitive (thinking), affective (feeling) and conative (conviction) [21].
The notion of “mindfulness” also interweaves with the “sustainable consumption” concept. It posits that individuals acquire and maintain behaviour in a unique way (i.e., emphasis on social influence and on external and internal social reinforcement) while considering the social environment in which individuals perform their behaviour [22]. It clearly suggests that when people are mindful they are more likely to seek out choices that do less harm to the natural environment, despite many real or perceived barriers to doing so. It focuses on how individuals process internal stimuli [23]. Mindful individuals are more careful about consumption, quality of life and environment [24]. Building on the notion of mindfulness, Sheth et al. [25] provided a model of mindful consumption which intends to reduce the “attitude—behaviour gap” in the context of sustainable consumption. This model suggests that mindful consumption has two core attributes: mindful mindset and mindful behaviour. By considering the ToM and mindfulness, in this study, SC is presented as a multi-dimensional construct that consists of the cognitive, affective and conative domains.
Although the concept of SC and its importance are widely mentioned in recent literature [26], there is no available scale to measure the SC construct by considering its attitudinal aspect. By addressing this, the present study conceptualises, develops, purifies and validates a multiple-item scale for measuring sustainable consumption. It is important to mention that there are scales that measure similar concepts, like “green purchase behaviour” [27], “ecological consumer behavior” [16], “environmental action” [28], “ethically minded consumer behaviour” [18] and “2pro-environmental behaviour” [29]. However, these constructs are measured solely from a behavioural perspective. As mentioned earlier, the theory of mind suggests that individuals possess different characteristics such as awareness, knowledge, preferences and convictions [30]. Based on this theory and considering the notion of “mindfulness”, it is necessary to consider the cognitive, affective and conative states of a consumer’s mind when measuring SC. Therefore, in this study, SC is conceptualised as a multi-dimensional attitudinal construct that is determined by the cognitive, affective and conative aspects of the mind.
The rest of the paper is organised as follows. In the next section, the theory of mind and its importance concerning sustainable consumption and development are discussed. The following section presents the conceptualisation of the SC construct and a discussion of its dimensions. Next, the adopted research methodology is discussed, highlighting the scale development phases, including item generation, item selection, scale purification and item validation. Two studies were carried out in this regard. Lastly, a discussion, conclusion, limitation and future research directions are presented.
2. Theoretical Basis of SC Construct
This study considers the notion of “mindfulness” and the “Theory of Mind (ToM)” as the theoretical basis. Mindfulness generates the idea that SC is a multifaceted construct, which is expected to bring coherence between attitude and behaviour [31]. Not only this, it also provides understanding of a ”mindful consumption” framework, which is developed by Sheth et al. [25]. In a similar vein, the ToM also suggests that sustainable consumption should be considered as a multi-dimensional construct by considering different mental states of an individual. A more detailed discussion is provided below.
2.1. Notion of “Mindfulness” and “Mindful Consumption”
Mindfulness is a rapidly emerging area that has inspired researchers in the area of sustainable consumption [24,25]. Fischer et al. [31] suggested it should be considered in the sustainable consumption paradigm in order to reduce the attitude–behaviour gap. In the literature, mindfulness is defined in several ways [31]. Primarily, it can be viewed from two different traditions: (i) cognitive psychological orientation [32,33] and (ii) Buddhist psychological concepts [34]. Cognitive psychologists’ definition of mindfulness focuses on one’s processing of external stimuli [23]. Kabat-Zinn [22] (p. 4) mentioned that it refers to “… paying attention in a particular way: on purpose, in the present moment, and non-judgmentally”. Built on Kabat-Zinn’s [22] definition, Shapiro et al. [35] considered it as “inherently a state of consciousness” and mentioned that it has three core elements: intention (on purpose), attention (paying attention) and attitude (in a particular way).
Rosenberg [36] stated that mindfulness allows individuals more deliberate choices by being aware of potentially accessible cognitive-behavioural processes underlying consumption that have become relatively automatic. Moreover, it is likely to instil “a sense of interconnectedness and interrelatedness between people as a genuine (or synergetic), non-consumerist satisfier of the need for fulfilment” [31] (p. 546). Researchers suggested that the persuasion of marketing tools can be reduced when individuals are more mindful, which is one of the factors that can lead them to achieve greater personal well-being and a sustainable lifestyle [36]. Moreover, mindfulness tends to positively influence consumers’ awareness of their consumption habits and strengthen non-materialistic values in life, leading to a reduced aspiration to consume [37]. This is due to the fact that mindful individuals are more apt to pay attention and intentionally process information about environmental impact [24].
It is suggested that mindfulness can reduce the “attitude–behaviour gap” in consumer behaviour research [38]. Built on the mindfulness concept, Sheth et al. [25] provided a model of “mindful consumption” which considers mindful mindset and mindful behaviour as the bases of sustainable consumption. As stated by Sheth et al. [25] (p. 27):
The mindset matters in two important ways: attitudes and values influence the choices about consumption, and they determine how the effect from consumption is interpreted, thereby increasing or decreasing the likelihood of further consumption of a related nature. To effectively deal with the problem of overconsumption, both behaviour and mindset need to change. This change can be brought about by inculcating mindful consumption.
In a nutshell, the premise of mindful consumption is individuals’ awareness in thought and behaviour about the consequences of their consumption, upon which this study is built.
2.2. Theory of Mind (TOM) and Sustainable Consumption
The theory of mind (ToM) explains how individuals perceive and interpret other peoples’ behaviour by considering their thoughts and wants [20]. It highlights a wide range of mental states, including intention, hope, expectations, imagination, desire and beliefs [19]. This theory is widely used in psychology and is believed to be useful in interpreting and explaining certain behaviours and psychological conditions [30].
Building on the ToM, concepts like trilogy of mind, tripartite model and taxonomy have emerged [39]. Studies about the trilogy of mind provide an understanding of the scope of social and cognitive knowledge characteristics of individuals [40], which are discussed in several psychological [41] as well as consumer behaviour studies [42,43]. Among the trilogy models, Hilgard’s [44] “cognition, affection and conation” received significant research attention in social science studies. Cognition is the mental state in which individuals gather knowledge about the object and become aware of it, whereas affection refers to the emotional state where individuals develop a liking/disliking or feelings towards an object. Conversely, conation is related to an individual’s intention and the probability of taking specific actions [43].
Guided by the trilogy of mind, researchers have proposed that the ability to comprehend and predict the behaviour of another person has an innate, biological, and modular basis [45]. Built on Hilgard’s [44] trilogy, Dennis et al. [39] developed a tripartite model of ToM, which is widely used in business studies to understand the different mental states of consumers [46]. In this model, Dennis et al. [39] suggested that individuals have different states of mind, such as “cognitive domain”, “affective domain” and “conative domain”. Based on such models, many researchers incorporated taxonomy with multiple mental states like cognitive, affective and conative [46,47].
In the field of consumer behaviour, this trilogy of mind is widely used. For example, Barry and Howard [21] considered the cognitive-affective-conative link in order to understand the effect of advertisement. On the other hand, Oliver [48] considered this link in order to measure consumers’ loyalty, which was widely used by other researchers, such as McMullan and Gilmore [43], Harris and Goode [42], Jones and Taylor [47] and the like. Oliver [48] suggested that the cognitive, affective and conative domains lead to a deeply held commitment, which predicts that consumers become loyal, first in a cognitive sense, then in an affective sense and later in a conative manner. In regard to sustainable consumption, these three domains are viewed as follows:
• Cognitive domain
The cognitive domain refers to individual’s awareness level, knowledge, beliefs, thoughts and attributes that he/she would associate with an object. It is the opinion or belief segment of an attitude. Past studies revealed that consumers’ awareness about green products influence their purchase decision [49,50]. The belief and knowledge about sustainability and/or environmental aspects are likely to enhance consumers’ sustainable consumption.
• Affective domain
The affective domain represents an individual’s liking, disliking and preference. It is the emotional or feeling segment of an attitude. It is evident that environmental apathy is related to consumers’ green purchase intentions [51]. In this study, it is expected that, individuals’ preference and liking towards sustainable consumption is likely to boost his/her sustainable consumption.
• Conative domain
Conation is a psychological domain of behaviour or mental processes associated with goal-directed action [52]. It refers to an individual’s commitment to invest energy in his/her work in order to reach a specific goal. It is assumed that the more an individual has the desire to behave sustainably and to care for the environment, the more he/she will consume sustainably.
3. Definition and Dimensionality of the SC Construct
3.1. Conceptualisation of the SC Construct
Scholars, policymakers and practitioners started to discuss SC in the early 1970s [53]. However, it received worldwide attention after the 1992 Rio Earth Summit and 1994 Oslo Symposium, where it was suggested that excess and wasteful consumption contributes to “unsustainability” [54] (p. 9). In this regard, SC is considered as one of the major components to overcome the challenges (e.g., optimising natural resources, climate change and environmental pollution) related to attaining a nation’s sustainability [55]. The necessity to adopt sustainable consumption in daily life is due to a responsibility to assure the wellbeing of future generations [56].
There is a lack of consensus regarding the definition of the SC construct. For example, most descriptions provided by past studies discuss sustainable consumption from the macro aspect, and the main focus is on general economic and societal issues [57]. It is also crucial to understand the concept from the consumers’ perspective. The Oslo Symposium [54] proposed the definition of sustainable consumption as “the use of goods and services that respond to basic needs and bring a better quality of life, while minimising the use of natural resources, toxic materials and emissions of waste and pollutants over the life cycle, so as not to jeopardise the needs of future generations”. By considering this definition as the basis, we conceptualise SC as follows:
Sustainable Consumption is an individual’s cognitive, affective and conative traits in relation to avoiding extravagant purchases, and the rational use of goods and services to satisfy basic needs. SC exhibits care for the environment by managing existing resources in a way that meets current demands but does not jeopardise the needs of future generations.
3.2. Dimensionality of the SC Construct
SC is a multi-dimensional construct which includes the cognitive, affective and conative domains. Table 1 provides the definitions of each dimension. The cognitive domain of the SC refers to an individual’s belief about sustainable consumption and the potential outcomes of consumption. The affective domain of the SC represents the feelings towards the concept of SC. The conative aspect of SC considers the intention to practice good habits due to the environment, natural resources, quality of life and care for the future generation. It is also related to the willingness to continue such habits on a long-term basis.

Table 1.
Proposed dimensions of the sustainable consumption (SC) construct.
4. Research Methodology
To understand the notion of SC, relevant articles were reviewed from ScienceDirect, Emerald, Sage, Taylor & Francis and ProQuest. The keywords used to search the articles included “sustainable consumption”, “sustainable development”, “green consumption”, “pro-environmental behaviour”, “socially conscious purchasing” and the like. The search result yielded 111 articles, among which 73 were relevant. A cursory review of the materials revealed that research on SC is still at an early stage. Although several studies discuss SC, most are at a conceptual level. Therefore, further empirical research is needed because there is no readily available scale to measure the SC construct exclusively.
Some scales measure constructs like ecological behaviour [16], green purchase behaviour [27], pro-environmental behaviour [29], ecological citizenship [58] and ethically minded consumer behaviour [18]. However, the SC scale in this research differs from previous ones in three main ways:
- First, most measures considered either the behavioural aspect [16,27] or the cognitive aspect [18,59]. However, the SC scale in this study considers other important aspects of the mind: cognition, affection and conation.
- Second, most prior scales viewed the construct as uni-dimensional, whereas the scale used in this study is multi-dimensional, with three facets.
- Third, many scales do not provide a proper theoretical basis (e.g., environmental knowledge scale, conscious for sustainability consumption scale), whereas some other scales focus on attitude-behaviour gap/relationship (e.g., ethically minded consumer behaviour scale, ecological behaviour scale, green purchase behaviour scale). The attitude-behaviour gap provides the understanding that a positive attitude does not always materialise in action. It is also argued that behaviour alone cannot give a proper understanding of firm commitment, psychological attachment and future motives [60]. Therefore, it is crucial to understand the mental process of observing human behaviour. This study uses the ToM and the notion of mindfulness as the basis for developing the scale.
The scale was adapted following Churchill’s [61] suggestions for the scale development process. Figure 1 provides a thorough description of the process that was followed when developing the scale.
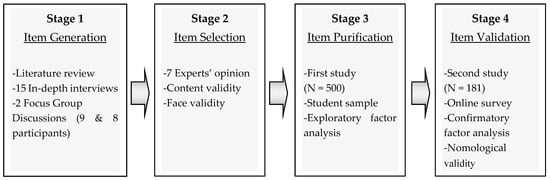
Figure 1.
The process followed in this study.
4.1. Item Generation
According to Hinkin [62], two major methods can be used to generate items, i.e., deductive and inductive. The deductive approach requires an extensive analysis of the literature and a strong understanding of the construct, whereas an inductive approach means that items are generated based on respondents providing descriptions relevant to the studied construct. This study uses both methods to create items to measure SC.
After a comprehensive review of the literature, an initial item pool was generated. Since the concept of SC is multi-dimensional, three subsets of items were developed to tap each of the three dimensions of the construct: cognitive, affective and conative. The inductive approach contained two focus group discussions (FGD) and 15 in-depth interviews in order to conceptualise SC, to reveal dimensions not included in the literature and to generate more items of SC [63]. It is suggested that the qualitative method is the best one to provide insights and to explore new ideas [64]. Furthermore, both approaches have been widely used in marketing research since the 1980s [65], particularly in the field of consumer behaviour [66].
In this study, the two FGDs contained eight and nine participants, respectively, as suggested by Cooper and Schindler [66]. The profiles of the participants of FGDs and 15 in-depth interviews are shown in Table 2.
Table 2.
Respondents’ demographic profile for four focus groups and three in-depth interviews.
Participants in the first FGD were post-graduate students from a public university. Post-graduate students were invited due to their understanding of sustainable consumption, and also for the convenience in contacting them, since they were studying in the same university as the researchers. All eight participants mentioned that they have a sustainable consumption behaviour. For example, they recycle the food container whenever possible, turn off the lights and the fan after use, close the tap after consuming the water, avoid using plastic bags, re-use newspapers, etc.
The second focus group consisted of nine research officers from a well-known research institute. The nine researchers were involved in a “green food marketing research project”, so it was expected that they would provide better insights into the phenomenon. All of them considered themselves as sustainable consumers. The selection of homogenous focus group participants is consistent with suggestions made by Malhotra et al. [64]. Particularly, Malhotra et al. [64] argued that the homogeneity of respondents for focus groups is important because: individuals are more likely to participate and communicate, feel greater self-esteem and less anxiety, be more supportive and trusting of other members and be more efficient in accomplishing the group’s goals. In addition, homogenous respondents enable the researcher to make a more accurate theoretical prediction [64].
In regard to the 15 in-depth interviews, snowball sampling was used to identify sustainable consumers to take part in the interview sessions. As such, the participants’ profession varied from executive, manager and university lecturer to technician and housewife. All participants were contacted through emails and phone calls. In the emails, the purpose of the interview was explained, and it was mentioned that the participation in the interview session was voluntary. It was also stated that practising sustainable consumption behaviour was necessary to take part in the interview. With the respondents’ consent, all interviews were tape-recorded. Next, transcriptions were prepared for the two FGDs as well as 15 in-depth interviews. To ascertain the reliability of the collected information, the participants reviewed all transcripts. Before moving to the next step, a thorough review was carried out to finalise the items based on the transcriptions. In total, 105 items were generated from the FGD and in-depth interviews.
4.2. Item Selection
In the next stage, content validity was performed to understand whether the initial pool of items accurately reflected the SC construct [67]. In this regard, seven experts were chosen due to their expertise in the subject matter. Five experts were university lecturers, and two were from a research institute. All five lecturers were specialised in consumer studies, and three of them specialised in green marketing. The other two experts were researchers in a well-known research institute and had experience in dealing with green agricultural products.
After receiving the feedback from seven experts, 24 items were deleted, which left 81 items to use for the next stage. After the content validity was assured, face validity was assessed by distributing the preliminary questionnaire to 15 post-graduate students. The purpose was to check the questionnaire for timing, wording, comprehension, clarity, completeness and flow of control [67]. In addition, respondents were asked to provide their feedback regarding the content, structure and formatting of the questionnaire [67]. Minor suggestions from respondents were considered, which helped to improve the clarity and readability of the questionnaire.
4.3. Item Purification
The first study was carried out to refine the SC scale. A questionnaire was developed and distributed based on the 81 items that were retained after the validity assessment and distributed to a sample of students at the university level. Considering university students for the first study is justified, since employing university students is a common practice in consumer studies [68]. Ok et al. [69] suggested that the choice of students as respondents is justified because they act as surrogates for other consumers. Some researchers argue that responses generated by students are not significantly different from those from other groups of consumers [70,71]. Students are “real life consumers” of many sustainable products and services, and they are familiar with the present research agenda. Therefore, the choice of students as the subjects of this study is justifiable.
Around 1000 questionnaires were distributed in 13 Malaysian universities, among which 522 questionnaires were returned and 500 cases were considered usable. Twenty-two cases were deleted due to missing values (13 cases), random answers (6) and outliers (3). The required sample size to run EFA in this study was decided based on Hair et al.’s [72] recommendation, i.e., to have at least five times as many observations as there are items to be analysed. The total number of items was 81. Thus, the sample size (81 × 5 = 405) for the first study was sufficient to run the EFA.
4.4. Factor Structure Using EFA
The objective of the EFA was to extract the factor structure and also to reduce the number of items for the SC construct. Using SPSS 24.0 factors were extracted using principal component analysis with varimax and the Kaiser normalisation and rotational method [73]. The results confirmed the existence of three factors associated with the proposed theoretical arguments of this study. The selection of the extracted factors was decided based on different criteria, i.e., only factors with an eigenvalue greater than 1 and items that had a factor loading of more than 0.50 were retained [72]. Furthermore, cross loading on two or more factors was deleted along with low communalities of less than 0.50 [73].
The three extracted factors explained 72.20% of the total variance with an eigenvalue greater than 1. The Kaiser–Meyer–Olkin (KMO) was 0.938, indicating acceptable sampling adequacy, and Bartlett’s Test of Sphericity of 3025.080 (p < 0.001) was also significant. Based on the interpretation of the items, the factors were classified as cognitive domain of SC (factor 1), affective domain of SC (factor 2) and conative domain of SC (factor 3). All items loaded on these three factors ranged between 0.646 and 0.791 and were proven to have a well-defined factor structure. Among the newly extracted three factors, the first-factor consisted of six items (Cognitive), the second factor consisted of seven items (affective) and the third factor (Conative) had eight items (Table 3). The Cronbach’s alpha coefficient for these three factors was 0.918, 0.907 and 0.901, respectively (see Table 3).
Table 3.
Results of Exploratory Factor Analysis (EFA) on sustainable consumption construct.
4.5. Reflective and Formative Measurement Model
The relationship between a construct and its relevant items represents the measurement model. The measurement model can be reflective (where the construct determines the items) or formative (where the items cause the construct) [74]. To identify the relationship between a construct and its underlying items, it is vital to have a clear conceptual definition for the construct and to generate items that can tap the construct of interest [75]. Additionally, Jarvis et al. [76] developed different criteria that can help to identify the relationship between the construct and its indicators. Specifically, the direction of causality for reflective models starts at the construct and ends at the items, which means each item is a reflection of the whole construct. In contrast, for formative models, the causality begins at the items and ends at the construct, which means all items that measure a specific construct are defining characteristics of the construct. Regarding the interchangeability of the measures, for reflective models, the items usually have a similar theme because they stem from the same domain. Hence, removing an item does not change the conceptual definition of the construct. However, formative constructs’ measures do not share similar themes, and each measure captures different aspects of the construct. Therefore, it is unique and not interchangeable, and dropping an item will affect the conceptual meaning of the formative construct. The reflective model’s items are expected to be highly correlated because they measure the same underlying construct, whereas items of the formative construct are not expected to be highly correlated.
In this study, the measurement model that reflects the relationship between SC and its cognitive, affective and conative subscales, and between subscales and its respective indicators, were identified as reflective–formative. Notably, at the first order, the direction of causality can be viewed from subscale to indicators. Indicators are expected to be interchangeable and correlated, so dropping an item will not affect the meaning of the subscale. For example, Con2: “I intend to reduce the misuse of goods and services (e.g., I switch off the light and the fan when I am not in the room)”, Con3: “I will continue to purchase environmentally friendly products even though they are slightly expensive” and Con4: “I will keep contributing to environmental welfare in all respects” are highly correlated, and dropping one of these items does not affect the results. In the same manner, the explanation applies to other subscales and their relevant indicators.
At the second order, the three subscales (cognitive, affective and conative) are distinct constructs because they possess different conceptualisations. Therefore, these constructs are not expected to be highly correlated or interchangeable. Moreover, dropping one of these constructs would change the conceptual meaning of SC. This indicates that the direction of causality should flow from the first order to the second order. Therefore, this study proposes that the three first-order constructs (cognitive, affective and conative) form the second order (SC), based on the formative measurement model.
4.6. Item Validation
In order to validate the newly developed SC scale, the second study was conducted. In this regard, data were collected via an online survey. A Google form was produced for this purpose. The purified questionnaire was distributed via email and Facebook and yielded 181 usable responses. The respondents were real life consumers. The minimum sample size required for CFA was decided based on power analysis using G power [77]. The results indicated that a sample size of 125 is necessary to achieve a statistical power greater than 0.80, R2 greater than 0.10 and effect size greater than 0.15. The profile of the two samples (study 1 and study 2) is shown in Table 4.
Table 4.
Profile of the two samples.
Several steps were carried out to assure the reliability and validity of the scale. The tests performed to purify the scale are shown in Figure 2.
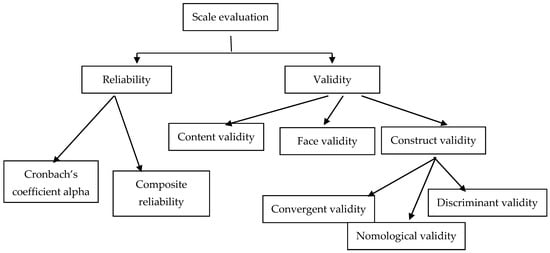
Figure 2.
Scale evaluation techniques utilised in the present study.
4.7. Confirmatory Composite Analysis (CCA)
To estimate the reliability and validly of the measurement model at the first and second orders, and to examine the nomological validity of the structural model, Partial Least Squares (PLS) were employed. The use of PLS was in line with the objective of the study, which is to develop and test the theoretical model through explanation and prediction [78]. Moreover, PLS can evaluate higher-order constructs by eliminating the uncertainty of inadmissible solutions [79]. In addition, PLS support exploratory research [78]. Furthermore, PLS-SEM leads to greater theoretical parsimony and reduced complexity when estimating the hierarchical model [74]. Additionally, PLS help to avoid limitations related to distributional properties, measurement level, sample size and model complexity [78]. Most importable PLS can handle the formative measurement mode [78].
PLS-SEM is a composite-based approach regardless of measurement model identification [80]. Composite measurement considers manifest variables and unobserved variables as composites [80]. PLS-SEM combined indicators linearly to form a composite construct, which is viewed as a proxy of the concepts it will examine [80]. Therefore, PLS-SEM is referred to as confirmatory composite analysis (CCA) [81]. Compared to CFA, CCA has several advantages: (i) the number of items retained to measure the construct is higher with CCA, thereby enhancing content validity, convergent validity and discriminate validity, (ii) latent variable scores for each construct are available [82], (iii) CCF can handle both the formative and reflective models [83].
Smart PLS3.0 [84] was used to estimate the model with a path weighting scheme for the inside approximation. Based on the suggested guidelines on hierarchical modelling [85,86], the study used PLS-SEM to estimate the second-order formative SC model. This study evaluates the first-order model at an early stage in terms of indicator reliability, construct reliability, convergent validity and discriminate validity. In the next stage, the second order was assessed in terms of convergent validity, multicollinearity, significance and relevance of factor weight.
a. Assessment of first order
To assess the first-order constructs, a PLS algorithm with factor weighting scheme and 300 iterations were run to generate the values of factor loadings, composite reliability (CR), Cronbach alpha (CA) and average variance extract (AVE) [87]. Factor loading is a measure of reliability, which indicates the absolute correlation between a construct and each of its indicator variables [61]. According to Hair et al. [75], the loading of each indicator on its respected construct should be higher than 0.70. In contrast, loadings less than 0.40 should be removed [88]. Loadings between 0.4 and 0.7 can be removed if they result in a significant increase in CR and AVE, above the cut-off value of 0.70 and 0.50, respectively [75]. Moreover, composite reliability (CR), Cronbach alpha (CA) and Dijkstra and Henseler’s PA are the measures of internal consistency reliability and refer to the extent to which a construct is measured by its relevant indicators [89]. As shown in Table 5, the factor loadings of all observed variables exceeded the threshold value of 0.70. Moreover, the CR, CA and Dijkstra and Henseler reliability for all latent variables surpassed the cut-off value of 0.70. Thus, the reliability of all measures was assured at the item and construct level.
Table 5.
Measurement model at the first order.
The assessment of construct validity was confirmed based on convergent validity and discriminant validity [90]. Convergent validity refers to the extent to which a set of indicators that measure the same construct are positively correlated [91]. The dominant measure of convergent validity is the AVE [92]. An AVE value greater than 0.50 is considered as acceptable [75]. As demonstrated in Table 5, AVE values for all constructs transcended the advised value of 0.50. Thus, convergent validity was assured.
Discriminate validity refers to the extent to which a construct has exclusive attributes that make it different from other constructs in the model [75]. Two criteria are suggested to assess discriminant validity, i.e., the Fornell–Larcker criteria, developed by Fornell and Larcker [92], and the heterotrait-monotrait ratio of correlation (HTMT), proposed by Henseler et al. [93]. According to the first criteria, the square root of AVE should be higher than the correlation with all other variables in the model. Table 6 revealed that the diagonal values (square root of AVE) are higher than the off-diagonal values (correlation with other variables). On the other hand, the second criteria estimate the factor correlation, and the HTMT values should be less than 1 for all factors. As shown in Table 7, the HTMT values of all constructs are less than 0.85, as recommended by Henseler et al. [93]. In addition, the bootstrapping procedure with 5000 samples is performed to demonstrate additional evidence that all HTMT values are significantly different from 1 [93]. The output reveals that none of the HTMT confidence intervals includes the value of 1, and thus convergent validity was established for all factors.
Table 6.
Fornell–Larcker criteria.
Table 7.
HTMT.
To test the overall model fit, the standardised root mean squared residual (SRMR) [94] that quantifies how strongly the empirical correlation matrix differs from the model-implied correlation matrix was used. The lower the SRMR, the better the theoretical model’s fit. A value of 0 for the SRMR would indicate a perfect fit and, generally, an SRMR value less than 0.08 indicates an acceptable fit [95]. In this study, the SRMR was 0.063, indicating an acceptable model fit.
b. Assessment of the second order
To establish the reflective–formative higher-order construct of SC, this study used the repeated indicator approach as advised by Becker et al. [85] (Figure 3). The affective, cognitive and conative constructs represent the lower-order of the more general higher-order SC construct. All indicators that used to measure the lower-order constructs were assigned simultaneously to identify the higher-order SC construct. To confirm the measurement model for the second-order formative construct, this study followed the procedures suggested by Hair et al. [83]. In the first step, the higher-order convergent validity was assessed using a redundancy analysis [96] in which the higher-order construct of SC was correlated with a global single-item measurement of SC. The result of the redundancy analysis yielded a path coefficient of 0.825 between the higher-order and the single-item measure of SC. This result confirmed the convergent validity of the higher-order construct of SC. Next, the potential collinearity between the lower-order components of SC was checked. As shown in Table 8, the variance inflation factor (VIF) values for the cognitive, conative and affective dimensions were less than 3, indicating that collinearity was not an issue [83]. Next, bootstrapping procedures with 5000 re-sample and no sign change were ran to assess the significance and relevance of the relationships between lower-order components and their higher-order components. As shown in Table 8, the outer weight for the cognitive, conative and affective dimensions was significant at p > 0.05, with factor weights of 0.0.38, 0.338 and 0. 397 for the affective, cognitive and conative dimensions, respectively. This reveals that the first-order construct significantly explains the second-order SC construct. Thus, the measurement model for the second-order formative SC was established.
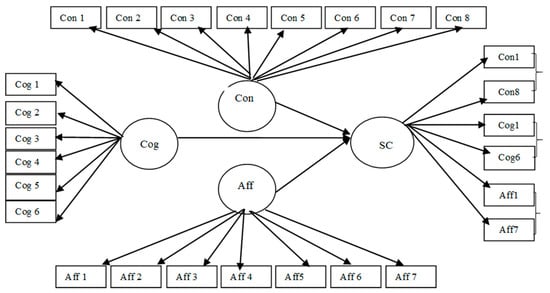
Figure 3.
Measurement model notes: Cog—Cognitive; Con—Conative; Aff—Affective; SC—Sustainable consumption.
Table 8.
Evaluation measurement model at the second order.
4.8. Assessing Nomological and Predictive Validity
In assessing nomological validity, this study examines the relationship between the newly developed SC construct and environmental activism (see Figure 4). Environmental activism is as important as sustainable consumption [29]. It is regarded as the function of pro-environmental behaviour [97]. By considering the theory of motivation [98], this study postulates that SC has a positive influence on environmental activism behaviour. By utilising the theory of motivation, Pelletier et al. [99] found that the “motivation towards environment” is positively correlated with recycling and reuse behaviour and also with environmental activism. Therefore, this study postulates that sustainable consumption is positively correlated with environmental activism, and thus the following hypothesis was proposed:
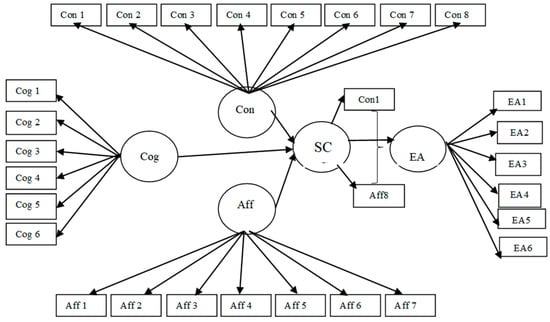
Figure 4.
Structural model notes: Cog—Cognitive; Con—Conative; Aff—Affective; SC—Sustainable consumption; EA—Environmental action.
Hypothesis 1 (H1).
SC significantly and positively affects environmental activism.
a. The output of nomological validity
The nomological validity of the SC construct was tested by predicting its relationship with environmental activism. The reliability and validity of environmental activism was confirmed through the values of the factor loadings, AVE, CR and CA that exceeded the recommended values of 0.70, 0.50, 0.70, and 0.80, respectively (see Table 6). The structural model that represents the relationship between the constructs was assessed using PLS bootstrapping with 5000 resamples to generate the values of path coefficient and their significant level. The results reveal that SC exerts a positive and significant effect on environmental activism (β = 0.614, p >0.01), and explained 37.7 percent of its variance. This provides support for H1. This result confirmed the impact of sustainable consumption on environmental activism, thus ensuring nomological validity.
b. The output of predictive validity
This research utilised Stone–Geisser’s Q2 method to test the predictive validity. Blindfolding procedures were used and generated a Q2 value greater than zero for EA, which confirmed the predictive validity of the model [100]. In addition, PLS-predict was carried out to evaluate the out-of-sample predictive power of the model. The guidelines proposed by Shmueli et al. [101] were followed, and, to evaluate the result, the Mean Absolute Error (MAE) values for the PLS and the Liner Model (LM), as well as the Q2-predcit values, for the PLS model were focused. The result illustrated in Table 9 shows that all Q2-predict values of the indicators of environmental activism were positive. With respect to MAE values, the results reveal that none of the items of environmental activism in the PLS-SEM analysis produced greater prediction errors compared to the LM benchmark, indicating a high out-of-sample predictive power. The validated scale to measure the SC construct is shown in Appendix A.
Table 9.
Partial Least Squares (PLS)-predict results based on the assessment of the Mean Absolute Error (MAE) values.
5. Discussion and Implications
This research develops and validates a new attitudinal scale of SC with satisfactory psychometric properties. The scale was developed using an organised and systematic procedure recommended by Churchill [61]. The scale is based on the “theory of mind” and the notion of “mindfulness”. The complete process comprises two different samples at distinct stages: study 1, to extract the factor structure, and study 2, to validate the purified scale. This study contributes to the existing body of knowledge about sustainable consumption measures by identifying the construct of SC, suggesting a new taxonomy, generating indicators for each of the three categories and empirically testing the reliability and validity of the subscales. The adapted SC is a three-dimensional construct with 21 items and 5-response choices.
The results provide evidence of the dimensionality, reliability and validity of the scale. At the first order, the three subscales achieved a satisfactory level in terms of composite reliability, Cronbach alpha, factor loadings, AVE and HTMT values, which confirms the authenticity of the reflective model. At the second order, the SC construct also achieved acceptable values for VIF, and significant values for factor weight, thereby endorsing the formative model of SC at the second order. Consequently, the theoretical and empirical evidence supports the arguments presented in this study, i.e., SC is a higher-order multi-dimensional latent construct in the form of a reflective-formative type B model. This study also confirms the nomological validity of the higher model by showing a strong and positive effect of SC with environmental activism.
5.1. Theoretical Implications
This is a pioneer research that conceptualises, develops and validates a multi-dimensional scale to measure consumers’ propensity for sustainable consumption. The ToM and notion of mindfulness provide the basis on which the multi-dimensional scale of SC is developed. By doing this, this study contributes to the existing ToM and mindfulness literature. Furthermore, this study improves the conceptual definition of SC by considering three major states of mind. The findings support the taxonomy that suggests considering cognitive, affective and conative aspects of the human mind. The theory of mind focuses on the ability to attribute mental states, beliefs, intents, desires, emotions and knowledge. At least three states appear to be basic, which is referred to as a trilogy of mind: cognition, affection and conation. The scale promotes the idea that individuals go through different stages of attitudinal and cognitive states before they take action. Additionally, this research has confirmed the usability of ToM and the notion of mindfulness, that have been developed in Western culture, to explain consumer attitudes in Eastern culture. This can open a new avenue for researchers from Asia and developing contexts to use these theories in their consumer studies.
5.2. Methodological and Practical Implications
This research developed a new scale that other researchers can use to measure the SC construct and to carry out future empirical investigations. Moreover, this study employed two approaches, i.e., a deductive and an inductive approach to develop and validate this new attitudinal scale from a consumer perspective. The rigorous procedures implemented in this research can be adapted to create new scales, especially in consumer behaviour studies. Additionally, assessing the second-order formative construct of sustainable consumption enables researchers to conduct empirical studies based on the formative measurement theory. This scale may assist policy makers and social marketers to understand consumers’ attitudinal aspects of sustainable consumption. It can help to understand a consumer’s perception, knowledge and intentions towards SC. Furthermore, the SC scale can be used to understand consumer differences and assist in segmentation.
Companies are under pressure to meet sustainability expectations, and many are trying to incorporate sustainability in their activities to improve their image and reduce their environmental impact. This research helps these companies to understand the facets that contribute to sustainable consumption in specific market segments. Similarly, the social marketers who want to instil a sustainability mindset and encourage people to act sustainably can also utilise the findings of this study.
The SC scale in this study suggests that consumers’ attitudinal, cognitive and conative facets are equally important when considering marketing strategies. Furthermore, studies on sustainable consumption help to understand consumer motivation and promote more sustainable consumption trends.
6. Limitations and Future Research Directions
This research has some limitations that could be explored in future research. First, this study considered Malaysian consumers, while cross-national settings could increase the generalisability of the scale. Hopefully, this scale will stimulate and facilitate more research on SC and assist social marketers in assessing and improving the sustainability of consumption. Moreover, this study uses a cross-sectional method for data collection. Future research could employ a longitudinal study to enhance the understating of sustainable consumption from a consumer perspective at different points in time and solve the issue of causality.
Author Contributions
Conceptualisation and literature review, F.Q.; methodology, analysis and investigation, J.M.; writing—original draft preparation, F.Q. and J.M.; writing—review and editing, J.M. and F.Q.; supervision and project administration, J.M. All authors have read and agreed to the published version of the manuscript.
Funding
This research received no external funding.
Conflicts of Interest
The authors declare no conflict of interest.
Appendix A
Table A1.
Finalised SC scale.
Table A1.
Finalised SC scale.
| Sustainable Consumption | |
|---|---|
| Cognitive SC | Cog1. I believe wasting food and other consumables is unethical. |
| Cog2. I am aware that excess consumption can cause a shortage of natural resources. | |
| Cog3. I believe that it is important to use eco-friendly products and services. | |
| Cog4. I believe that individuals should care for the future generation. | |
| Cog5. I believe that it is our responsibility to care for the natural environment. | |
| Cog6. I know that natural resources decreasing at an alarming rate. | |
| Affective SC | Affec1. I feel good when I can control my whims for buying unnecessary things. |
| Aaffec2. I don’t like to waste food or beverage. | |
| Affec3. I prefer to buy organic food, since it is environmentally friendly. | |
| Affec4. I prefer to pay more to purchase environmentally friendly products. | |
| Affec5. I prefer to use paper bags, since they are biodegradable. | |
| Affec6. I like to purchase only what I need. | |
| Affec7. I feel happy to give priority to environmental welfare. | |
| Conative SC | Con1 I intend to reduce the misuse of goods and services (e.g., I switch off the lights and the fan when I am not in the room). |
| Con2. I will continue to purchase environmentally friendly products even though they are slightly expensive. | |
| Con3. I will avoid consumption activities that can lead to environmental pollution. | |
| Con4. I will continue to purchase biodegradable packages (e.g., use of paper bag instead of plastic bag). | |
| Con5. I will keep trying not to waste my food and beverage. | |
| Con6. I will spend my money wisely in order to avoid wastage and excessive purchases. | |
| Con7. I will keep contributing to environmental welfare in all respects. | |
| Con8. I will not engage in any purchase that can have a negative effect on the environment. | |
References
- Nkamnebe, A.D. Sustainability marketing in the emerging markets: Imperatives, challenges, and agenda setting. Int. J. Emerg. Mark. 2011, 6, 217–232. [Google Scholar] [CrossRef]
- Kates, R.W.; Parris, T.M.; Leiserowitz, A.A. What is sustainable development? Goals, indicators, values, and practice. Environ. Sci. Policy Sustain. Dev. 2005, 47, 8–21. [Google Scholar]
- World Commission on Environment and Development (WCED). Our Common Future; Oxford University Press: New York, NY, USA, 2007. [Google Scholar]
- Peattie, K.; Collins, A. Guest editorial: Perspectives on sustainable consumption. Int. J. Consum. 2009, 33, 107–112. [Google Scholar]
- UNEP. Education for Sustainable Consumption (ESC). Available online: https://en.unesco.org/greencitizens/stories/education-sustainable-consumption (accessed on 31 May 2019).
- Zhang, Y.; Chabay, I. How “green knowledge” influences sustainability through behavior change: Theory and policy implications. Sustainability 2020, 12, 6448. [Google Scholar] [CrossRef]
- Hansen, K.V.; Derdowski, L.A. Sustainable food consumption in nursing homes: Less food waste with the right plate color? Sustainability 2020, 12, 6525. [Google Scholar] [CrossRef]
- Quoquab, F.; Jaini, A.; Mohammad, J. Does it matter who exhibits more green purchase behavior of cosmetic products in Asian culture? A multi-group analysis approach. Int. J. Environ. Res. Public Health 2020, 17, 5258. [Google Scholar] [CrossRef]
- Quoquab, F.; Mohammad, J. Managing sustainable consumption: Is it a problem or panacea? In Sustainable Economic Development; World Sustainability Series; Springer: Hamburg, Germany, 2017; Chapter 7; pp. 115–125. [Google Scholar]
- Black, I. Sustainability through anti-consumption. J. Consum. Behav. 2010, 9, 403–411. [Google Scholar] [CrossRef]
- Banytė, J.; Šalčiuvienė, L.; Dovalienė, A.; Piligrimienė, Ž.; Sroka, W. Sustainable consumption behavior at home and in the workplace: Avenues for innovative solutions. Sustainability 2020, 12, 6564. [Google Scholar] [CrossRef]
- Chua, K.; Quoquab, F.; Mohammad, J. Factors affecting environmental citizenship behaviour: An empirical investigation in Malaysian paddy industry. Asia Pac. J. Mark. Logist. 2020, 32, 86–104. [Google Scholar] [CrossRef]
- Lee, K.M. Predictors of sustainable consumption among young educated consumers in Hong Kong. J. Int. Consum. Mark. 2014, 26, 217–238. [Google Scholar] [CrossRef]
- Stern, P.C. Toward a coherent theory of environmentally significant behavior. J. Soc. Issues 2000, 56, 407–424. [Google Scholar] [CrossRef]
- Kinoti, M.W. Green marketing Intervention strategies and sustainable development: A conceptual paper. Int. J. Bus. Soc. Sci. 2011, 2, 263–273. [Google Scholar]
- Fraj, E.; Martinez, E. Ecological consumer behaviour: An empirical analysis. Int. J. Consum. Stud. 2006, 3, 26–33. [Google Scholar] [CrossRef]
- Johnson, O.; Chattaraman, V. Conceptualization and measurement of millennial’s social signalling and self-signalling for socially responsible consumption. J. Consum. Behav. 2018, 18, 32–42. [Google Scholar] [CrossRef]
- Sudbury-Riley, L.; Kohlbacher, F. Ethically minded consumer behavior: Scale review, development, and validation. J. Bus. Res. 2016, 69, 2697–2710. [Google Scholar] [CrossRef]
- Premack, D.; Woodruff’, G. Does the chimpanzee have a theory of mind? Behav. Brain Sci. 1978, 1, 515–526. [Google Scholar] [CrossRef]
- Astington, J.; Edward, M. The Development of Theory of Mind in Early Childhood. Encyclopaedia on Early Childhood Development (Online). 2010. Available online: http://www.child-encyclopedia.com/social-cognition/according-experts/development-theory-mind-early-childhood (accessed on 21 October 2018).
- Barry, T.E.; Howard, D.J. A review and critique of the hierarchy of effects in advertising. Int. J. Advert. 1990, 9, 121–135. [Google Scholar] [CrossRef]
- Kabat-Zinn, J. Wherever You Go, There You Are: Mindfulness Meditation in Everyday Life; Hyperion: New York, NY, USA, 1994. [Google Scholar]
- Langer, E.J. Mindfulness; Addison-Wesley: Reading, MA, USA, 1989. [Google Scholar]
- Amel, E.L.; Manning, C.M.; Scott, B.A. Mindfulness and sustainable behavior: Pondering attention and awareness as means for increasing green behavior. Ecopsychology 2009, 1, 14–25. [Google Scholar] [CrossRef]
- Sheth, J.; Sethia, N.K.; Srinivas, S. Mindful consumption: A customer-centric approach to sustainability. J. Acad. Mark. Sci. 2011, 39, 21–39. [Google Scholar] [CrossRef]
- Johnstone, L.; Lindh, C. The sustainability-age dilemma: A theory of (un)planned behaviour via influencers. J. Consum. Behav. 2017, 17, 127–129. [Google Scholar] [CrossRef]
- Uddin, S.M.F.; Khan, M.N. Exploring green purchasing behavior of young urban consumers: Empirical evidences from India. South Asian J. Glob. Bus. Res. 2016, 5, 2–31. [Google Scholar]
- Alisat, S.; Reimer, M. The environmental action scale: Development and psychometric evaluation. J. Environ. Psychol. 2015, 43, 13–23. [Google Scholar] [CrossRef]
- Dono, J.; Webb, W.; Richardson, B. The relationship between environmental activism, pro-environmental behavior and social identity. J. Environ. Psychol. 2010, 30, 178–186. [Google Scholar] [CrossRef]
- Leslie, A.M. Theory of mind. In International Encyclopedia of the Social & Behavioral Sciences Pages; Elsevier: New York, NY, USA, 2010; pp. 15652–15656. [Google Scholar]
- Fischer, D.; Stanszus, L.; Geiger, S.; Grossman, P.; Schrader, U. Mindfulness and sustainable consumption: A systematic literature review of research approaches and findings. J. Clean. Prod. 2017, 162, 544–558. [Google Scholar] [CrossRef]
- Kabat-Zinn, J. Mindfulness-based interventions in context: Past, Present, Future. Clin. Psychol. 2003, 10, 144–156. [Google Scholar] [CrossRef]
- Langer, E.J.; Moldoveanu, M. The construct of mindfulness. J. Soc. Issues 2000, 56, 1–9. [Google Scholar] [CrossRef]
- Grossman, P. Mindfulness: Awareness informed by an embodied ethic. Mindfulness 2015, 6, 17–22. [Google Scholar] [CrossRef]
- Shapiro, S.L.; Carlson, L.E.; Astin, J.A.; Freedman, B. Mechanisms of Mindfulness. J. Clin. Psychol. 2006, 62, 373–386. [Google Scholar] [CrossRef]
- Rosenberg, E.L. Mindfulness and consumerism. In Psychology and Consumer Culture: The Struggle for a Good Life in a Materialistic World; Kasser, T., Kanner, A.D., Eds.; American Psychological Association: Washington, DC, USA, 2005. [Google Scholar]
- Bahl, S.; Milne, G.R.; Ross, S.M.; Mick, D.G.; Grier, S.A.; Chugani, S.K.; Chan, S.; Gould, S.J.; Cho, Y.-N.; Dorsey, J.D.; et al. Mindfulness, the transformative potential for consumer, societal, and environmental well-being. J. Public Policy Mark. 2016, 35, 198–210. [Google Scholar] [CrossRef]
- Chatzisarantis, N.L.D.; Hagger, M.S. Mindfulness and the intention-behavior relationship within the theory of planned behavior. Personal. Soc. Psychol. Bull. 2007, 33, 663–676. [Google Scholar] [CrossRef]
- Dennis, M.; Simic, N.; Bigler, E.D.; Abildskov, T.; Agostino, A.; Taylor, H.G.; Rubin, K.; Vannatta, K.; Gerhardt, C.A.; Stancin, T.; et al. Cognitive, affective, and conative theory of mind (ToM) in children with traumatic brain injury. Dev. Cogn. Neurosci. 2013, 5, 25–39. [Google Scholar] [CrossRef] [PubMed]
- Taylor, M. A theory of mind perspective on social cognitive development. In Perceptual and Cognitive Development; Gelman, R., Au, T.K.-F., Eds.; Academic Press: Cambridge, MA, USA, 1996; Chapter 9; pp. 283–329. [Google Scholar]
- Mayer, J.D.; Chabot, H.F.; Carlsmith, K.M. Advances in Psychology; Elsevier Science: Amsterdam, The Netherlands, 1997; Volume 124, pp. 31–63. [Google Scholar]
- Harris, L.C.; Goode, M.H. The four levels of loyalty and the pivotal role of trust: A study of online service dynamics. J. Retail. 2004, 80, 139–158. [Google Scholar] [CrossRef]
- McMullan, R.; Gilmore, A. The conceptual development of customer loyalty measurement: A proposed scale. J. Target. Meas. Anal. Mark. 2003, 11, 230–243. [Google Scholar] [CrossRef]
- Hilgard, E.R. The trilogy of mind: Cognition, affection, and conation. J. Hist. Behav. Sci. 1980, 6, 107–117. [Google Scholar] [CrossRef]
- Leslie, A.M.; Frith, U. Autistic children’s understanding of seeing, knowing, and believing. Br. J. Dev. Psychol. 1988, 6, 315–324. [Google Scholar] [CrossRef]
- Kurczewska, A.; Kyro, P.; Lagus, K.; Kohonen, O.; Lindh-Knuutila, T. The interplay between cognitive, conative, and affective constructs along the entrepreneurial learning process. Educ. Train. 2017, 60, 891–901. [Google Scholar] [CrossRef]
- Jones, T.; Taylor, S.F. The conceptual domain of service loyalty: How many dimensions? J. Serv. Mark. 2007, 21, 36–51. [Google Scholar] [CrossRef]
- Oliver, R. Whence consumer loyalty. J. Mark. 1999, 63, 33–44. [Google Scholar] [CrossRef]
- Sasmita, J.; Suki, N.M. Young consumers’ insights on brand equity: Effects of brand association, brand loyalty, brand awareness, and brand image. Int. J. Retail. Distrib. Manag. 2015, 43, 276–292. [Google Scholar] [CrossRef]
- Yu, Y.; Han, X.; Hu, G. Optimal production for manufacturers considering consumer environmental awareness and green subsidies. Int. J. Prod. Econ. 2016, 182, 397–408. [Google Scholar] [CrossRef]
- Rana, J.; Paul, J. Consumer behavior and purchase intention for organic food: A review and research agenda. J. Retail. Consum. Serv. 2017, 38, 157–165. [Google Scholar] [CrossRef]
- Atman, K. The role of conation (striving) in the distance education enterprise. Am. J. Distance Educ. 1987, 1, 14–24. [Google Scholar] [CrossRef]
- Holt, D.B. Constructing sustainable consumption from ethical values to the cultural transformation of unsustainable markets. Ann. Am. Acad. Political Soc. Sci. 2012, 644, 236–255. [Google Scholar] [CrossRef]
- Oslo Symposium. Oslo Roundtable on Sustainable Production and Consumption. 1994. Available online: http://www.iisd.ca/consume/oslo004.html (accessed on 31 May 2019).
- Quoquab, F.; Sukari, N.N. Why Sustainable Consumption is not in practice? A developing country perspective. In Sustainable Economic Development; World Sustainability Series; Springer: Hamburg, Germany, 2017; Chapter 6; pp. 103–113. [Google Scholar]
- Organisation for Economic Co-Operation and Development (OECD). Education at a Glance 2006—Highlights. 2006. Available online: https://www.oecd.org/education/skills-beyond-school/37376068.pdf (accessed on 1 November 2019).
- Stevens, C. Guest editor: Special issue on gender and sustainable development. Int. J. Innov. Sustain. Dev. 2009, 4, 2–3. [Google Scholar]
- Wolf, J.; Brown, K.; Conway, D. Ecological citizenship and climate change: Perceptions and practice. Environ. Politics 2009, 18, 503–521. [Google Scholar] [CrossRef]
- Balderjahn, I.; Buerke, A.; Kirchgeorg, M.; Peyer, M.; Seegebarth, B.; Wiedmann, K. Consciousness for sustainable consumption: Scale development and new insights in the economic dimension of consumers’ sustainability. Acad. Mark. Sci. Rev. 2013, 3, 181–192. [Google Scholar] [CrossRef]
- Salegna, G.J.; Goodwin, S.A. Consumer Loyalty to service providers: An integrated conceptual model. J. Consum. Satisf. Dissatisf. Complain. Behav. 2005, 18, 51–67. [Google Scholar]
- Churchill, G.A. A paradigm for developing better measures of marketing constructs. J. Mark. Res. 1979, 16, 64–73. [Google Scholar] [CrossRef]
- Hinkin, T.R. A review of scale development practices in the study of organizations. J. Manag. 1995, 21, 967–988. [Google Scholar] [CrossRef]
- Zikmund, W.G. Business Research Methods, 7th ed.; Thomson/South-Western: Mason, OH, USA, 2003. [Google Scholar]
- Malhotra, N.K.; Hall, J.; Shaw, M.; Oppenheim, P. Marketing Research: An Applied Orientation; Prentice Hall, Pearson Education Frenchs Forest: Sydney, Australia, 2002. [Google Scholar]
- Krueger, R.A. Focus Groups: A Practical Guide for Applied Research, 2nd ed.; Sage: Thousand Oaks, CA, USA, 1994. [Google Scholar]
- Cooper, D.R.; Schindler, P.S. Business Research Methods, 8th ed.; McGraw-Hill: New York, NY, USA, 2003. [Google Scholar]
- Cavana, R.Y.; Delahaye, B.L.; Sekaran, U. Applied Business Research: Qualitative and Quantitative Methods; Wiley: Milton, Australia, 2001. [Google Scholar]
- Martensen, A. Tweens’ satisfaction and brand loyalty in the mobile phone market. Young Consum. 2007, 8, 108–116. [Google Scholar] [CrossRef]
- Ok, C.; Shanklin, C.W.; Back, K.J. Generalizing survey results from student samples: Implications from service recovery research. J. Qual. Assur. Hosp. Tour. 2008, 8, 1–23. [Google Scholar] [CrossRef]
- Lynch, J.G., Jr. Theory and external validity. J. Acad. Mark. Sci. 1999, 27, 367–376. [Google Scholar] [CrossRef]
- Sheth, J.N. Are there differences in dissonance reduction behaviour between students and housewives? J. Mark. Res. 1970, 7, 243–245. [Google Scholar] [CrossRef]
- Hair, J.F., Jr.; Black, W.C.; Babin, B.J.; Anderson, R.E.; Tatham, R.L. Multivariate Data Analysis, 6th ed.; Prentice—Hall, International Inc.: Upper Saddle River, NJ, USA, 2010. [Google Scholar]
- Pallant, J. SPSS Survival Manual: A Step-By-Step Guide to Data Analysis Using Using SPSS for Windows; Open University Press: Maidenhead, UK, 2007. [Google Scholar]
- Edwards, J.R. Multidimensional constructs in organizational behaviour research: An integrative analytical framework. Organ. Res. Methods 2001, 4, 144–192. [Google Scholar] [CrossRef]
- Yi, J. A measure of knowledge sharing behaviour: Scale development and validation. Knowl. Manag. Res. Pract. 2009, 7, 65–81. [Google Scholar] [CrossRef]
- Jarvis, C.B.; Mackenzie, S.B.; Podaskoff, P.M. A critical review of construct indicators and measurement model misspecification in marketing and consumer research. J. Consum. Res. 2003, 30, 199–218. [Google Scholar] [CrossRef]
- Faul, F.; Erdfelder, E.; Buchner, A.; Lang, A.-G. Statistical power analyses g*power 3.1: Tests for correlation and regression analyses. Behav. Res. Methods 2009, 41, 1149–1160. [Google Scholar] [CrossRef]
- Hair, J.F.; Hult, G.T.M.; Ringle, C.M.; Sarstedt, M. A Primer on Partial Least Squares Structural Equation Modeling (PLS-SEM), 2nd ed.; Sage Publication: Los Angeles, CA, USA, 2017. [Google Scholar]
- Hulland, J.; Ryan, M.J.; Rayner, R.K. Modeling Customer Satisfaction: A Comparative Performance Evaluation of Covariance Structure Analysis Versus Partial Least Squares; Handbook of Partial Least Squares; Springer: New York, NJ, USA, 2010. [Google Scholar]
- Rigdon, E.E. Rethinking partial least squares path modeling: In praise of simple methods. Long Range Plan. 2012, 45, 341–358. [Google Scholar] [CrossRef]
- Hair, J.F.; Howard, M.C.; Nitzl, C. Assessing measurement model quality in PLS-SEM using confirmatory composite analysis. J. Bus. Res. 2020, 109, 101–110. [Google Scholar] [CrossRef]
- Rigdon, E.E.; Becker, J.-M.; Sarstedt, M. Factor indeterminacy as metrological uncertainty: Implications for advancing psychological measurement. Multivar. Behav. Res. 2019, 54, 429–443. [Google Scholar] [CrossRef]
- Hair, J.F.; Sarstedt, M.; Ringle, C.M. Rethinking some of the rethinking of partial least squares. Eur. J. Mark. 2019, 53, 558–566. [Google Scholar] [CrossRef]
- Ringle, C.M.; Wende, S.; Becker, J.M. SmartPLS 3. Boenningstedt: SmartPLS GmbH. 2015. Available online: www.smartpls.com (accessed on 15 January 2019).
- Becker, J.-M.; Klein, K.; Wetzels, M. Hierarchical latent variable models in PLS-SEM: Guidelines for using reflective-formative type models. Long Range Plann. 2012, 45, 359–394. [Google Scholar] [CrossRef]
- Ringle, C.M.; Sarstedt, M.; Straub, D.W. A critical look at the use of PLS-SEM in MIS quarterly. MIS Q. 2012, 36, 3–31. [Google Scholar] [CrossRef]
- Ringle, C.M.; Sarstedt, M.; Mitchell, R.; Gudergan, S.P. Partial Least Squares Structural Equation Modeling in HRM Research. Int. J. Hum. Resour. Manag. 2018, 46, 1–27. [Google Scholar] [CrossRef]
- Hulland, J. Use of partial least squares (PLS) in strategic management research: A review of four recent studies. Strateg. Manag. J. 1999, 20, 195–204. [Google Scholar] [CrossRef]
- Dijkstra, T.K.; Henseler, J. Consistent and asymptotically normal PLS estimators for linear structural equations. Comput. Stat. Data Anal. 2015, 81, 10–23. [Google Scholar] [CrossRef]
- Henseler, J. Bridging design and behavioral research with variance-based structural equation modelling. J. Advert. 2017, 46, 178–192. [Google Scholar] [CrossRef]
- Akter, S.; D’ambra, J.; Ray, P. Service quality of mHealth platforms: Development and validation of a hierarchical model using PLS. Electron. Mark. 2010, 20, 209–227. [Google Scholar] [CrossRef]
- Fornell, C.; Larcker, D.F. Evaluating structural equation models with unobservable variables and measurement error. J. Mark. Res. 1981, 48, 39–50. [Google Scholar] [CrossRef]
- Henseler, J.; Ringle, C.M.; Sarstedt, M. A new criterion for assessing discriminant validity in variance-based structural equation modeling. J. Acad. Mark. Sci. 2015, 43, 115–135. [Google Scholar] [CrossRef]
- Hu, L.T.; Bentler, P.M. Cutoff criteria for fit indexes in covariance structure analysis: Conventional criteria versus new alternatives. Struct. Equ. Model. 1999, 6, 1–55. [Google Scholar] [CrossRef]
- Henseler, J.; Dijkstra, T.K.; Sarstedt, M.; Ringle, C.M.; Diamantopoulos, A.; Straub, D.W.; Ketchen, D.J.; Hair, J.F.; Hult, T.M.; Calantone, R.J. Common beliefs and reality about PLS: Comments on Rönkkö and Evermann (2013). Organ. Res. Methods 2014, 17, 182–209. [Google Scholar] [CrossRef]
- Chin, W.W. Issues and opinions on structural equation modeling. MIS Q. 1998, 22, 7–26. [Google Scholar]
- Seguin, C.; Pelletier, L.G.; Hunsley, J. Toward a model of environmental activism. Environ. Behav. 1998, 30, 628–652. [Google Scholar] [CrossRef]
- Deci, E.L.; Ryan, R.M. Intrinsic Motivation and Self-Determination in Human Behavior; Plenum: New York, NY, USA, 1985. [Google Scholar]
- Pelletier, L.G.; Tuson, K.M.; Green-Demers, I.; Noels, K.; Beaton, A.M. Why are you doing things for the environment? The motivation toward the environment scale (MTES). J. Appl. Soc. Psychol. 1998, 28, 437–468. [Google Scholar] [CrossRef]
- Fornell, C.; Cha, J. Partial least squares. In Advanced Methods of Marketing Research; Bagozzi, R.P., Ed.; Blackwell: Cambridge, MA, USA, 1998; pp. 52–78. [Google Scholar]
- Shmueli, G.; Ray, S.; Velasquez-Estrada, J.M.; Chatla, S.B. The elephant in the room: Predictive performance of PLS model. J. Bus. Res. 2016, 69, 4552–4564. [Google Scholar] [CrossRef]
© 2020 by the authors. Licensee MDPI, Basel, Switzerland. This article is an open access article distributed under the terms and conditions of the Creative Commons Attribution (CC BY) license (http://creativecommons.org/licenses/by/4.0/).