Article

Understanding the Effectiveness of Higher Education System: Evidences from Market Outcomes of Early University Graduates in Seven European Countries †

1
School of Foreign Studies, Xi’an Jiaotong University, Xi’an 710049, China
2
School of Economics and Finance, Xi’an Jiaotong University, Xi’an 710061, China
*
Author to whom correspondence should be addressed.
This paper is an extension of a working paper included in the corresponding author’s unpublished Ph.D. thesis titled “The Future of the Creative Economy in Europe: an Empirical Analysis across the Main European Regions” (University of Birmingham, the UK, 2015). About 50% of the former content has been changed or updated.
Sustainability 2020, 12(18), 7761; https://doi.org/10.3390/su12187761
Submission received: 3 August 2020 / Revised: 17 September 2020 / Accepted: 17 September 2020 / Published: 19 September 2020
(This article belongs to the Section Sustainable Education and Approaches)

Abstract

:
Being enlightened by Richard Florida’s seminal work on the creative class, this paper aims to evaluate the effectiveness of higher education institutions to cultivate a workforce with utilised skills that meet the demand of labour market in the context of sustainable socio-economic development. Based on the macro and micro data generated from Eurostat and the Europe Labour Force Survey (EU LFS), the supply and demand condition of early graduates and the mismatch rate between early graduates’ education backgrounds and actual jobs they undertook are estimated by a multinomial logit model in seven European countries. The findings suggest that, (1) higher education has a significant impact on the formation of specific sustainability competencies that contribute to the development of creative economy; (2) many creative workers also have a high probability of finding jobs that are not commensurate with their qualifications; (3) the effect of higher education policies appears to be heterogeneous across different countries. Therefore, we argue that policy makers should increase awareness about connecting internal measures of education system (e.g., course design) directly to aims and scopes of sustainable socio-economic development scenarios, and joint efforts shall be made to reduce such mismatch rates for particular subjects that are identified by regular monitoring procedures or programmes on the basis of full consideration of interests and reasonable requirements across different countries in Europe.

1. Introduction

In the so-called fourth industrial revolution, sustainable development (SD) has been recognized as one of the biggest challenges of the 21st century. More specifically, as the World Economic Forum (WEF) [1] pointed out, disruptive innovations in business models will impact the employment landscape significantly over the coming years, in particular, youth employment remains a top global concern [2], however, people’s employment is closely related to their lifelong well-being and socio-economic development worldwide. Higher education institutions can serve as an innovation hub for achieving labour productivity through equipping young people with “sustainability competencies,” which concerns “the combination of cognitive skills, practical abilities and ethical values and attitudes mobilized in a real situation or context related to sustainability” [3]. In addition, the Organisation for Economic Co-operation and Development (OECD)[4,5] suggested a collection of “hard” and “soft” skills across cognitive, social, and emotional domains (e.g., creativity, critical thinking, problem-solving etc.) in responding to the current socio-economic climate of the 21st century, for enhancing quality of education, individual well-being, and social progress.
In such a context, scholars and practitioners have identified an urgent need to evaluate the effectiveness of teaching and learning experiences in higher education systems for achieving sustainability [6]. A large number of literatures, from different perspectives, aimed to explore how students are more likely to acquire essential skills and competencies in being ready for the knowledge economy. For instance, some have addressed the topic considering the design of transformative and reflective curriculum towards sustainability [7], and others have accounted for that creating attitude-building opportunities is essential to sustainable higher education [8], or suggested the conception of sustainability has to be included in undergraduate courses and engaging students with sustainable technologies, practices, and ethical principles helps them to develop the ability of critical thinking [9]. In other words, the existing research remains a “bottom-up” orientation with a careful examination of the internal “teaching-program design-learning” process in assessing the effectiveness of higher education systems, however, as the Critical Social Transformative Learning Theory [10,11] suggested, evaluating and improving the effectiveness of a higher education system should be situated in a broader context of socio-economic development, in this sense, a “top-down” orientation with taking account of socio-economic factors to evaluate if students’ learning outcomes, acquired skills, and competencies meet the requirement for the development of a sustainable economy [9], such as to what extent the labour produced (i.e., graduates) by a higher education institution match the demand of a labour market (i.e., employment).
Modern human capital theory [12,13] provides fundamental support for investigating how education as one of the greatest important ingredients of human capital affects sustainable economic growth [14] and increase productivity, human capital has been measured in various forms [15], such as the degree of education [16], entrepreneurship [17], individual and collective human capital [18]. Besides, another strand of investigation focuses on the role of occupational groups in economic development. For instance, the theory of “the creative class” (i.e., a particularly defined community that includes different types of knowledge workers) proposed by Florida [19,20] advocates that the essential condition for the sustainable socio-economic development is cultivating and reserving specific forms of human capital (including scientists, university teachers, engineers, high-tech technicians, managers, marketers, financial and social service professionals, or artists and journalists), which explicitly links the mission and practices of higher education with emerging socio-economic sustainable development needs. The implied core tenet can be if the current higher education system is capable of producing graduates who have qualified competences, early graduates are more likely to promptly find jobs in labour markets that are consistent with their skills and knowledge received from universities.
It is within such an intersection of an educational and economic line of inquiry, this study aims to, (1) distinguish the evaluation of the quality of a higher education system from the mainstream investigations by considering solid socio-economic outcomes (i.e., employment) as an “index” to reflect the effectiveness of skills and competencies developed by young people during the time at the university. Specifically, we used the indicator of degree of mismatch between the quality of labour produced by an education system and its labour market outcomes as the proxy to depict such a pattern, which allows an integration of both supply and demand in a labour market in evaluating graduates’ sustainability competencies; (2) further decompose graduates into three grand categories of education backgrounds (i.e., technological, business-management, and artistic backgrounds) with a holist scope to highlight the composition complexity of their sustainability competencies in a higher education system rather than focusing on specific aspects of higher education, such as the effects of tertiary education [21], biometric characteristics [22], the overall expansion of an education system [23], late graduation [24], or generally defined group of skilled workers [25]; (3) by viewing young people as drivers of knowledge economy and socio-economic development [26,27,28], highlight that understanding the development of sustainable higher education must be embedded in societal challenges and realities in the 21st century.
Integrating the concept of sustainability competencies (i.e., having particular attitudes and skills to socio-economic development in a long run) [29], as mentioned above in mainstream education research with skills and competencies conceptualized in creative workers, we understand and further define sustainability competencies as a collection of cognitive, social, and emotional skills that allows using knowledge to create new ideas, stimulate innovations, convert innovations to concrete social/economic outcomes, or at least to solve complex problems independently and creatively during the working process to the rise of knowledge economy. Based on the understanding that comparing education backgrounds and occupations that graduates are employed in can offer significant insights on how efficiently a higher education system can produce labour with sustainability competencies, we endeavour to answer the following questions: RQ1: What is the status of new creative workers in the European labour market; RQ2: are the present education system and associated education policies efficient enough to support them to actualize their skills and potentials under the dominant milieu of sustainable socio-economic development; and RQ3: measuring the effectiveness of a higher education system, is there any difference across countries in Europe? Findings of this study expand the understanding of sustainable higher education to an interdisciplinary scope, and also shed new light on the creative class theory regarding how to produce sufficient creative workers to meet the demand of the rise of the knowledge-intensive economy.
The rest of this paper is arranged as follows: literature review and hypotheses developments are illustrated in Section 2; Section 3 introduces methodology and describes the data; Section 4 discusses the main findings from both the supply and demand sides; Section 5 and Section 6 show theoretical, managerial implications and research limitations.

2. Literature Review

2.1. Higher Education for Sustainable Development

Economic, social, and environment constitute the foundation in conceptualizing sustainable development (SD) [30], which has been recognized as one of the critical global challenges of this century. The fundamental importance of education for addressing the challenges has been reaffirmed as a crucial goal to contribute to more sustainable societies in both the new 2030 Agenda for Sustainable Development [31] and the 17 Sustainable Development Goals [32], according to the international recognition that through education people can achieve a more sustainable living approach and society [5]. Education, especially at the higher level, directly influences economic growth, employability, making people more productive, which in turn promote the creation of knowledge, ideas, technological innovations, and the formation of a cordial political, social, and economic environment [33]. Therefore, empowering the individual with sustainability competencies to act in a complex changing socio-economic climate in a sustainable manner has become the primary aim of all levels of education, in particular higher education institutions.
However, existing research mirrors the lack of common definitions and frameworks in conceptualizing sustainability competencies, despite their increasing efforts in exploring the development and evaluation of sustainability competencies from various perspectives (see review c.f. [3]). Cabrian et al. [3] see sustainability competencies as “the combination of cognitive skills, practical abilities and ethical values and attitudes mobilized in a real situation or context related to sustainability”. Fortuin and Bush [34] emphasized being able to cross boundaries between bodies of disciplinary knowledge, cultures, theory, and practice for sustainability competent graduates. In the context of the fourth revolution, a combination of proper adequate knowledge and skills under the umbrella of sustainability competencies tend to be decisive within the workforce for driving innovation capacity in a fast-changing knowledge economy [35]. In responding, Van Larr et al. [36] have identified seven core skills (including technical, information management, communication, collaboration, creativity, critical thinking, and problem solving) and five contextual skills (including ethical awareness, cultural awareness, flexibility, self-direction, and lifelong learning) for success in the 21st century, which indicates the emerging complexity of competencies that jobs demanded for achieving the sustainable society.
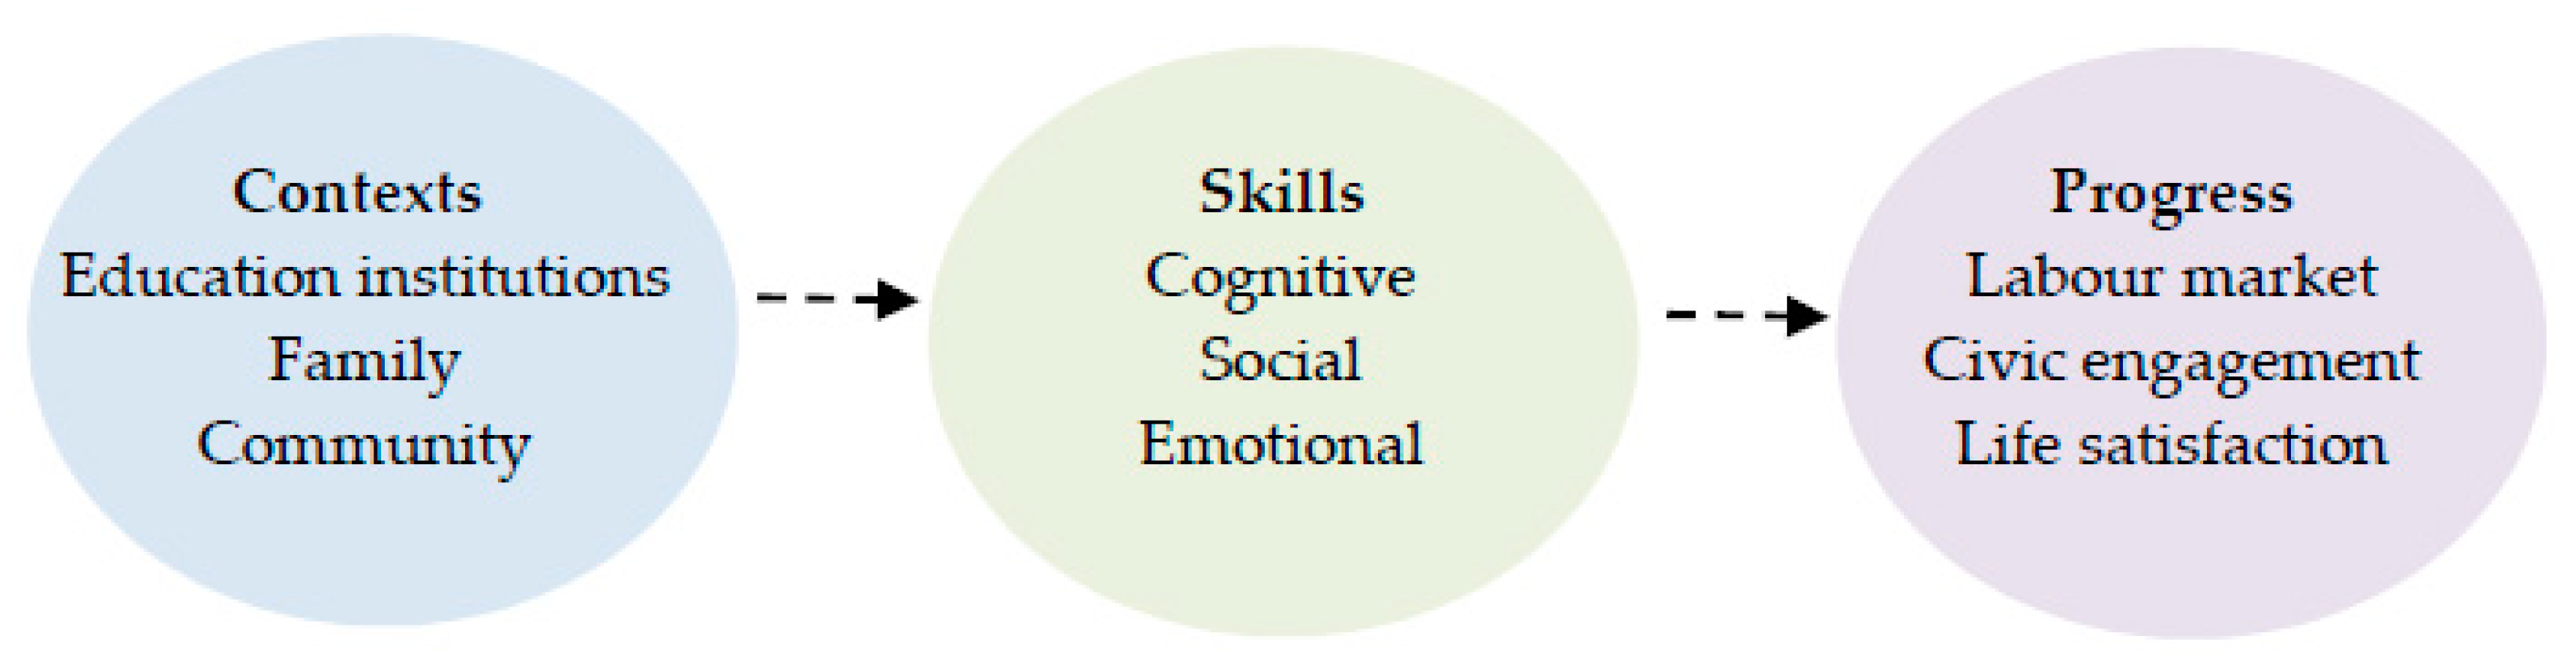
Moreover, the Organisation for Economic Co-operation and Development (OECD) conducted series investigations (e.g., OECD Skills Strategy (OSS); the OECD Survey of Adult Skills; the Programme for the International Assessment of Adult Competencies (PIAAC) ect.), attempting to help young people to gain a foothold in the labour market, enhancing individual wellbeing, and effectiveness of higher education systems in transforming knowledge and skills into economic growth. According to evidence from a three-year longitudinal research (the Education and Social Progress (ESP) project), OECD [5] highlighted the interconnection between education institutions and labour market (as shown in Figure 1) in developing young peoples’ skills across cognitive, social, and emotional dimensions for achieving sustainable social progress, such as literacy, numeracy, problem solving—skills that not only involve applying knowledge, but also include the ability to reflect and participate in more intricate thinking patterns; perseverance, self-esteem, and respect for others, which play important roles in countless everyday situations in all stages of a person’s life. More importantly, it also emphasized that many skills required in the 21st century, like creativity and critical thinking, incorporate intellectual, social, and emotional elements. This tendency is also shown in the key skills demands analysed by the World Economic Forum [37] in which “human” skills such as creativity, originality, complex problem-solving, emotional intelligence etc., were identified as outsized increase in demand in 2022 (see Table 1). The emergence of more complex skills required by the fast-changing knowledge society pose serious challenges to higher education systems that carry significant commitments to preparing young people for the labour market. Therefore, enhancing the effectiveness and quality of higher education institutions should be a core issue in the new era of knowledge economy.

2.2. Assessing the Quality of Higher Education Institutions

To further develop higher education for sustainability, scholars and practitioners have identified a need to evaluate the effects of higher education institutions. One line of inquiry adopted a “bottom-up” orientation with attention particularly given to explore students’ learning experiences and internal features of a sustainable education system. Such investigations are mainly based on qualitative research approaches. For example, some studies used educational data mining as a common method to predict and analyse students’ performance [38], other studies adopted case studies in examining qualitative institutional documents, e.g., the report of teaching activities [39]. Research have shown that the quality of student–teacher interaction and student participation are very important factors that affect the overall performance of students [40], and emphasized the value of both social and individual transformation during the educational process in improving graduates’ sustainability competencies [41,42,43].
The other line of inquiry, usually employing quantitative research methods, tends to apply a “top-down” orientation to measure socio-economic outcomes in relation to education returns, which can be considered as a reflection of the quality of a higher education system. Economic theories are normally drawn on in such studies to evaluate the effectiveness of higher education [44,45,46]. For example, from human capital theory perspective, the market rewards the investment of individuals in their skills with better jobs and higher wages, therefore, mismatch in the supply of skills can be due to the low capacity of education systems to respond to the needs of the market [4,47]. In a perfectly competitive labour market, the effect of a deterioration or improvement of higher education is straightforward; there is a reduction or increase in the wage of all graduates [23]. Thus, wage premium is often taken as a reference point for analysing the relationship between graduates’ labour market performance and various factors (e.g., IQ [48], gender [49], ethnicity [50], biometric characteristics [51], years of schooling etc.) that are considered as influential determinants to the trend and design of higher education policies.
The policy innovations introduced by the OECD Skills Strategy (OSS) [52] implied that education system could work more actively to update the demand for skills of an economic structure, rather than as passive recipients of the demands from employers and markets. A number of studies seem to be consistent with this advocacy. For example, education backgrounds were found having a strong power in explaining graduates’ whereabouts in the labour market [53], more specifically, graduates with an engineering and health background have a 30 percent higher wage than those who majored in the humanities [54]; graduates with STEM and business backgrounds were identified with larger wage premiums [55]. Besides education backgrounds, other aspects that also provide means of assessing the efficiency of higher education institutions cover cross-border higher education, time to degree, information provision on educational attainments etc. For instance, degree field and university ranking were recognized as having significant impacts on graduates’ first employment through comparing the labour market outcomes of graduates who participated in a cross-border higher education degree programs in Malaysia and Japan [56]. Aina and Casalone [45] analysed the effect of time to degree on the early labour market performance of Italian graduates, and found that students who graduate later are less likely to obtain jobs in the labour market and this effect is persistent for a very long period of time. Additionally, providing information on labour market to students with parents from low socio-economic households can significantly increase their intended college enrolments compared to those with a high socio-economic background [57].
As can be seen, existing literature on assessing the quality of higher education institutions have addressed various dimensions such as learning behaviours and processes, subjects, educational backgrounds, wage premium, time to degree etc., among graduates in different contexts. However, it appears that giving excessive but isolated attention to either internal learning experiences or labour market performance were actually treating sustainability competencies and socio-economic outcomes as independent entities, thus, offered limited understanding on the higher education institutions’ efficiency in cultivating young people’s sustainability competencies in such a changing socio-economic climate that requires re-shaping and emerging of more complex competencies through education, in order to narrow the widening skill gap [1]. Therefore, a theoretical framework that allows integration of sustainability competencies and socio-economic realities is needed for a better holistic understanding of the effectiveness of higher education systems.

2.3. Cultivating Creative Workers: Seeing Sustainability Competences Through the Lens of Market Outcome

As a strand of human capital theory, since the creative class thesis was initialized in 2002, this notion that the American urbanist Richard Florida proposed [19] to upgrade the existing regional/urban socio-economic structure has been hotly debated, e.g., [58,59]. The agglomeration of the creative class, which includes a super creative core (i.e., scientists, engineers, university professors, poets and novelists, artists, entertainers, actors, designers and architects, as well as the thought leadership of the modern society: notification writers, editors, cultural figures, think-tank researchers, analysts, and other opinion makers), creative professionals (i.e., high-tech, financial services, the legal and health care professions) and bohemians (i.e., novelists, artists, entertainers, actors, designers, and architects) [20] (p.38–40), is argued to be fundamental in determining the growth for a city or region. As long as the density of the creative class increases, its presence acts as a symbol of “regional attractiveness” in attracting more creative talents and industries, and shaping a virtuous circle. Therefore, the key to the success of such a sustainable socio-economic system is how creative workers can be efficiently cultivated and attracted.
The creative class theory has enlightened a number of novel venues to rethink how an urban/regional creative economy system can be developed and sustained, albeit many studies doubted the causal relationship between building up a tolerant people climate and sustainable economic growth, because of the difficulty in defining and measuring the concept of tolerance [60]. As Florida argued [20], what people actually do and their creative occupations are a better measure of people’s skills than educational attainment and other proxies, because they capture utilised abilities rather than potential. A sustainable, creative economy should not only attract creative workers from outside, but also act as a powerhouse in forging well-trained and educated individuals in the creative disciplines. In this sense, it is concordant with OECD Skills Strategy’s emphasis on the higher education system’s significant and active role in acting as a supplier to the labour market by constantly providing appropriate skills that the sustainable economy requires.
However, current discussion has remained focused on “attracting creative talents”, while it has not been fully extended to the role of the education system when shaping various types of creative workers. Only a few existing empirical studies give attention to generating creative workers. For instance, Comunian, Faggian, and Li [61] initially examined the labour market in the U.K. for bohemian graduates. Using micro-individual student data by the Higher Education Statistical Agency (HESA), bohemian graduates in the U.K. were believed to be unfairly rewarded in the year 2006, in terms of the level of salary and type of jobs offered to them. This research gap not only specifies a viable direction for further research concerning the development of the creative economy, but also provides an opportunity to reconcile the inconsistency between the research on the concept of graduates’ sustainability competencies and their labour market performances as mentioned earlier.
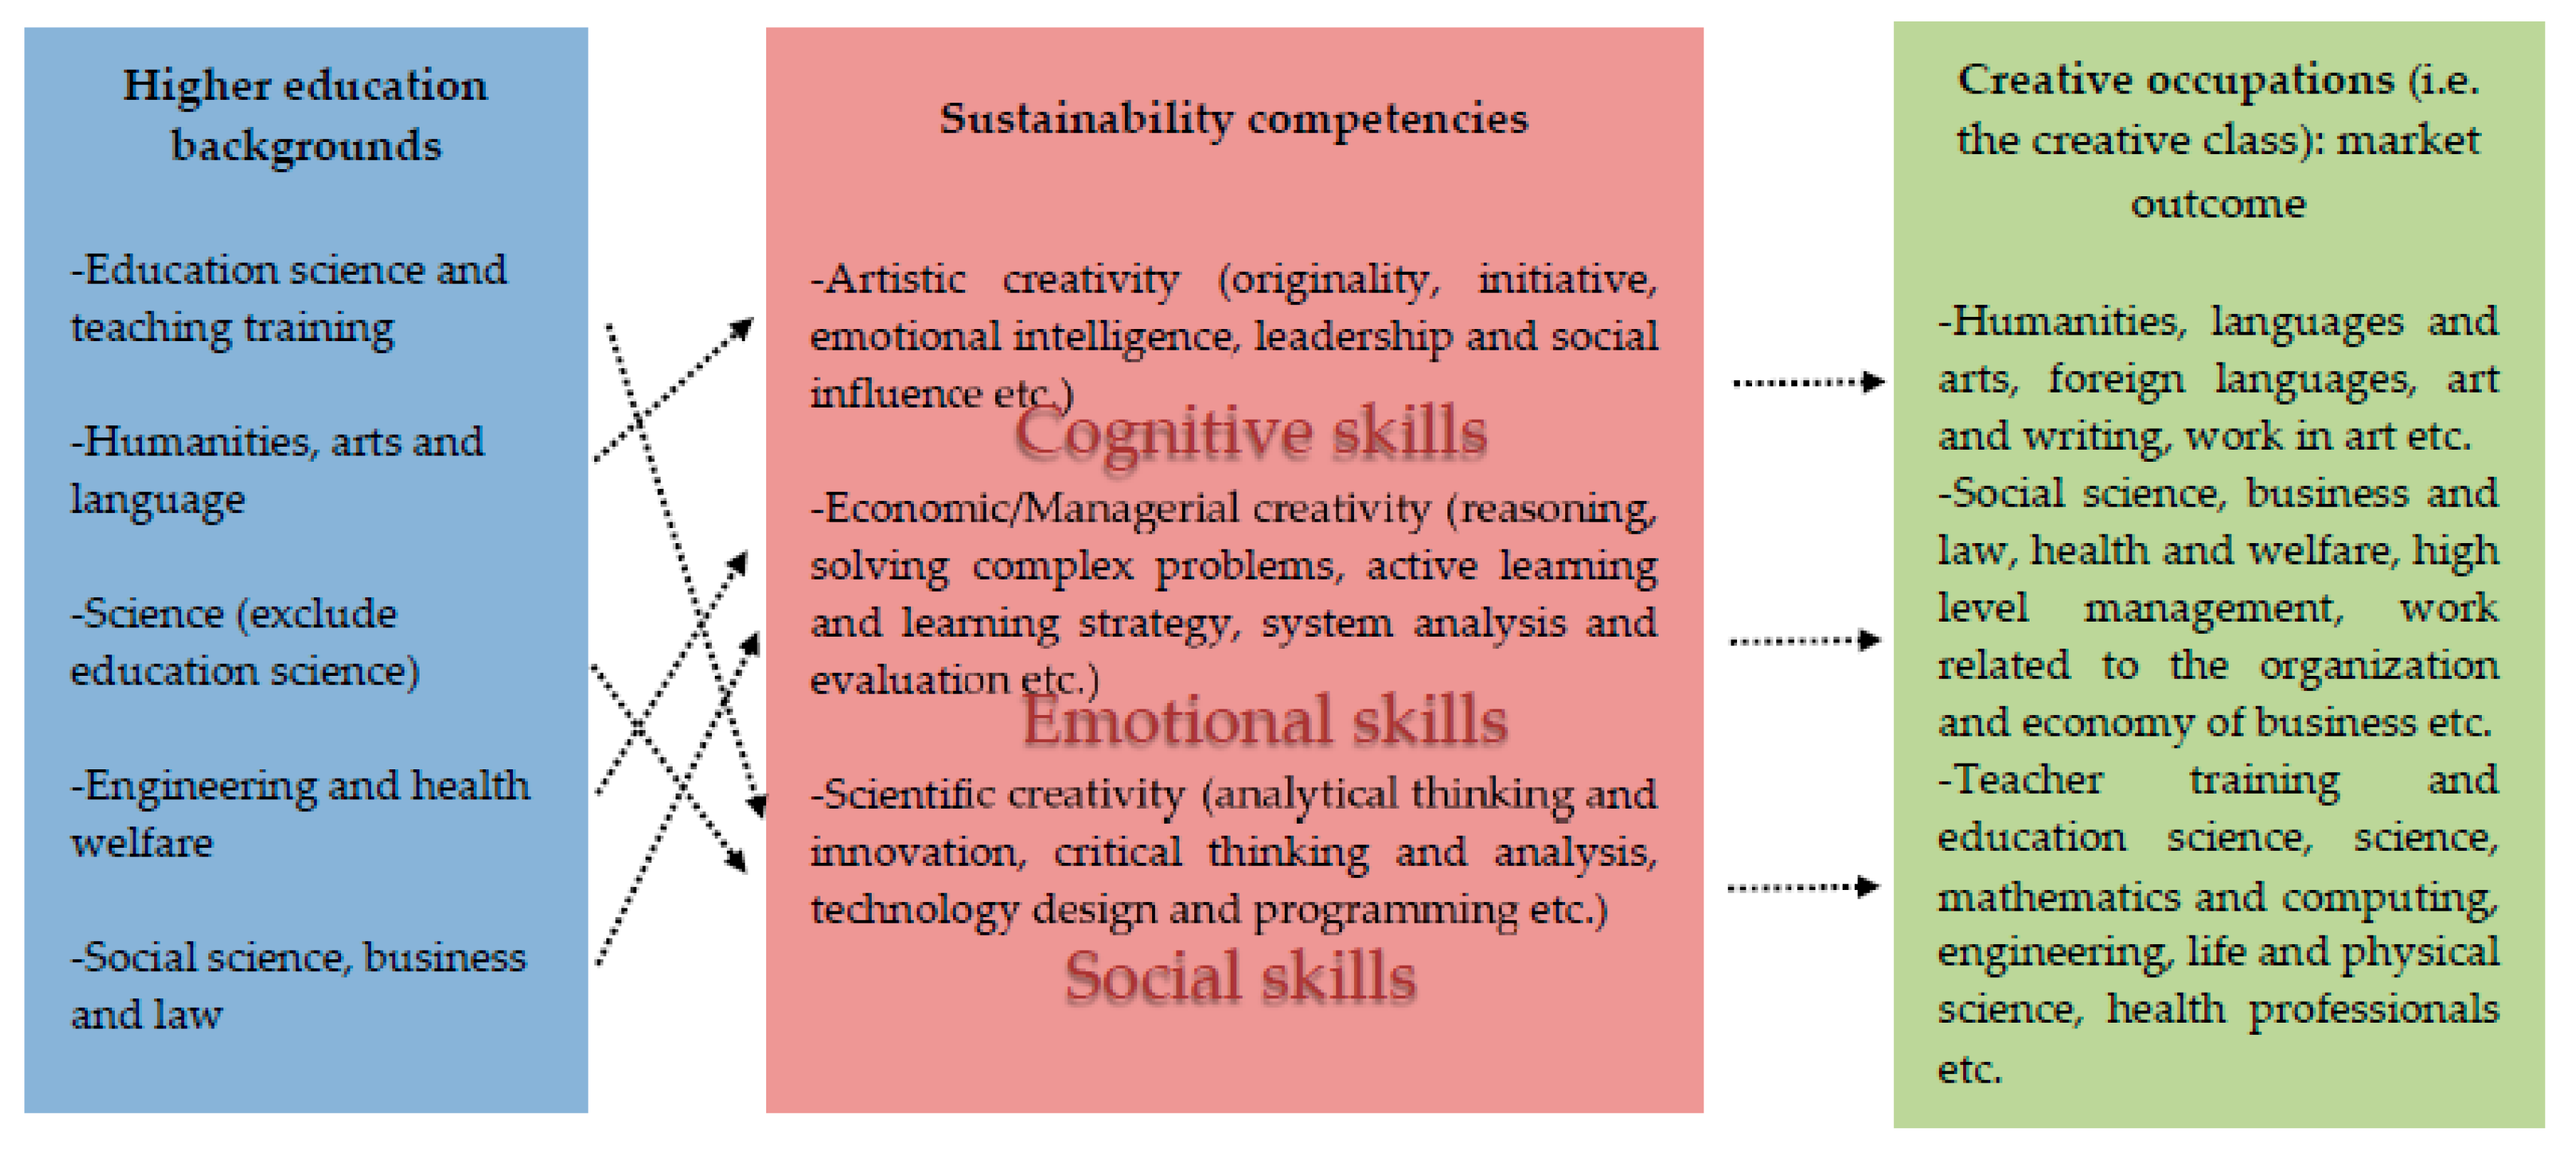
Applying creative class theory, higher education background can be generally categorized as “education science and teaching training”, “humanities, arts, and language”, “science (exclude education science)”, “engineering and health welfare” and “social science, business, and law”, according to the data provided by the Europe Labour Force Survey (EU LFS). Florida defined competencies that contribute to sustainable economic development as artistic creativity, economic/managerial creativity, and scientific creativity, and finally, these sustainability competencies that are supposed to be developed by different subjects (i.e., education backgrounds) are tested by a real market environments and converted into job outcomes, namely, creative occupations scattered everywhere during the production process, such as writers, journalists, engineers, scientists, mangers, lawyers, business and financial professionals, etc. The core tenet is that if a higher education system is highly efficient, education backgrounds are very likely to match with corresponding job outcomes. For instance, courses related to education science and teaching training, science (exclude education science) should develop students’ sustainability competencies in terms of scientific creativity; or a social science, business, and law curriculum should help students to gain sustainability competencies in terms of economic/managerial creativity and get jobs in business, computer use, engineering, health and welfare, and high level management. In this sense, students all have an opportunity to acquire sustainability competencies and become creative. The only difference is that due to different education backgrounds and the disparity in higher education effectiveness, their creativity will be realized in different ways and at different levels. Therefore, the mismatch rate between graduates’ education backgrounds and early creative jobs they undertook can be considered as an effective proxy for measuring the quality of higher education institutions in developing graduates’ sustainability competencies.
Grounded in what have been reviewed so far, we further defined sustainability competencies as a collection of cognitive, social, and emotional skills that allows using knowledge to create new ideas; stimulate innovations, converting innovations to concrete social/economic outcomes; or at least to solve complex problems independently and creatively during the working process to the rise of the knowledge economy. Our understanding of the interconnections between higher education backgrounds, sustainability competencies, and creative occupation outcomes is shown in Figure 2. It is based on this understanding that we arrived at our empirical investigation and results that are going to be discussed in detail next.

3. Methodology

3.1. Data

Given that little comparative research has been undertaken on the scale of the creative economy across Europe [62], the European Labour Force Survey (EU LFS) database provides an opportunity to link the main European creative economies together, such as the U.K., Germany, Spain, Italy, and France. In addition, the Netherlands and Denmark are also included, as their economies have frequently been described as “creative” [63]. Ideally, the EU LFS survey can cover all of the EU countries, but the core variable “hatfield”, which indicates interviewee’s education/training background by 14 general subjects, has only been available since 2003 for limited countries, thus only the U.K., France, Italy, Spain, Germany, the Netherlands, and Denmark are the research targets. This paper proposes the following classification to link different education backgrounds to the concept of the creative class.
1. New bohemian workers: LFS subject codes 200 (humanities, languages, and arts) and 222 (foreign languages), which are likely to be relevant to creative occupations 245 (journalism, art, and writing), 347 (work in art, entertainment, and sports) and 521 (modelling).
2. New creative core workers: LFS subject codes 100 (teacher training and education science), 400 (science, mathematics, and computing), 420 (life science), 440 (physical science), 460 (mathematics and statistics) and 481 (computer science), which are likely to be relevant to creative occupation groups 21 (physical, mathematical, and engineering science professionals), 22 (life science and health professionals), 23 (teaching professionals), and 24 (other professionals).
3. New creative professionals: LFS subject codes 300 (social sciences, business, and law), 482 (computer use), 500 (engineering, manufacturing, and construction) and 700 (health and welfare), which are likely to be relevant to creative occupations 1 (high level management), 241 (work related to the organisation and economy of business), 242 (work with law), 31 (technical work in nonbiological areas), 32 (technical work in biological areas), and 34 (other associate professionals).
It is worth mentioning that this alignment is rough, as the specific subject codes that are accurately related to each creative occupation or small groups of creative occupations are unobtainable in the EU LFS. It is especially true when measuring new workers who have an education background related to the jobs of bohemians or creative professionals. However, meaningful results about the match or mismatch between qualifications and occupations are expected as this attempt can still capture this pattern in a broad sense.
In order to maximise the sample size, the dataset includes micro-level records based on the longest time period for each target country, such as the period 2004–2007 for the U.K. and Italy, and the period 2006–2007 for the Netherlands and France, and in the period 2003–2007 for Spain and Denmark. The exception is Germany, where the variable “educfild” is only available in the year 2003. In addition, the time period after 2007 is not included, as the economic crisis in Europe, which began in 2008, is argued to completely change the pattern of job outcomes for graduates and nongraduates [64].
Moreover, the variable “wstat1y (situation with regard to activity one year before survey)” is used to define newly graduated students. As the EU LFS derived this variable to represent the situation of every interviewee one year before the survey, it is plausible to assume that the workers who were pupils, students, or had further training and unpaid working experience, can be a cohort of new graduates/nongraduates according to the previous academic year. This group is further confined by the age band of 22, as interviewees at the age above this band are less likely to be newly graduated students but instead be workers who already have considerable work experience to redevelop skills and knowledge in the workplace. With this adjustment, the valid observations/weighted observations for each country based on the available time periods are listed in Table 2. Finally, the personal characteristics of individuals are also controlled for, such as age (variable “age”), gender (variable “gender”), the level of educational attainment (variable “hatlev1d”), part-time/full-time (variable “ftpt”), self-employment/employment (variable “stapro”), and ethnicity (variable “countryb”).

3.2. Models

After having defined qualifications and creative occupations, the methodology of this paper follows three steps:
Firstly, the simple descriptive statistics are presented to measure the situation of newly graduated students regarding both supply and demand in the labour market. An important setup here is that only individuals who have jobs in the current year are focused upon. In other words, only the relationship between the supply of labour (graduates/nongraduates) and the demand of labour (creative/noncreative occupations) is addressed, without consideration of unemployment, as the EU LFS dataset contains insufficient information to analyse this pattern. Therefore, for graduates and nongraduate workers who were students and pupils from the last academic year, the only job outcome for them is if their occupations are now creative or noncreative, based on Florida’s definition.
Then a multinomial logit model identifies what factors affect the probability of obtaining a creative job for new workers. Formally:
  Pr ( Y = 0 | X ) = e x β 0 e x β 0 + e x β 1 Pr ( Y = 1 | X ) = e x β 1 e x β 0 + e x β 1
In Equation (1), outcomes 1 and 0 recorded in y represent the job outcomes in terms of creative and noncreative occupations respectively. A set of coefficient β 1 and β 0 is estimated, corresponding to each outcome. However, this model is unidentified as it has more than one solution β 1   and β 0 and leads to the same probability if Y = 1 and Y = 0. To solve this problem, β 0 has to be set at zero. Therefore, the remaining coefficients β 1 will measure the relative change to the Y = 0 group. In this case, the set of equations in 6.1 can be further expressed as:
Pr ( Y = 0 | X ) = 1 e x β 1 + 1 Pr ( Y = 1 | X ) = e x β 1 e x β 1 + 1
In this case, the relative probability of getting a creative job (Y = 1) to the basic outcome of getting a noncreative job is:
  Pr ( Y = 1 | X ) Pr ( Y = 0 | X ) = e x β 1
Thus, the exponentiated value β i is defined as the risk-relative ratio (RRR) for one-unit change in the corresponding variable X i , which represents the different personal and course characteristics in this study.
At this stage, the definition of creative jobs is only a general concept. As the aim is to measure the effect of different characteristics on the outcome of creative jobs, all creative occupations will not be separated into subcategories. However, the general education/training background of the whole creative class is still expected to reveal the differences in the education system and labour market across the target countries.
Finally, the heterogeneity across the different creative occupations is highlighted. Personal and course characteristics can result in different job outcomes regarding the nature of creative occupations that require quite different skills and qualifications. In this respect, the second multinomial logit model is further used to examine how course and personal characteristics influence the probability of getting a bohemian, creative core, or creative professional job. The following model is estimated as:
Pr ( Y = 0 | X ) = 1 e x β 1 + e x β 2 + e x β 3 + 1 Pr ( Y = 1 | X ) = e x β 1 e x β 1 + e x β 2 + e x β 3 + 1 Pr ( Y = 2 | X ) = e x β 2 e x β 1 + e x β 2 + e x β 3 + 1 Pr ( Y = 3 | X ) = e x β 3 e x β 1 + e x β 2 + e x β 3 + 1
In Equation (4), outcomes 0, 1, 2, and 3 recorded in y represent the job outcomes in terms of noncreative, bohemian, creative core, and creative professional occupations respectively. The deduction in calculating the risk-relative ratio for each subcategory is the same as Equation (2) and (3).

4. Findings

4.1. Supply of Graduates in the European Labour Market

To observe the supply of graduates in the labour market requires the data from Eurostat. As can be seen in Appendix A, the number of graduates evidently increased in the period 2000–2007 for the majority of subjects. The only exceptional case is France, where the pattern of this overall growth is not very clear, such as in the subject fields of science, mathematics, and computing (−8.6 percent), humanities and arts (−10.1 percent), and social sciences, business, and law (−0.1 percent). In contrast, Italy experienced a faster average growth in most subjects compared to the rest of the countries, such as teacher training and education science (27.4 percent), humanities and arts (10.8 percent), or social sciences, business, and law (8.5 percent).
Turning to the share of graduates by subject, figures reveal that graduates with a background in social science, business, and law account for the largest average share across all the target countries. For the other subjects, it is not possible to draw a universal conclusion as the ranking varies. However, the share of graduates with a health and welfare background or with an engineering, manufacturing, and construction background is generally larger than those who have a background in science, mathematics and computing, humanities and arts, or teacher training and education science. In comparison, the smallest number of graduates is allocated to the subject agriculture, veterinary, and services, which is defined as “other subjects” in this thesis.
It is interesting to observe the significant variation in some subjects, which is consistent with the nature of an economy. For example, in the U.K. and the Netherlands, where the education industry is an important sector, the share of graduates with teacher training and education science is very high, showing figures of 16.5 percent and 10.2 percent, respectively. Such a share is also very high in Spain, which is even higher than that of the U.K. This can be deemed realistic, as the Spanish university was experiencing evident quantitative growth in terms of institution expansion and enrolment rate due to the significant HE policy changes when the People’s Party (PP) was in power [65]. For the countries where the overall EQI source (the overall quality of local government, see [66]) is higher, there is a greater demand for graduates in the health and welfare sector. For instance, the share of health and welfare graduates is relatively larger in Denmark (24.6 percent), Germany (23.9 percent), the Netherlands (19.0 percent), and the U.K. (17.3 percent), compared to Italy (14.9 percent), Spain (13.1 percent), and France (10.5 percent).

4.2. Demand for Creative Workers in the European Labour Market

The EU LFS dataset was adopted to continue the investigation. Again, the average of the results was taken based on the available time periods for each country. As shown in Table 3, it is readily evident that the Netherlands and Denmark have the highest shares of new graduates/nongraduates that actually have creative jobs, which account for 1.9 and 1.4 percent of the total average workforce, respectively. For western European economies, this figure is 1.04 percent in Germany, followed by France (0.8 percent), the U.K. (0.7 percent), Spain (0.7 percent), and Italy (0.4 percent). Turning to the role of university degrees, the Netherlands and Denmark still have the highest shares of new creative workers who have a university degree, showing the figures of 0.9 percent and 0.8 percent, respectively. In comparison, there is over 0.5 percent of new graduates who have creative jobs in the U.K., France, and Spain. However, this pattern is less evident in Italy and Germany, as the number of new creative graduates almost accounts for the same share as those creative nongraduates.
The above discussion confirmed that higher education is in fact a signal to indicate the competencies of new workers to get a creative job in the labour market. It is not surprising to see that a large share of new creative workers have university degrees, which is much higher than the average share of total new workers who have a university degree. For example, the total number of new graduates only account for 0.9 percent of the total workforce in the U.K., while 2.5 percent of new workers do not have a university degree. This finding may support the argument that the concept of the creative class and human capital is largely overlapping, and it also highlights the importance of the higher education system in shaping creative workers in the long term. However, as Florida argued, the creative occupations measure utilised skills rather than potential skills, such as graduates; therefore, the higher level of the creative job outcomes cannot simply be explained by the higher level of human capital. The situation in Germany and Italy has already shown that almost half of nongraduates have creative jobs, and this share is also significant in the rest of the countries.

4.3. Econometric Analysis

4.3.1. Model I: How Can Students Become Creative Workers?

The analysis begins with the whole creative class, and higher education and education background are separately included in two regressions. The results are presented in relative risk ratio. A ratio above one means that a relevant variable positively affects the outcome of getting a corresponding creative job compared to the base category (i.e., noncreative occupations). As can be seen in the first column in Model I in Appendix B, the difference in gender appears to have a significant impact on the outcome of creative jobs. Male graduates are more likely to enter a job in creative occupations than female graduates in the U.K., France, Italy, Germany, and Denmark, but the reverse is seen in Spain and the Netherlands. As for age, graduates in the age band 22–27 have a higher probability of becoming creative workers than those in the age band 17–22. This result may imply an effect similar to higher education, as the majority of graduates in the age band 22–27 are composed of college graduates, while younger ones are more likely to be nongraduates from secondary education or vocational education. There are strong indications that new creative workers prefer to be self-employed or have full-time jobs in the majority of the target countries.
Looking at the role of higher education, it seems that its positive effect on creative job outcomes is significant in all of the target countries, where the highest coefficient is observed in Spain (6.63 (for example, new workers with a university degree increase the change of getting creative jobs by 563 percent in Spain)), followed by Denmark (4.48), Italy (4.35), Germany (4.20), the U.K. (3.32), France (3.31), and the Netherlands (2.75). In addition, new creative workers are more likely to migrate towards metropolitan areas with the exception of Italy. This is not surprising given the fact that metropolitan regions provide greater opportunities for new graduates to develop their personal careers [67].
As far as course characteristics are concerned (see the second column in Model I in Appendix B), the results appear to be consistent with the findings in the descriptive analysis when measuring the creative class as a whole. With the exception of Italy, new workers with education, science and engineering, and health and welfare backgrounds have a higher positive effect on the probability of entering a creative job than other subjects.

4.3.2. Model II: A Specific Analysis by Different Groups of Creative Workers

This section proposes a breakdown of all the creative occupations into three categories: bohemians, the creative core, and creative professionals (see Model II for each country in Appendix B). Moreover, we focus on the interpretation of independent variables regarding their abilities to distinguish between pairs of group and contributions, which they make to change the odds of being in one dependent variable group. For instance, having a background in arts and languages increases the chance of being a bohemian worker by approximately 139.4 percent, while a background of engineering or health and welfare decreases this chance by 41.2 percent in the U.K. In addition, the component of bohemian occupations is dropped in France, as very limited observations of new bohemian workers in the sample results in calculation failure by the maximum likelihood function. Finally, the important results are summarised as follows:
1. Personal characteristics
Age: the probability of getting creative jobs increases with age in the majority of the target countries.
Ethnic background: new workers from an ethnic minority are less likely to find creative jobs with a few exceptions. In Denmark, being a new worker who was born in a foreign country increases the chance of getting bohemian, creative core, and creative professional jobs by 14.9 percent, 50.2 percent, and 27.7 percent, respectively. In Italy, being a non-native born worker increases the chance of getting creative professional jobs by 46.2 percent.
Self-employment: there is a clear indication that new creative workers are more likely to be self-employed and it is particularly obvious in the bohemian category; for example, the RRR of being self-employed is well over 12 and 18, respectively, compared to getting a full-time job in the U.K. and Germany. However, this phenomenon is not considered to be due to the nature of the creative class but as a realistic situation for new workers in the labour market. As mentioned earlier, new workers may need a long period to integrate their skills and qualifications with on-the-job experience; thus, they are less likely to be perfect substitutions for older workers. As a result, there are a large number of new creative workers becoming self-employed due to the unavailability of regular jobs. Particularly for new bohemian workers, it could be more that the nature of the jobs requires self-employment. Many creative sectors, such as the TV and film industry, hire on a contract basis rather than providing permanent employment. Artists often see themselves as self-employed if they are frequently moving between contracts [68].
Full time/part time: new bohemian workers in Spain and Italy have a higher probability of doing part-time bohemian jobs, while new workers who are defined as the creative core and creative professionals are less likely to do so. Also, being a part-time worker increases the chance of getting a creative core job by 9.8 percent in Spain. In association with the discussion about self-employment, this finding, from a different perspective, again can be seen to confirm the insecure position of bohemian students in the labour market.
2. Higher education
The positive effect from higher education is readily evident in the majority of the creative subcategories across countries. In general, the strongest effect captured is among creative core occupations, then creative professional and bohemian jobs. For example, in the U.K., having a university degree increases the chance of getting a creative core job by around 410 percent, a creative professional job by around 180 percent, and a bohemian job by around 147 percent. This finding again supports the important role of higher education and further reveals that higher education seems to be more important in shaping creative workers in relation to the concept of the creative core.
3. Education backgrounds

A Comparison across Backgrounds in a Category

On the basis of the descriptive statistics, how qualifications and knowledge match to creative jobs based on econometric exercises needs to be addressed. As far as the different education backgrounds in each occupation category are concerned, it seems that in many countries, creative job outcomes are responsive to qualifications and skills. In addition to the case of the U.K., holding a qualification in arts and languages significantly increases the chance of getting bohemian jobs in the Netherlands, Italy, and Germany, while there is no significant difference in creative job outcomes in Denmark. The only exception is Spain, where new workers with this background are more likely to get jobs in other creative occupation categories. Such consistency between a qualification and a job outcome is more indicative in the subcategory of the creative core. Holding a prestigious science-led (excluding education science) qualifications and getting a creative core job is straightforward in all of the target countries except Italy. For instance, the RRR for science-led subjects leading to a creative core job is well over 10, compared to 3.31 (humanities, arts, and language) and 2.93 (social science, business, and law) in the Netherlands. Moreover, as another important background in shaping creative core workers, being educated by education-science led subjects increases the chance of getting equivalent jobs. Such an effect is very dominant in the U.K., the Netherlands, and Denmark, showing RRR values of 51.40, 16.15, and 27.49, respectively.

A Comparison across Categories for a Background

The impact of each education/training background through different subcategories of the creative class is also examined. Here the perspective is different from the above section; the aim is to ascertain how a new worker with an education/training background could find different jobs in the labour market rather than evaluating the impacts of different subjects in getting the same type of jobs. It is worth mentioning that the findings may be slightly different from the descriptive statistics regarding this pattern, as the measure of education/training background inevitably includes both graduates and nongraduates.
The results again indicate that in many cases, holding a relevant qualification gives a better chance of getting a corresponding job. Particularly for new workers with education-science, social science, and science backgrounds, this pattern is straightforward in the majority of countries. For example, holding a qualification related to social science subjects increases the chance of getting a creative professional job by 225 percent in Denmark, while doing so decreases the chance of getting a creative core job by 1.6 percent and increases the chance of getting a bohemian job by only 24.6 percent. Similarly, with a qualification related to science, the chance of getting a creative core job is increased by 413 percent, which is much higher than getting a bohemian job (increased by 96.9 percent) or a creative professional job (163 percent).

5. Discussion

With the implementation of the Lisbon strategy, the aim and scope of higher education shifted from increasing employability and entrepreneurship generally, to a direct, specific emphasis on investing more in human capital by improving higher education institutions in Europe [69]. Therefore, it may not be surprising that there is a general growth trajectory of graduates in the target European countries during the period of investigation. This growth pattern was not only recorded in EU statistics, but was also captured in our analysis at a more micro level. At this point, the Lisbon strategy appears to facilitate efficient governance in terms of coordinating education policies at the EU level. However, similarly to other studies (e.g., [70]), the findings of this study also show that national policies of EU members were less likely to converge to common goals. For example, evidently faster growth of graduates in some countries (e.g., the U.K., the Netherlands, and Italy) than in other countries were identified, and in terms of producing specific creative jobs, the job landscape of these countries are even more diversified. This may imply that the Lisbon strategy functioned effectively to some extent in promoting human capital via higher education, while remained limited when considering a more concrete match between sustainability competencies cultivated in higher education and creative occupations, particularly in the fourth industrial revolution where no less than 54% of all employees will require significant re- and up-skilling by 2022, which requires that individual talents have appropriate skills enabling them to thrive in the job market [37].
Even though this study has not been able to cover data in the more recent period of time, the creative class thesis offered a meaningful entry point to understand values of higher education systems and provided important references for supporting the recent agenda of higher education reform proposed by the WEF [37] towards Europe. In general, higher education has indeed played a critical role in shaping new workers with emerging skills that are required by the increasing adoption of new technologies and the expansion of the knowledge economy. Moreover, it also allows a more fine-grained inquiry on sustainability competencies (cultivated according to different education backgrounds) in relation to socio-economic outcomes. Comparing skills with demand, our study showed that many graduates with skills such as analytical thinking, innovation, problem solving, and originality that are advocated by the EU and identified by the WEF as trending future-proof skills, however, actually do not efficiently obtain corresponding jobs. Specifically, it is difficult to capture the dominant advantages from the background of social scientists; instead, several subjects can be meaningful to explain the job outcome of creative professionals (e.g., engineering, health, and welfare subjects). Being educated in social science-led subjects still has a strong explanatory power in many countries. The strongest effect is observed in Germany, where being educated in social science-led subjects increases the chance of getting creative professional jobs by around 700 percent. However, the boundary between acquired skills and practical use is not very clear for new workers with a bohemian background. Even though holding a qualification related to bohemian subjects is more likely to get a bohemian job compared to remaining subjects, the horizontal comparison across countries portrayed an ambiguous picture, as only in Germany and Italy do new workers with this background have obviously more chances of getting a bohemian job, while they are also likely to get a creative core (i.e., scientific creativity) or creative professional (economic/managerial creativity) jobs in the rest of the countries.
These discrepancies implicate that the efficiency of transforming sustainability competencies in certain fields (e.g., artistic creativity) gained from higher education into appropriate socio-economic outcomes still remains a widening space for further improvement, even though relevant skills (e.g., originality, initiative etc.) have been recognized and highly valued as critical “human” skills in the 21st century. This may suggest that on the one hand, there is an emerging need to combine skills across domains in reshaping more “integrated” sustainability competencies while acknowledging and keeping core featured skills of different educational backgrounds in higher education in order to prepare “future-ready adults”[71,72] with right skills to meet real “sustainable” in facing the growing skills instability with the wave of new technologies in the fourth industrial revolution, for example, an artistic student should also be competent in technology related skills for successfully finding a corresponding job such as an illustrator or visual designer. On the other hand, it also highlights the complex feedback loops between higher education, sustainability competencies, and market, therefore, despite the evolution needed in higher education, companies and employers are also expected to broaden the workforce by offering more hiring and training opportunities for re-skilling and up-skilling, based on an understanding of sustained value for the business and employees through seeing “workforce as an asset” [73], and in this way, support more efficient and sustainable transformation of skills into socio-economic growth, as well as talents’ lifelong well-being by investment in human capital. A core challenge in this case concerns the issue of co-ordination and collaboration along the vertical and horizontal dimensions of government policy-marker, regulators, educators, and other stakeholders in the society in working on and achieving the skills policies [74]. Although discussing how different countries govern their skills policies is beyond the scope of the current study, findings of diversified market landscapes in different countries already shed light on the need for better strengthening “the governance of skills systems” [75].

6. Conclusions and Limitations

Through analysing the mismatch rate between education backgrounds with sustainable competencies and associated creative jobs in the context of socio-economic development, the effectiveness of the higher education system in shaping graduates’ sustainability competencies in seven European countries was examined. This paper provides scholars and practitioners in relevant fields with a novel perspective to assess the effect of higher education policies on sustainable socio-economic development, and to a certain degree, reconciles the existing research gap in both higher education and creative class studies, and the data adopted in this study per se contributed in building integrated information systems for making good governance decisions.
In response to RQ1, a strong supply and demand for graduates in creative disciplines has been observed, and higher education indeed has shown a significant impact on the formation of specific sustainable competencies that contribute to the development of a creative economy. The education system in Europe appears to be considerably specialised compared to more general education programmes [76,77,78], the former ensures highly specialised skills training for specific tasks, while the latter implies a greater adaptability in response to changes in the economic situation [79].
In further inquiring this pattern in detail, the probabilities of getting bohemian, creative core, and creative professional jobs with different backgrounds for each country were separately ranked (highest probability = 5/lowest probability = 1). It revealed that new workers are generally assimilated into proper jobs with different rates, depending on their education/training backgrounds. Specifically, new workers with arts and humanities backgrounds are more likely to become bohemians, holding a qualification of science or education-science increases the chance of getting creative core jobs and in order to have a creative professional job, the background of social science and engineering/health and welfare appears to be necessary (see Appendix C). These finding answered RQ2 by showing that to a great extent education schemes in developed European nations could match labour market needs, which is consistent with previous studies that highlighted the important role of higher education in cultivating sustainability competencies under the dominant milieu of knowledge-intensive economy development [80,81,82].
However, new creative workers also have a high probability of finding jobs that are not commensurate with their qualifications. This is particularly evident for those who are holding qualifications related to arts/humanities, social science, and engineering/health and welfare. Moreover, the effect of higher education policies still appears to be heterogeneous across different countries, e.g., [53,83,84], even though education backgrounds generally match labour market outcomes in terms of probability in getting creative jobs, graduates with education science, science and teaching training backgrounds are more likely to have creative-core jobs in the U.K., the Netherlands, Demark, and Germany than France, Italy, and Spain do. Accordingly, in regard to RQ3, these findings imply that there is still an emerging ambiguous boundary among creative occupations that require and use appropriate sustainability competencies developed through higher education.
Grounded in what has been found, the study can offer a range of implications at managerial level for strengthening “the governance of skills systems” called for by OECD [75]. First, the primary consensus across different levels of governance that should be reached concerns a holistic understanding of the increasing significant powers of education, particularly at the higher level, in transforming potential capacities into utilizable skills for sustainable socio-economic development, in other words, skills policies should be placed at the top of the government agenda [75]. Based on this understanding, policy makers should increase awareness of connecting internal measures of education systems (e.g., curriculum design, sustainable competencies development, skills training etc.) more tightly with aims and scopes of sustainable socio-economic development scenarios; this may require co-ordination, co-operation, and collaboration across different dimensions of governance by identifying and engaging stakeholders throughout the phase of policy formulation, design, implementation, and re-design, therefore, to form a more efficient “policy cycle”. Second, the study also suggests that the field of study matters in shaping creative workers, however, a significant mismatch rate co-existed. The possible solution could be providing and ensuring adequate and equitable resources, for example, adjusting the wage system to accurately capture important values of different education backgrounds, and considering more equitable funding and resource allocations for different subjects, such as differentiating tuition fees and scholarships, providing high quality bursary and occupational guidance would encourage more individuals to participate in humanity and arts subjects. Finally, although higher education institutions are heterogeneous in terms of policy design, focus, and actual effectiveness across different countries or regions in Europe, a joint effort should be better made by the OECD countries in strengthening the governance of skills systems, stimulate the demand for high-level sustainability competencies, expand the pool of available talent, and promote sustainable development globally.
Besides the contribution our study made, limitations cannot be avoided in each research. First of all, it must be accepted that the application of the EU LFS dataset has its own limitations. The discussion cannot be extended to the wage effect of education due to lack of available data, while the time period of 2003–2007 may be not indicative of recent circumstances from 2007 onwards. This is most likely to occur because EU LFS, for the concern of data confidentiality, gradually removed some variables that can be further decomposed or analysed to reveal interviewees’ identities. Even though a dataset with a longer time period can be obtained in a number of independent datasets, to the authors’ best knowledge, EU LFS is the only one that can conduct an analysis in the way this paper used on a comparable basis. Secondly, a survey-based dataset always has considerable biases. One of the most typical examples is that the scale of graduates or new workers can only be indirectly estimated through the assumption. Also in multinomial logit models, the size of coefficients for a particular variable is likely to be driven by the sample selection technique in each country. In response to these issues, there is a need for a more harmonized data with a longer period of survey time, and future research should focus on variable defining and methodological design to produce more accurate and comparable results.

Author Contributions

Conceptualization, K.Z.; Formal analysis, Z.Y. and K.Z.; Methodology, K.Z.; Software, Z.Y.; Writing—Original Draft, Z.Y. and K.Z.; Writing—Review & Editing, Z.Y. All authors have read and agreed to the published version of the manuscript.

Funding

This research was funded by the China Postdoctoral Science Foundation funded project (Grant No. 2017M613092; 2017M623140), the Fundamental Research Funds for the Central Universities (Grant No. SK2020018). It was also part of the SERVICEGAP project, which is funded by the European Commission, Research Directorate General as part of the 7th Framework Programme, Theme 8: Socio-Economic Sciences and Humanities, Grant Agreement No.: 244 552.

Acknowledgments

The authors gratefully acknowledge the helpful comments from anonymous reviewers; Mary O’Mahony, King’s College London; Stanley Siebert, University of Birmingham.

Conflicts of Interest

The authors declare no conflict of interest.

Appendix A

Table A1. The supply of graduates in the European labour market (2000–2007).
DenmarkTeacher training and education scienceNumber3902GermanyTeacher training and education scienceNumber28,946FranceTeacher training and education scienceNumber22,890
Growth Rate1.69%Growth Rate7.51%Growth Rate17.36%
Share8.71%Share8.53%Share3.86%
Humanities and artsNumber6067Humanities and artsNumber41,494Humanities and artsNumber74,006
Growth Rate4.62%Growth Rate14.76%Growth Rate−10.06%
Share13.54%Share12.23%Share12.49%
Social sciences, business, and lawNumber12,659Social sciences, business, and lawNumber77,421Social sciences, business, and lawNumber238,926
Growth Rate8.66%Growth Rate8.07%Growth Rate−0.06%
Share28.25%Share22.81%Share40.31%
Science, mathematics, and computingNumber3774Science, mathematics, and computingNumber64,466Science, mathematics, and computingNumber74,472
Growth Rate3.26%Growth Rate10.26%Growth Rate−8.57%
Share8.42%Share10.35%Share12.56%
Engineering, manufacturing, and constructionNumber6797Engineering, manufacturing, and constructionNumber64,466Engineering, manufacturing, and constructionNumber113,773
Growth Rate3.94%Growth Rate1.58%Growth Rate4.95%
Share15.17%Share18.99%Share19.19%
Health and welfareNumber11,012Health and welfareNumber81,397Health and welfareNumber62,172
Growth Rate1.13%Growth Rate0.59%Growth Rate1.44%
Share24.58%Share23.98%Share10.49%
Agriculture, veterinary, and servicesNumber2125Agriculture, veterinary and servicesNumber18,800Agriculture, veterinary, and servicesNumber27,548
Growth Rate3.40%Growth Rate2.85%Growth Rate7.49%
Share4.74%Share5.54%Share4.65%
SpainTeacher training and education scienceNumber33,679ItalyTeacher training and education scienceNumber29,858The NetherlandsTeacher training and education scienceNumber16,112
Growth Rate1.89%Growth Rate27.44%Growth Rate5.99%
Share11.81%Share9.56%Share16.52%
Humanities and artsNumber26,096Humanities and artsNumber43,996Humanities and artsNumber7274
Growth Rate1.00%Growth Rate10.78%Growth Rate9.93%
Share9.15%Share14.08%Share7.46%
Social sciences, business, and lawNumber85,991Social sciences, business, and lawNumber106,352Social sciences, business, and lawNumber35,291
Growth Rate−2.63%Growth Rate8.50%Growth Rate8.06%
Share30.16%Share34.04%Share36.17%
Science, mathematics, and computingNumber29,799Science, mathematics, and computingNumber22,001Science, mathematics, and computingNumber6115
Growth Rate0.11%Growth Rate6.90%Growth Rate10.28%
Share10.45%Share7.04%Share6.27%
Engineering, manufacturing, and constructionNumber63,494Engineering, manufacturing, and constructionNumber49,135Engineering, manufacturing, and constructionNumber11,986
Growth Rate3.04%Growth Rate8.50%Growth Rate2.16%
Share22.27%Share15.73%Share12.29%
Health and welfareNumber37,200Health and welfareNumber46,662Health and welfareNumber18,525
Growth Rate4.28%Growth Rate8.96%Growth Rate3.23%
Share13.05%Share14.94%Share18.99%
Agriculture, veterinary, and servicesNumber23,774Agriculture, veterinary, and servicesNumber11,819Agriculture, veterinary, and servicesNumber4690
Growth Rate5.11%Growth Rate40.57%*Growth Rate10.36%
Share8.34%Share3.78%Share4.81%
The U.K.Teacher training and education scienceNumber61,295
Growth Rate4.52%
Share10.23%
Humanities and artsNumber92,093
Growth Rate4.70%
Share15.36%
Social sciences, business, and lawNumber177,706
Growth Rate4.55%
Share29.65%
Science, mathematics, and computingNumber91,621
Growth Rate1.17%
Share15.28%
Engineering, manufacturing, and constructionNumber90,149
Growth Rate0.83%
Share15.04%
Health and welfareNumber103,493
Growth Rate7.00%
Share17.27%
Agriculture, veterinary, and servicesNumber10,983
Growth Rate−5.22%
Share1.83%
Notes: 1. Number: the average number of graduates by education/training fields in the period 2000–2007. 2. Growth rate: the average growth rate of graduates by fields in the period 2000–2007. 3. Share: the average share for each field is calculated by dividing its average number of graduates by the average total number of graduates for each country. 4.* The number of graduates with a background in services is 1215 in 2000; however, this figure was dramatically increased to 9849 in 2001 in Italy. 5. The sum of shares for all education/training fields in each country does not precisely equal one—this is due to the fact that the number of graduates is estimated by an average value over periods. Source: Eurostat.

Appendix B

Table A2. The multinomial logit model (relative risk ratio)—Germany.
Basic Category: Non-Creative Jobs (Germany)The Creative JobsThe Creative JobsBohemian Jobs Bohemian Jobs Creative core Jobs Creative Core Jobs Creative Professional JobsCreative Professional Jobs
Model IModel II
Personal characteristics
Female0.921***1.133***0.929***0.778***0.628***0.841***1.238***1.530***
Age 1.176***1.292***1.292***1.394***1.231***1.352***1.142***1.240***
Non-native born n/an/an/an/an/an/an/an/a
Self-employment 2.925***3.561***31.174***18.867***2.211***2.714***2.055***2.351***
Part time0.442***0.332***0.488***0.215***0.590***0.374***0.361***0.310***
Higher education4.203*** 3.357*** 9.569*** 2.353***
Course characteristics
Education science and teaching training 4.057*** 0.000 5.412*** 2.280***
Humanities, arts, and language 2.407*** 10.962*** 1.613*** 1.876***
Social science, business, and law 3.429*** 0.873*** 1.215*** 7.999***
Science (exclude education science) 10.820*** 0.000 11.394*** 10.087***
Engineering and health welfare 4.034*** 0.489*** 3.646*** 5.222***
Location
Berlin0.953***1.219***1.662***1.712***0.807***1.205***1.035***1.166***
Time effectsn/an/an/an/an/an/an/an/a
Constant0.022***0.023***0.014***0.007***0.000***0.000***0.005***0.004***
Number of observations204,786179,694204,786179,694
Log pseudo-likelihood−114,571.63−103,982.69−203,454.19−174,039.64
LR: χ250,647.3236,158.4272,079.0074,486.80
Pseudo R20.1890.1480.1500.176
Notes: 1. In the first column in each table, the creative class was measured as a whole. 2. Drop observations with age above 27 in all countries. 3. Bohemian group is excluded due to insufficient observations in France. 4. The variable “educfild” is only accessible in 2003 in Germany. 5. Standard errors are not reported due to lack of space. 6. *** p < 0.01.
Table A3. The multinomial logit model (relative risk ratio)—Denmark.
Basic Category: Noncreative Jobs (Denmark)The Creative JobsThe Creative JobsBohemian Jobs Bohemian JobsCreative Core Jobs Creative Core Jobs Creative Professional Jobs Creative Professional Jobs
Model IModel II
Personal characteristics
Female0.804***0.882***0.579***0.641***0.640***0.628***0.9901.140***
Age 1.239***1.409***1.189***1.334***1.365***1.603***1.189***1.335***
Non-native born 1.158***1.339***0.9591.149***1.179***1.502***1.183***1.277***
Self-employment 5.955***6.243***3.400***3.963***3.337***3.211***8.350***8.840***
Part time0.549***0.451***1.0100.679***0.481***0.344***0.530***0.484***
Higher education4.484*** 2.663*** 5.467*** 4.281***
Course characteristics
Education science and teaching training 10.774*** 0.669*** 27.494*** 2.927***
Humanities, arts, and language 1.438*** 1.265*** 1.852*** 1.308***
Social science, business, and law 2.118*** 1.246*** 0.984*** 3.251***
Science (exclude education science) 3.105*** 1.969*** 5.128*** 2.630***
Engineering and health welfare 2.164*** 0.249*** 2.280*** 2.889***
Location
n/an/an/an/an/an/an/an/an/a
Time effects
Year 20040.586***0.556***0.599***0.562***0.725***0.654***0.526***0.511***
Year 20050.525***0.585***0.717***0.784***0.648***0.735***0.440***0.484***
Year 20060.621***0.627***0.536***0.515***0.696***0.652***0.606***0.639***
Year 20070.726***0.748***0.699***0.732***0.9650.9620.629***0.651***
Constant0.004***0.001***0.001***0.001***0.001***0.001***0.005***0.001***
Number of observations398,858398,858385,149398,858
Log pseudo-likelihood−189,757.31−198,438.44 −302,356.75−304,016.52
LR: χ2123,850.15106,487.88138,154.62134,835.08
Pseudo R20.2460.2120.1820.186
Notes: 1. In the first column in each table, the creative class was measured as a whole. 2. Drop observations with age above 27 in all countries. 3. Bohemian group is excluded due to insufficient observations in France. 4. The variable “educfild” is only accessible in 2003 in Germany. 5. Standard errors are not reported due to lack of space. 6. *** p < 0.01.
Table A4. The multinomial logit model (relative risk ratio)—The Netherlands.
Basic Category: Noncreative Jobs (The Netherlands)The Creative JobsThe Creative JobsBohemian Jobs Bohemian Jobs Creative Core Jobs Creative Core Jobs Creative Professional Jobs Creative Professional Jobs
Model IModel II
Personal characteristics
Female1.138***1.222***0.887***0.881***0.870***0.939***1.455***1.754***
Age 1.179***1.247***1.147***1.169***1.210***1.375***1.210***1.253***
Non-native born 0.758***0.706***0.609***0.580***0.870***0.752***0.702***0.729***
Self-employment 5.285***5.295***13.344***11.358***5.548***5.590***3.706***3.964***
Part time0.318***0.242***1.154***0.879***0.326***0.175***0.235***0.234***
Higher education2.750*** 2.134*** 8.571*** 1.455***
Course characteristics
Education science and teaching training 2.896*** 1.890*** 16.147*** 1.098***
Humanities, arts, and language 1.901*** 3.798*** 3.305*** 1.076***
Social science, business, and law 1.928*** 1.386*** 2.930*** 1.832***
Science (exclude education science) 3.318*** 1.314*** 10.609*** 2.448***
Engineering and health welfare 2.929*** 1.271*** 5.562*** 2.778***
Location
n/an/an/an/an/an/an/an/an/a
Time effects
Year 20071.272***1.271***1.595***1.568***1.169***1.208***1.256***1.249***
Constant0.016***0.003***0.001***0.001***0.001***0.000***0.014***0.005***
Number of observations834,041834,041834,041834,041
Log pseudo-likelihood−431,452.01−438,821.5 −65,1731.18−649,774.56
LR: χ2178,831.57164,092.59223,681.96227,595.20
Pseudo R20.1720.1560.1350.149
Notes: 1. In the first column in each table, the creative class was measured as a whole. 2. Drop observations with age above 27 in all countries. 3. Bohemian group is excluded due to insufficient observations in France. 4. The variable “educfild” is only accessible in 2003 in Germany. 5. Standard errors are not reported due to lack of space. 6. *** p < 0.01.
Table A5. The multinomial logit model (relative risk ratio)—France.
Basic Category: Noncreative Jobs (France)The Creative JobsThe Creative jobsBohemian Jobs Bohemian Jobs Creative core Jobs Creative core Jobs Creative professional Jobs Creative Professional Jobs
Model IModel II
Personal characteristics
Female0.984***1.141***2.424***n/a0.905***1.057***1.012***1.143***
Age 1.128***1.224***0.855***n/a1.224***1.343***1.084***1.173***
Non-native born 0.490***0.416***0.000n/a0.474***0.404***0.495***0.468***
Self-employment 2.411***2.819***21.142***n/a0.418***0.870***3.994***0.410***
Part time0.525***0.520***0.154***n/a1.300***0.364***0.257***3.362***
Higher education3.315*** 8.768***n/a3.659*** 3.058***
Course characteristics
Education science and teaching training 0.000*** n/a 0.000 1.722***
Humanities, arts, and language 2.023*** n/a 2.292*** 1.320***
Social science, business, and law 1.529*** n/a 0.887*** 1.815***
Science (exclude education science) 3.832*** n/a 4.853*** 2.923***
Engineering and health welfare 2.176*** 1.918*** 2.333***
Location
Île de France2.586***2.798***4.599***n/a2.006***2.214***3.019***3.090***
Time effects
Year 20070.888***0.939***2.131***n/a0.890***0.940***0.856***0.872***
Constant0.019***0.003***0.033***n/a0.001***0.000***0.033***0.005***
Number of observations873,167873,167873,167877,314
Log pseudo-likelihood−474,748.66−488,767.79−677,894.66−65,1771.2
LR: χ2172,907.08144,868.82223,587.20199,697.07
Pseudo R20.1500.1290.1410.133
Notes: 1. In the first column in each table, the creative class was measured as a whole. 2. Drop observations with age above 27 in all countries. 3. Bohemian group is excluded due to insufficient observations in France. 4. The variable “educfild” is only accessible in 2003 in Germany. 5. Standard errors are not reported due to lack of space. 6. *** p < 0.01.
Table A6. The multinomial logit model (relative risk ratio)—Spain.
Basic Category: Noncreative Jobs (Spain)The Creative JobsThe Creative JobsBohemian Jobs Bohemian Jobs Creative Core Jobs Creative Core Jobs Creative Professional Jobs Creative Professional Jobs
Model IModel II
Personal characteristics
Female1.183***1.436***0.956***0.797***1.050***1.395***1.354***1.618***
Age 1.124***1.218***1.031***1.094***1.196***1.329***1.087***1.163***
Non-European ethnicity n/an/an/an/an/an/an/an/a
Self-employment 1.582***1.541***1.361***1.162***1.672***1.756***1.541***1.473***
Part time0.937***0.971***2.153***1.975***1.085***1.098***0.716***0.754***
Higher education6.624*** 5.713*** 78.530*** 4.078***
Course characteristics
Education science and teaching training 2.312*** 1.602*** 4.001*** 1.059***
Humanities, arts, and language 1.555*** 1.488*** 0.865*** 2.248***
Social science, business, and law 3.245*** 0.105*** 3.830*** 4.062***
Science (exclude education science) 3.230*** 0.169*** 4.145*** 3.463***
Engineering and health welfare 2.243*** 0.498*** 2.844*** 2.340***
Location
Madrid1.400***1.496***2.297***2.759***1.543***1.663***1.166***1.212***
Time effects
Year 20051.0431.0050.619***0.641***1.213***1.115***0.9900.972
Year 20060.912***0.912***0.751***0.780***0.727***0.707***1.111***1.118***
Year 20071.134***1.142***0.706***0.748***1.127***1.075***1.251***1.295***
Constant0.010***0.004***0.007***0.008***0.004***0.000***0.023***0.005***
Number of observations857,402857,402857,402857,402
Log pseudo-likelihood−524,212.57−544,636.73−888,362.7−886,139.08
LR: χ2140,081.0799,232.74182,091.68186,538.92
Pseudo R20.1180.1000.1000.101
Notes: 1. In the first column in each table, the creative class was measured as a whole. 2. Drop observations with age above 27 in all countries. 3. Bohemian group is excluded due to insufficient observations in France. 4. The variable “educfild” is only accessible in 2003 in Germany. 5. Standard errors are not reported due to lack of space. 6. *** p < 0.01.
Table A7. The multinomial logit model (relative risk ratio)—The UK.
Basic Category: Noncreative Jobs (The UK)The Creative JobsThe Creative Jobs Bohemian Jobs Bohemian Jobs Creative Core JobsCreative Core Jobs Creative Professional Jobs Creative Professional Jobs
Model I Model II
Personal characteristics
Female0.772***0.778***0.671***0.666***0.705***0.660***0.837***0.871***
Age 1.212***1.262***1.153***1.230***1.323***1.369***1.171***1.214***
Non-native born 0.681***0.651***0.582***0.567***0.748***0.824***0.658***0.587***
Self-employment 4.147***4.348***12.929***12.189***1.802***1.951***3.017***3.295***
Part time0.231***0.194***0.589***0.416***0.193***0.167***0.190***0.165***
Higher education3.320*** 2.467*** 5.098*** 2.802***
Course characteristics
Education science and teaching training 14.005*** 1.932*** 51.404*** 2.108***
Humanities, arts, and language 1.743*** 2.394*** 2.643*** 1.229***
Social science, business, and law 1.512*** 0.109*** 0.955 2.276***
Science (exclude education science) 2.744*** 1.108*** 5.427*** 2.034***
Engineering and health welfare 2.239*** 0.598*** 3.552*** 2.235***
Location
Greater London1.642***1.685***1.448***1.372***1.309***1.405***1.942***1.964***
Time effects
Year 20050.958***1.0131.107***1.132***0.775***0.841***1.036***1.081***
Year 20061.0251.042***1.0571.0671.0341.1071.0101.001
Year 20071.039***1.082***1.527***1.610***1.0461.154***0.926***0.933***
Constant0.006***0.003***0.001***0.001***0.000***0.000***0.007***0.004***
Number of observations3,103,4382,831,6533,103,4382,831,653
Log pseudo-likelihood−1,052,677.9−1,000,545−1,580,955.1−1,462,517.6
LR: χ2934,534.77877,983.471,030,645.711,077,105.96
Pseudo R20.3070.3050.2460.269
Notes: 1. In the first column in each table, the creative class was measured as a whole. 2. Drop observations with age above 27 in all countries. 3. Bohemian group is excluded due to insufficient observations in France. 4. The variable “educfild” is only accessible in 2003 in Germany. 5. Standard errors are not reported due to lack of space. 6. *** p < 0.01.
Table A8. The multinomial logit model (relative risk ratio)—Italy.
Basic Category: Noncreative Jobs (Italy)The Creative JobsThe Creative JobsBohemian Jobs Bohemian Jobs Creative Core JobsCreative Core Jobs Creative Professional Jobs Creative Professional Jobs
Model IModel II
Personal characteristics
Female0.682***1.074***0.591***0.694***0.6591.482***0.719***1.082***
Age 1.096***1.202***1.0081.058***1.3171.585***1.084***1.164***
Non-native born 1.264***1.205***0.582***0.598***0.9890.794***1.495***1.462***
Self-employment 2.990***3.216***3.620***3.577***3.2633.634***2.781***3.001***
Part time0.588***0.493***1.971***1.417***0.6490.428***0.432***0.396***
Higher education4.346*** 2.999*** 15.230 3.241***
Course characteristics
Education science and teaching training 0.854*** 1.214*** 1.032 0.781***
Humanities, arts, and language 1.141*** 2.239*** 1.246*** 0.874***
Social science, business, and law 1.570*** 0.560*** 1.504*** 1.922***
Science (exclude education science) 1.764*** 1.954*** 2.844*** 1.539***
Engineering and health welfare 3.233*** 1.509*** 7.880*** 3.074***
Location
Lazio+ Piemonte0.801***0.749***0.9960.885***0.814***0.719***0.755***0.728***
Time effects
Year 20051.045***1.150***1.534***1.570***0.949***1.119***0.965***1.067***
Year 20060.991***1.068***1.054***1.086***0.774***0.868***1.0431.129***
Year 20070.910***1.025***1.0101.0550.829***1.0000.912***1.029***
Constant0.043***0.004***0.024***0.008***0.000***0.000***0.046***0.006***
Number of observations1,138,1871,135,5031,138,1871,135,503
Log pseudo-likelihood−601,387.15−622,783.92−899,096.25−914,481.76
LR: χ2247,311.47201,991.70345,521.23311,864.95
Pseudo R20.1710.1400.1610.145
Notes: 1. In the first column in each table, the creative class was measured as a whole. 2. Drop observations with age above 27 in all countries. 3. Bohemian group is excluded due to insufficient observations in France. 4. The variable “educfild” is only accessible in 2003 in Germany. 5. Standard errors are not reported due to lack of space.6. *** p < 0.01.

Appendix C

Figure A1. The average ranking by education background for each creative job outcome.
Sustainability 12 07761 g0a1

References

  1. World Economic Forum. The Future of Jobs: Employment, Skills and Workforce Strategy for the Fourth Industrial Revolution. 2016. Available online: https://www.weforum.org/reports/the-future-of-jobs (accessed on 18 September 2020).
  2. International Labor Organization (ILO). Youth Employment Programme, ILO’s Youth Employment Brochure; ILO: Geneva, Switzerland, 2017. [Google Scholar]
  3. Cebrián, C.; Junyent, M.; Mulà, I. Competencies in education for sustainable development: Emerging teaching and research developments. Sustainability 2020, 12, 579. [Google Scholar] [CrossRef] [Green Version]
  4. Organisation for Economic Co-operation and Development (OECD). Learning for Jobs; OECD Publishing: Paris, France, 2010. [Google Scholar] [CrossRef]
  5. Organisation for Economic Co-operation and Development (OECD). Skills for Social Progress: The Powers of Social and Emotional Skills; OECD Skills Studies; OECD Publishing: Paris, France, 2015. [Google Scholar] [CrossRef]
  6. Wals, A.E.J. Mirroring, Gestaltswitching and transformative social learning: Stepping stones for developing sustainability competence. Int. J. Sustain. High. Educ. 2010, 11, 380–390. [Google Scholar] [CrossRef]
  7. Probst, L.; Bardach, L.; Kamusingize, D.; Templer, N.; Ogwali, H.; Owamani, A.; Mulumba, L.; Onwonga, R.; Adugna, B.T. A transformative university learning experience contributes to sustainability attitudes, skills and agency. J. Clean. Prod. 2019, 232, 648–656. [Google Scholar] [CrossRef]
  8. Sutton, S.G.; Gyuris, E. Optimizing the environmental attitudes inventory. Int. J. Sustain. High. Educ. 2015, 16, 16–33. [Google Scholar] [CrossRef]
  9. Paphitis, A.; Kelland, L. The university as a site for transformation: Developing civic-minded graduates at South African institutions through an epistemic shift in institutional culture. Educ. Chang. 2016, 20, 184–203. [Google Scholar] [CrossRef] [PubMed] [Green Version]
  10. Wals, A.E.J. Afterword: Ethical Literacies and Sustainability Education: Young People, Subjectivity and Democratic Participation. In Ethical Literacies and Education for Sustainable Development; Franck, O., Osbeck, C., Eds.; Palgrave Macmillan: Cham, Switzerland, 2017; pp. 163–167. [Google Scholar] [CrossRef]
  11. Biedenweg, K.; Monroe, M.C.; Oxarart, A. The importance of teaching ethics of sustainability. Int. J. Sustain. High Educ. 2013, 14, 6–14. [Google Scholar] [CrossRef]
  12. Schultz, T.W. Investment in human capital. Am. Econ. Rev. 1961, 51, 1–17. Available online: https://www.jstor.org/stable/1818907 (accessed on 18 September 2020).
  13. Becker, G.S. Human Capital: A Theoretical and Empirical Analysis, with Special Reference to. Education; Columbia University Press: New York, NY, USA, 1975. [Google Scholar]
  14. Goode, R.B. Adding to the stock of physical and human capital. Am. Econ. Rev. 1959, 49, 147–155. Available online: https://www.jstor.org/stable/i331502 (accessed on 18 September 2020).
  15. Zhao, K.; Zhang, Y.S.; Zhao, J.K.; Li, X.J. Understanding Contributions of the Creative Class to Sustainable Economic Growth in China. Sustainability 2020, 12, 1304. [Google Scholar] [CrossRef] [Green Version]
  16. Barro, R.J. Government spending in a simple model of endogenous growth. J. Polit. Econ. 1990, 98, 103–125. [Google Scholar] [CrossRef] [Green Version]
  17. Glaeser, E.L. The Triumph of City; Penguin Books: New York, NY, USA, 2011. [Google Scholar]
  18. Jones, R.; Chiripanhura, B. Measuring the UK’s human capital stock. Econ. Labour Mark. Rev. 2010, 4, 36–63. [Google Scholar] [CrossRef]
  19. Florida, R. The Rise of the Creative Class; Basic Books: New York, NY, USA, 2002. [Google Scholar]
  20. Florida, R. The Rise of the Creative Class, 10th ed.; Basic Books: New York, NY, USA, 2013. [Google Scholar]
  21. Obiols-Homs, F.; Sánchez-Marcos, V. Education Outcomes and the Labor Market. Labour Econ. 2018, 54, 14–28. [Google Scholar] [CrossRef]
  22. Böckerman, P.; Bryson, A.; Viinikainen, J.; Hakulinen, C.; Pulkki-Råback, L.; Raitakari, O.; Pehkonene, J. Biomarkers and long-term labour market outcomes: The case of creatine. J. Econ. Behav. Organ. 2017, 142, 259–274. [Google Scholar] [CrossRef] [Green Version]
  23. Knight, J.; Deng, Q.H.; Shi, L. China’s expansion of higher education: The labour market consequences of a supply shock. China Econ. Rev. 2017, 43, 127–141. [Google Scholar] [CrossRef] [Green Version]
  24. Aina, C.; Casalone, G. Early labor market outcomes of university graduates: Does time to degree matter? Socio. Econ. Plan. Sci. 2020, 71, 127–141. [Google Scholar] [CrossRef]
  25. Dolado, J.J.; Felgueroso, F.; Jimeno, J.F. Youth labour markets in Spain: Education, training and crowding-out. Eur. Econ. Rev. 2000, 44, 943–958. [Google Scholar] [CrossRef] [Green Version]
  26. Vygotsky, L.S. Mind in Society: The Development of Higher Psychological Process; Harvard University Press: London, UK, 1978. [Google Scholar]
  27. McGuigan, M.; McNally, S.; Wyness, G. Student Awareness of Costs and Benefits of Educational Decisions: Effects of an Information Campaign. J. Hum. Cap. 2016, 10, 482–519. [Google Scholar] [CrossRef] [Green Version]
  28. Garrecht, C.; Bruckermann, T.; Harms, U. Students’ Decision-Making in Education for Sustainability-Related Extracurricular Activities—A Systematic Review of Empirical Studies. Sustainability 2018, 10, 3876. [Google Scholar] [CrossRef] [Green Version]
  29. Hesselbarth, C.; Schaltegger, S. Educating change agents for sustainability -learnings from the first sustainability management master of business administration. J. Clean. Prod. 2014, 62, 24–36. [Google Scholar] [CrossRef]
  30. WCED. Our Common Future. Report of the World Commission on Environment and Development: Our Common Future. 1987. Available online: http://www.undocuments.net/our-common-future.pdf (accessed on 18 September 2020).
  31. United Nations (UN). Agenda for Sustainable Development. Resolution Adopted by the General Assembly on 25 September 2015 (A/70/L.1); UN: New York, NY, USA, 2015. [Google Scholar]
  32. UNESCO. Education for Sustainable Development Goals: Learning Objectives; UNESCO: Paris, France, 2017; Available online: https://ees.elsevier.com/sys/default.asp (accessed on 18 September 2020).
  33. Habibi, F.; Zabardast, M.A. Digitalization, education and economic growth: A comparative analysis of Middle East and OECD countries. Technol. Soc. 2020, 63, 101370. [Google Scholar] [CrossRef]
  34. Fortuin, J.; Bush, R. Educating students to cross boundaries between disciplines and cultures and between theory and practice. Int. J. Sustain. High. Educ. 2011, 11, 19–35. [Google Scholar]
  35. Picatoste, J.; Pérez-Ortiz, L.; Ruesga-Benito, S. A new educational pattern in response to new technologies and sustainable development. Enlightening ICT skills for youth employability in the European Union. Telemat. Inform. 2018, 35, 1031–1038. [Google Scholar] [CrossRef]
  36. Van Laar, E.; Van Deursen, A.J.A.M.; Van Dijk, J.A.G.M.; De Haan, J. The relation between 21st-century skills and digital skills: A systematic literature review. Comput. Hum. Behav. 2017, 72, 577–588. [Google Scholar] [CrossRef]
  37. World Economic Forum. The Future of Jobs Report. 2018. Available online: http://www3.weforum.org/docs/WEF_Future_of_Jobs_2018.pdf (accessed on 18 September 2020).
  38. Taylor, E.W.; Cranton, P. The Handbook of Transformative Learning: Theory, Research, and Practice; John Wiley & Sons: San Francisco, CA, USA, 2012. [Google Scholar]
  39. Brunstein, J.; King, J. Organizing reflection to address collective dilemmas: Engaging students and professors with sustainable development in higher education. J. Clean. Prod. 2018, 203, 153–163. [Google Scholar] [CrossRef]
  40. Kostopoulos, G.; Kotsiantis, S.; Pierrakeas, C.; Koutsonikos, G.; Gravvanis, G.A. Forecasting students’ success in an open university. Int. J. Learn. Technol. 2018, 13, 26–43. [Google Scholar] [CrossRef]
  41. Wright, M.F.; Cain, K.D.; Monsour, F.A. Beyond sustainability: A context for transformative curriculum development. Transform. Dialog. Teach. Learn. J. 2015, 8, 1–19. [Google Scholar]
  42. McCunney, D. Shaped by campus culture: Intersections between transformative learning, civic engagement, and institutional mission. J. High. Educ. Outreach Engag. 2017, 21, 61–68. [Google Scholar]
  43. Kelly, E.; O’Connel, P.J.; Smyth, E. The economics returns to field of study and competencies among higher education graduates in Ireland. Econ. Educ. Rev. 2010, 29, 650–657. [Google Scholar] [CrossRef] [Green Version]
  44. Riddel, W.C.; Song, X. The impact of education on unemployment incidence and re- employment success: Evidence from the U.S. labour market. Lab. Econ. 2011, 18, 453–463. [Google Scholar] [CrossRef] [Green Version]
  45. Aina, C.; Casalone, G.; Raitano, M. Age at graduation and its reflections in early career prospects. Stud. High Educ. 2019, 45, 1121–1132. [Google Scholar] [CrossRef]
  46. Altonji, J.G.; Dunn, T.A. The effects of family characteristics on the return to education. Rev. Econ. Stat. 1996, 78, 692–704. [Google Scholar] [CrossRef]
  47. UNESCO. Strategy for the Second Half of the United Nations Decade of Education for Sustainable Development; UNESCO: Paris, France, 2010; Available online: https://unesdoc.unesco.org/ark:/48223/pf0000215466?posInSet=1&queryId=137fa437-1687-421d-b558-65c2ec98385c (accessed on 18 September 2020).
  48. Blau, F.M.; Kahn, L. Gender differences in pay. J. Econ. Perspect. 2000, 14, 75–99. [Google Scholar] [CrossRef] [Green Version]
  49. Altonji, J.G.; Blank, R.M. Chapter 48 Race and gender in the labor market. Handb. Labor Econ. 1999, 3, 3143–3259. [Google Scholar]
  50. Bos, P.A.; Terburg, D.; Van Honk, J. Testosterone decreases trust in socially naïve humans. Proc. Natl. Acad. Sci. USA PNAS 2010, 107, 9991–9995. [Google Scholar] [CrossRef] [PubMed] [Green Version]
  51. Rumberger, R.; Thomas, S.L. The economic returns to college major, qualityand performance: A multilevel analysis of recent graduates. Econ. Educ. Rev. 1993, 12, 1–19. [Google Scholar] [CrossRef]
  52. Valiente, O. The OECD skills strategy and the education agenda for development. Int. J. Educ. Dev. 2014, 39, 40–48. [Google Scholar] [CrossRef]
  53. Mason, G.; Williams, G.; Cranmer, S. Employability skills initiatives in higher education: What effects do they have on graduate labour market outcomes. Educ. Econ. 2009, 17, 1–30. [Google Scholar] [CrossRef]
  54. Paglin, M.; Rufolo, A.M. Heterogeneous human capital, occupational choice, and male-female earnings differences. J. Labor. Econ. 1990, 8, 123–144. [Google Scholar] [CrossRef]
  55. Naylor, R.A.; Smith, J.; Mcknight, A. Graduate Employability: Policy and Performance in Higher Education in the UK. Econ. J. 2010, 110, 382–411. [Google Scholar]
  56. Koda, Y.; Yuki, T. The labor market outcomes of two forms of cross-border higher education degree programs between Malaysia and Japan. Int. J. Educ. Dev. 2013, 33, 367–379. [Google Scholar] [CrossRef]
  57. Peter, F.H.; Zambre, V. Intended college enrollment and educational inequality: Do students lack information? Econ. Educ. Rev. 2017, 60, 125–141. [Google Scholar] [CrossRef] [Green Version]
  58. Peck, J. The struggling with creative class. Int. J. Urban Reg. 2005, 29, 740–770. [Google Scholar] [CrossRef]
  59. Scott, A.J. Beyond the creative city: Cognitive-cultural capitalism and the new urbanism. Reg. Stud. 2014, 48, 565–578. [Google Scholar] [CrossRef] [Green Version]
  60. Asheim, B.; Hansen, H.K. Knowledge bases, talents, and contexts: On the usefulness of the creative class approach in Sweden. Econ. Geogr. 2009, 85, 425–442. [Google Scholar] [CrossRef]
  61. Comunian, R.; Faggian, A.; Li, Q.C. Unrewarded careers in the creative class: The strange case of bohemian graduates. Pap. Reg. Sci. 2010, 89, 389–410. [Google Scholar] [CrossRef]
  62. Carr, J.; Creative Industries, Creative Workers and the Creative Economy: A Review of Selected Recent Literature. Scottish Government Social Research. 2009. Available online: http://www.scotland.gov.uk/resource/doc/289922/0088836.pdf (accessed on 11 November 2013).
  63. Stam, E.; Jong, J.P.J.; Marlet, G. Creative industries in Netherland: Structure, development, innovativeness and effects on urban growth. Geogr. Ann. Ser. B Hum. Geogr. 2008, 90, 119–132. [Google Scholar] [CrossRef]
  64. Hurley, J.; Fernández-Macías, E.; Storrie, D. Employment Polarisation and Job Quality in the Crisis: European Jobs Monitor; Eurofound: Dublin, UK, 2013. [Google Scholar]
  65. Otero, M.S.; Whitworth, A. Equality in Higher Education in Spain and the UK: Mismatch between Rhetoric and Policy? High. Educ. Res. Dev. 2010, 60, 167–186. [Google Scholar] [CrossRef] [Green Version]
  66. Charron, N.; Dijkstra, L.; Lapuente, V. Regional governance matters: Quality of government within European Union member states. Reg. Stud. 2014, 48, 68–90. [Google Scholar] [CrossRef]
  67. Faggian, A.; McCann, P. Human capital, graduate migration and innovation in British Regions. CAMB J. Econ. 2009, 33, 317–333. [Google Scholar] [CrossRef] [Green Version]
  68. O’Connar, J. The definitions of the “cultural industries”. Eur. J. Arts Educ. 2000, 2, 15–27. [Google Scholar]
  69. Barković, I.; Borozan, D. The EU Strategy for Growth and Jobs: Novelties of the Renewed Lisbon Strategy. In European Union at the Crossroads: The Need for Constitutional and Economic Changes; Chapter: Changes in the Field of European Union, Policies; Maliszewska-Nienartowicz, J., Ed.; Nicolas Copernicus University: Torun, Poland, 2007; pp. 188–201. [Google Scholar]
  70. Colignon, S.; Dehousse, F. The Lisbon Strategy and the Open Method of Co-Ordination. Policy Paper No. 12; Notre Europe: 2005.. Available online: http://www.stefancollignon.de/PDF/Notre%20Europe%20Policypaper12-en.pdf (accessed on 18 September 2020).
  71. Organisation for Economic Co-operation and Development (OECD). OECD Skills Strategy 2019: Skills to Shape a Better Future; OECD Publishing: Paris, France, 2019. [Google Scholar] [CrossRef]
  72. Organisation for Economic Co-operation and Development (OECD). Getting Skills Right: Future-Ready Adult Learning Systems; OECD Publishing: Paris, France, 2019. [Google Scholar] [CrossRef]
  73. World Economic Forum. Human Capital as an Asset: An Accounting Framework to Reset the Value of Talent in the New World of Work. 2020. Available online: http://www3.weforum.org/docs/WEF_NES_HR4.0_Accounting_2020.pdf (accessed on 18 September 2020).
  74. UNESCO; ILO. Taking a Whole of Government Approach to Skills Development; The United Nations Educational, Scientific and Cultural Organization: Paris, France; The International Labour Organization: Geneva, Switzerland, 2018. [Google Scholar]
  75. Organisation for Economic Co-operation and Development (OECD). Strengthening the Governance of Skills Systems: Lessons from Six OECD Countries; OECD Skills Studies; OECD Publishing: Paris, France, 2020. [Google Scholar] [CrossRef]
  76. Tosun, M.; Akin, A.; Simsek, F. Courses on Specialized Field in Undergraduate Programs of Translation & Interpretation Departments in Turkey: The Importance of Courses on Specialized Field in the Specialization Process of Translator Candidates. Procedia Soc. Behav. Sci. 2015, 192, 4–10. [Google Scholar]
  77. Ndou, V.; Mele, G.; Del Vecchio, P. Entrepreneurship education in tourism: An investigation among European Universities. J. Hosp. Leis. Sport Tour. Educ. 2019, 25, 100175. [Google Scholar] [CrossRef]
  78. Voûte, E.; Stappers, P.J.; Giaccardi, E.; Mooij, S.; Van Boeijen, A. Innovating a Large Design Education Program at a University of Technology. She Ji J. Des. Econ. Innov. 2020, 6, 50–66. [Google Scholar] [CrossRef]
  79. Machin, S.; McNally, S.; Tertiary Education Systems and Labour Markets. A Paper Commissioned by the Education and Training Policy Division, OECD, for the Thematic Review of Tertiary Education. 2007. Available online: https://www.researchgate.net/publication/253144232_Tertiary_Education_Systems_and_Labour_Markets (accessed on 18 September 2020).
  80. Kluve, J. The effectiveness of European active labor market programs. Labour Econ. 2010, 17, 904–918. [Google Scholar] [CrossRef]
  81. Herman, E. Education’s Impact on the Romanian Labour Market in the European Context. Procedia Soc. Behav. Sci. 2012, 46, 5563–5567. [Google Scholar] [CrossRef] [Green Version]
  82. Ţiţan, E.; Burciu, A.; Manea, D.; Ardelean, A. From Traditional to Digital: The Labour Market Demands and Education Expectations in an EU Context. Procedia Econ. Financ. 2014, 10, 269–274. [Google Scholar] [CrossRef] [Green Version]
  83. Balestra, S.; Backes-Gellner, U. Heterogeneous returns to education over the wage distribution: Who profits the most? Labour Econ. 2017, 44, 89–105. [Google Scholar] [CrossRef] [Green Version]
  84. Patacchini, E.; Rainone, E.; Zenou, Y. Heterogeneous peer effects in education. J. Econ. Behav. Organ. 2017, 134, 190–227. [Google Scholar] [CrossRef] [Green Version]
Figure 1. The interconnection between learning contexts, skills, and social progress (adapted from OECD, 2015 [5]).
Sustainability 12 07761 g001
Figure 2. The interconnections between education backgrounds, sustainability competencies, and job outcomes.
Sustainability 12 07761 g002
Table 1. Trending skills demanded in 2022 (from Future of Job Survey 2018, World Economic Forum [37]).
Trending, 2022
Analytical thinking and innovation
Active learning and learning strategies
Creativity, originality and initiative
Technology design and programming
Critical thinking and analysis
Complex problem-solving
Leadership and social influence
Emotional intelligence
Reasoning, problem-solving and ideation
System analysis and evaluation
Table 2. Sample size.
CountryActualWeightedTime Period
The U.K.15662,831,6532004–2007
France6209877,3142006–2007
Spain2662859,1352003–2004,2006–2007
Italy96251,138,1872004–2007
The Netherlands5101834,0412006–2007
Denmark3105400,0292003–2007
Germany793204,7862003
Table 3. Demand for creative workers.
The U.K.FranceSpainItalyGermanyThe NetherlandsDenmark
NumberShareNumberShareNumberShareNumberShareNumberShareNumberShareNumberShare
Total workforce27,139,629100%23,823,060100%16,661,549100%21,696,648100%37,428,520100%8103,937100%2,706,812100%
Decomposed based on education
Workers with a university degree8,599,67132%6,403,62727%5,056,15430%2,965,14114%9,856,86526%2,377,80329%772,97029%
Workers without a university degree18,539,95868%17,419,43373%11,605,39570%18,731,50786%27,571,65674%5,726,13471%1,933,84171%
Total 100% 100% 100% 100% 100% 100% 100%
Decomposed based on education and situation
New workers with a university degree250,4680.92%238,7941.00%149,9550.90%66,7590.31%199,3800.53%117,2631.45%33,6431.24%
New workers without a university degree665,4682.45%374,7121.57%208,7461.25%241,8051.11%1,058,2022.83%583,6747.20%155,8585.76%
Total 3.37% 2.58% 2.15% 1.42% 3.36% 8.65% 7.00%
Decomposed based education, situation and occupation
New creative workers with a university degree142,4110.52%133,8420.56%86,8840.52%44,1230.20%148,2640.40%73,0960.90%21,6350.80%
New creative workers without a university degree53,6550.20%55,9510.23%25,1790.15%50,4140.23%237,1530.63%84,4801.04%14,8490.55%
Total 0.72% 0.80% 0.67% 0.44% 1.03% 1.94% 1.35%
Note: All shares in this table are calculated based on the average number of total workforce in each country. For example, in the U.K., the share of new workers with a university degrees = 250,468/2,7139,629 = 0.92%. Source: The European Labour Force Survey.

