Article

Evaluation of the Temporal and Spatial Changes of Ecological Quality in the Hami Oasis Based on RSEI

1
School of Geography and Tourism, Xinjiang Normal University, Urumqi 830054, China
2
Urbanization Development Research Center of the Silk Road Economic Belt, Xinjiang Normal University, Urumqi 830054, China
*
Author to whom correspondence should be addressed.
Sustainability 2020, 12(18), 7716; https://doi.org/10.3390/su12187716
Submission received: 17 August 2020 / Revised: 15 September 2020 / Accepted: 16 September 2020 / Published: 18 September 2020

Abstract

:
Given the restrictions on special geographic locations in development processes, the measurement and analysis of the ecological quality of the Hami Oasis are of great significance for the protection of this fragile oasis. In this study, the ecological quality of the Hami Oasis was monitored by constructing a remote sensing ecological index (RSEI) for arid areas. Using the standard deviation ellipse and moving window method, the ecological status and space–time changes were explored for both their external and internal factors in the Hami Oasis. Finally, a geo-detector was employed to determine the driving factors of the ecological quality of the Hami Oasis. The results revealed that: (1) In the remote sensing ecological index constructed in the Hami Oasis, the main influencing factors were dryness and wetness. The average value of the ecological quality of the oasis was less than 0.5, and the ecological quality level was relatively poor. Among the five grades of ecological quality in the Hami Oasis, the poor grade and the good grade showed the largest changes, decreasing by 200 and increasing by 300, respectively, which were mainly concentrated in the periphery of the oasis. (2) The improved ecological quality of the Hami Oasis was mainly manifested in the expansion of the artificial oasis, while the deteriorated area was manifested as an increase in the built-up area. Moreover, the ecological quality of the Hami Oasis presented a ringlike nesting distribution pattern from the internal built-up area to the artificial oasis periphery. (3) The external expansion direction of the ecological quality of the Hami Oasis featured southeast–northwest expansion, which was consistent with the direction of the rivers and traffic roads. The transformation between different ecological qualities in the oasis and the expansion of the built-up area were the reasons for the fragmentation of the Hami Oasis’ landscape. (4) Compared to a single factor, the dual-factor for the ecological quality of the Hami Oasis had stronger explanatory power. Moreover, changes in land use types caused changes in the ecological quality of the Hami Oasis. During the study period, we found that human activities had a more significant impact than natural factors on the development of the Hami Oasis. (5) The Moran’s I Index increased from 0.835268 in 2000 to 0.923976 in 2018, and the p values in the study area all reached a 0.05 significant level. At the same time, the areas with p values above the 0.01 and 0.001 significant levels have also increased significantly in the past 18 years.

1. Introduction

Oases—human settlements that have developed agriculture and animal husbandry in fragile ecological environments—are located in the arid regions in China and around the world [1,2,3]. An oasis provides people with opportunities to settle and produce by providing a more suitable environment than the surrounding desert [4]. Although the expansion of an oasis contributes to economic growth and sufficient food production [5], this expansion can cause many environmental problems, such as dust storms, groundwater decline, desertification, salinization, and soil organic carbon decline [6], as well as disrupt the ecosystem Integrity, thus increasing the risk of sustainable development in an oasis [7]. The land degradation caused by poor land management and climate change is one of the most prominent global environmental problems [8,9]. In arid and semiarid regions, land degradation is often referred to as “desertification”, which may lead to the continuous loss of ecosystem functions and pose a serious threat to the sustainable livelihoods in already ecologically fragile areas [10]. Over recent decades, the amount of desertified land has grown globally due to the intensification of land-use activities, such as overcultivation, overgrazing, and fuelwood collection, as well as shifts in climate [11]. This trend is expected to continue, particularly in arid regions in northwestern China, where there are increasing human population pressures and warming and drought due to climate change [12,13].
Recent research has focused on oasis land-use changes and their driving mechanisms [14,15,16,17,18,19,20], the mapping and assessment of oasis desertification [21,22,23,24], oasis soil biodiversity [25], the relationship between oasis land use/cover changes and water environment responses [26,27,28], and assessing the ecological effects of agricultural oasis changes [29].
Currently, there are few studies on the quality of the ecological environment of oases. Due to the large area of arid land, it is extremely urgent to find an effective monitoring method. Remote sensing—a real-time ground observation method that can cover a large area and offer rapid and periodic repeated observations—is widely used in environmental monitoring and ecological research. Various remote sensing indexes have been used for the monitoring and evaluation of ecosystems in forests [30], grasslands [31], cities [32], rivers, and river basins [33,34] and have become an important part of ecological research in the field of remote sensing [35,36]. The above-mentioned indexes all analyze a single index. With the development of remote sensing technology, these single-factor index methods for evaluating ecological environmental quality have also been improved to perform multielement comprehensive evaluation [37,38,39]. In 2006, the Ministry of Ecology and Environment of China issued the Ecological Environment Index (EI) based on multiple indicators. However, some problems have been found in practical applications [40]. Based on this, the present study uses remote sensing technology and the ecological environment index (RSEI) [41] to assess the ecological quality of an oasis; these methods have been widely used around the world [42,43,44,45,46]. RSEI can quickly monitor and evaluate the ecological quality of a region, which has practical significance and high credibility.
The Hami Oasis is distributed in a dot pattern in the arid region. Compared with other contiguous oases, there were many disadvantages in its development, such as a lack of water resources and a harsh climate. Therefore, it is particularly important to monitor the quality of its ecological environment. This paper analyzes the evolution of the ecological quality of the Hami Oasis to explore the sustainable development of the arid oasis. Analyzing the expansion and change of the oasis from the perspective of ecological quality is an important indicator and evaluation standard for achieving the sustainable development of the oasis. Otherwise, the expansion of the oasis without quality space and a lack of a healthy ecological environment will eventually cause the oasis to disappear more rapidly. To handle this problem, this paper constructs a remote sensing ecological index to reflect the ecological environmental quality of the Hami Oasis using the standard deviation ellipse method to analyze the overall expansion direction of the Hami Oasis’ quality space and the moving window method to analyze the transformation of different ecological qualities of the Hami Oasis from inside of the Hami Oasis. Finally, the geo-detector model is employed to explore the driving force of the Hami Oasis and makes relevant suggestions to provide a reference for the ecological development of oases in arid regions.

2. Materials and Methods
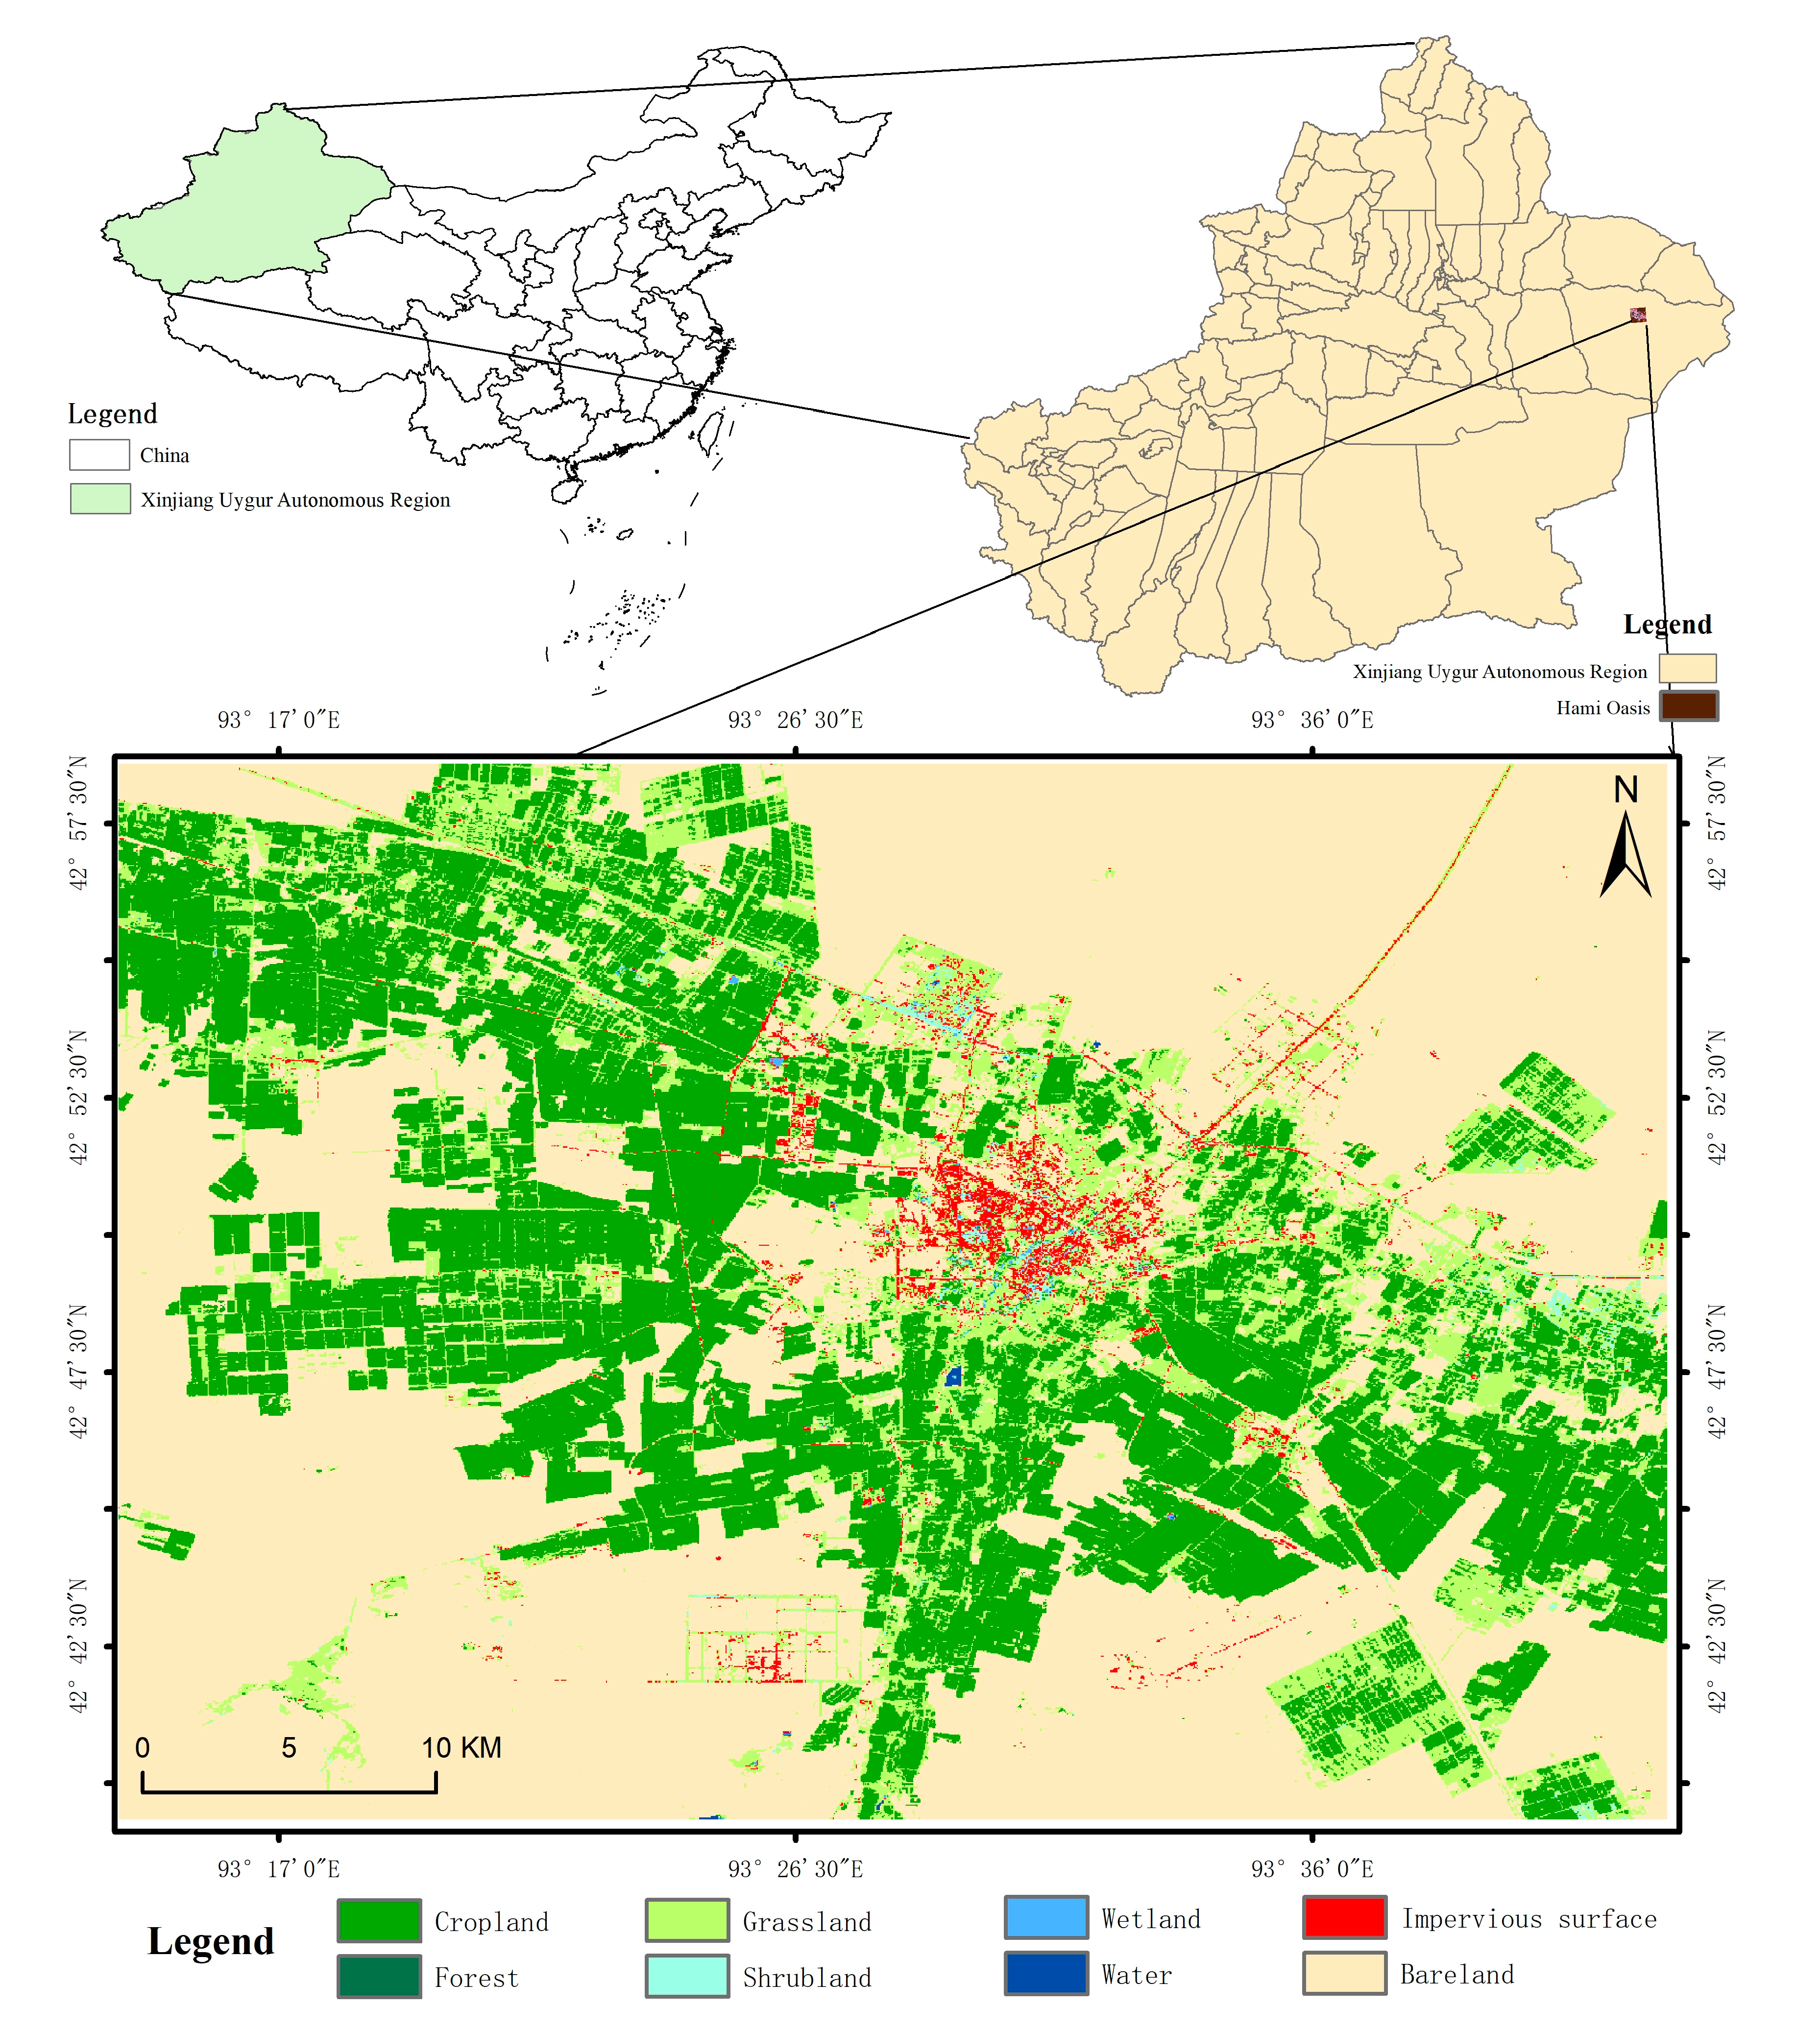
2.1. Study Area

Located in the eastern part of Xinjiang (40°52′~45°05′ N, 91°06′~96°23′ E), the Hami Oasis is the first oasis of the inland provinces entering Xinjiang and belongs to the administrative jurisdiction of Yizhou District, Hami City (Figure 1). The topography of the Hami Oasis is high in the middle and low in the north and south, with a large desert Gobi on the south side and an alluvial fan in the south of East Tianshan on the north side. Due to its location in an arid zone, the Hami Oasis has a typical temperate continental arid climate. The temperature difference between day and night in the oasis is large, the maximum daily difference is 26.7 °C, and the annual average temperature is only 9.8 °C. The average annual precipitation is only 33.8 mm, while the evaporation reaches as high as 3300 mm. The dry climate and widespread Gobi often produce some disastrous weather, including droughts, strong winds, low temperatures, freezing damage, dry hot winds, floating dust, and sandstorms that have a great impact on production and life. The main vegetation types of the Hami Oasis include desert shrub vegetation, represented by Ephedra; desert steppe vegetation, represented by Stipa; forest vegetation, represented by Siberian larch; shrub vegetation, represented by Nitraria; meadow vegetation, represented by alpine true meadows; and alpine vegetation, represented by alpine cushions. Flowing through the Hami Oasis, however, the Hami River maintains a dry state all year. The main water sources of this river are surface water (precipitation, snowfall) and groundwater (melting glaciers in the East Tianshan Mountains). The total amount of surface water and shallow water resources is 1.696 billion cubic meters, among which the surface runoff is 870 million cubic meters, and recoverable groundwater is 820 million cubic meters. Hami soil is divided into 13 soil types, 31 subtypes, and 39 soil genera. Among them, chernozem soil, meadow soil, gray forest soil, subalpine meadow soil, and alpine icy soil are distributed on the Gobi Plain, while arable soil, fluvo–aquic soil, chestnut soil, and brown calcium soil are mainly distributed in cultivated land. There are 704,600 hectares of wasteland in Hami, of which 114,600 hectares are relatively fertile first and second-level wasteland, and 590,000 hectares are suitable third and fourth-level wasteland. The total registered population of Yizhou District is 432,200, including 308 thousand urbans citizens and 124,200 rural citizens, with a 71.26% urbanization rate among the registered population. Yizhou District is rich in forest resources, with a forest area of 104,266 hectares and a forest coverage rate of 1.51%.

2.2. Data Sources and Preprocessing

To evaluate the ecological quality in the Hami Oasis, remote-sensing data, spatial data, and basic geographical information data were collected. Each thematic layer was processed with the same resolution (30 m), projected coordinate system (WGS_1984_UTM_44N), and spatial boundary. (1) Remote-sensing data. Landsat images (column number:138; row number: 30) for 2000 and 2018 were downloaded from the United States Geological Survey (https://www.usgs.gov/). To ensure the accuracy of the images, radiometric calibration, and atmospheric correction were performed on the two images; the average elevation of the main urban area was set to 0.85 km2, the aerosol type was an urban type, and the mean square error was less than 0.5 pixels. (2) Spatial data. Digital elevation model (DEM) data and thematic maps on Population density, GDP, temperature, and precipitation were obtained from the Resources and Environment Data Cloud Platform (http://www.resdc.cn/). Slope data were retrieved from the DEM data. (3) Basic geographical information data. The road and river data came from the 1:1 million basic Chinese geographical information data released by the China National Geographical Information Center.

2.3. Research Methods

2.3.1. Remote Sensing Ecological Index

In the remote sensing ecological index, the greenness index (NDVI) is calculated using NDVI [47], the wetness index (LSM) is calculated by a tasseled cap transformation on remote sensing images [48], the dryness (NDBSI) is obtained using the bare land index and the built-up area index as the average value [49], and the heat index (LST) is obtained by calculating the actual temperature of the ground surface using the thermal infrared band [50]. The initial data are standardized in a range from approximately 0 to 1 to remove the influence of different measurement units. Then, by synthesizing four multiband images, a PCA analysis is performed:
R S E I = f ( G , W , T , D )
R S E I 0 = ( 1 { P C 1 [ f ( N D V I , W E T , L S T , N D B S I ) ] }
R S E I = ( R S E I 0 R S E I m i n ) / ( R S E I m a x R S E I m i n )
where f represents a combination of the four indicators; G, W, T, and D represent the greenness index, the wetness index, the dryness index, and the heat index, respectively; R S E I 0 indicates the initial value of the ecological index, and P C 1 represents the first component of the principal component analysis; R S E I m i n is the minimum value of R S E I 0 , and R S E I m a x is the maximum value of R S E I 0 .

2.3.2. Standard Deviation Ellipse Analysis

This paper used the standard deviation ellipse model to analyze the spatial change characteristics of the ecological quality of the Hami Oasis [51]. The formula for the center of gravity of the standard deviation ellipse is as follows:
M ( X ¯ , Y ¯ ) = [ i = 1 n w i x i i = 1 n w i , i = 1 n w i y i i = 1 n w i ]
where M ( X ¯ , Y ¯ ) represents the center of gravity of the distribution on an ecological level; n is the number of analysis units; and w i is the attribute value of the analysis unit, as the spatial weight of the analysis unit corresponding to i, ( w i y i ) represents the i-th—the center coordinate within the cell.

2.3.3. Moving Window Method

The moving window method is widely used in the field of landscape ecology to study the spatial heterogeneity of the various elements of different types of landscapes and the spatial distribution of structures and their dynamic changes. This principle is based on the classified raster data, selecting the appropriate landscape index, experimenting with windows of different sizes, moving in an orderly manner in the study area, and (at the same time) calculating the index in the window passing area and then assigning values to the center window grid that passes, ultimately forming a complete grid layer. The moving window method can intuitively express the regional ecological process and pattern information in a spatial manner [52].

2.3.4. Geo-Detector Model

Geo-Detector is a spatial analysis model used to measure the relationship between geographic phenomena and their potential influencing factors, which can not only better express the similarities in the same area and the differences between different areas but can also explain the strength of the independent variable X to the dependent variable Y [53]. The factor detector can calculate the effect of temporal and spatial variation differentiation of different factors on ecological quality and detect the magnitude of its influence. The specific definition is as shown in Equation (5):
q = 1 h = 1 L N h σ h 2 N σ 2
where q is the explanatory power of a variable on a spatial attribute, h is the categories or partitions of the variables, N h is the quantity of sample units in the subfields, N is the quantity of sample units in the whole area, L is the quantity of subfields, σ 2 is the variance of a single variable of the entire region, and σ h 2 is the variance of the subfield.
Interaction detection is used to judge the interactions between different influencing factors—that is, evaluating factors X1 and X2 together to determine whether they will increase or decrease the explanatory power of ecological quality. The relationship between the two factors can be divided into the following categories (Table 1):
Ecological detection: to compare whether there are significant differences in the effects of the two factors on the spatial distribution of ecological quality.
F = N X 1 ( N X 2 1 ) S S W X 1 N X 2 ( N X 1 1 ) S S W X 2
where N X 1 and N X 2 represent the sample sizes of factors X 1 and X 2 , respectively, and S S W X 1 and S S W X 2 represent the sum of the intralayer variance of the stratification formed by X 1 and X 2 , respectively.
Regard with the actual situation, eight variables were designed and listed in Table 2.

2.3.5. Spatial Autocorrelation Analysis

Spatial autocorrelation is an important indicator to test whether the attribute value of an element is correlated significantly with the attribute value of its adjacent space. This reveals the correlation of the attribute eigenvalue between the spatial reference unit and its adjacent space unit. In this paper, Moran’s I index (global spatial autocorrelation) and the local indicator of spatial association (LISA) were used to analyze the spatial correlation of ecological environment quality [54].
G l o b a l m o r a n s   I i = i = 1 n j = 1 m w i j ( x i x ¯ ) ( x j x ¯ ) S 2 i = 1 n j = 1 m w i j
where x i is the attribute value of the location of i ; n is the total number of the grids in the study area; w i j is the weight of matrix, which can represent the relationship of spatial objects; i = 1, 2, 3, …, n , j = 1, 2, 3, …, m . When i and j are adjacent, w i j = 0. Moran’s I ranges from approximately +1 (for positive spatial autocorrelation) to −1 (negative autocorrelation), and zero expresses the absence of spatial autocorrelation.
L o c a l m o r a n s   I i = ( x i x ¯ m ) j = 1 m w i j ( x i x ¯ )
m = ( j 1 , j 1 m x i 2 ) ( n 1 ) x 2
where I i represents the spatial clustering of similar values (high value or low value) around the spatial unit, and negative I i represents the spatial clustering between dissimilar values.

3. Results

3.1. Principal Component Analysis of the Ecological Environment Index

Table 3 shows that in 2000 and 2018, in the remote sensing ecological index transformation map synthesized by NDVI, LSM, NDBSI, and LST, the contribution rates of the eigenvalues of the first principal component were 81.85% and 84.41%, respectively. In these two time periods, the value of the first principal component exceeded 80%, indicating that the first principal component can represent most of the characteristic values. Therefore, it is reasonable to construct a remote sensing ecological index in the study area.
In Table 4, it is shown that the mean values of RSEI from 2000 to 2018 all increased (0.22 and 0.40, respectively). Due to the limitations of the ecological conditions of the oasis in the arid region, the average value of the remote sensing ecological index was not overly high, suggesting that the ecological conditions of the area were relatively simple and that the degree of greening was not high. This conclusion was also obtained from the average value of the NBDSI in the study area and the contributions to the first principal component. The load value was high, and the average value of the NBDSI was above 0.87 in the two time periods. The average value also indicates that the number of NBDSI pixels in the study area was numerous, which played a negative role in the ecological evaluation of the overall study area. The average and standard deviation of NDVI both increased first and then decreased over 18 years, and the range of changes was small, indicating that the expansion of urban green space in the study area and the development direction of the surrounding artificial oasis were relatively fixed. The average value of LSM was lower than 0.4 in the two time periods, signifying that the wetness in the study area was poor, which is also in line with the general background that the area is arid. The average value of LST also showed a decreasing trend, from 0.63 in 2000 to 0.48 in 2018, suggesting that the ecological environment in the study area experienced a period of improvement. Thus, we concluded, considering previous studies [55], that the scope of the green ecological function area was expanding at the same time, which had a significant effect on regional cooling and humidification and was also confirmed by the changes in NDVI and LSM. In general, the ecological status of the Hami Oasis gradually improved from 2000 to 2018, but its overall ecological level was poor, and the average value of its RSEI was lower than 0.5.

3.2. Oasis Ecological Environment Quality Classification

To further explore the changes of local ecological conditions in the study area, the normalized RSEI ecological index was divided into five grades according to a numerical interval of 0.2. The values from low to high represent ecologically poor, fair, moderate, good, and excellent [42,45], and the area and proportion of each ecological level in each year were calculated (Table 5).
According to the remote sensing ecological index grades (Table 5), the proportion of poor grades continued to decline in the two time periods (67.94% and 21.69%, respectively), and the overall decrease was 46.25%. This shows that during 2000–2018, most of the undeveloped areas around the Hami Oasis were reasonably used and the area’s vegetation coverage greatly improved. At the same time, the area of bare land was reduced, and the areas with poor ecological quality also reduced year by year. The percentages of fair grades in 2000 and 2018 showed a rising trend (by 15.08% and 33.80%). This means that the areas with poor grades in the oasis increased year by year. Figure 2 shows that the area with a fair grade mainly expanded in the southeast and northwest regions and changed from a poor to a fair grade, showing that the ecological quality improved to a certain extent, but the overall situation was still poor. The changes in the middle level increased from 10.79% in 2000 to 20.16% in 2018—an increase of nearly 200%, indicating an increasing state. In 2018, the proportion of poor, fair, medium, and good grades in the Hami Oasis was relatively average at around 25% each, indicating that the overall ecology of the oasis in 2018 improved to a greater extent compared to 2000.
From 2000 to 2018, the changes in the premium grades showed a decreasing trend, and the area percentage fell from 0.27% to 0.18%. This may be related to the planning and construction of industrial parks in the southwest and southeast of the periphery of the town in Yizhou District in recent years to develop industry and promote agricultural transformation [56]. The above measures also contributed to a reduction in bare land, an increase in green vegetation coverage, and an increase in construction land. In 2000, cotton was the main crop in the area with excellent ecological quality, while in 2018, the ecological quality of the same area was reduced to good. The reason for this reduction lies in the transformation of the agriculture in the Hami region over the past 10 years, which has exchanged its original cotton crops for crops such as jujube trees with higher economic output. Compared with jujube, cotton presented a higher chlorophyll content in the same period. Therefore, the NDVI value of cotton was higher than that of jujube in the inversion of the remote sensing images. When calculating the remote sensing ecological index, the NDVI value feature contribution rate was relatively high, so there were different ecological grade changes in the two images of this area.

3.3. Dynamic Monitoring of the Ecological Environment Quality in the Hami Oasis

To further analyze the differences in the ecological environment quality of the Hami Oasis over 18 years, the data for each of the two time periods were processed according to their difference based on RSEI to analyze the changes in the ecological quality of each grade.
Table 6 shows that from 2000 to 2018, the area of improved ecological quality reached 97.5 km2, accounting for 7.14%. Figure 3 shows that the areas with improved ecological quality were concentrated in the western, southern, and eastern regions of the Hami Oasis, represented by an increase in artificial oasis dominated by agricultural land. During this time period, Hami City, to promote agricultural transformation [56], planted a large number of crops, such as cotton, to increase vegetation coverage and wetness, which affected the changes in the regional remote sensing ecological index. The area where the ecological quality deteriorated reached 95.03 km2 (Figure 3), mainly including the impervious surfaces of rapidly expanding towns. Around the urban center of Yizhou District, there was a poor area with relatively concentrated patches. This area was caused by the rapid expansion of villages, towns, and related groups over the past 18 years. The areas with poor ecological quality were mostly located in the north, which was the main direction of urban expansion in Yizhou District over the past 18 years.
In Figure 3, the blue circle shows the range of deterioration, and the yellow circle indicates the range of improvement. The areas with worse ecological quality were scattered, while the areas with better ecological conditions were distributed around the areas with worse ecological conditions in a ringlike nested distribution. Figure 2 shows that the areas with better ecological quality with reasonable planning and development over the past 18 years were mainly areas expanded into by artificial oasis in 2018 [6,57], which was of great significance to the expansion of the Hami Oasis. This shows that the main reason for the better ecological quality of the oasis in the arid region was the rapid development of an artificial oasis, while the deterioration of oasis ecology was due to the expansion of the built-up area. The built-up area changed its original ecological appearance to a certain degree, yet the development processes of the built-up area and the oasis area were mutually promoted and developed. With increases in the built-up area, the population and economy in the arid region developed rapidly. To obtain more living space, the residents of this area continuously cultivated a larger artificial oasis. To a certain degree, this artificial oasis not only improved the local barren desert landscape but also changed its ecological quality.
As the Hami Oasis appears as a relatively isolated point-shaped oasis in space, the future development of this oasis still needs to grow the area of the artificial oasis and the built-up area to expand the oasis. As a result, this area could be connected to the surrounding oasis to form a flaky oasis [58], thus stimulating a siphoning effect of the oasis.

3.4. External Overall Analysis of the Ecological Quality of the Hami Oasis Based on the Standard Deviation Ellipse Method

The standard deviation ellipse method [59] is a typical method used to describe the density and distribution range of spatial points, whose principle involves converting the patch range formed by the remote sensing ecological index of each period into a vector surface file and then converting the surface into a point file to realize the construction of a standard deviation ellipse. This paper applied this method to analyze the expansion direction and scope of the ecological quality of the Hami Oasis from a macro perspective.
From a spatial perspective, Figure 4 shows that the direction of the major axis of the standard deviation ellipse was the same in the two time periods, indicating that the Hami Oasis expanded in a southeast–northwest direction over the past 18 years; this direction is the same as the expansion direction of the artificial oasis because the urban area of the Hami Oasis and the surrounding group fields were distributed along the main railway and national highways. At the same time, located in the alluvial fan on the southern slope of the eastern section of Tianshan Mountain, the terrain of the Hami Oasis is high in the north side and low in the south, which restricted the development of other industries and determined the distribution patterns of towns and groups in the oasis. Figure 2 and Figure 4 show that the main expansion direction of the Hami Oasis in the early stage was distributed along the river. The reason for this expansion direction is that the early Hami Oasis mainly relied on the basic development of the primitive natural oasis. However, with increases in the population of Hami City and improvements in social development and water conservancy facilities [60], the Hami Oasis’ complete dependence on rivers improved.
From a diachronic perspective, compared with 2000, the minor axis of the ellipse in 2018 showed an increasing trend, and the increase in the minor axis on the north side was smaller than that on the south side, suggesting that the development of the Hami Oasis over 18 years mainly focused on the southern part of the oasis. Figure 1 and Figure 4 show a small increase in the short axis on the north side due to the large built-up area on the north side. According to the actual research, this area is the northern industrial park of Hami [61]. Due to being affected by the higher regional terrain and large areas of Gobi, this park is more suitable for developing industry than agriculture. Since the emergence of industrial parks changed the original desert landscape, the ecological quality of the north has improved over the course of 18 years of development.
From the analysis of the standard deviation ellipse, we found that the semiminor axis of the standard deviation ellipse in this area increased while the semimajor axis decreased, indicating that the urban–rural junction developed more closely. Areas with better ecology were connected by a patch related to the integration of urban and rural areas in the Hami Oasis. Among them, the area represented by Qincheng [56] was included in the national tourism poverty alleviation pilot village to actively develop poverty alleviation tourism such as ecological sightseeing, garden picking, and custom folk experiences, and the ecological quality improved significantly.

3.5. Internal Detailed Analysis of Ecological Quality in the Hami Oasis Based on the Moving Window Method

Figure 5 shows that the landscape index of the Hami Oasis was distributed regularly, and the ecological quality of the oasis also had a certain degree of correlation with the internal space. The Patch Density (PD) (Figure 5a) [62] changed significantly from 2000 to 2018. The red area represents a larger patch density value, while the darker the color represents higher fragmentation of the ecological land and higher heterogeneity of the landscape. In 2000, the PD value range in the central area of the city and the surrounding area was 0 to 3.8, while in 2018, the range was from 36 to 58, signifying that the location was highly ecologically fragmented. Over the past 18 years, the fragmentation of the ecological landscape in the central area of the city has continued to increase, reflecting the acceleration of urbanization and the greater transformation of the original surface.
The Largest Patch Index (LPI) (Figure 5d) changed greatly during this time period, manifested as a change from the inside of the oasis to the outside; at the same time, the phenomenon of an approximately ring-shaped mosaic sleeve appeared. In 2000, the LPI was divided into a high-value area, a low-value area, a high-value area, and a low-value area from inside to outside. Conversely, in 2018, from the inside to the outside, the LPI was divided into a low-value area, a high-value area, a low-value area, and a high-value area. The peripheral areas with high LPI values were mainly concentrated in the northeast, southeast, and west, and the RSEI values of these areas were low, indicating that their ecological quality changes were more complicated. The low-value areas in 2000 were concentrated in the northeast and southwest, showing a symmetrical distribution, mainly because the area was undeveloped, suggesting that the ecological quality of the area changed slightly.
The Contagion Index (CONTAG) (Figure 5c) [7] reflects the trend of agglomeration and extension between different types of patches. A larger Contagion Index indicates that the patches in the landscape are well connected; otherwise, the fragmentation of the landscape is higher. Figure 5 shows that in 2000 and 2018, the internal spread of the ecological environment of the Hami Oasis was relatively large, and the links between the patches were good. However, high values appeared on the edge of the oasis, indicating that the most fragmented areas emerged there. In the figure of the Contagion Index for 2000, the urban built-up areas within the oasis present obvious high-value areas, which indicates that the built-up areas have an impact on the overall link status of the oasis. At the same time, at the junctions of different ecological quality levels, the Contagion Index lies between 38 and 74, suggesting that the transformation between different patches would destroy the correlation between the patches, which is one of the important manifestations of the fragmentation of ecological quality. From the Contagion Index in 2018, it was found that the frequency and range of high-value areas were significantly greater than those in 2000. With a further analysis, we found that the high-value areas of the built-up area in 2018 decreased. This occurred because, after 18 years of ecological improvement, the greening of the built-up area increased, and the increase in ecological level had a good impact on the overall connection status of the oasis. At the same time, the transformation of different ecological quality levels became more dramatic over the 18 years of changes. During this transition, the degree of connectivity decreased, while the degree of fragmentation increased.
The Shannon Diversity Index (SHDI) (Figure 5b) indicates the sensitivity of the uneven distribution of each patch type in the main landscape, which emphasizes the contribution of the smallest patch type to the information. In a landscape system, the higher the SHDI value, the more complex its ecological quality and the higher its degree of fragmentation will be. In Figure 5, the high-value areas of the SHDI in 2000 generally appeared in the outer area of the oasis center, but the high-value areas of the SHDI in 2018 only appeared in the southwestern area of the oasis center. This occurred because the area with a poor grade transitioning between a poor grade and a medium grade in the Hami Oasis in 2000 was small, resulting in a shorter distance between the poor grade and the medium grade. These three types of ecological qualities were concentrated in a small area, so the value of SHDI in this area was higher. Similarly, in 2018, the four levels of ecological quality were concentrated in the southwestern region of the Oasis Center, resulting in a high SHDI value in this area. In addition, the ecological quality levels of the other regions all showed a steplike change, and the areas of different ecological quality levels were relatively equal, so the SHDI value was not high. In short, the changes in the periphery of the oasis in 2000 were more dramatic than those in 2018, and the trend of ecological quality expansion in the oasis was more obvious.
The patch density index is similar to the patch shape index [63]. The larger the LSI value (Figure 5e), the more irregular the patch shape. The high-value areas in 2000 were more evenly distributed in the oasis, indicating that the scale of ecological land in 2000 was small. In addition, the distribution was relatively scattered, without forming a contiguous area, so the LSI value was relatively large. Similarly, the northern and southern regions were both undeveloped areas with no ecological land, so the patch shapes in this area were very regular, showing a low value area of 0. In 2018, due to the reasonable planning of ecological land, the area was relatively regular, so the value of the LSI was not high, and the median area was more evenly dispersed in the study area, which further illustrates the rational planning and development of cities and the oasis and that the ecological quality of the oasis also improved [49].

4. Discussions

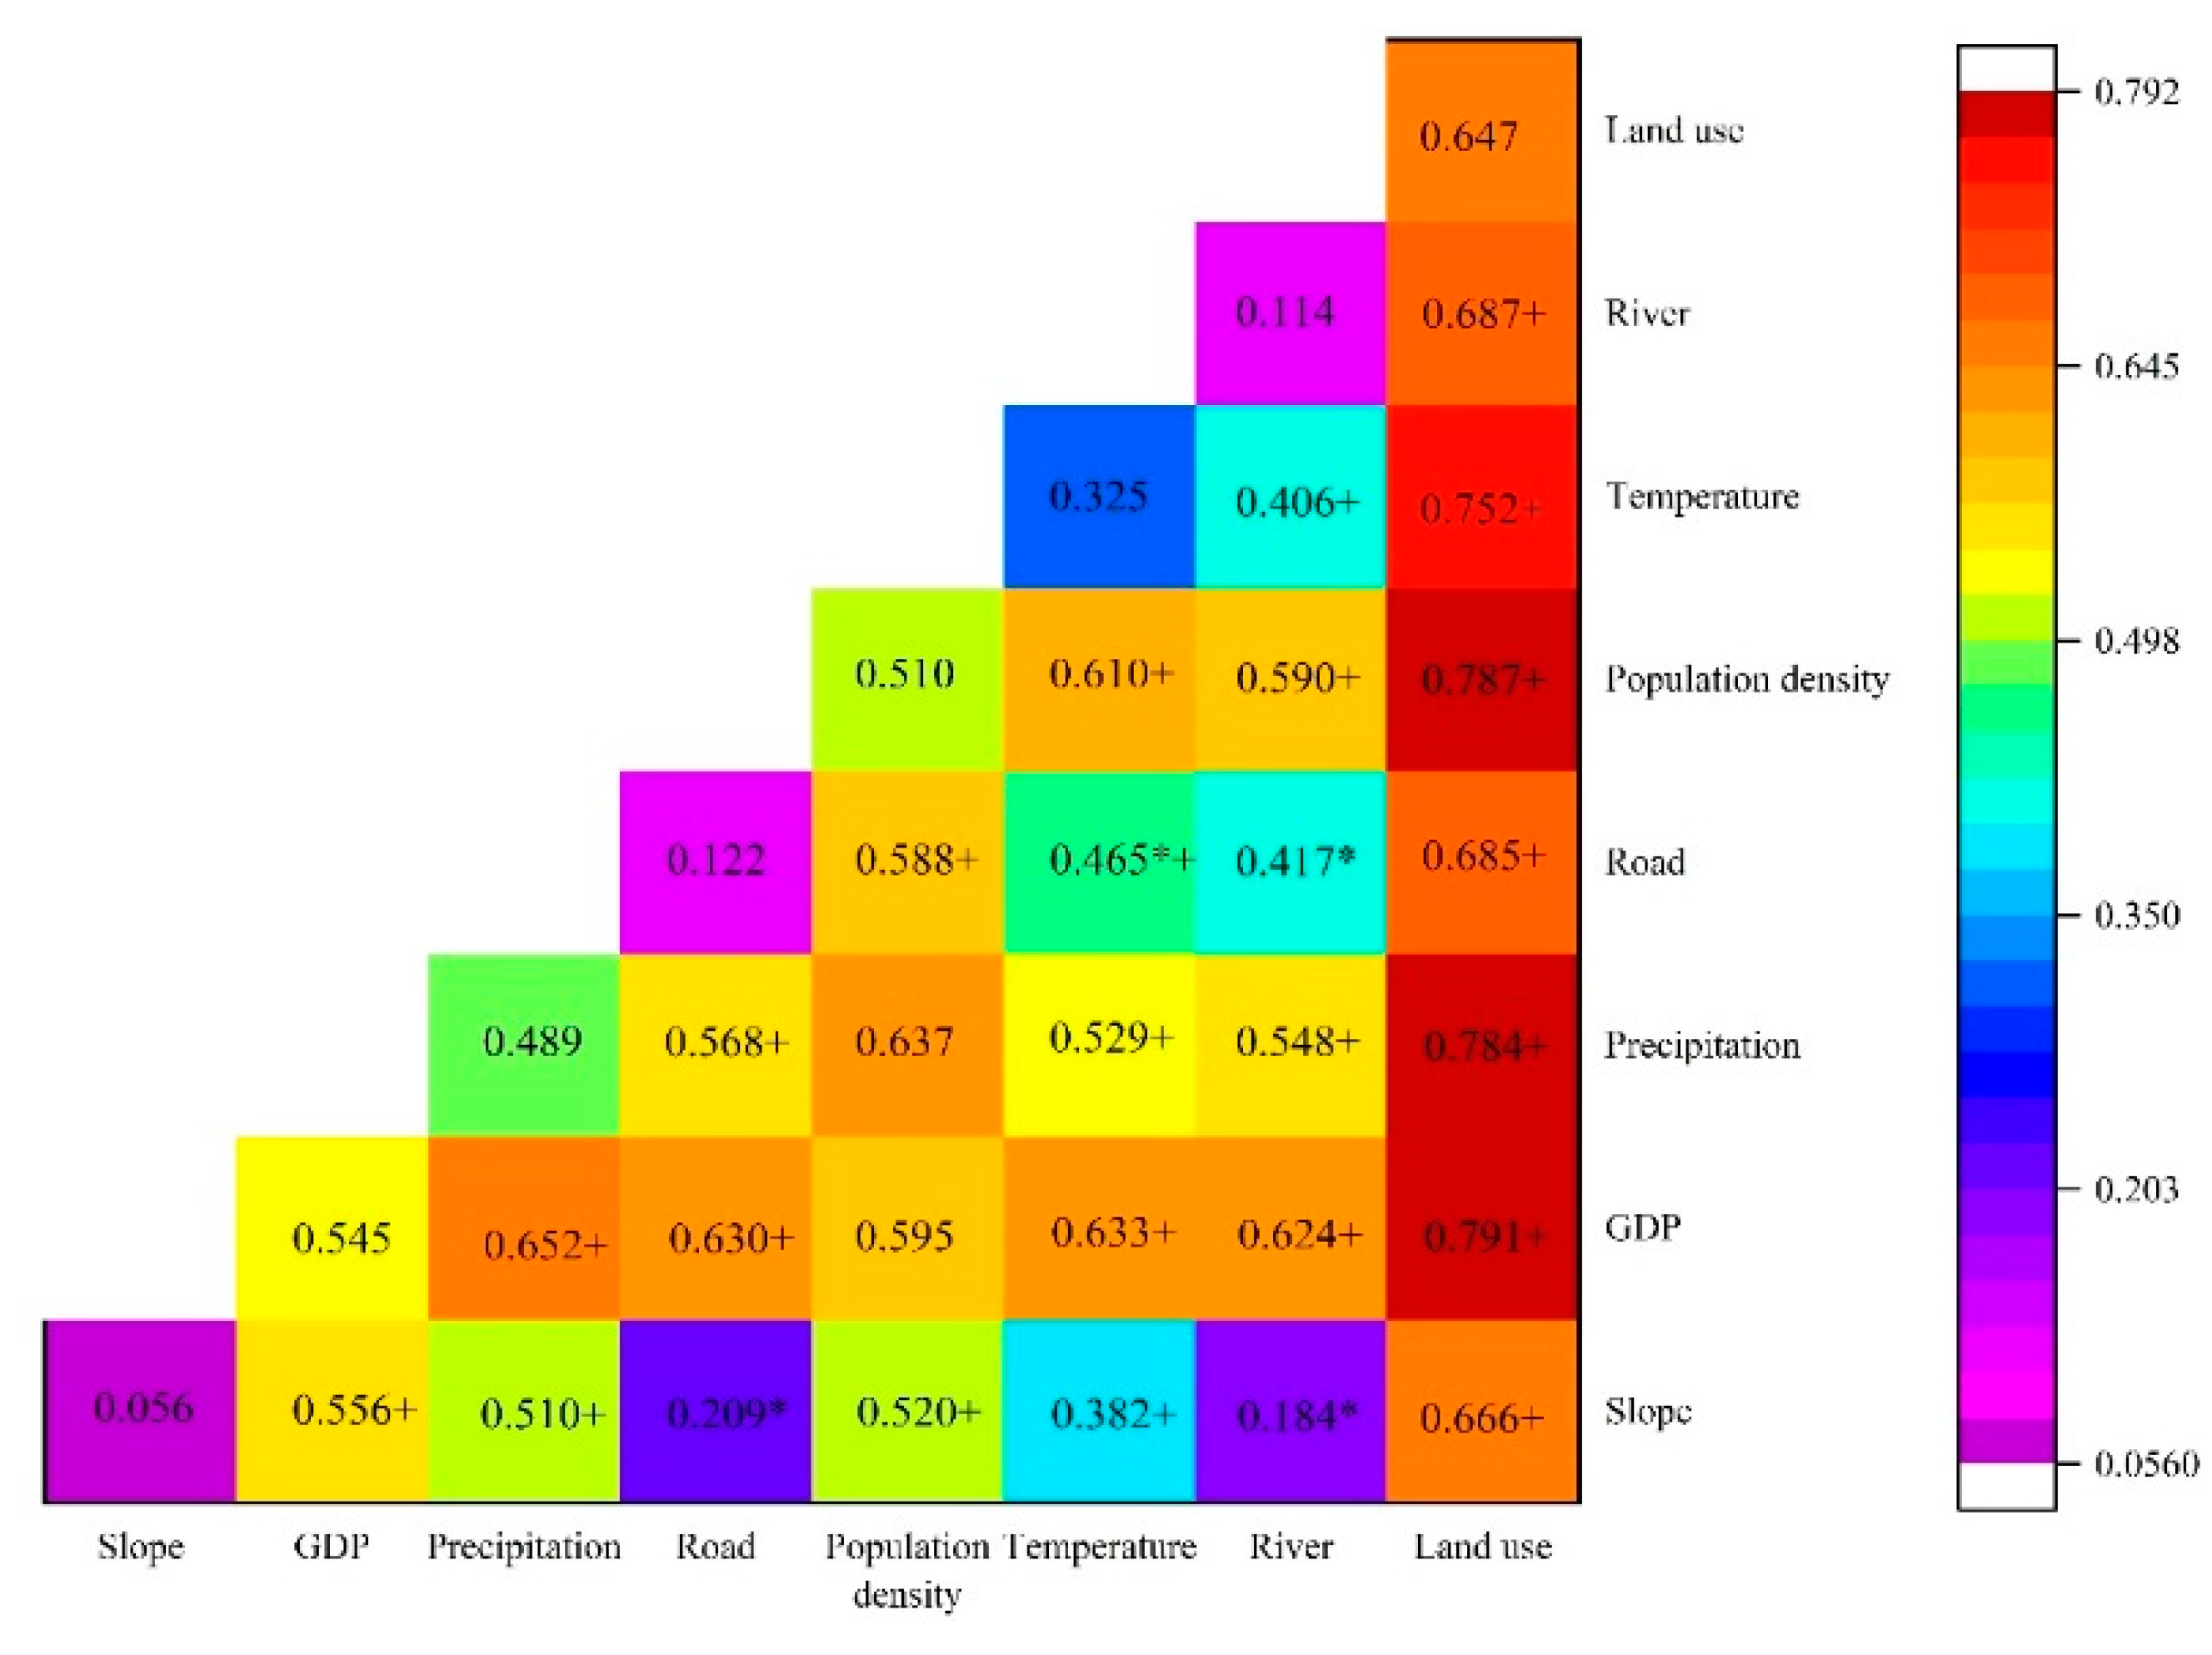
4.1. Analysis of Driving Factors of the Hami Oasis Based on Geographic Detector

The results of the factor detection (Table 7) reveal that the eight selected ecological factors all passed the significance test with a p value of less than 0.05, and the deterministic q value of different factors was generally higher. The order of q values from large to small was Land use > GDP > Population density > Precipitation > Temperature > Road > River > Slope. This shows that land use change was the main factor causing the changes in the oasis’ ecological quality, while the second most common influencing factors were population density and GDP, followed by temperature and precipitation, and, finally, the impact of water systems and road networks.
Based on the interactive detection (Figure 6), we found that the slope ∩ road (0.209), slope ∩ river (0.184), road ∩ temperature (0.465), and road ∩ river (0.417) (with *) represent nonlinear enhancements, while the rest are two-factor enhancements. In the factor detection, the slope (0.056) and road (0.122) had the lowest explanatory power, indicating that the explanatory power of slope and road for the ecological quality of the oasis was greatly improved after interactive detection. The other two-factor enhancements were sorted by explanatory power as follows: land use ∩ GDP (0.791) > land use ∩ population (0.787) > land use ∩ precipitation (0.784) > land use ∩ temperature (0.752) > land use ∩ river (0.687) > land use ∩ road (0.685) > land use ∩ slope (0.666). The interactive detection values of the other factors were all less than 0.65. The results show that the explanatory power after the interactive detection of land use and other factors was greater than that of the original single-factor detection [64,65]. Based on the ecological detection (Figure 6), the river ∩ slope, river ∩ road, temperature ∩ road, and road ∩ slope all present no significant differences, while the ecological detections among the other factors show significant differences.
Like the changes in ecological driving factors in the upper Tarim River Oasis [66], the Manas Oasis [67], Dunhuang Oasis [68], and Tianshan Oasis [69] in the arid zone, the main driving factors for changes in the ecological quality of Hami Oasis are land use type [70] because different types of land uses will form different types of landscapes [71]. For the unused land represented by the Gobi, analysis of the four indicators of RSEI shows that the dryness and heat in this area are relatively high, while the greenness and wetness are extremely low, suggesting that the ecological quality of the area is also extremely low. In the land use types of cultivated land and woodland, greenness and wetness are higher, while dryness and heat are lower, indicating that the ecological quality of the region is higher.
Some researchers [72] believe that the main driving forces behind the different expansion stages of the oasis are inconsistent. In the initial stage of oasis expansion, the changes are mainly manifested as the growth of the natural oasis, whose process is mainly restricted by long-term climate changes. When humans live in the oasis, the expansion of the oasis enters its midterm, and the changes in its main driving forces are affected by human factors. This occurs because human activities and human needs need to be met in a short period of time, which is bound to produce major transformations in the oasis during this period. Therefore, the oasis’ expansion and ecological changes were extremely drastic. Because it was affected by natural factors such as precipitation, temperature, slope, etc., the oasis is also a product of human activities in arid areas; indeed, human activities have a more profound impact on the production of oases than other factors. The contribution rates of population density and GDP in the Hami Oasis were significantly higher than those of temperature and precipitation. Moreover, natural factors and human activities played different roles in the development of the oasis at different time scales [6,73]. We found that the impact of human activities on the ecological quality of the Hami Oasis was much higher than that of natural factors during the study period. With the implementation of Western Development [6], Xinjiang’s cities and towns have begun to develop rapidly, the area’s economic and social processes are steadily accelerating, and the impact of human activities on the surface is becoming increasingly more profound, resulting in more dramatic changes in the ecological effects of the Hami Oasis.

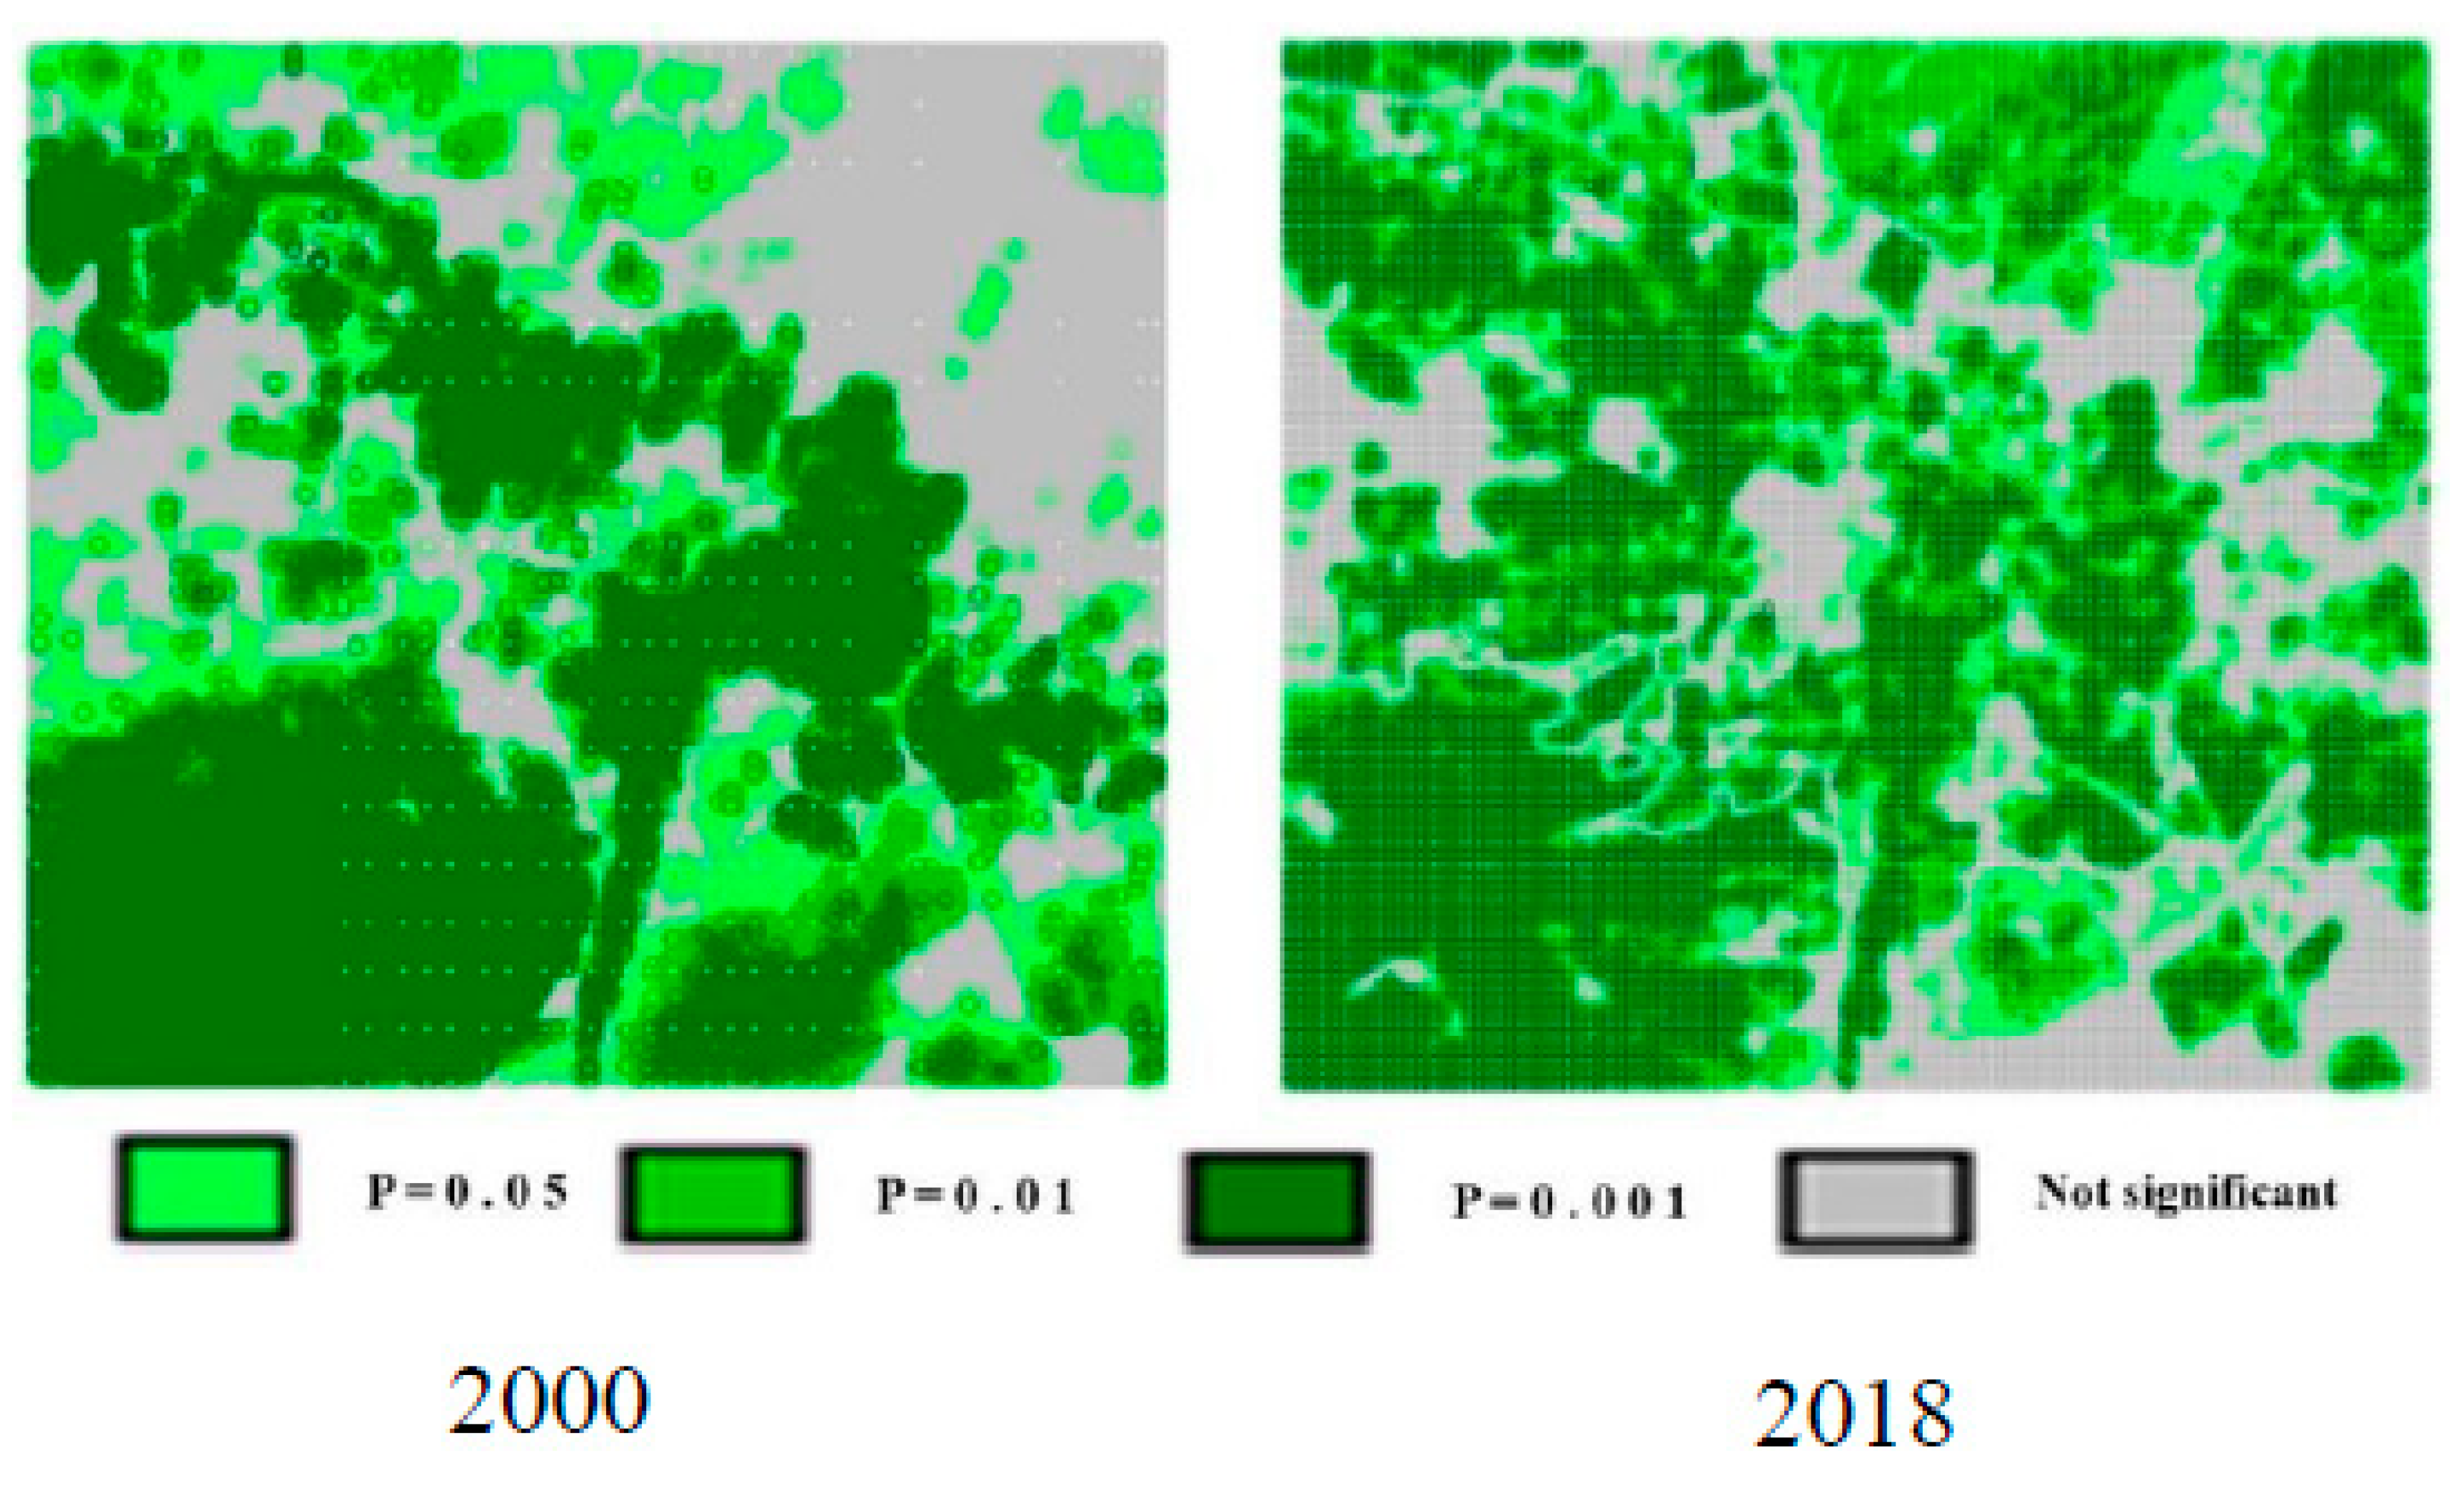
4.2. Spatial Clustering of the Ecological Environment of Hami Oasis

Using Moran’s I index and scatter plot (Figure 7), the RSEI of the Hami Oasis from 2000 to 2018 was analyzed via spatial autocorrelation. The Moran’s I scatter plot drawn by the Open GeoDa software can qualitatively distinguish the relationship between the RSEIs in each region. In Figure 2, the high values surrounded by high neighboring values are High–High (H–H), the low values surrounded by low neighboring values are Low–Low (L–L), the low values surrounded by high neighboring values are Low–High (L–H), and the high values surrounded by low neighboring values are High–Low (H–L). The degree of autocorrelation of Moran’s I index in 2000 was relatively strong, with 0.835268. Compared to 2000, the Moran’s I index increased significantly in 2018, reaching a higher value of 0.923976, indicating that it has a strong positive correlation and a certain internal relationship between the ecological environment quality of the study area. In 2000, the RSEI distribution points were clustered in the first quadrant, indicating that the difference in RSEI were small in areas with high ecological environment quality. In 2018, the RSEI point clusters were distributed in the first and third quadrants, which is very different from the distribution in 2000. The point clusters in the third quadrant showed that the RSEI differences increased in areas with lower ecological environment quality [74].
To understand the spatial distribution characteristics of ecological environment quality, the local spatial correlation pattern of the ecological environment quality was analyzed using a LISA clustering map and a LISA significance level map (Figure 8 and Figure 9). Four types of spatial associations were proposed, as follows (see Figure 7): a High–High Cluster type, a High–Low Outlier type, a Low–High Outlier type, and a Low–Low Cluster type. The High–High and Low–Low clusters correspond to positive spatial autocorrelation, while the High–Low and Low–High outliers correspond to negative spatial autocorrelation. The characteristics of local spatial agglomeration were then summarized. In 2000 [75], H–H was located in the middle of the study area. Compared with 2000, H–H showed an upward trend in 2018, occupying most of Hami, which is related to the planning and construction of industrial parks in the southwest and southeast areas of the city’s periphery in Yizhou District in recent years to develop industrial and agricultural transformation. The reduction in bare land area and the increase in vegetation coverage have improved the quality of the ecological environment to a certain extent [76]. L–L was mainly distributed in the wasteland and bare land in the southwest in 2000 and 2018, where the vegetation coverage was low, and the ecological environment quality was poor [77].
In future urban planning, proper consideration should be given to renovating or minimizing bare land. The region of H–H mostly reached a significance level of 0.05 in 2000. A significance level of 0.01 was mainly observed in the H–H and L–L areas, where the ecological environment quality has a strong correlation. The region with a significance level of 0.05 was mainly located in the periphery of the region where the significance level reached 0.01. The region of H–H mostly reached a significance level of 0.01 in 2000 and 2018 [78,79].

5. Conclusions

The Hami Oasis is a special and relatively independent type of oasis due to the development process of the oasis in the arid region. This study improved our understanding of the ecological quality of this particular oasis to help improve the overall development of oases in arid regions. The results indicate the following: In the context of arid regions, the ecological quality of the Hami Oasis, based on the remote sensing ecological index, was greatly affected by dryness and wetness, which also resulted in the average value of the ecological environment quality of the Hami Oasis being less than 0.5, indicating a low ecological quality level. However, on the whole, the ecology of the Hami Oasis gradually improved from 2000 to 2018. The areas with poor and good ecological quality levels in the oasis experienced the most significant changes, which were mainly distributed in the western and southern regions of the oasis. These changes were mainly prompted by the expansion of the artificial oasis. The areas with deteriorating ecological quality were mainly located in built-up areas, presenting a ringlike nesting distribution pattern. The overall analysis of the outside of the oasis shows that the Hami Oasis has mainly expanded in the southeast–northwest direction, which is consistent with the distribution of railways and national trunk lines. The internal analysis of the oasis shows that the transformation between different ecological quality levels and the expansion of the built-up area are important reasons for the fragmentation of the oasis’ ecological landscape. The analysis using a geo-detector shows that a direct influencing factor on the ecological quality changes of the Hami Oasis is the land use type. During the study period, human activities had a more significant impact than natural factors in the development process of the Hami Oasis. The Moran’s I Index increased from 0.835268 in 2000 to 0.923976 in 2018. The H–H Cluster increased significantly. Meanwhile, the p values in the study area all reached a 0.05 significance level. RSEI is merely based on remote sensing and natural factors but ignores socioeconomic factors. In addition, RSEI lacks empirical data to verify the results of the inversion. In future research, researchers should try to build a better ecological environment index and consider adding empirical data verification to build a better system for evaluating the results of remote sensing index inversion.

Author Contributions

Writing—original draft preparation, P.G.; methodology, T.R.; software, P.G. and T.R.; data curation, H.Z. and Y.Z.; writing—review and editing, J.C. and B.L.; funding acquisition, A.K. All authors have read and agreed to the published version of the manuscript.

Funding

This research was funded by the Natural Science Foundation of China, grant number NO. 41661037, and the Postgraduate Research and Innovation Project of Xinjiang Uygur Autonomous Region, grant number NO. XJ2020G237.

Acknowledgments

We thank the two anonymous reviewers for their constructive comments and suggestions that have helped to improve the original manuscript. We would also like to thank the editorial staff.

Conflicts of Interest

The authors declare no conflict of interest.

References

  1. Ingram, H.A.P. Ecohydrology of Scottish peat lands. Trans. R. Soc. Edinb. Earth Sci. 1987, 78, 287–296. [Google Scholar] [CrossRef]
  2. Ling, H.; Xu, H.; Fu, J.; Fan, Z.; Xu, X. Suitable oasis scale in a typical continental river basin in an arid region of China: A case study of the Manas River Basin. Quat. Int. 2013, 286, 116–125. [Google Scholar] [CrossRef]
  3. Qi, S.; Li, X.; Duan, H. Oasis land-use change and its environmental impact in Jinta Oasis, arid northwestern China. Environ. Monit. Assess. 2007, 134, 313–320. [Google Scholar] [CrossRef]
  4. Luo, G.-Q.; Zhou, C.-H.; Chen, X.; Li, Y. A methodology of characterizing status and trend of land changes in oases: A case study of Sangong River watershed, Xinjiang, China. J. Environ. Manag. 2008, 88, 775–783. [Google Scholar] [CrossRef] [PubMed]
  5. Zhou, D.; Wang, X.; Shi, M. Human driving forces of oasis expansion in north-western China during the last decade-a case study of the Heihe River Basin. Land Degrad. Dev. 2017, 28, 412–420. [Google Scholar] [CrossRef]
  6. Zuo, L.-J.; Zhang, Z.-X.; Zhao, X.-L.; Wang, X.; Wu, W.-B.; Yi, L.; Liu, F. Multitemporal analysis of cropland transition in a climate-sensitive area: A case study of the arid and semiarid region of northwest China. Reg. Environ. Chang. 2014, 14, 75–89. [Google Scholar] [CrossRef]
  7. Fan, Q.; Ding, S. Landscape pattern changes at a county scale: A case study in Fengqiu, Henan Province, China from 1990 to 2013. Catena 2016, 137, 152–160. [Google Scholar] [CrossRef]
  8. Zhu, Z.; Liu, S.; Di, X. Desertification and Rehabilitation in China; Academic Press: Beijing, China, 1988; pp. 205–218. [Google Scholar]
  9. Duan, H.-C.; Wang, T.; Xue, X. Dynamic monitoring of aeolian desertification based on multiple indicators in Horqin Sandy Land. China. Sci. Total Environ. 2019, 650, 2374–2388. [Google Scholar] [CrossRef]
  10. WHO. Millennium Ecosystem Assessment. In Ecosystems and Human Wellbeing: Synthesis; Island Press: Washington, DC, USA, 2005; p. 137. Available online: http://refhub.elsevier.com/S0341-8162(19)30516-8/h0140 (accessed on 5 September 2020).
  11. Feng, S.; Fu, Q. Expansion of global drylands under a warming climate. Atmos. Chem. Phys. 2013, 13, 81–100. [Google Scholar] [CrossRef] [Green Version]
  12. Feng, Q.; Ma, H.; Jiang, X.-M. What has caused desertification in China. Sci. Rep. 2015, 5, 15998. [Google Scholar] [CrossRef] [PubMed] [Green Version]
  13. Xue, Y. Interactions and feedbacks between climate and dryland vegetation. In Dryland Ecohydrology; D’Odorico, P., Porporato, A., Eds.; Springer: New York, NY, USA, 2006; pp. 85–105. [Google Scholar] [CrossRef]
  14. Aspinall, R. Modelling land use change with generalized linear models—A multi-model analysis of change between 1860 and 2000 in Gallatin Valley, Montana. J. Environ. Manag. 2004, 72, 91–103. [Google Scholar] [CrossRef] [PubMed]
  15. Bakker, M.-M.; Govers, G.; Kosmas, C. Soil erosion as a driver of land-use change. Agric. Ecosys. Environ. 2005, 105, 467–481. [Google Scholar] [CrossRef]
  16. Feng, Y.-X.; Luo, G.-P.; Zhou, D.-C. Effects of land use change on landscape pat-tern of a typical arid watershed in the recent 50 years: A case study on Manas River watershed in Xinjiang. Acta Ecol. Sin. 2010, 30, 4295–4305. [Google Scholar] [CrossRef]
  17. Bai, J.; Chen, X.; Li, L.; Luo, G.; Yu, Q. Quantifying the contributions of agricultural oasis expansion, management practices and climate change to net primary production and evapotranspiration in croplands in arid northwest China. J. Arid Environ. 2014, 100, 31–41. [Google Scholar] [CrossRef]
  18. Guo, M.; Yu, W.-B.; Ma, M.-G.; Li, X. Study on the oasis landscape fragmentation in northwestern China by using remote sensing data and GIS: A case study of Jinta oasis. Environ. Geol. 2008, 54, 629–636. [Google Scholar] [CrossRef]
  19. Hu, N.-K.; Li, X. Spatial distribution of an ancient agricultural oasis in Juyan, northwestern China. Front. Earth Sci. Prc. 2014, 338–350. [Google Scholar] [CrossRef]
  20. Wang, Y.; Gao, J.-X.; Wang, J.-S.; Qiu, J. Value assessment of ecosystem services in nature reserves in Ningxia, China: A response to ecological restoration. PLoS ONE 2014, 9. [Google Scholar] [CrossRef]
  21. Lamqadem, A.A.; Saber, H.; Pradhan, B. Quantitative assessment of desertification in an arid oasis using remote sensing data and spectral index techniques. Remote Sens. 2018, 10, 1862. [Google Scholar] [CrossRef] [Green Version]
  22. Boali, A.; Bashari, H.; Jafari, R. Evaluating the potential of Bayesian networks for de-sertification assessment in arid areas of Iran. Land Degrad. Dev. 2019, 30, 371–390. [Google Scholar] [CrossRef]
  23. Wang, T.; Sun, J.G.; Han, H. The relative role of climate change and human ac-tivities in the desertification process in Yulin region of northwest China. Environ. Monit. Assess. 2012, 184, 7165–7173. [Google Scholar] [CrossRef]
  24. Wang, R.-H.; Zhang, H.-Z.; Huang, Q. Characteristics and laws of MODS coupling rela-tion in and zone under global change. Chin. Sci. Bull. 2006, 51, 75–81. [Google Scholar] [CrossRef]
  25. Falcucci, A.; Maiorano, L.; Boitani, L. Changes in land-use/land-cover patterns in Italy and their implications for biodiversity conservation. Landsc. Ecol. 2007, 22, 617–631. [Google Scholar] [CrossRef]
  26. Yang, G.; Chen, D.; He, X.-L. Land use change characteristics affected by water saving practices in Manas River Basin, China using Landsat satellite images. Int. J. Agric. Biol. Eng. 2017, 10, 123–133. [Google Scholar]
  27. Misak, R.F.; Baki, A.A.A.; ElHakim, M.S. On the causes and control of the waterlogging phenomenon, Siwa Oasis, northern Western Desert, Egypt. J. Arid Environ. 1997, 37, 23–32. [Google Scholar] [CrossRef]
  28. Siebert, S.; Nagieb, M.; Buerkert, A. Climate and irrigation water use of a mountain oasis in northern Oman. Agric. Water Manag. 2007, 89, 1–14. [Google Scholar] [CrossRef]
  29. Su, Y.-Z.; Zhao, W.-Z.; Su, P.-X.; Zhang, Z.-H.; Wang, T.; Ram, R. Ecological effects of desertification control and desertified land reclamation in an oasis–desert ecotone in an and region: A case study in Hexi Corridor, northwest China. Ecol. Eng. 2007, 29, 117–124. [Google Scholar] [CrossRef]
  30. Ochoagaona, S.; Kampichler, C.; Bhj, D.J. A multi-criterion index for the evalua-tion of local tropical forest conditions in Mexico. For. Ecol. Manag. 2010, 260, 618–627. [Google Scholar] [CrossRef]
  31. Sullivan, C.A.; Skeffington, M.S.; Gormally, M.J. The ecological status of grasslands on lowland farmlands in western Ireland and implications for grassland classification and nature value assessment. Biol. Conserv. 2010, 143, 1529–1539. [Google Scholar] [CrossRef]
  32. Gupta, K.; Kumar, P.; Pathan, S.K. Urban Neighborhood Green Index—A measure of green spaces in urban areas. Landsc. Urban Plan. 2012, 105, 325–335. [Google Scholar] [CrossRef]
  33. Chen, X.-Y.; Chau, K.-W. A hybrid double feedforward neural network for suspended sediment load estimation. Water Resour. Manag. 2016, 30, 2179–2194. [Google Scholar] [CrossRef]
  34. Shamshirband, S.; Nodoushan, E.-J.; Adolf, J.-E.; Manaf, A.-A.; Mosavi, A.; Chau, K. Ensemble models with uncertainty analysis for multi-day ahead forecasting of chlorophyll a concentration in coastal waters. Eng. Appl. Comput. Fluid Mech. 2019, 13, 91–101. [Google Scholar] [CrossRef] [Green Version]
  35. Chau, K.-W.; Jiang, Y.-W. Three-Dimensional pollutant transport model for the Pearl River Estuary. Water Res. 2002, 36, 2029–2039. [Google Scholar] [CrossRef] [Green Version]
  36. Moran, M.-S.; Peterslidard, C.-D.; Watts, J.M.; Mcelroy, S. Estimating soil moisture at the watershed scale with satellite-based radar and land surface models. Can. J. Remote Sens. 2004, 30, 805–826. [Google Scholar] [CrossRef] [Green Version]
  37. Foody, G.-M. Editorial: Ecological applications of remote sensing and GIS. Ecol. Inform. 2007, 2, 71–72. [Google Scholar] [CrossRef]
  38. Ju, W.-M.; Ping, G.; Wang, J. Combining an ecological model with remote sensing and GIS techniques to monitor soil water content of croplands with a monsoon climate. Agric. Water Manag. 2010, 97, 1221–1231. [Google Scholar] [CrossRef]
  39. Malekmohammadi, B.; Blouchi, L.-R. Ecological risk assessment of wetland ecosystems using Multi Criteria Decision Making and Geographic Information System. Ecol. Ind. 2014, 41, 133–144. [Google Scholar] [CrossRef]
  40. Ye, Y.-H.; Liang, Y.-X.; Sheng, Y.-Q.; Xie, L.-S. Several issues worthy of discussion in the Technical Specifications for Assessment of Ecological Environment. Trop. Geogr. 2009, 29, 404–406. [Google Scholar]
  41. Xu, H.-Q.; Tang, F. A new generation of Landsat series satellites: New features of Landsat8 remote sensing imagery and its ecological and environmental significance. Acta Ecol. Sin. 2013, 33, 3249–3257. [Google Scholar]
  42. Hu, X.-S.; Xu, H.-Q. A new remote sensing index for assessing the spatial heterogeneity in urban ecological quality: A case from Fuzhou City, China. Ecol. Indic. 2018, 89, 11–21. [Google Scholar] [CrossRef]
  43. Xu, H.-Q.; Wang, M.-Y.; Shi, T.-T.; Guan, H.-D.; Fang, G.-Y.; Lin, Z.-L. Prediction of ecological effects of potential population and impervious surface increases using a remote sensing based ecological index (RSEI). Ecol. Indic. 2018, 93, 730–740. [Google Scholar] [CrossRef]
  44. Bai, X.-Y.; Du, P.-J.; Guo, S.-C.; Zhang, P.; Lin, C.; Tang, P.-F.; Zhang, C. Monitoring Land Cover Change and Disturbance of the Mount Wutai World Cultural Landscape Heritage Protected Area, Based on Remote Sensing Time-Series Images from 1987 to 2018. Remote Sens. 2019, 11, 1332. [Google Scholar] [CrossRef] [Green Version]
  45. Yue, H.; Liu, Y.; Li, Y.; Lu, Y. Eco-Environmental quality assessment in China’s 35 major cities based on remote sensing ecological index. IEEE Access. 2019, 7, 51295–51311. [Google Scholar] [CrossRef]
  46. Shan, W.; Jin, X.-B.; Ren, J.; Wang, Y.-C.; Xu, Z.-G.; Fan, Y.-T.; Gu, Z.-M.; Hong, C.-Q.; Lin, J.-H.; Zhou, Y.-K. Ecological environment quality assessment based on remote sensing data for land consolidation. J. Clean. Prod. 2019, 239, 118126. [Google Scholar] [CrossRef]
  47. Luo, H.; Wang, L.; Fang, J.; Li, Y.; Li, H.; Dai, S. NDVI, Temperature and Precipitation Variables and Their Relationships in Hainan Island from 2001 to 2014 Based on MODIS NDVI. In Geo-Informatics in Resource Management and Sustainable Ecosystem; Bian, F., Xie, Y., Eds.; Springer: Berlin/Heidelberg, Germany, 2016; pp. 336–344. [Google Scholar]
  48. Thakkar, A.-K.; Desai, V.-R.; Patel, A.; Potdar, M.-B. An effective hybrid classification approach using tasseled cap transformation (TCT) for improving classification of land use/land cover (LU/LC) in semi-arid region: A case study of Morva-Hadaf watershed, Gujarat, India. Arab. J. Geosci. 2016, 9, 180. [Google Scholar] [CrossRef]
  49. Xu, H.; Shi, T.; Wang, M.; Fang, C.; Lin, Z. Predicting effect of forthcoming population growth–induced impervious surface increase on regional thermal environment: Xiong’an New Area, North China. Build. Environ. 2018, 136, 98–106. [Google Scholar] [CrossRef]
  50. Estoque, R.-C.; Murayama, Y.; Myint, S.-W. Effects of landscape composition and pattern on land surface temperature: An urban heat island study in the megacities of Southeast Asia. Sci. Total Environ. 2017, 577, 349–359. [Google Scholar] [CrossRef]
  51. Xiao, R.; Liu, Y.; Huang, X. Exploring the driving forces of farmland loss under rapidurbanization using binary logistic regression and spatial regression: A case study of Shanghai and Hangzhou Bay. Ecol. Indic. 2018, 95, 455–467. [Google Scholar] [CrossRef]
  52. Mcgarigal, K.; Marks, B.-J. FRAGSTATS—Spatial Pattern Analysis Program for Quantifying Landscape Structure. Gen. Tech. Rep. PNW 1995, 351. [Google Scholar] [CrossRef]
  53. Wang, J.; Xu, C. Geodetector: Principle and prospective. Acta Geogr. Sin. 2017. [CrossRef]
  54. Wang, S.-X.; Yao, Y.; Zhou, Y. Analysis of Ecological Quality of the Environment and Influencing Factors in China during 2005–2010. Int. J. Environ. Res Public Health 2014, 11, 1673–1693. [Google Scholar] [CrossRef]
  55. Xu, H.-Q.; Huang, S.-L.; Zhang, T.-J. Built-Up land mapping capabilities of the ASTER and Landsat ETM+ sensors in coastal areas of southeastern China. Adv. Space Res. 2013, 52, 1437–1449. [Google Scholar] [CrossRef]
  56. Hami Government Network. Available online: http://www.hami.gov.cn/info/1084/161767.htm (accessed on 5 September 2020).
  57. Lei, Y.; Li, X.-Q.; Ling, H.-B. Model for calculating suitable scales of oases in a continental river basin located in an extremely arid region, China. Environ. Earth Sci. 2015, 73, 571–580. [Google Scholar] [CrossRef]
  58. Cao, S.-X.; Chen, L.; Shankman, D. Excessive reliance on afforestation in China’s arid and semi-arid regions: Lessons in ecological restoration. Earth-Sci. Rev. 2011, 104, 240–245. [Google Scholar] [CrossRef]
  59. Zhao, H.-B.; Yu, D.-F.; Miao, C.-H. Research on the Location Layout Characteristics and Influencing Factors of Cultural Facilities in Zhengzhou City Based on POI Data. Sci. Geogr. Sin. 2018, 9. [Google Scholar] [CrossRef]
  60. Hami Government Network. Available online: http://www.hami.gov.cn/info/1042/15216.htm (accessed on 5 September 2020).
  61. Hami Government Network. Available online: http://www.hami.gov.cn/info/1645/15581.htm (accessed on 5 September 2020).
  62. Wang, S.-X.; Wang, S.-L. Land use/land cover change and their effects on landscape patterns in the Yanqi Basin, Xinjiang (China). Environ. Monit. Assess. 2013, 185, 9729. [Google Scholar] [CrossRef] [PubMed]
  63. Hao, R.-F.; Yu, D.-Y.; Liu, Y.-P.; Liu, Y.; Qiao, J.-M.; Wang, X.; Du, J.-S. Impacts of changes in climate and landscape pattern on ecosystem services. Sci. Total Environ. 2017, 579, 718–728. [Google Scholar] [CrossRef]
  64. Liu, Q.; Yang, Z.; Han, F.; Shi, H.; Wang, Z.; Chen, X. Ecological Environment Assessment in World Natural Heritage Site Based on Remote-Sensing Data. A Case Study from the Bayinbuluke. Sustainability 2019, 11, 6385. [Google Scholar] [CrossRef] [Green Version]
  65. Zhu, Z.-Y.; Kasimu, A. Spatial-Temporal evolution of habitat quality in Yili Valley based on geographical detectors and its influencing factors. Chin. J. Ecol. 2020. [CrossRef]
  66. Chen, S.; Lu, G.; MA, Y.-G.; Zhu, H.-Q.; Zhao, J.-J. Temporal and spatial pattern analysis of land use in typical oasis in the upper reaches of the Tarim River. J. Northwest A&F Univ. (Nat. Sci. Ed.) 2020, 7, 113–122. [Google Scholar] [CrossRef]
  67. Liu, J.; Jin, T.; Liu, G. Analysis of land use/cover change from 2000 to 2010 and its driving forces in Manas River Basin, XinJiang. Acta Ecol. Sin. 2014, 34, 3211–3233. [Google Scholar]
  68. Zhang, X.-X.; Jie, Y.-W.; Wei, J.-J.; Lv, L.-L. The temporal and spatial evolution process of the Dunhuang oasis landscape in the arid area from 1986 to 2015. Arid Zone Res. 2017, 3, 669–676. [Google Scholar] [CrossRef]
  69. Dong, W.; Yang, Y.; Zhang, X.-L.; Tao, J.; Wang, B.-W. Analysis of Urban Land Expansion and Driving Forces in Oasis on the Northern Slope of Tianshan Mountains. Arid Zone Res. 2011, 6, 980–985. [Google Scholar] [CrossRef]
  70. Li, Z.-Z. Research on the Spatiotemporal Variation of Ecological Vulnerability and the Relationship of Land Use in Gansu Province. Master’s Thesis, Lan Zhou University, Lan Zhou, China, 2019. [Google Scholar]
  71. Diao, W.-J.; Zhao, Y.; Zhai, J.-Q.; He, F. Analysis on the Spatio-temporal Evolution Law and Driving Factors of Minqin Oasis Area from 1987 to 2017. J. Irrig. Drain. 2019, 10, 106–113. [Google Scholar] [CrossRef]
  72. Zhang, H.; Wu, J.-W.; Zheng, Q.-H.; Yu, Y.-J. A preliminary study of oasis evolution in the Tarim Basin, Xinjiang, China. J. Arid Environ. 2003, 55, 545–553. [Google Scholar] [CrossRef]
  73. Amuti, T.; Luo, G. Analysis of land cover change and its driving forces in a desert oasis landscape of Xinjiang, northwest China. Solid Earth 2014, 5, 1071–1085. [Google Scholar] [CrossRef] [Green Version]
  74. Dipanjan, D.-M.; Atrayee, B. Quantifying land surface temperature change from LISA clusters: An alternative approach to identifying urban land use transformation. Landsc. Urban Plan. 2016, 153, 51–65. [Google Scholar] [CrossRef]
  75. Zhong, J.-L.; Li, Z.-G.; Suna, Z.-S.; Sun, Z.-S.; Tian, Y.-J.; Yang, F. The spatial equilibrium analysis of urban green space and human activity in Chengdu, China. J. Cleaner Prod. 2020, 259. [Google Scholar] [CrossRef]
  76. Li, D.-S.; Wu, R.-W. A Dynamic Analysis of Green Productivity Growth for Cities in Xinjiang. Sustainability 2018, 10, 515. [Google Scholar] [CrossRef] [Green Version]
  77. Jing, Y.-Q.; Zhang, F.; He, Y.-F.; Kung, H.-T.; Johnsone, V.-C.; Arikena, M. The region of HH mostly reached the significant level of 0.01 in 2000 and 2018. Ecol. Indic. 2020, 110, 105874. [Google Scholar] [CrossRef]
  78. Jing, Y.-Q.; Zhang, F.; He, Y.-F.; Hsiang, K. Assessment of spatial and temporal variation of ecological environment quality in Ebinur Lake Wetland National Nature Reserve, Xinjiang, China. Ecol. Indic. 2020, 110, 105874. [Google Scholar] [CrossRef]
  79. Wei, X.; Qiao, Y.; Wang, P. Dynamic monitoring of ecological environment based on remote sensing and GIS-taking Xiangning county, Shanxi Province as an example. J. Geo-Inf. Sci. 2010, 1, 111–118. [Google Scholar]
Figure 1. Sketch map of the Hami Oasis.
Sustainability 12 07716 g001
Figure 2. RSEI Classification of the Hami Oasis from 2000 to 2018.
Sustainability 12 07716 g002
Figure 3. 2000–2018 the Hami Oasis Change Detection.
Sustainability 12 07716 g003
Figure 4. Standard deviation spatial distribution of the ecological quality of the ellipse.
Sustainability 12 07716 g004
Figure 5. Analysis of the moving window of ecological quality of the Hami Oasis from 2000 to 2018.
Sustainability 12 07716 g005aSustainability 12 07716 g005b
Figure 6. Interactive detection and ecological detection results of the ecological quality of the Hami Oasis. Note: The addition of * indicates that the interaction between the two factors represents nonlinear enhancement, the absence of * indicates dual-factor enhancement, and the addition of + indicates a significant difference in ecological exploration; otherwise, there is no mark.
Sustainability 12 07716 g006
Figure 7. Hami Oasis RSEI Moran’s I Index Chart for 2000 and 2018.
Sustainability 12 07716 g007
Figure 8. LISA Cluster Map.
Sustainability 12 07716 g008
Figure 9. LISA Significance Map.
Sustainability 12 07716 g009
Table 1. Types of interactions between the two covariates.
Reference for JudgingInteraction Type
q(X1 ∩ X2) < Min(q(X1), q(X2))nonlinear weakening effect
Min(q(X1), q(X2)) < q(X1 ∩ X2) < Max(q(X1), q(X2)single factor nonlinear weakening effect
q(X1 ∩ X2) > Max(q(X1), q(X2))mutual strengthening effect
q(X1 ∩ X2) = (q(X1) + q(X2))independence
q(X1 ∩ X2) > q(X1) + q(X2)nonlinear strengthening effect
Table 2. Ecological quality driving factors.
VariablesStandard of Classification
Slope (X1)Extracted from DEM data and classed into five categories with natural breaks.
GDP (X2)Classed into five categories with natural breaks.
Precipitation (X3)Classed into five categories with natural breaks.
Road (X4)Kernel density of river is created and classed into five categories with natural breaks.
Population density (X5)Classed into five categories with natural breaks.
Temperature (X6)Classed into five categories with natural breaks.
River (X7)Kernel density of river is created and classed into five categories with natural breaks.
Land use (X8)Classification of Land Use Status (GB/T21010-2017).
Table 3. Principal component analysis of the remote sensing ecological index.
YearIndexPC1PC2PC3PC4
2000NDVI0.6150.262−0.334−0.664
LSM0.2350.638−0.3480.645
NDBSI0.631−0.671−0.1090.375
LST0.410.2720.8690.05
Eigenvalues0.0470.0070.0030.001
Eigenvalue contribution rate (%)81.8511.995.190.95
2018NDVI0.678−0.026−0.141−0.721
LSM−0.60.4620.203−0.621
NDBSI0.3270.886−0.1320.301
LST0.2710.020.960.066
Eigenvalues0.0620.0080.0030
Eigenvalue contribution rate (%)84.4111.144.10.33
Table 4. Mean changes of the four indicators and remote sensing ecological index (RSEI).
YearItemNDVILSMNBDSILSTRSEI
2000Mean0.4890.2610.9050.6330.223
Standard deviation0.140.0870.0810.1560.174
Load to PC10.910.48−0.94−0.85
2018Mean0.5050.2780.9420.4810.396
Standard deviation0.1780.0640.0430.1880.207
Load to PC10.940.42−0.86−0.75
Table 5. Statistics of the ecological grades of the Hami Oasis from 2000 to 2018.
RSEI GradeYear 2000Year 2018
Area/km2Percent/%Area/km2Percent/%
poor (0–0.2)927.8267.94296.1721.69
fair (0.2–0.4)205.8815.08461.6633.80
medium (0.4–0.6)147.3410.79275.3620.16
good (0.6–0.8)80.945.93330.1724.18
excellent (0.8–1)3.740.272.390.18
Table 6. Changes in the ecological quality of the Hami Oasis from 2000 to 2018.
Grade2000–2018 Year
Area/km2Percent/%
positive97.57.14
unchanged1173.1985.90
negative95.036.96
Table 7. Detection results of factors of ecological quality of the Hami Oasis.
SlopeGDPPrecipitationRoadPopulation DensityTemperatureRiverLand Use
q statistic0.056 ***0.545 ***0.489 ***0.122 ***0.51 ***0.325 ***0.114 ***0.647 ***
p value0.0000.0000.0000.0000.0000.0000.0000.000
*** p < 0.001

