Article

Fluctuations in Hong Kong Hotel Industry Room Rates under the 2019 Novel Coronavirus (COVID-19) Outbreak: Evidence from Big Data on OTA Channels

1
Shenzhen Tourism College, Jinan University, Shenzhen 518053, China
2
School of Hotel and Tourism Management, The Hong Kong Polytechnic University, 17 Science Museum Road, TST East, Kowloon, Hong Kong 999077, China
*
Author to whom correspondence should be addressed.
Sustainability 2020, 12(18), 7709; https://doi.org/10.3390/su12187709
Submission received: 28 August 2020 / Revised: 11 September 2020 / Accepted: 16 September 2020 / Published: 18 September 2020

Abstract

:
The infectious pneumonia caused by the 2019 novel coronavirus (COVID-19) has spread rapidly worldwide, crippling the global tourism industry’s development and operations. In Hong Kong, where tourism is a pillar industry, the hotel industry is essential to maintaining a stable economy. Facing multiple forms of pressure, the industry’s status deserves close attention. More than 200 hotels in Hong Kong were taken as the research set in this study. A Python-based web crawler was used to collect daily hotel prices from various online travel agencies. Repeated-measures analysis of variance (ANOVA), correlation analysis, and descriptive analysis were employed to study hotels’ room rate fluctuations over time. Results indicated that room rates across hotels in Hong Kong were primarily influenced by holidays and festivities prior to COVID-19, whereas rates tended to decline after the outbreak. Data analysis based on hotels’ star ratings revealed that 5-star hotels were relatively less affected by COVID-19 while 4- and 4.5-star hotels were most seriously affected. District-level analysis also showed that hotel room rates were differentially influenced by the virus: Hong Kong’s Islands district was hit hardest, followed by Kowloon. These findings offer valuable implications for hotel managers and relevant government departments in making rational decisions based on the current market state.

1. Introduction

An infectious pneumonia caused by a novel coronavirus (COVID-19) was first identified in China in late 2019. The number of infections has since climbed across the globe: the World Health Organization declared the viral outbreak a “global public health emergency” on 31 January and labeled it a “global pandemic” on March 11. This pandemic has severely damaged economic and industrial development around the world. The hotel industry, which is capital- and labor-intensive, has been particularly affected due to its large investment and high operating costs. According to data from Smith Travel Research, China’s Spring Festival in early January 2020 brought hotel occupancy to 70% in mainland China; however, this rate fell sharply after the COVID-19 outbreak, plummeting to 17% by the end of January [1]. The tourism industry and hotels play important roles in the Asia-Pacific region’s economic and political climate [2]. It is, therefore, necessary to carefully assess the hotel industry’s standing amid COVID-19.
As a well-known international metropolis, Hong Kong has ranked among the most popular tourist cities in the world for nine successive years. Tourism is one of its pillar industries, and the tourism industry accounts for about 5% of GDP (Tourism Research Center, Chinese Academy of Social Sciences, https://www.sohu.com/a/301312989_126204). Hotels hold a vital position in Hong Kong’s economy. According to recent data from the Hong Kong Tourism Board (HKTB) (https://securepartnernet.hktb.com), the pandemic led to a 98% decline in tourist arrivals during the Spring Festival in February 2020 compared to 2019. The lack of tourists sparked pessimism in the hotel industry as firms faced an overall occupancy rate of merely 20%. On 31 January, the Hong Kong News Network reported that room rates at many 5-star hotels in the city were half their normal cost, with rates at 4-star hotels falling even more. Given this context, several questions arise related to room rate changes. What are the shifting characteristics of Hong Kong’s market? Do nuances exist in fluctuations for hotels with different star ratings and in different geographical districts? If so, how should the extent of any negative (or positive) effects of a given peak or trough be assessed in terms of their likelihood to influence hotel room rates? This study aims to clarify the current status of Hong Kong’s hotel industry. Findings can inform hotel managers’ market-based decisions and guide market supervision departments’ policy adjustments to promote sustainable market development.
The paper proceeds as follows. Section 2 reviews the existing literature about the effects of infectious diseases on hotels and hotel room rates research. Section 3 describes the data collection and the method employed in the analysis. Section 4 presents the findings of data analysis and summarizes. Section 5 makes some discussion points and states implications for managers, consumers, and market supervision departments. Finally, Section 6 states the conclusions, as well as the limitations of the study.

2. Literature Review

2.1. Research on the Effects of Infectious Diseases on Hotels

Studies pertaining to hotels and infectious disease outbreaks have focused on several large-scale illnesses, such as the SARS outbreak in Guangdong, China in 2003; the H1N1 outbreak in Mexico in 2009; and the Ebola outbreak in West Africa in 2014. In a study of SARS pneumonia, the Hong Kong Metropole Hotel Super Spread incident drew people’s attention to the role of viral transmission in non-medical settings [3]. Scholars have also found that SARS had a significant negative impact on Taiwan’s hotel stock returns, mainly due to declining hotel sales revenue and increasing room rate discounts [4]. During the 2009 H1N1 outbreak, questionable prevention and control measures led to the collective segregation of guests and employees at The Metropark Hotel. This instance exemplified a lack of effective communication between hotels and public health supervision departments [5]. The hotel industry in Hong Kong and many other regions faced adverse consequences from the virus [6]. Society has since paid growing attention to the prevention and control of large-scale infectious diseases in hotels. Nigeria’s Ebola outbreak in 2014 led hotels in major regions to cooperate immediately with disease prevention and control agencies to establish areas for healthy guests; related cost-based expenditures accounted for roughly 43.8% of all expenditures [7]. Although the hotel industry has learned valuable lessons from prior infectious disease crises, including improving epidemic prevention and sanitation systems and mitigating the direct impacts of viral spread, hotels have remained somewhat passive in addressing the indirect influence of COVID-19.
The COVID-19 pandemic has compelled researchers and practitioners to consider the development of the tourism and hotel industries. Following the outbreak, global news reports and social media coverage were posited to inform individuals’ travel decisions, in turn affecting tourism revenue and destination marketing [8]. More resources will likely be allocated to disease control, as travel can increase the risk of viral infection. Governmental travel bans in various countries have exacerbated the negative impact of COVID-19 on the tourism industry [9]. The strong transmissibility of the virus, coupled with the timing of China’s 2020 Spring Festival, US–China trade friction, and other factors, has caused the economic consequences of COVID-19 to exceed those of SARS in 2003 [10] for hotels and other tourism industries. Overall, the far-reaching effects of COVID-19 have placed many people and businesses in challenging situations. Most relevant studies have involved overall descriptions and evaluations of the hotel industry, with few pertaining specifically to hotels’ operational statuses. As a relatively early study on the outbreak’s influence on hotel price fluctuations, this article presents an in-depth analysis of hotel industry operations amid COVID-19 to uncover trends in hotel prices.

2.2. Research on Hotel Room Rates

Recent hotel-related research has focused on revenue [11], occupancy rates [12], customer satisfaction [13], and online reviews [14]. Studies on room rate differences have largely involved sales channels and price fluctuations over time. In terms of hotel marketing, traditional offline sales channels have existed for quite some time, whereas online travel agents (OTAs) recently became a major online avenue for room sales. Online hotel market share jumped to nearly 70% in recent years. Despite the relatively high cost of OTAs as intermediaries, hotel room sales continue to rely on efficient, convenient OTAs [15]. The question of how to balance channel sales while maximizing hotel revenue is a prime concern among hotel managers dealing with multi-channel sales. Many scholars have explored room rate differences between offline and OTA channels in terms of boosting associated revenue. Hotels with lower occupancy rates tend to cooperate with OTAs to increase profits. When hotels are more highly ranked, OTAs generally work harder to provide corresponding resources [16]. Wang and Li considered the game process of hotels and OTAs to study commission-related decisions and applied a Stackelberg game model and cooperative optimization model of non-cooperation between hotels and OTAs in a market environment where hotels dominated. Yan compared master–slave pricing strategies and revenue between hotels and OTAs and discovered that, under mutual cooperation, retail room rates decreased and both parties’ revenue increased [17]. Long and Shi revealed that service quality, unit commission, the service cost coefficient, and the unit service compensation coefficient each exerted unique effects on traditional travel agencies and OTAs’ pricing decisions [18]. Scholars in this area have employed myriad methods and types of data, but their conclusions appear similar: cooperative exchanges between OTAs and hotels must be circular, orderly, smooth, and strategic [19]. Cooperation enables the efficient realization of long-term, sustainable benefits for hotels and OTA platforms and ultimately improves both parties’ revenue.
Despite these findings, relatively few studies have focused on hotel room rate fluctuations. As one exception, Herrmann and Herrman studied the effects of large-scale events on hotel prices and showed that average rates fluctuated greatly over time during Germany’s Oktoberfest [20]. Gricar and Bojnec studied seasonal fluctuations in hotel pricing from a longitudinal standpoint, and their findings proved the rationale for seasonal pricing [21]. Law and colleagues have examined room rate fluctuations in various settings. They studied minimum room rates on various OTA platforms; although their results did not reveal specific rules, the authors observed large differences in housing prices throughout the year of 2014 [22]. They took a hotel as a focal case in 2016 and tracked prices for 3 months, focusing on fluctuation patterns in room rates from three perspectives [23]. They later studied the frequency of hotel price fluctuations in 2019 and found that the frequency of room rate changes was tied to seller density, hotel size, hotel star rating, and consumer heterogeneity on different booking days [24]. Until now, however, much of the available literature has considered the extent of and trends in hotel price fluctuations based on a relatively small number of hotels.

2.3. Revenue Management in the Hospitality Industry Associated with Crisis Management

Studies concerning the relationship between revenue management and crisis management in the hospitality industry are relatively rich. Israeli tried to examine hospitality crisis management practices and found that hotel managers in some regions were better at crisis management (with respect to average revenue and average income per employee) than those in others [25]. However, whether there existed a causal relationship between crisis management and short-term performance remained unclear. The sudden reversal in the lodging industry’s fortunes from 2008 to 2009 has brought increasing attention to revenue and profitability for revenue managers [26]. During economic downturns, demand was lower and market prices tended to decrease, so revenue management became extremely helpful in coping with the adverse economic situation [27]. Meanwhile, for large-scale problems, crisis management might be a critical factor that determines the sustainability and success of a destination [28]. Song believed that the global economic crisis was likely to have affected the demand for hotel rooms in Hong Kong, and found that room revenue for the High Tariff A and Medium Tariff categories, in particular, was estimated to have experienced negative annual growth (−2.48% and −13.63%, respectively) in 2009 [29]. Malhotra and Venkatesh analyzed various issues relating to readiness to address crises across different types and stages. They concluded that the gaps in the crisis management strategies and the lessons learned from them could be identified to the relative impact of the negative events on the hospitality and tourism industry [30]. Alonso-Almeida focused on the connection between the impacts of the crisis, the measures taken to alleviate the crisis, and hotel performance. They found that high-quality and branded hotels with a loyal customer base performed better during the crisis and the worst performers were characterized by reactive measures (e.g., cost-cutting) [31]. Kapiki suggested that tourism could be the driving force behind Greece’s economic recovery, and provided some feasible strategies, such as enhancement of alternative forms of tourism, environmental protection, creation of quality infrastructure, and a boost of competitiveness through a tourism product that offers value for money [32]. Gehrels explored revenue management practices in two Prague hotels throughout the previous years of economic crisis. They found that accurate forecasting was needed to maximize revenue, and strategies aimed at both direct and indirect channels should be aligned to maximize value and cost-effectiveness [33]. For crisis management during COVID-19, Ivanov pointed out that automation technologies should be provided to tourism-related companies to mitigate the negative impacts of biosecurity threats on their economic performance [34]. In summary, crisis management plays an important role in revenue management from the evidence of existing studies. Therefore, it would be crucial for addressing hotel price fluctuations under the crisis of COVID-19. This can, in turn, provide better crisis management strategies or suggestions for hotel managers to maximize operating profits.

3. Methodology

3.1. Data Collection and Preprocessing

A Python-based web-crawling bot was used to gather hotel room rate data in this study. Following prior research [35,36], TripAdvisor.com was chosen as the main data collection channel because this site is the largest and most popular hotel room booking platform. Data parameters were as follows: the check-in date for each hotel was set to seven days in advance, the room was a standard double room booked for one night [37], and room rates were displayed in Hong Kong dollars (HK) (conversion rate updated at 8 September 2020, HK$1=US$0.129 US$=EU€0.109).
Similar to earlier work [37,38,39], hotel star ratings were primarily based on the scoring system on Hotels.com, which uses half-star classification. Star ratings were then cross-validated through comparison with listings on Booking.com and TripAdvisor to identify star-rating differences between these two sites for the same hotel. In such cases, 3.5- and 4.5-star hotels were retained.
COVID-19 was officially characterized by human-to-human transmission on 20 January 2020. The pre- and post-COVID-19 demarcation point was set as 27 January (marking the ninth week of the year or, alternatively, the fifth fortnight for the purposes of this study). To analyze room rate fluctuations more comprehensively, our dataset spanned 1 December 2019–17 July 2020 (229 days in total). The hotel list was obtained from the official HKTB website in September 2019. According to the released data, a map of districts in Hong Kong, together with the number of hotels and guesthouses in each district and the number of their rooms, is illustrated in Figure 1. There were 303 hotels with 84,089 rooms in total by September 2019, and 1520 guesthouses with 12,702 rooms. To simplify our research, guesthouses were excluded due to the unavailability of public data. Some hotels did not offer standard double rooms or did not allow for online reservations; as such, 237 Hong Kong hotels were included in the final dataset, and the number of hotels categorized by hotel star rating or district is shown in Table 1. Data included the hotel district, check-in date, and daily room rate on each OTA platform. More than 450,000 room rates were collected.

3.2. Method of Analysis

To evaluate room rate fluctuations in Hong Kong hotels, the same parameter (i.e., room rate) was measured repeatedly over time. Repeated-measures analysis of variance (ANOVA) constituted our key analytical approach. The date was set as the within-subject factor with hotel room rate as the dependent variable and district or star rating as the covariate. First, a rough estimate was established based on Mauchly’s test of sphericity. Second, peaks and troughs in the graph of estimated marginal means were singled out, and pairwise comparisons were performed to further evaluate related differences. Correlation analysis was conducted using the Baidu index and the mean room rate in Hong Kong. All analyses were completed in SPSS 23.0.
Room rate data were missing for certain dates when the web-crawler bot could not locate records for a given type of room on chosen OTA platforms. When excessive data were missing or an excessive number of observations were collected, the repeated-measures ANOVA would neither run properly nor return accurate results. To address these issues, each hotel’s room rates were calculated as a weekly or biweekly average to ensure effective results from repeated-measures ANOVA. The weekly average was used when non-missing data were sufficient (e.g., when analyzing overall price fluctuations), and the biweekly average was applied otherwise (e.g., when analyzing price fluctuations for a particular hotel, typically 3- or 4.5-star in this study). Corresponding fortnight or week numbers for a given date range are listed in Table 2.

4. Findings

To preliminarily determine whether room rate fluctuations and the COVID-19 pandemic were affiliated, correlation analysis was performed using the average daily room rate and the “coronavirus” Baidu index for Hong Kong. The corresponding Pearson’s correlation coefficient was −0.238 (p < 0.01), indicating a significantly negative correlation between these two factors; that is, when the “coronavirus” search index was higher, the average hotel room rate on that day was relatively lower. The COVID-19 pandemic, thus, appeared to have a more or less significant negative influence on Hong Kong hotel prices. Room rate fluctuations are analyzed in detail below.

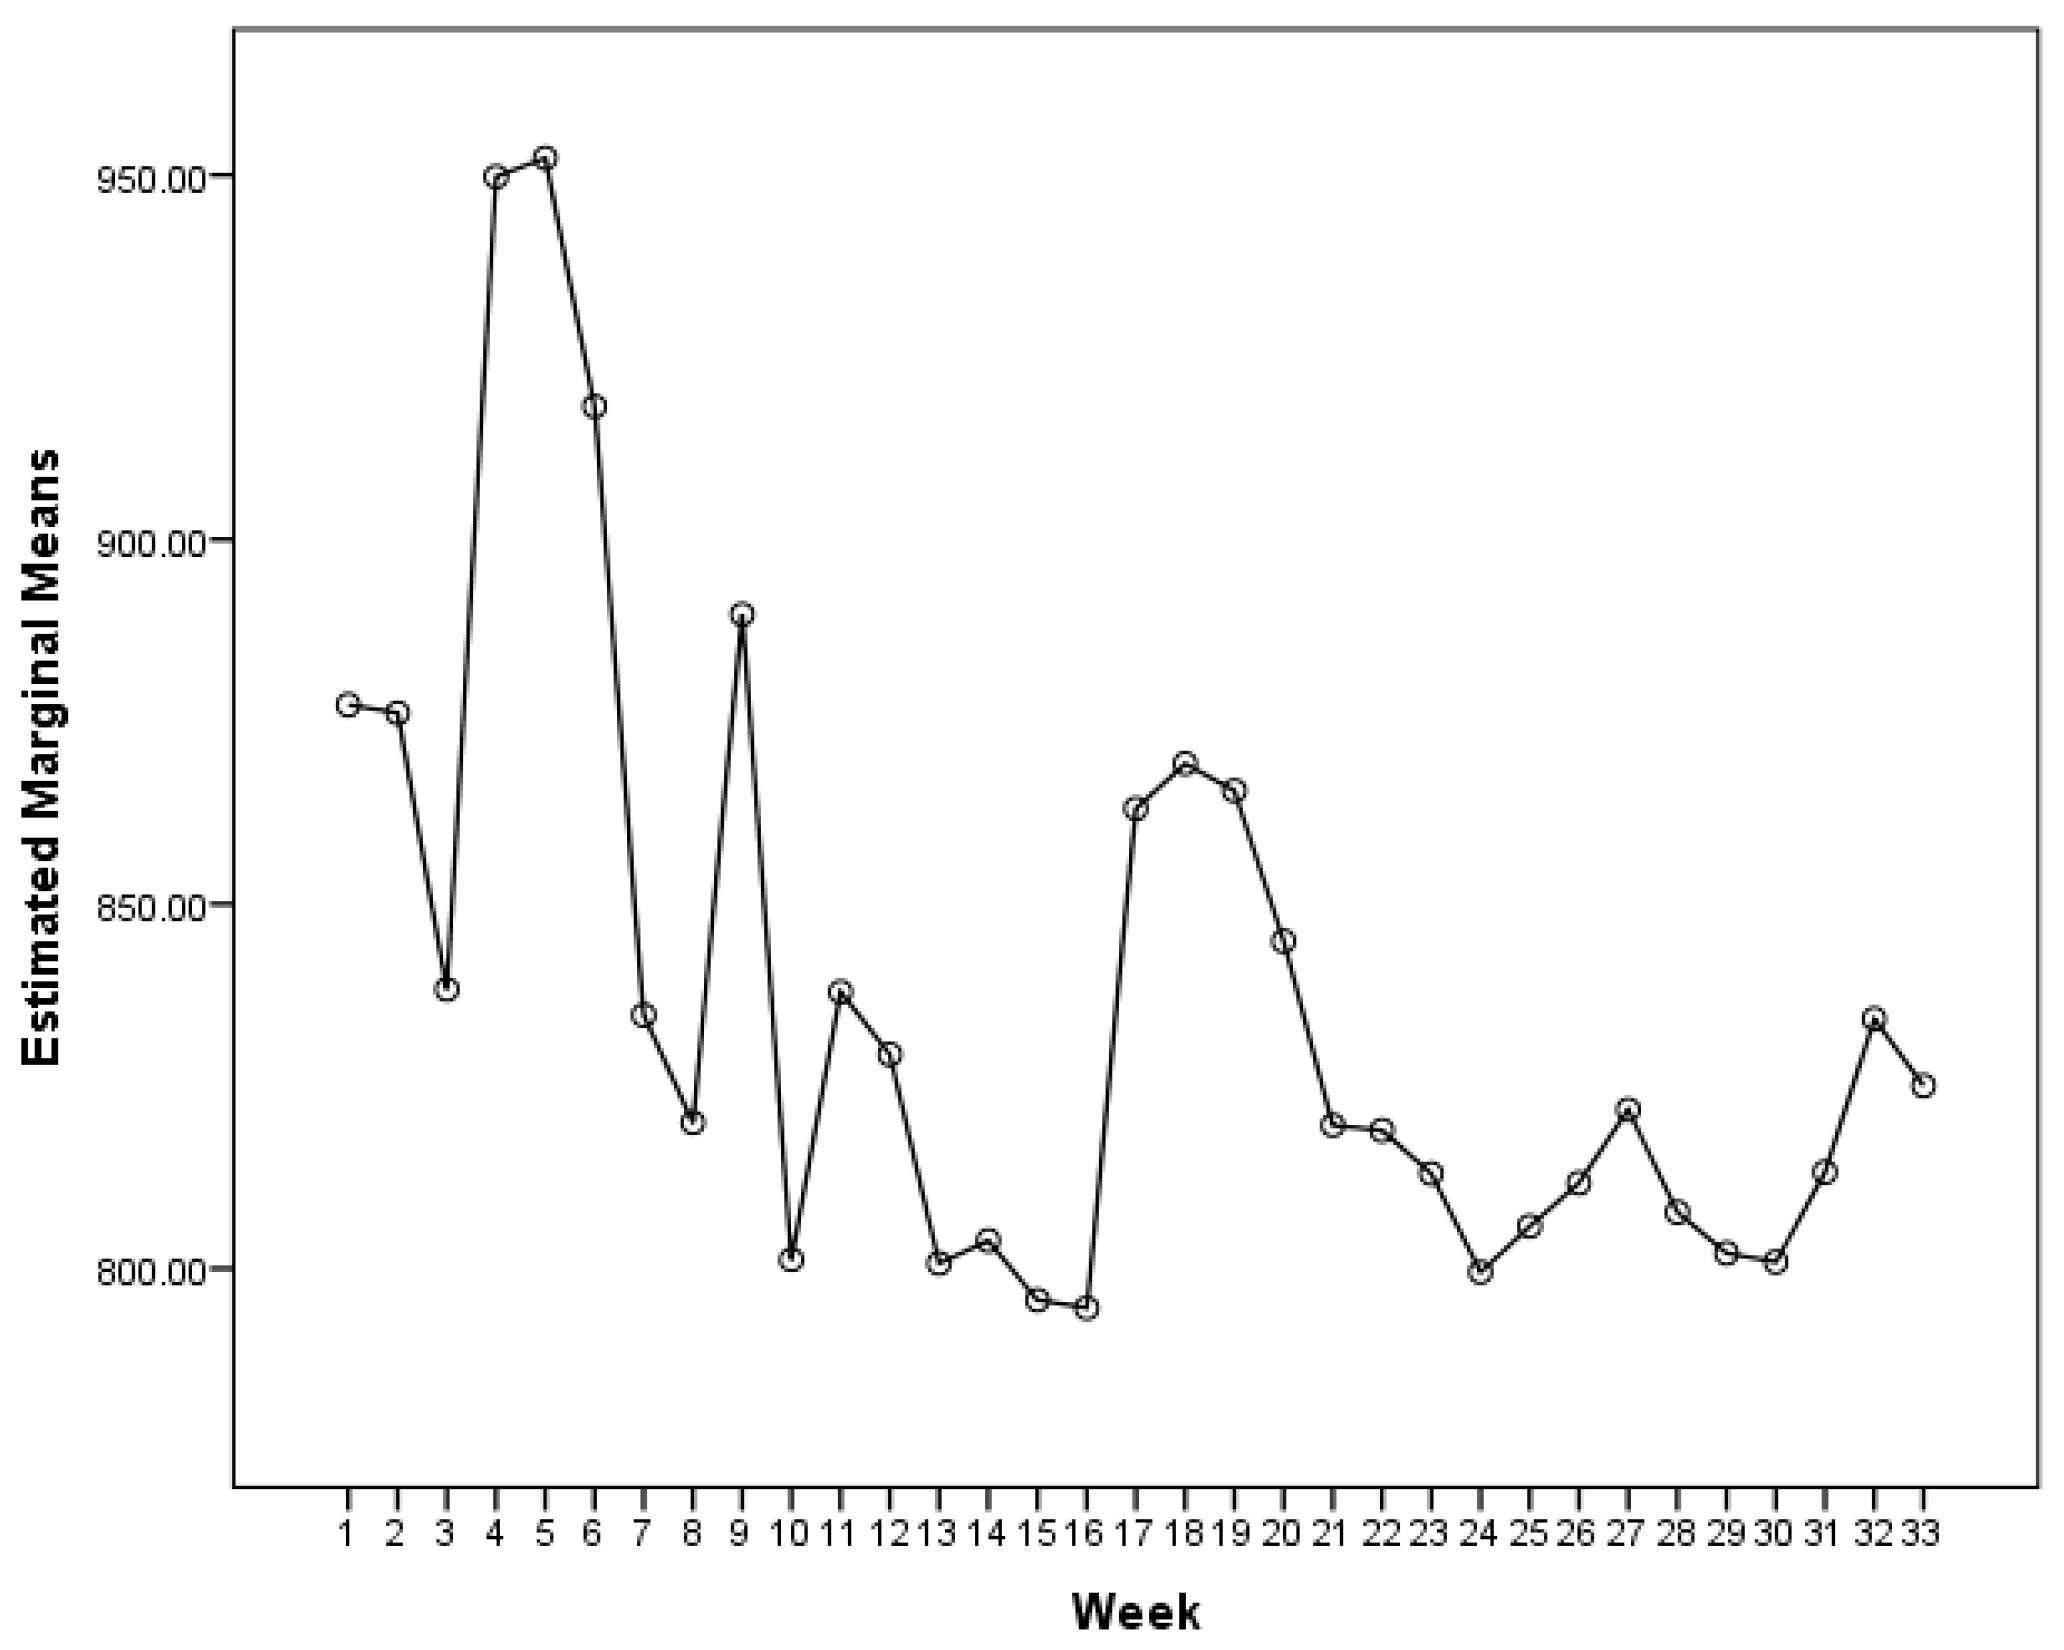
4.1. Overall Trends in Room Rate Fluctuations

As mentioned earlier, for repeated-measures ANOVA, the weekly average room rate was taken as the observed variable, the date as the within-subject variable, and the hotel star rating and district as within-subject factors. Mauchly’s test of sphericity revealed unequal variance in room rates (χ2 = 8491.119, p < 0.000). Variance results for date, date*star, and date*district remained significant after Greenhouse–Geisser correction. Therefore, hotel prices differed significantly by date, and room rate fluctuations varied from star to star and district to district. Similar to prior research [40], we identified a “turning point” in hotel room rate growth in all categories based on the occurrence of a peak (trough) in the time series where the room rate shifted from ascending (descending) to descending (ascending). The number of turning points reflected the extent of the pandemic’s impact on price fluctuations. Six troughs with eight peaks appear in Figure 2, with the descent lasting much longer than the ascent. Overall, hotel room rates in Hong Kong displayed a volatile downward trend during the study period.
Table 3 presents pairwise comparison results for several important time nodes in the graph of estimated marginal means (Figure 1). Before the ninth week, hotel prices in Hong Kong fluctuated substantially with two clear peaks in the fifth and ninth weeks. Because these two weeks coincided with New Year’s Day and the 2020 Spring Festival, respectively, pre-COVID-19 room rates appeared to be mostly affected by the holiday. After the outbreak, room rates dropped significantly within seven weeks (i.e., the 9th–16th week). A new peak emerged in the 19th week, and the graph demonstrated several slight fluctuations. Given that the 19th week included Tomb Sweeping Day, hotel prices were presumably affected by the holiday but to a lesser degree. The average room rate in the 19th week was lower than that during New Year’s Day or the Spring Festival. Therefore, hotel room rates seemed drastically affected in the early stages of the outbreak, showing a significant downward trend before gradually rising later. The final price was still lower than that before the outbreak with a difference of HK$64.659 (US$8.343/EU€7.063).

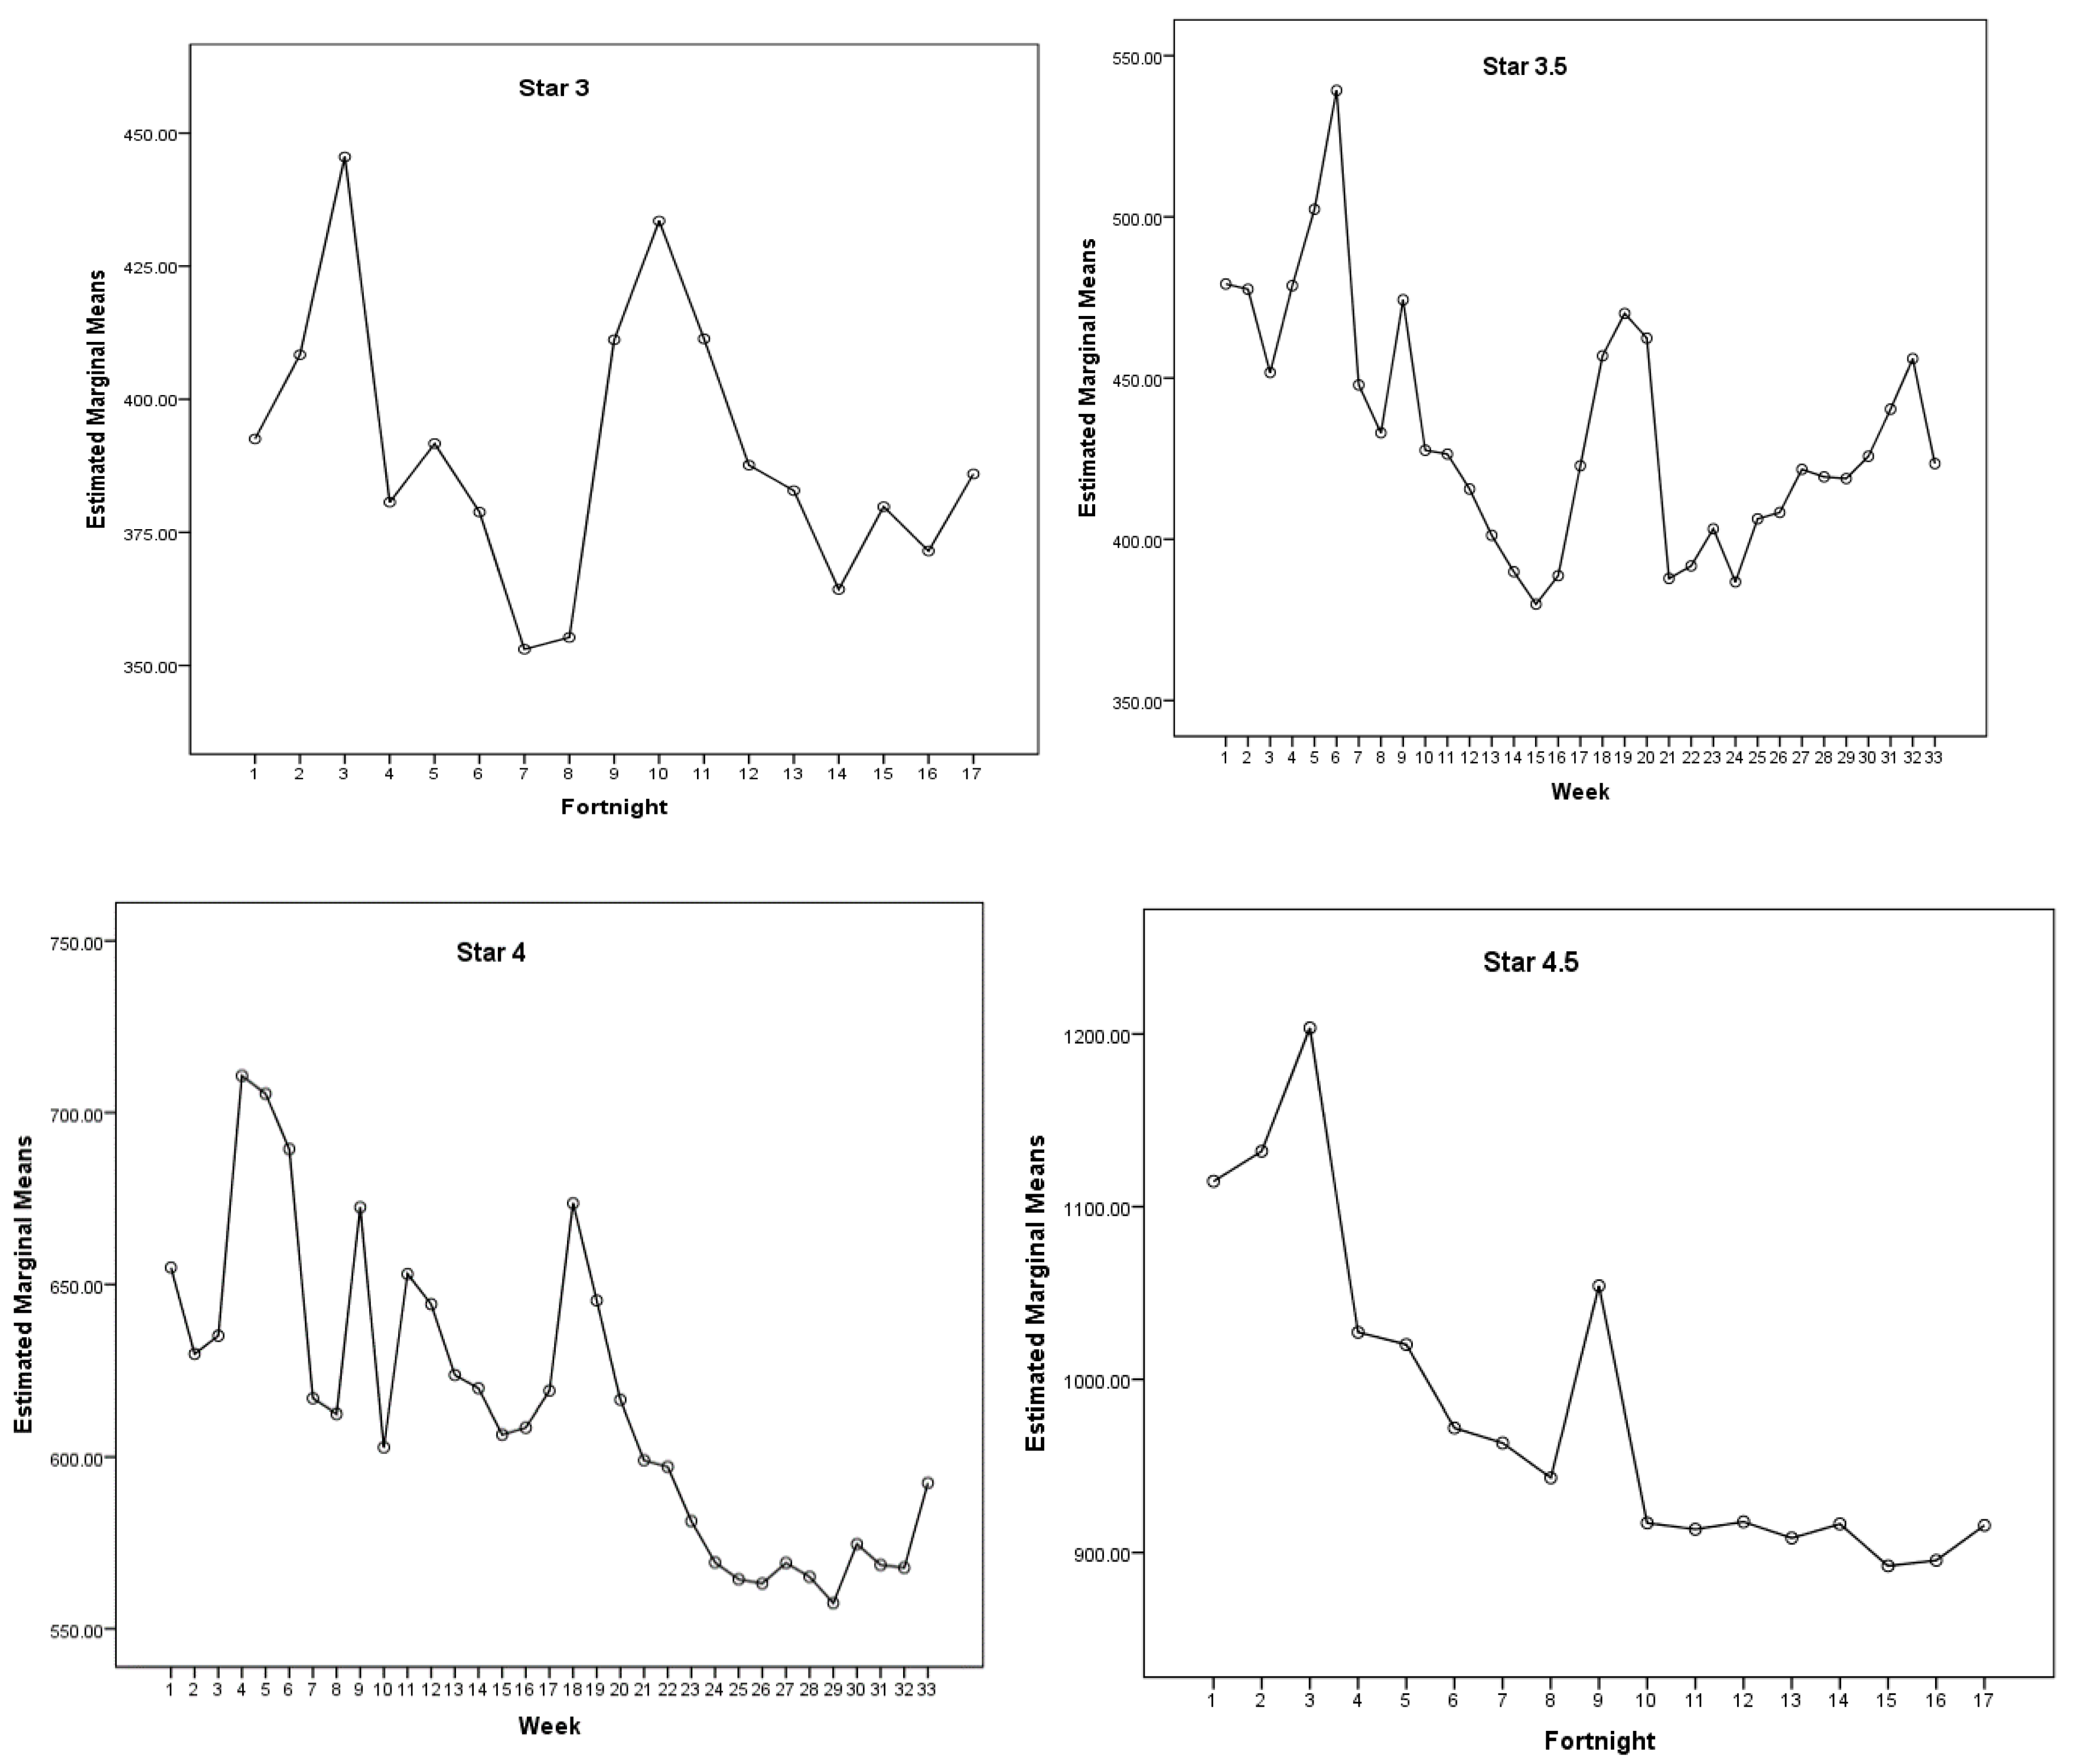
4.2. Fluctuations in Hotel Room Rates by Star Rating

When considering each hotel star level separately, the volume of data for 3- and 4.5-star hotels was relatively small; therefore, average room rates were taken on a biweekly basis. Furthermore, because our dataset included only two 2.5-star hotels, the data volume and representativeness were too small for a separate analysis. Repeated-measures ANOVA was conducted by setting weeks/fortnights as within-subject variables and district as the covariate. Findings are displayed in Table 4. All star-rated hotels had statistically significant room rate differences on different dates with the exception of 5-star hotels.
The room rate for each hotel star level rose to varying degrees around the ninth week or fifth fortnight echoing our general analysis results; that is, room prices associated with each star level before the outbreak were mainly affected by holidays such as New Year’s Day and the Spring Festival. Detailed information by star rating after the COVID-19 outbreak (i.e., the ninth week or fifth fortnight) is outlined below as shown in Table 5.
For 3-star hotels, a small decline (HK$38.632/US$4.984/EU€4.220) initially followed the COVID-19 outbreak, from the fifth to the seventh fortnight. Then several notable price peaks appeared during the 9th–11th fortnight (22 March–2 May), when the average room rate even exceeded that associated with the Spring Festival. Compared with the eighth fortnight, room rates increased by approximately HK$78.221 (US$10.093/EU€8.544) during the 10th fortnight. Prices then began to fluctuate downward. No significant difference was observed before and after the pandemic outbreak; only a slight decrease (HK$5.708/US$0.737/EU€0.624) was apparent.
The room rate for 3.5-star hotels declined rapidly by HK$94.41 (US$12.182/EU€10.313) after the outbreak. Similar to 3-star hotels, prices immediately increased from the 15th to 19th week by HK$120.352 (US$15.529/EU€13.147). While the peak was lower than during the Spring Festival (ninth week), the difference was negligible (HK$4.221/US$0.545/EU€0.461). Rates then began to show a volatile upward trend. No significant difference (merely HK$18.267/US$2.357/EU€1.996) emerged between pricing at the 32nd week compared to before the COVID-19 outbreak. Yet a sharp drop followed in the 33rd week, resulting in a rate difference of HK$50.816 (US$6.557/EU€5.551).
Rates for 4-star hotels did not fall drastically briefly after the outbreak but fluctuated and reached their first low trough in the 15th week (i.e., a decline of HK$65.973/US$8.513/EU€7.207). Prices then rose between the 17th and 19th weeks. However, this increase only lasted for a short time and was followed by a substantial decline (HK$81.173/US$10.474/EU€8.867) in the 18th–33rd weeks. Although room rates at 4-star hotels did not fluctuate much early in the pandemic, prices continued to fall as the outbreak persisted. Room rates also differed significantly compared to the beginning of the pandemic (i.e., the 9th vs. 33rd week).
Rate fluctuations at 4.5-star hotels were similar to 4-star hotels: prices declined since the COVID-19 outbreak, bottoming out at HK$76.877 (US$9.920/EU€8.398) by the eighth fortnight. A short-term and large-scale room rate rebound occurred during the ninth fortnight (17th–18th week). The peak increase surpassed room rates during the Spring Festival by HK$33.964 (US$4.382/EU€3.710). A substantial price drop followed, and the final room rate was significantly lower than before COVID-19.
No clear trend manifested for overall room rates among 5-star hotels. Figure 3 illustrates that the number and magnitude of fluctuations in 5-star hotels exceeded those of other star-rated hotels. A price decline of HK$229.922 (US$29.667/EU€25.116) occurred during the 11th–16th weeks. Two peaks then appeared during the 11th and 12th weeks as well as in the 19th to 21st weeks, followed by a drop in the 21st–24th weeks. Overall, July rates were HK$15.84 (US$2.044/EU€1.730) lower than those before COVID-19.
In sum, post-COVID-19 fluctuation patterns can be divided into three categories. The first includes 3-star and 3.5-star hotels, which demonstrated a relatively clear downward trend shortly after the outbreak with a relatively large increase during the 17th–22nd weeks. These room rates rebounded gradually over time, such that July prices were not much lower than before COVID-19. We also conducted interviews with sales staff from several travel agencies in Shenzhen, China. Interviewees reported that many consumers preferred 3-star hotels in Hong Kong (especially guests from mainland China) due to moderate prices. However, the profit margin for 3-star hotels is often relatively small, as is the price reduction for hotel rooms. These aspects may explain why room rates for 3- and 3.5-star hotels in our sample appeared less affected by COVID-19.
The second category consisted of 4- and 4.5-star hotels, whose rates behaved similarly to 3- and 3.5-star hotels early in the COVID-19 outbreak. Prices in this category displayed a considerable downward trend first before climbing near the 19th week. Even so, the duration of this increase was shorter than in the first category; after peaking, we observed an enduring large-scale price reduction among 4- and 4.5-star hotels such that their final prices were significantly lower than before the pandemic.
The third category included 5-star hotels. These hotels’ overall price change during the pandemic period was not significant. Rates increased in the early outbreak but soon recovered and then began to fluctuate periodically. Although room rates in July differed significantly from those before COVID-19, the low price was relatively similar.

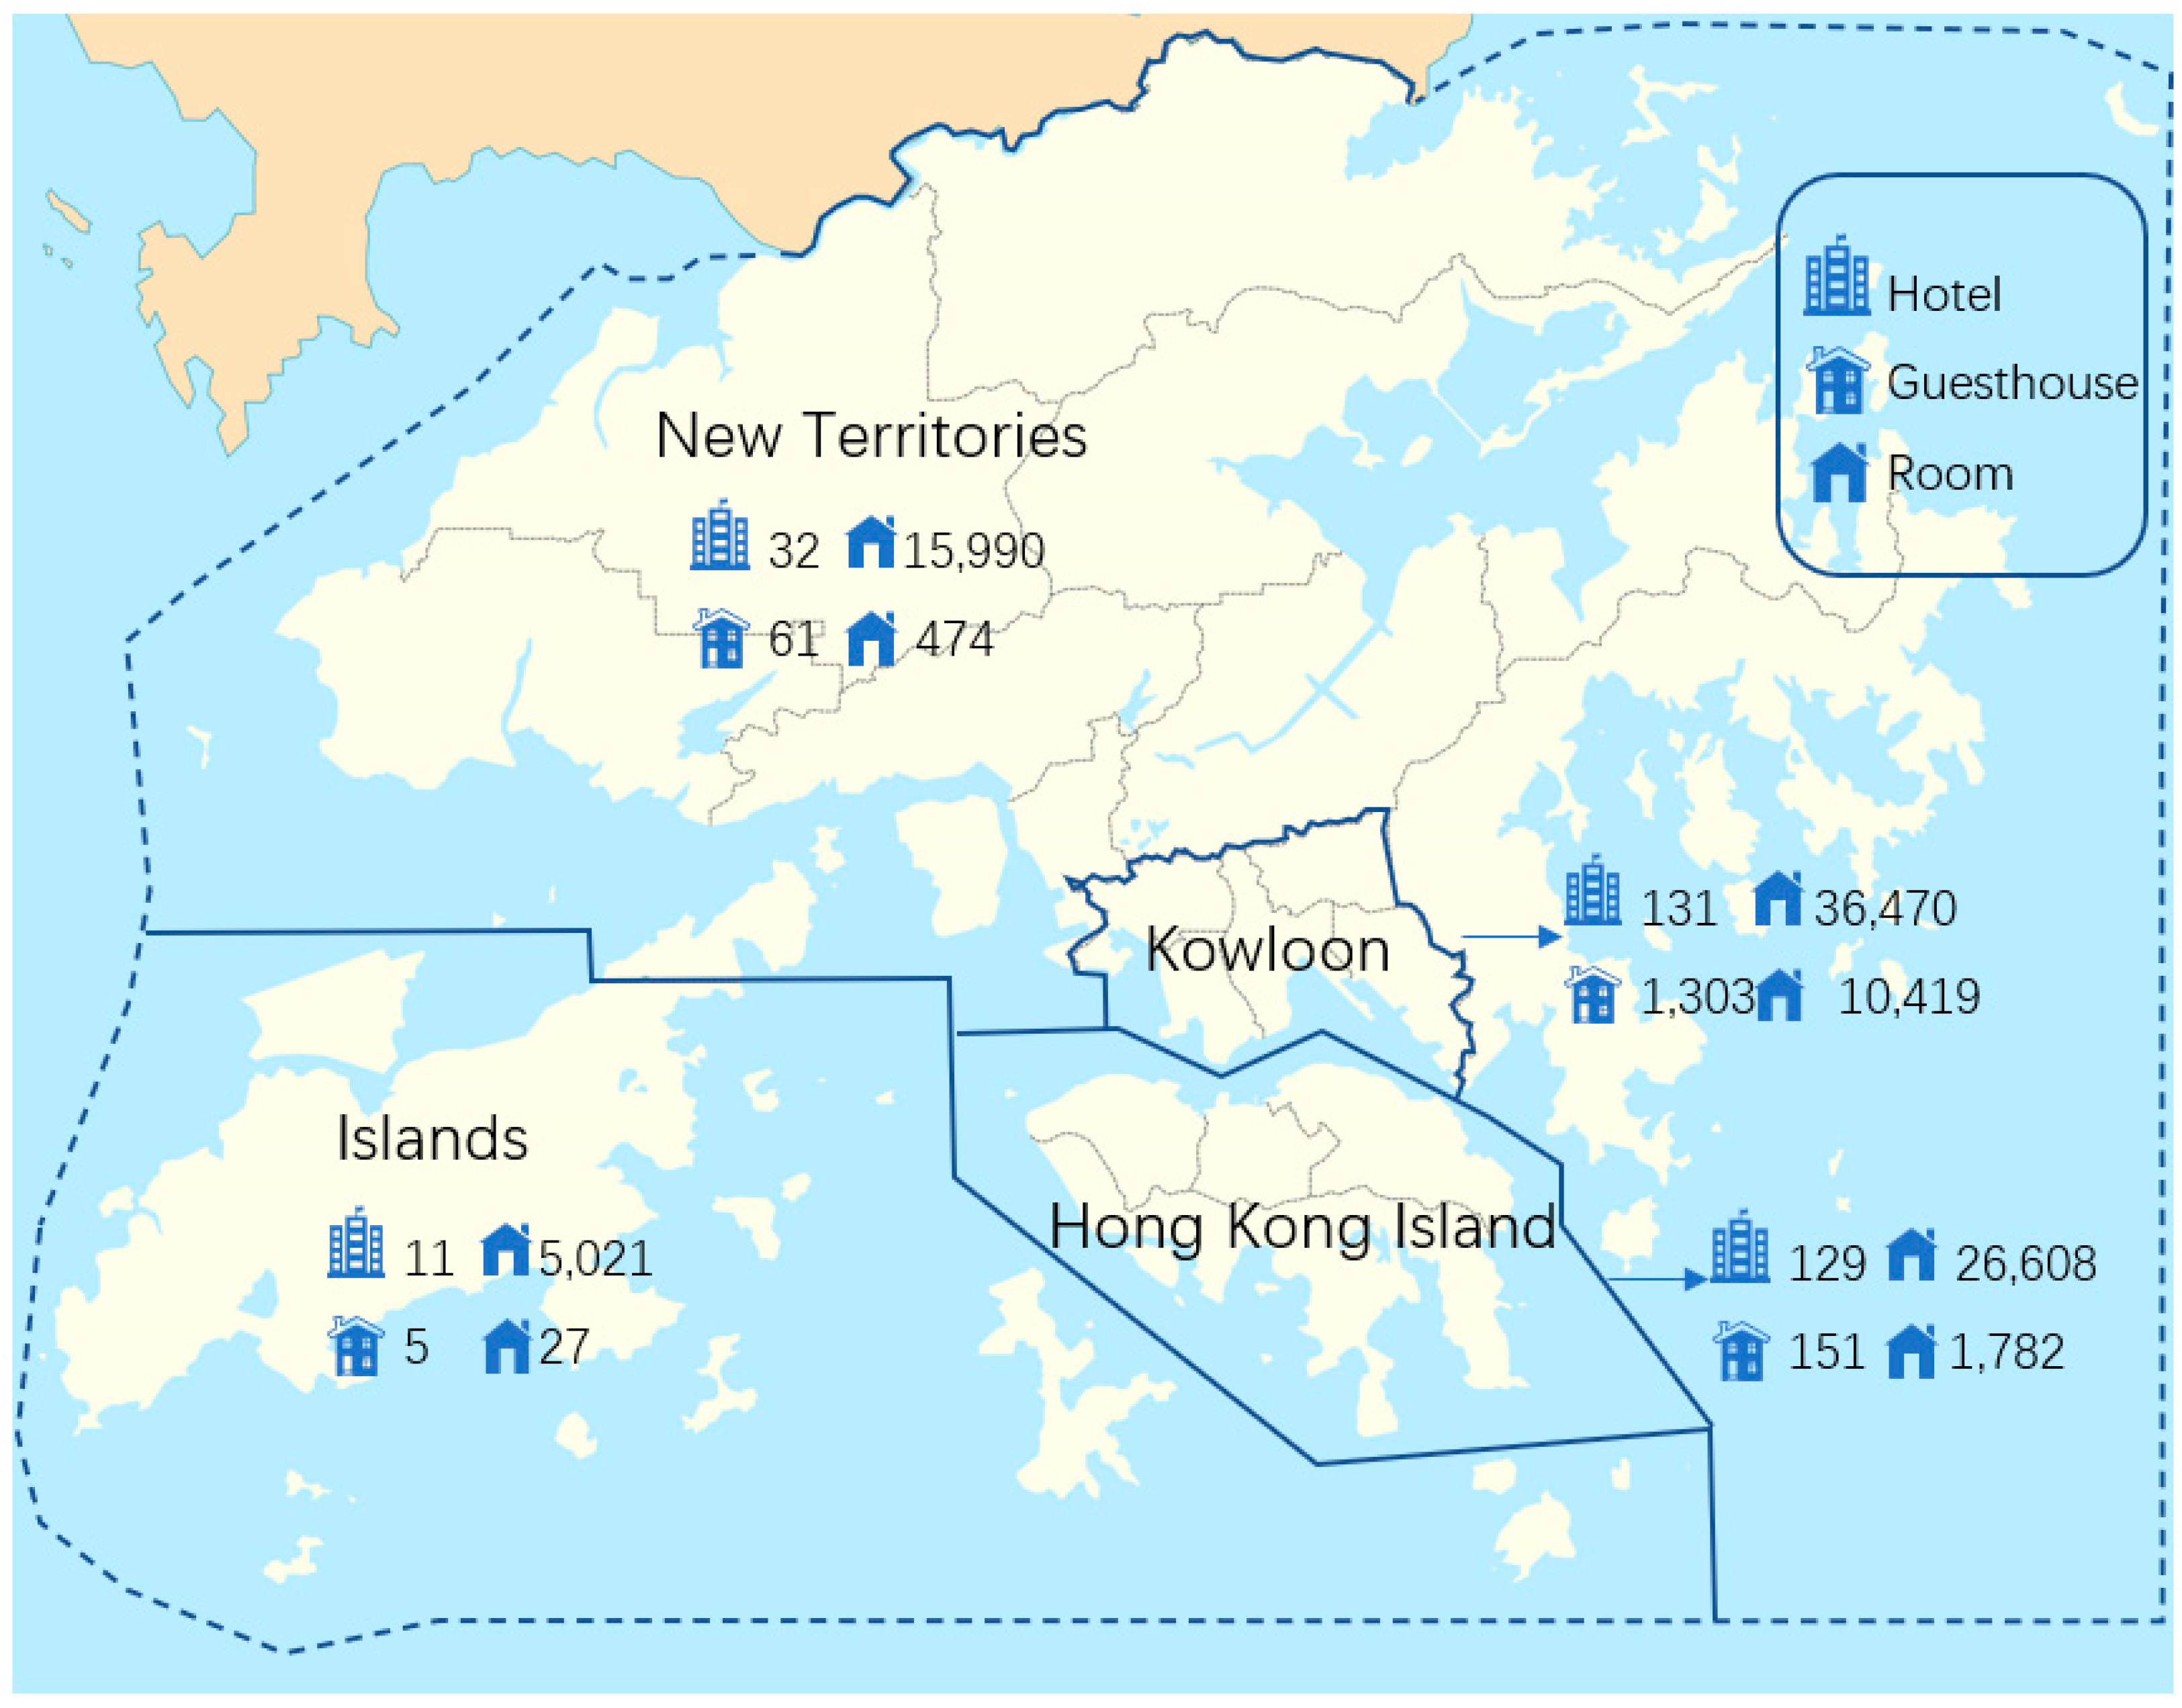
4.3. Fluctuations in Hotel Room Rates by District

To compare the influence of COVID-19 across districts, we carried out repeated-measures ANOVA using date as the within-subject variable and star ratings as the covariate. Except for New Territories districts, significant differences emerged in hotel room rates in districts at different times at a confidence interval of 0.9. Results are shown in Table 6.
Districts’ hotel room rates were further analyzed as follows: hotel room rates in the New Territories and Islands districts were taken as biweekly averaged prices due to excessive missing values; weekly averages were calculated for the other two districts (i.e., Hong Kong Island and Kowloon). Repeated-measures ANOVA results are depicted in Table 7 and Figure 4. While the graph of price fluctuations in the New Territories demonstrates no clear change-related trend, the graphs for the other three districts vary. Room rate fluctuations are discussed in greater detail below.
After the ninth week, room rates in Hong Kong Island fluctuated initially and then increased significantly (by HK$65.229/US$8.417/EU€7.126) from the 16th to 18th weeks. However, prices began to drop sharply from the 18th to 24th weeks with a decline of HK$91.480 (US$11.804/EU€9.993). Ultimately, no significant difference was found in pre- and post-COVID-19 room rates.
Rate changes in Kowloon were similar to those in Hong Kong Island in the early stages of the outbreak. Rates fluctuated up and down, rising sharply by HK$74.318 (US$9.589/EU€8.118) in the 15th week to 17th week and then declining by HK$83.421 (US$10.764/EU€9.113) in the 17th week to 24th week. Unlike Hong Kong Island, after a decline during the 24th week, no significant increase followed. Therefore, the rate prior to the outbreak differed significantly from the final price by HK$81.564 (US$10.524/EU€8.910).
After the COVID-19 outbreak (i.e., the fifth fortnight) in the New Territories, room rates changed significantly with many steep rises and falls: a decline of HK$45.896 (US$5.922/EU€5.014) from the 6th to 8th fortnights, an increase of HK$73.997 (US$9.548/EU€8.083) from the 8th to 9th fortnight, a decline of HK$65.887 (US$8.502/EU€7.197) from the 9th to 13th fortnights, and finally an increase of HK$42.304 (US$5.458/EU€4.621) from the 12th to 16th weeks. Prices in the last two weeks of July were HK$19.036 (US$2.456/EU€2.080) higher compared with before COVID-19.
Since the COVID-19 outbreak (i.e., the fifth fortnight), average room rates in the Islands dropped to some extent, with a total decline of HK$238.583 (US$30.785/EU€26.062) from the fifth to seventh weeks. After that, prices remained low with a total decrease of HK$202.172 (US$26.087/EU€22.085). This district also witnessed the largest decline in room rates overall.
Generally, when analyzing hotels in Hong Kong’s four administrative districts separately, we found that rates in the Islands and Kowloon were significantly lower than those before COVID-19. Prices showed a continuous and significant decline after the outbreak. The latest prices on Hong Kong Island did not differ significantly from those before the outbreak, and prices in the New Territories were even higher than before COVID-19.

4.4. Summary

Hotel room rates were analyzed based on overall trends, hotel star ratings, and districts. Fluctuating periods based on each factor are displayed in Table 8. Throughout this period, most hotels quickly experienced significantly declining prices after the outbreak (i.e., ninth week/fifth fortnight). These trends indicate that, after COVID-19 was officially announced, Hong Kong’s hotel market responded immediately by lowering prices. This reaction further suggests that the pandemic had a highly time-sensitive effect on online hotel prices. Prices subsequently rebounded to a more stable level, but the latest hotel rates (i.e., the 33rd week/17th fortnight) in our sample remained lower than those prior to COVID-19. Specific differences were also observed based on hotels’ star ratings and districts. Among all starred hotels, rates at 4- and 4.5-star hotels continued to decline for a relatively longer period, while prices of 3- and 5-star hotels fell for a briefer time. As for the extent of fluctuation, declines were strongest for 5-star hotels, whereas 3.5-star hotels displayed higher prices than before the outbreak. Among different districts, the Islands and Kowloon were subjected to the longest ongoing decline, while Hong Kong Island and the New Territories did not experience sustained rate drops over the long term. Room prices in the Islands fell the most. Hong Kong hotel prices underwent a fluctuating decline throughout the study period; as the pandemic persists, hospitality businesses’ short-term prospects may continue to be overshadowed by the global economic recession.
To analyze further, we took the number of turning points as reflecting the extent of pandemic-related consequences on price differences. The 237 hotels were correspondingly grouped into three categories: highly affected (4- and 4.5-star hotels), moderately affected (3 and 3.5 stars), and less affected (5 stars). This categorization partially echoes an earlier study indicating that the higher a hotel’s star rating, the greater the price increase [41] with respect to fluctuating hotel room prices during the Canton Fair in China. Our classification is also consistent with another study [24] revealing low price elasticity among hotels with higher star ratings. Similarly interesting is the fact that significant peak-to-trough (or trough-to-peak) periods identified through repeated-measures ANOVA may proxy the degree of recession (or boom) experienced by a hotel in a particular category.

5. Discussion and Implications

5.1. Discussion

The negative influence of the pandemic on Hong Kong hotels has far exceeded our expectations. Due to the increasing number of visitors during the Spring Festival, February is often Hong Kong’s peak tourist season. According to the HKTB, the average hotel room rate in February 2019 was HK$1378 (US$177.805/EU€150.531) compared to a mere HK$963 (US$124.257/EU€105.197) in February 2020. Yet data collected in this study indicate that the average hotel price in February was in fact much lower: HK$743.52 (US$95.937/EU€81.221). In this vein, this study concentrates on the shifting characteristics of the hotel market by examining the fluctuations in room rates under a period of time. Not only do the research findings imply that room rates in Hong Kong demonstrated an overall downward trend after the COVID-19 outbreak, which would be a rather obvious conclusion, but also delineate how the pricing has been evolving during the time period: rate fluctuations mainly occurred around holidays before the pandemic owing to the increased demand for accommodation in leisure time; overall prices exhibited a downward slope thereafter, implying that a slight or sudden growth, if there were, could not compensate for this declining deficit. The findings also reveal how and when the fluctuation progressively shifts from increase to decline, and vice versa.
Furthermore, our findings indicate that hotel room rate fluctuations varied across star rating levels and districts. Room rates at each hotel star level aside from 5-star hotels were significantly affected by COVID-19 but showed distinct fluctuations. According to the results, 4- and 4.5-star hotels appeared to suffer greater room rate reductions compared to 3-and 3.5-star hotels based on a more enduring decline. A plausible explanation for the drastic decline may be attributable to the comparably high price elasticity in this category. When the supply remains unchanged in a short-term period but the demand for accommodation decreases, hotel managers must have tailored their hotel room prices by presenting a lower rate to survive the contractions. As for districts, fluctuations coincided with holidays and festivities before COVID-19, conveying uniform momentum growth irrespective of hotels’ geographical location. Post-COVID-19, room rates for hotels in all districts apart from the New Territories tended to decline over time, albeit with oscillations. Room rates at hotels in the Islands dropped especially markedly, potentially due to the large number of high-star hotels in this district. Understanding star-level inequality and regional disparities on hotel room rate fluctuations offer several valuable insights and implications for research and practice.

5.2. Implications

Based on the findings, the present study offers several valuable insights for research and practice. COVID-19′s hotel industry effects seem closely tied to government-mandated travel restrictions or tourists choosing to minimize health risks and reduce travel. Low accommodation demand may, therefore, partially explain lower hotel online booking room rates. This article shed light on the interaction among occupancy rates, room rates, and hotel operations; that is, fewer tourist arrivals during the pandemic hampered hotel occupancy rates and spurred hotel price fluctuations, ultimately resulting in poor hotel operations. While studies on hotel price fluctuations have explored related factors such as price adjustment frequency [24], differences in OTA platforms [22,23], and fluctuations during large-scale festivals or exhibitions [20,41], scarce research has investigated specific public health crises such as infectious disease outbreaks. The current study focused on hotel price fluctuations amid COVID-19 and identified significant differences via repeated-measures ANOVA, greatly enhancing the reliability of our results. Resultant findings have expanded the scope of relevant research and enriched knowledge of hotel industry operations in times of public health crisis.
For hotel managers, these results offer pricing-related guidance for better revenue management. Hotels can apply our findings to make informed price adjustments based on room rate fluctuations among hotels with the same star rating and within the same geographic area. For example, five-star hotels target high-end customers, and price reductions do not particularly appeal to this consumer base. Nevertheless, hoteliers can confidently use the findings to improve their responses to cater to customers’ consumption habits during the epidemic period, or to implement appropriate strategies such as delivering high-value or dedicated hotel room products. Three-star hotels have little room for price reduction, which may partially explain their relatively stable room rates. In this case, hotel managers should plan marketing strategies, such as conferring with third-party channels on payment by e-equity cards or electronic stored value cards, to boost arrivals and reduce revenue loss, thereby yielding sustainable development of the hotel industry. Other hotels can modify their prices according to the state of the pandemic to promote sustainable operations through cost savings. Our results can also aid consumers in selecting a hotel category. For consumers, knowing when the hotel reaches a low room rate may assist them in reserving hotel rooms online. The desire to hire an upscale hotel (to make a reservation for a 5-star hotel) with a low rate (e.g., at a 4-star price) to get high-quality service does not seem to be a mirage, especially during this difficult time, thereby reducing their costs in return for better service. For market supervision departments, these findings can likewise serve as a reference for decision making. Hotel prices fell sharply during COVID-19 but may rebound once the pandemic dissipates. Taking SARS as an example, during the first month after the epidemic ended (December 2003), the tourism industry underwent “retaliatory growth” [1]. Therefore, as today’s hotel industry grapples with this pandemic, relevant departments can devise policies to enhance hotels’ operations (e.g., the low-cost requisition of hotels as designated isolation areas, tax reductions, and so on). Once the pandemic ends, relevant departments can turn their attention to maintaining market order and effectively allocating resources to ensure stable economic recovery.

6. Conclusions and Limitations

This study aimed to explore room rate fluctuations at Hong Kong hotels during COVID-19. Repeated-measures ANOVA was employed to identify the significance of such fluctuations across times, star ratings, and districts. This method was effective for assessing trends and fluctuations in our data. However, the time points suitable for repeated-measures ANOVA were relatively limited, and missing values could adversely affect our model. Average room rates were used as needed to mitigate these issues.
However, this study still has limitations that leave room for future work. First, several dynamic factors were not considered. Due to a manpower shortage, our data were collected periodically from OTA platforms for a single room category on the same check-in date; various room categories and the influences of different check-in times were not accounted for. Subsequent studies could assess relevant issues in greater detail, including room category and rate fluctuations within a single day. Using more hotels with information over a longer time horizon could also result in more accurate price fluctuation data with distinct differences.
Second, the range and volume of our dataset were relatively small: data only covered room rates in 237 Hong Kong hotels for 229 days. It was challenging to uncover other characteristics, and year-on-year comparisons were not possible. Hong Kong’s tourism and hotel industry operations appear to have worsened since August 2019. Li Hancheng, executive director of the Hong Kong Hotel Owners Association, explained that in December 2019, the average hotel occupancy rate was about 60% (a year-on-year decrease of 33%), and room rates fell by 47% year-on-year. Related changes reflecting the influence of COVID-19 are, thus, relatively insignificant. Future research should be carried out in areas especially stricken by COVID-19. Longer follow-up investigations will likely elicit more meaningful findings.
Third, it is challenging to tease out the effects of diverse factors in hotel room rate fluctuations. This study described select fluctuation trends and offered potential explanations based on COVID-19. Numerous other aspects warrant investigation, such as the factors shaping rate fluctuations and the extent to which COVID-19 affects hotel pricing. In the future, scholars may wish to inspect additional characteristics and identify those exerting the greatest influence on hotel room rate fluctuations.

Author Contributions

Literature review, methodology, writing—original draft preparation: F.W.; data analysis, writing—original draft preparation: Q.Z.; initiation, idea generation, writing—review, revision, and editing: R.L.; supervision, conceptualization, validation, revision, and editing: T.Z. All authors have read and agreed to the published version of the manuscript.

Funding

This research was funded by Special Funds of High-level University Construction Program of Guangdong Province (grant number: 88018052), and Jinan University Innovation Fund (grant number: 21617416).

Conflicts of Interest

The authors declare no conflict of interest. The funding sponsor had no role in the design of the study; in the collection, analyses, interpretation of data; in the writing of the manuscript; and in the decision to publish the results.

References

  1. Xian, F. Analysis of the Impact of the Epidemic on Hotel and Tourism Industry. China. Conf. Exhib. 2020, 4, 56–61. (In Chinese) [Google Scholar]
  2. Huang Yin, C.; Goh, E.; Law, R. Developing inter-organizational relationships with online travel agencies (OTAs) and the hotel industry. J. Travel. Tour. Mark. 2019, 36, 428–442. [Google Scholar] [CrossRef]
  3. Braden, C.R.; Dowell, S.F.; Jernigan, D.B.; Hughes, J.M. Progress in Global Surveillance and Response Capacity 10 Years after Severe Acute Respiratory Syndrome. Emerg. Infect. Dis. 2013, 19, 864–869. [Google Scholar] [CrossRef]
  4. Chen, M. The response of hotel performance to international tourism development and crisis events. Int. J. Hosp. Manag. 2011, 30, 200–212. [Google Scholar] [CrossRef] [PubMed]
  5. Hung, K.K.C.; Mark, C.K.M.; Yeung, M.P.S.; Chan, E.Y.Y.; Graham, C.A. The role of the hotel industry in the response to emerging epidemics: A case study of SARS in 2003 and H1N1 swine flu in 2009 in Hong Kong. Global. Heal. 2018, 14, 117. [Google Scholar] [CrossRef] [PubMed] [Green Version]
  6. Wu, E.H.C.; Law, R.; Jiang, B. The impact of infectious diseases on hotel occupancy rate based on independent component analysis. Int. J. Hosp. Manag. 2010, 29, 751–753. [Google Scholar] [CrossRef]
  7. Olugasa, B.O.; Oshinowo, O.Y.; Odigie, E.A. Preventive and social cost implications of Ebola Virus Disease (EVD) outbreak on selected organizations in Lagos state, Nigeria. Pan. Afric. Medi. J. 2015, 22, 20. [Google Scholar] [CrossRef]
  8. Wen, J.; Aston, J.; Liu, X.; Ying, T. Effects of misleading media coverage on public health crisis: A case of the 2019 novel coronavirus outbreak in China. Anato. Int. J. Tour. Hosp. Res. 2020, 31, 331–336. [Google Scholar] [CrossRef]
  9. Yang, Y.; Chen, X. Coronavirus pandemic and tourism: Dynamic stochastic general equilibrium modeling of infectious disease outbreak. Ann. Tourism. Res. 2020, 83. [Google Scholar] [CrossRef]
  10. China Tourism Academy. Blue Book of Chinese Tourism Economics No.12; China Tourism Academy: Beijing, China, 2020. (In Chinese) [Google Scholar]
  11. Tian, X.; Wang, X.; Li, K.; Chen, J. The Driving Factors of Hotel Revenue Management Strategy: An Empirical Study Based on Chinese Starred-Hotel Data. Tour. Sci. 2014, 28, 65–80. (In Chinese) [Google Scholar] [CrossRef]
  12. Gao, B.; Sun, H.; Wang, H. Influence of Online Reviews on Hotels’ Full-occupancy Rates. Tour. Trib. 2016, 31, 109–117. (In Chinese) [Google Scholar] [CrossRef]
  13. Zhang, Y.; Yu, Y.; Pan, H. A Comparison Research on Hotel Attributes to Customer Satisfaction:A Study based on Web Content Analysis. Tour. Forum. 2017, 10, 45–57. (In Chinese) [Google Scholar] [CrossRef]
  14. Shen, H.; Zhao, J.; Hu, F. The Influence of e-WOM Characteristics on Hotel Purchasing Decision online. Tour. Forum. 2020, 13, 35–44. (In Chinese) [Google Scholar] [CrossRef]
  15. Toh, R.S.; Raven, P.; DeKay, F. Selling Rooms: Hotels vs. Third-Party Websites. Cornell. Hosp. Q. 2011, 52, 181–189. [Google Scholar] [CrossRef]
  16. Ling, L.; Guo, X.; Yang, C. Opening the online marketplace: An examination of hotel pricing and travel agency on-line distribution of rooms. Tour. Manag. 2014, 45, 234–243. [Google Scholar] [CrossRef]
  17. Yan, K.; Gao, Q.; Hu, X. Pricing and revenue optimization between hotel and online travel agencies. J. Nanjing Univ. Sci. Technol. 2017, 41, 779–783. (In Chinese) [Google Scholar] [CrossRef]
  18. Long, Y.; Shi, P. Pricing strategies of tour operator and online travel agency based on cooperation to achieve O2O model. Tour. Manag. 2017, 62, 302–311. [Google Scholar] [CrossRef]
  19. Raab, C.; Berezan, O.; Christodoulidou, N.; Jiang, L.; Shoemaker, S. Creating strategic relationships with online travel agents to drive hotel room revenue: An OTA perspective. J. Hosp. Tour. Technol. 2018, 9, 125–140. [Google Scholar] [CrossRef]
  20. Herrmann, R.; Herrmann, O. Hotel roomrates under the influence of a large event: The Oktoberfest in Munich 2012. Int. J. Hosp. Manag. 2014, 39, 21–28. [Google Scholar] [CrossRef]
  21. Gricar, S.; Bojnec, S. Prices of short-stay accommodation: Time series of a eurozone country. Int. J. Contemp. Hosp. Manag. 2019, 31, 4500–4519. [Google Scholar] [CrossRef]
  22. Leung, R.; Guillet, B.D.; Law, R. The channel that offers the lowest online room rates: A case study of hotels in Hong Kong. Int. J. Hosp. Tour. Admin. 2014, 15, 103–120. [Google Scholar] [CrossRef]
  23. Sun, S.; Law, R.; Tse, T. Exploring price fluctuations across different online travel agencies: A case study of room reservations in an upscale hotel in Hong Kong. J. Vacat. Mark. 2016, 22, 167–178. [Google Scholar] [CrossRef]
  24. Mohammed, I.; Guillet, B.D.; Law, R. Last-minute hotel-booking and frequency of dynamic price adjustments of hotel rooms in a cosmopolitan tourism city. J. Hosp. Tour. Manag. 2019, 41, 12–18. [Google Scholar] [CrossRef]
  25. Israeli, A.A.; Reichel, A. Hospitality crisis management practices: The Israeli case. Int. J. Hosp. Manag. 2003, 22, 353–372. [Google Scholar] [CrossRef]
  26. Kimes, S.E. Hotel revenue management in an economic downturn: Results from an international study. Cornell. Hosp. Report. 2009, 9, 6–17. [Google Scholar]
  27. Caudillo-Fuentes, L.A.; Li, Y. Revenue management during times of recession. J. Reve. Pric. Manag. 2010, 9, 185–188. [Google Scholar] [CrossRef]
  28. Racherla, P.; Hu, C. A Framework for Knowledge-Based Crisis Management in the Hospitality and Tourism Industry. Cornell. Hosp. Q. 2009, 50, 561–577. [Google Scholar] [CrossRef]
  29. Song, H.; Lin, S.; Witt, S.F.; Zhang, X. Impact of financial/economic crisis on demand for hotel rooms in Hong Kong. Tour. Manag. 2011, 32, 172–186. [Google Scholar] [CrossRef]
  30. Malhotra, R.; Venkatesh, U. Pre-crisis period planning: Lessons for hospitality and tourism. World. Hosp. Tour. Them. 2009, 1, 66–74. [Google Scholar] [CrossRef]
  31. Alonso-Almeida, M.D.M.; Bremser, K. Strategic responses of the Spanish hospitality sector to the financial crisis. Int. J. Hosp. Manag. 2013, 32, 141–148. [Google Scholar] [CrossRef]
  32. Kapiki, S. The impact of economic crisis on tourism and hospitality: Results from a study in Greece. Cen. Eur. Revi. Econ. Fina. 2012, 2, 19–30. [Google Scholar]
  33. Gehrels, S.; Blanar, O. How economic crisis affects revenue management: The case of the Prague Hilton hotels. Res. Hosp. Manag. 2013, 2, 9–15. [Google Scholar] [CrossRef]
  34. Ivanov, S.H.; Webster, C.; Stoilova, E.; Slobodskoy, D. Biosecurity, crisis management, automation technologies and economic performance of travel, tourism and hospitality companies—A conceptual framework. Tourism. Econ. 2020. [Google Scholar] [CrossRef]
  35. Soler, I.P.; Gemar, G.; Guzman-Parra, V.F. A comparison of destinations’ impacts on hotel rates. Int. J. Hosp. Manag. 2019, 77, 226–237. [Google Scholar] [CrossRef]
  36. Martin-Fuentes, E. Are guests of the same opinion as the hotel star-rate classification system? J. Hosp. Tour. Manag. 2016, 29, 126–134. [Google Scholar] [CrossRef] [Green Version]
  37. Law, R.; Chan, I.; Goh, C. Where to find the lowest hotel room rates on the internet? The case of Hong Kong. Int. J. Contemp. Hosp. Manag. 2007, 19, 495–506. [Google Scholar] [CrossRef]
  38. Tso, A.; Law, R. An empirical study of online pricing practices for Hong Kong hotels. In Information and Communication Technologies in Tourism 2005; Frew, A.J., Ed.; Springer: Vienna, Austria, 2005; pp. 328–337. [Google Scholar] [CrossRef]
  39. Denizci, G.B.; Law, R. Analyzing hotel star ratings on third-party distribution websites. Int. J. Contemp. Hosp. Manag. 2010, 22, 797–813. [Google Scholar] [CrossRef]
  40. Tang, C.M.F.; King, B.E.M.; Kulendran, N. Estimating Future Room Occupancy Fluctuations to Optimize Hotel Revenues. J. Travel. Tour. Mark. 2015, 32, 870–885. [Google Scholar] [CrossRef]
  41. Zhou, L.; Zhang, Q.; Zhu, Q.; Lu, L. Spatio-temporal Differentiation in the Effects of Canton Fair on Hotel Prices: A Case Study of the 117th and 118th Canton Fair. Sci. Geo. Sin. 2017, 37, 1363–1373. (In Chinese) [Google Scholar] [CrossRef]
Figure 1. Map of Hong Kong and number of hotels and guesthouses with room.
Sustainability 12 07709 g001
Figure 2. Estimated marginal means for room rates.
Sustainability 12 07709 g002
Figure 3. Estimated marginal means of room rates by hotel star rating.
Sustainability 12 07709 g003aSustainability 12 07709 g003b
Figure 4. Estimated marginal means of hotel room rates by district.
Sustainability 12 07709 g004
Table 1. Number of hotels by star rating or district.
Star RatingNumberDistrictNumber
2.52Hong Kong Island97
335Kowloon106
3.555New Territories24
494Islands10
4.522-
529-
Total237Total237
Table 2. Corresponding fortnight or week numbers by date range.
Fortnight NUMWeek NUMDATEFortnight NUMWeek NUMDATEFortnight NUMWeek NUMDATE
111–7 December 201971323–29 February 2020132517–23 May 2020
28–14 December 2019141–7 March 20202624–30 May 2020
2315–21 December 20198158–14 March 2020142731 May–6 June 2020
422–28 December 20191615–21 March 2020287–13 June 2020
3529 December 2019–4 January 202091722–28 March 2020152914–20 June 2020
65–11 January 20201829 March–4 April 20203021–27 June 2020
4712–18 January 202010195–11 April 2020163128 June–4 July 2020
819–25 January 20202012–18 April 2020325–11 July 2020
5926 January–1 February 2020112119–25 April 2020173312–17 July 2020
102–8 February 20202226 April–2 May 2020
6119–15 February 202012233–9 May 2020
1216–22 February 20202410–16 May 2020
Table 3. Pairwise comparisons of room rates.
Week (I)Week (J)Mean Difference (I–J)Std. ErrorSig
Before ninth week 35−114.045 ***13.0100.000
58132.310 ***12.6830.000
89−69.709 ***8.3030.000
After ninth week916495.137 ***22.2420.000
1619−70.963 ***17.8350.000
192466.049 ***18.2010.000
93364.659 **27.4630.020
Note: * p < 0.1, ** p < 0.05, *** p < 0.01.
Table 4. Repeated-measures analysis of variance for room rates by hotel star rating.
Star Ratingχ2pGreenhouse–Geisser
Fp
3 (fortnightly)781.0360.0003.6680.000
3.5 (weekly)3581.9500.0005.7870.001
4 (weekly)4735.6780.0004.3590.000
4.5 (fortnightly)956.6670.0003.7780.006
5 (weekly)2105.3630.0001.3240.270
Table 5. Pairwise comparisons of room rates by hotel star rating.
Star RatingFortnight (I)Fortnight (J)Mean Difference (I–J)Std. ErrorSig.
35738.632 ***9.8260.000
810−78.221 ***12.2310.000
5175.70814.3320.692
4.55876.877 **25.9390.005
89−110.84157.0100.059
59−33.96463.4470.595
917138.357 *55.1700.016
517104.393 ***25.9990.000
Star RatingWeek (I)Week (J)Mean Difference (I–J)Std. ErrorSig
3.591594.410 ***14.9200.000
1519−120.352 ***27.6040.000
9194.22124.7120.865
93350.816 **15.2990.002
491565.973 **18.5950.001
1519−38.848 ***10.4820.000
183381.173 *31.5480.012
93380.016 **26.4870.003
5111696.574 *43.4210.033
1621−110.290 **29.2830.001
212495.450 **33.6330.008
93315.84065.6350.811
Note: * p < 0.05, ** p < 0.01, *** p < 0.001.
Table 6. Repeated-measures analysis of variance in room rates by district.
Districtχ2pGreenhouse–Geisser
Fp
Hong Kong Island5124.8550.0002.1750.097
Kowloon5213.1220.0002.2470.096
New Territories1003.5820.0001.9680.102
Islands520.7060.0002.3450.092
Table 7. Pairwise comparisons of room rates by district.
DistrictWeek (I)Week (J)Mean Difference (I–J)Std. ErrorSig.
Hong Kong Island1618−65.229 ***11.9970.000
182491.480 ***17.2960.000
93327.48232.6350.402
Kowloon1517−74.318 *34.4590.034
172483.421 *34.7500.018
93381.564 ***10.5060.000
DistrictFortnight (I)Fortnight (J)Mean Difference (I–J)Std. ErrorSig
New Territories6845.896 **16.5020.008
89−73.997 ***18.5950.000
91365.887 **23.6140.008
1216−42.30450.0400.403
517−19.03624.3140.438
Islands57238.583 ***40.0290.000
517202.172 **57.0130.003
Note: * p < 0.05, ** p < 0.01, *** p < 0.001.
Table 8. Summary of periods of significant decline in hotel room rates.
VariablesPeriod of Significant Decline
OverallW: 9–16, 19–24, 9–33
Star Rating3F: 5–7
3.5W: 9–15
4W: 9–15, 18–33
4.5F: 9–17, 5–17
5W: 11–16, 21–24
DistrictHong Kong IslandW:18–24
KowloonW: 17–24, 9–33
New TerritoriesF: 6–8, 9–13
IslandsF: 5–7, 5–17
Note: W = week, F = fortnight.

