Article

Rainfall and Human Impacts on Weathering Rates and Carbon-Nutrient Yields in the Watershed of a Small Mountainous River (Kaoping) in Southwestern Taiwan

1
Department of Oceanography, National Sun Yat-sen University, Kaohsiung 80424, Taiwan
2
Department of Oceanography, University of Hawaii Manoa, Honolulu, HI 96822, USA
*
Author to whom correspondence should be addressed.
Sustainability 2020, 12(18), 7689; https://doi.org/10.3390/su12187689
Submission received: 13 July 2020 / Revised: 1 September 2020 / Accepted: 14 September 2020 / Published: 17 September 2020
(This article belongs to the Special Issue Watershed Processes under Changing Climate)

Abstract

:
This study presents the influence of rainfall and human perturbation on physical and chemical weathering rates, and carbon and nutrient yields in the basin of the Kaoping, a small mountainous river (SMR) in southwestern Taiwan. The study was derived principally from the spatial and temporal variability of aquatic geochemistry in the river during wet (1999–2000) and drought (2002) periods. The total, physical, and chemical weathering rates in the river basin ranged respectively from 4739, 3601, and 1138 g m−2 year−1 in the wet period to 1072, 656, and 416 g m−2 year−1 in the drought period, resulting mainly from a large difference in rainfall and river discharge between the two periods. The wet and drought periods were likely associated with La Niña and El Niño events, respectively. The weathering rates of the wet period were much higher than those reported from the world’s river basins, showing the unique characteristics of the SMR. The total carbon yield was derived mainly from dissolved inorganic carbon and was much higher in the wet period (140 g C m−2 year−1) than in the drought period (53.7 g C m−2 year−1). Taking silicate weathering (54.7 ± 10.2%) slightly over carbonate weathering (48.6 ± 9.5%) in determining dissolved ion loads, the Kaoping catchment may currently consume 0.155–0.298 MtC/year atmospheric CO2 without considering the CO2 released from chemical weathering. The nutrient yields were controlled mainly by human inputs but also enhanced by increased rainfall. Both regional and local climatic conditions and human impacts likely determined the weathering rates and total yields of carbon and nutrients. The SMRs may collectively contribute significantly to global fluxes of terrestrial sediments, geochemical matters, carbon, and nutrients to oceans.

1. Introduction

Physical and chemical weathering processes denude continents and produce suspended sediments and dissolved ions and matter in rivers [1,2,3,4]. The total dissolved loads of the world’s rivers are roughly contributed by the weathering of silicate minerals (45%) and by the dissolution of carbonates and evaporates, including the decomposition of bio-detritus (55%) [5]. During past decades, many studies have focused largely on large river watersheds because such studies allow the erosion and denudation processes at a global scale to be addressed. The global approach based on studies of large rivers seems to be the most powerful method in deriving global laws on the control of continental denudation [6,7].
However, recent studies have demonstrated the importance of small watersheds, particularly those in the high stand, in accounting for global sediment yields and chemical budgets [8,9,10]. In effect, large quantities of river-borne sediments have been reported delivering to the western Pacific Ocean from the islands of southern Asia and Oceania (Japan, Taiwan, Philippines, Malaysia, Indonesia, New Guinea, and New Zealand), accounting for a significant fraction of global material fluxes to the oceans [2,8,9,11]. The study of small watersheds in high-stand areas may provide valuable information to fill the gap of knowledge for the present state of global denudation.
Based on a few data available for the early 1980s, mostly from Taiwan and New Zealand, Milliman and Meade [2] estimated that the average sediment yield of New Zealand and Taiwan was 1000 t km−2 year−1, more than five times greater than the global average. Small rivers generally discharge much greater sediment and dissolved loads relative to their basin areas than do large rivers [8] because a high sediment yield is generally associated with small storage capacity and frequent episodic events, such as floods and landslides [12].
Superimposed on the increasing erosion in the watershed of the small mountainous river (SMR), recent changes in land uses may also accelerate the sediment yield and flux in the Kaoping River [12]. In addition to human activities, several natural factors, including the relief of the drainage basin, geology of the drainage basin, climate, the presence of dams and lakes, and the drainage basin area, have been proposed in determining the erosion and denudation rates [2,9,11].
The chemical weathering that determines the state of dissolved matter in the river usually accounts for a smaller contribution to the denudation rate and total material flux to the ocean. However, the condition of the water chemistry may be dependent upon chemical weathering and is critical to the river ecosystem and human life [13]. Meybeck [6] stated that the global delivery of dissolved loads to the oceans (~3.7 × 10¹⁵ g year−1) was approximately 25% of those suspended loads. Several factors similar to those affecting physical weathering may also control the denudation of dissolved matter in river water. Walling and Webb [14] highlighted the river runoff, drainage basin geology, and climatic regime in determining the fluvial discharge of dissolved matter. Although chemical weathering principally releases major ions to rivers, these major ions may not have a strong impact on estuarine and oceanic ecosystems [15]. On the other hand, recent increasing loads of organic matter and nutrients may have tremendously altered the quality of water and habitants in both river and coastal oceans [16,17,18]. Understanding the fluvial conditions and fluxes of organic matter and nutrients may be critical to evaluate eutrophication in river and coastal ecosystems.
The Kaoping River is a typical SMR, located in the southwestern region of Taiwan. River discharge and suspended load are generally high in the wet season ranging from May to September, prevailing with the southwestern monsoon, and both are quite low in the dry season ranging from October to April, prevailing with the northeastern monsoon [19]. The occurrence of typhoons is quite often during the wet season and usually brings in episodic huge rainfalls in the watershed. In addition to the high sediment yield of the river basin, the river has also suffered from increased pollution from the middle to lower reaches by receiving urban and industrial effluents [20,21]. Because of changes in hydrological conditions and human impacts on the lower reach, the Kaoping River provides a valuable study spot for understanding the influences of natural and anthropogenic forcings on weathering rates and carbon and nutrient yields in the SMR watershed.

2. Materials and Methods

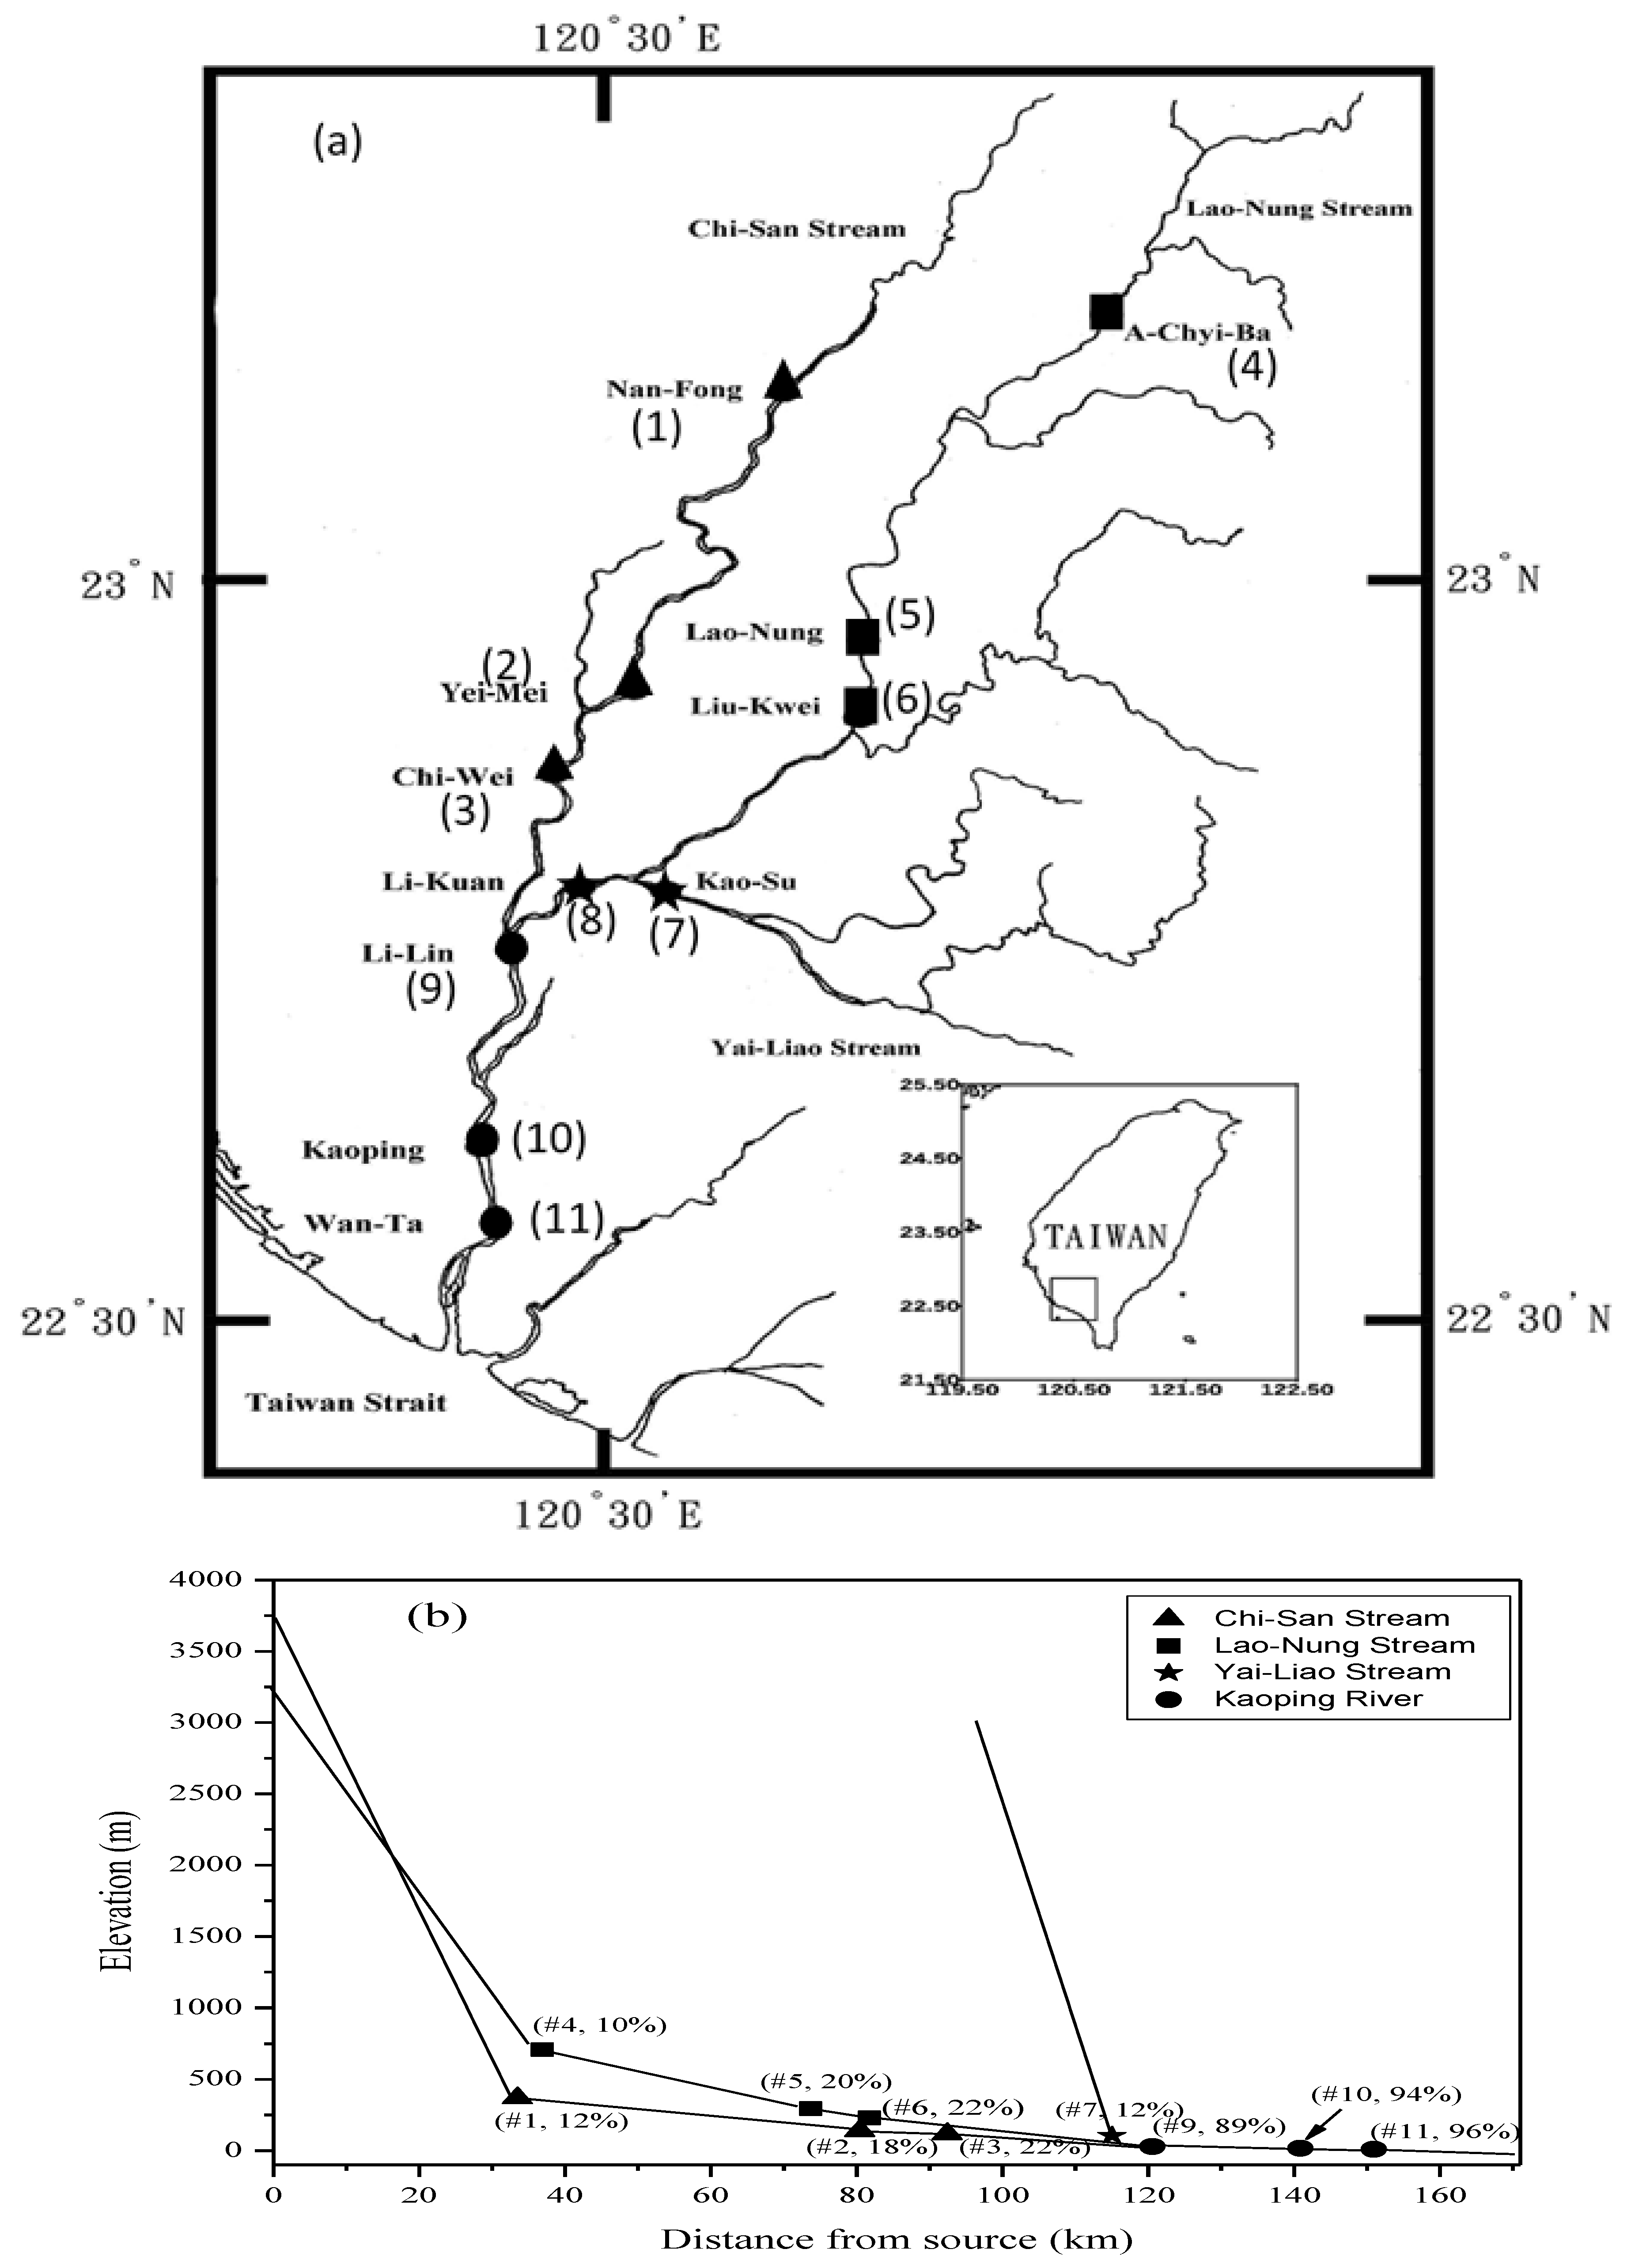
2.1. Study Area and Background

The Kaoping River originates from Yushan Mountain (3997 m a.s.l.) of the Taiwan Central Range and drains through the Chi-San (833 km2), Lao-Nung (1375 km2), and Yai-Liao (623 km2) watersheds from the north to the south in the upper and middle ranges of the river (Figure 1). Three branches meet on Li-Lin, forming the Kaoping River, which flows through the middle to lower ranges of the watershed (414 km2) reported by the Water Resources Bureau (WRB) [22] in Taiwan. The upper and middle ranges are composed mainly of sandstone, shale, and metamorphic rocks, and the lower range is composed largely of recent alluvium deposits [23]. Carbonate rocks present mainly in the lower alluvium deposits, particularly around the Kaohsiung metropolitan areas [23]. Details of the geological map may be referred to in the report [24] showing the geological background of the same study area. Soils are dominated by underdeveloped and shallow types in the steep sloping terrain and by alluvial soils in lower sloping areas [25]. Thus, the river erodes mostly Miocene-age sedimentary rocks and older metasediments in the mountain regions and carries additional recent sediments in the lower range before entering the Taiwan Strait [26]. Land covers range from evergreen forest in the mountainous areas to largely cultivated crops in the middle and lower ranges where several developed counties, Kaohsiung metropolitan city, and associated industrial districts are located within the watersheds.

2.2. Sampling and Analytical Methods

Samples were taken bimonthly between August 1999 and August 2002 from various river stations located approximately below 500 m above the sea level. The sampling locations (Figure 1) were determined largely according to gauged stations established by the WRB on bridges, in order to obtain details of the discharge managed by the WRB in Taiwan. The sampling stations were renamed numerically for easy identification. Whenever possible, the composite water sample of each station was taken from the surface and bottom of the river’s central course with a horizontal water sampler (Core-Parmer, Alpha water sampler, Vernon Hills, IL, USA). The water samples were measured in situ for pH (Mettler MP-120, resolution 0.01 pH), dissolved oxygen (DO) with a DO-meter (WTW, Oxi-320, resolution 0.01 mg L−1), temperature and conductivity (Salinometer WTW, LF-320). About 100 mL water was filtered immediately through a GF/F filter, and the filter was stored frozen for chlorophyll a determination according the method of Welschmeyer [27]. A portion of 1 L water was stored in a PE bottle at 4 °C and further filtered in the laboratory through a pre-combusted GF/F filter for analyses of dissolved inorganic carbon (DIC), dissolved organic carbon (DOC), dissolved inorganic nitrogen (DIN = NH4+ + NO2 + NO3), dissolved inorganic phosphorus (DIP), and dissolved silicate (DSi) in filtered water, and for analyses of particulate organic carbon (POC) and particulate organic nitrogen (PON), and particulate inorganic carbon (PIC) and particulate phosphorus (PP). Another portion of 4 L water was stored in a PE bottle and filtered in the laboratory through a filter (Nucleopore, 0.4 µm, 47 mm) for analyses of dissolved major ions (Ca2+, Mg2+, Na+, K+, HCO3, Cl, SO42−) and total suspended matter (TSM) and particulate elements. The concentration of TSM was the dry weight of suspended matter divided by the volume of filtered water. The total dissolved solids (TDS) were determined by evaporating the specific amount of filtrate and measuring the mass of residues left.
DIC was measured with a carbon analyzer (Shimadzu TOC-5000) by reacting water with phosphoric acid, and the produced CO2 was detected with an NDIR detector. The precision was in the range of ±0.2%. DOC was measured with the method of high-temperature catalytic oxidation by using the Shimadzu TOC-5000 analyzer [28,29]. Uncertainty for freshwater determination was <±2%. POC and PON were determined with a C/N/S analyzer (Fisons NCS 1500) after removing carbonate with 2 M HCl [29,30]. The measuring precision of POC and PON was ±0.3 µM C and ±0.2 µM N. PIC was determined by the difference between total particulate carbon and POC [29,30].
The chemical weathering rate was determined by river fluxes of dissolved major ions and normalized to the watershed area. The major cations (Ca2+, Mg2+, Na+, K+) were determined with atomic absorption spectrophotometry (Perkin-Elmer 5100PC). Precision and accuracy was generally within ±2% by measuring the certified river water (SLRS-1, National Research Council Canada, Vancouver, BC, Canada). Dissolved Cl and SO42− were measured with ion chromatography (Dionex DX-100) and precisions (n = 9) were within ±2%. Bicarbonate was regarded as the major form of DIC because of pH ranging from 7.6 to 8.3, and DIC was determined with the method mentioned above.
The measured concentrations of dissolved major ions were corrected from atmospheric contributions before they were used for deriving the chemical weathering rate. For example, [SO42−]corrected = [SO42−]measured − [Cl]ref × {[SO42−]sea-salt/[Cl-]sea-salt}, where [Cl]ref = [Cl]rain × F (concentration factor = (precipitation/(precipitation–evaporation)). Dissolved nutrients were determined colorimetrically [31] with a UV-Vis spectrophotometer equipped with a flow injection analysis [32]. Precision was generally better than 5%. Dissolved NH4+ was determined with a Hach DR/2010 m according to the procedures of Hach Method 8155. The recovery of spiked NH4+ in the river water was greater than 92%. Dissolved organic nitrogen (DON) was determined from the difference between DIN (NH4+ + NO2 + NO3) and total dissolved nitrogen (TDN) that was measured with the chemiluminence method using an instrument of Anteck Models 771/720 [28,29]. Dissolved organic phosphorus (DOP) was determined from the difference between DIP (PO43−) and total dissolved phosphorus (TDP) that was measured with UV-persulfate oxidation and colorimetric method [33]. The precision was better than ±7% and ±5%, respectively, for TDN and TDP [28].
River fluxes of dissolved and particulate elements were estimated by the following methods:
(i)
Dissolved elemental flux = Σ([dissolved elemental concentration (corrected from atmospheric contribution)] × [discharge]);
(ii)
Particulate elemental flux = Σ([particulate elemental concentration] × [sediment load]);
(iii)
Sediment, carbon, and nutrient yields = (annual fluxes of sediment, carbon, and nutrients)/(watershed area, 3257 km2).
Annual sediment load at the river end-member (river–estuary boundary) (Wan-Da Station (WDS) (#11), non-gauged station) was estimated from the sediment-discharge rating curve (log[Ls] = −0.6061 + 1.8878log[cms], r =0.9565, p < 0.0001) established from historical data of sediment load (Ls, ton day−1) and discharge (m3s−1, cms) [23] at the gauged Li-Lin Station (#9). The river discharge at Station #11 was estimated from that in Station #9 according to the method proposed by David [34]. Thus, Qr = Ax(∆f/r)(r/(2.74Di * 10−6)), where Qr is the discharge at WDS (#11), Ax is the increased watershed area from the neighborhood gauged station (#9), r is the monthly precipitation, Di is the number of days in the month, and ∆f/r (monthly runoff/monthly rainfall ratio) = exp(−e°/r); e° = 1.0 × 10⁹exp(−4.62 × 10³/(T + 273)); T: monthly temperature (°C).

3. Results

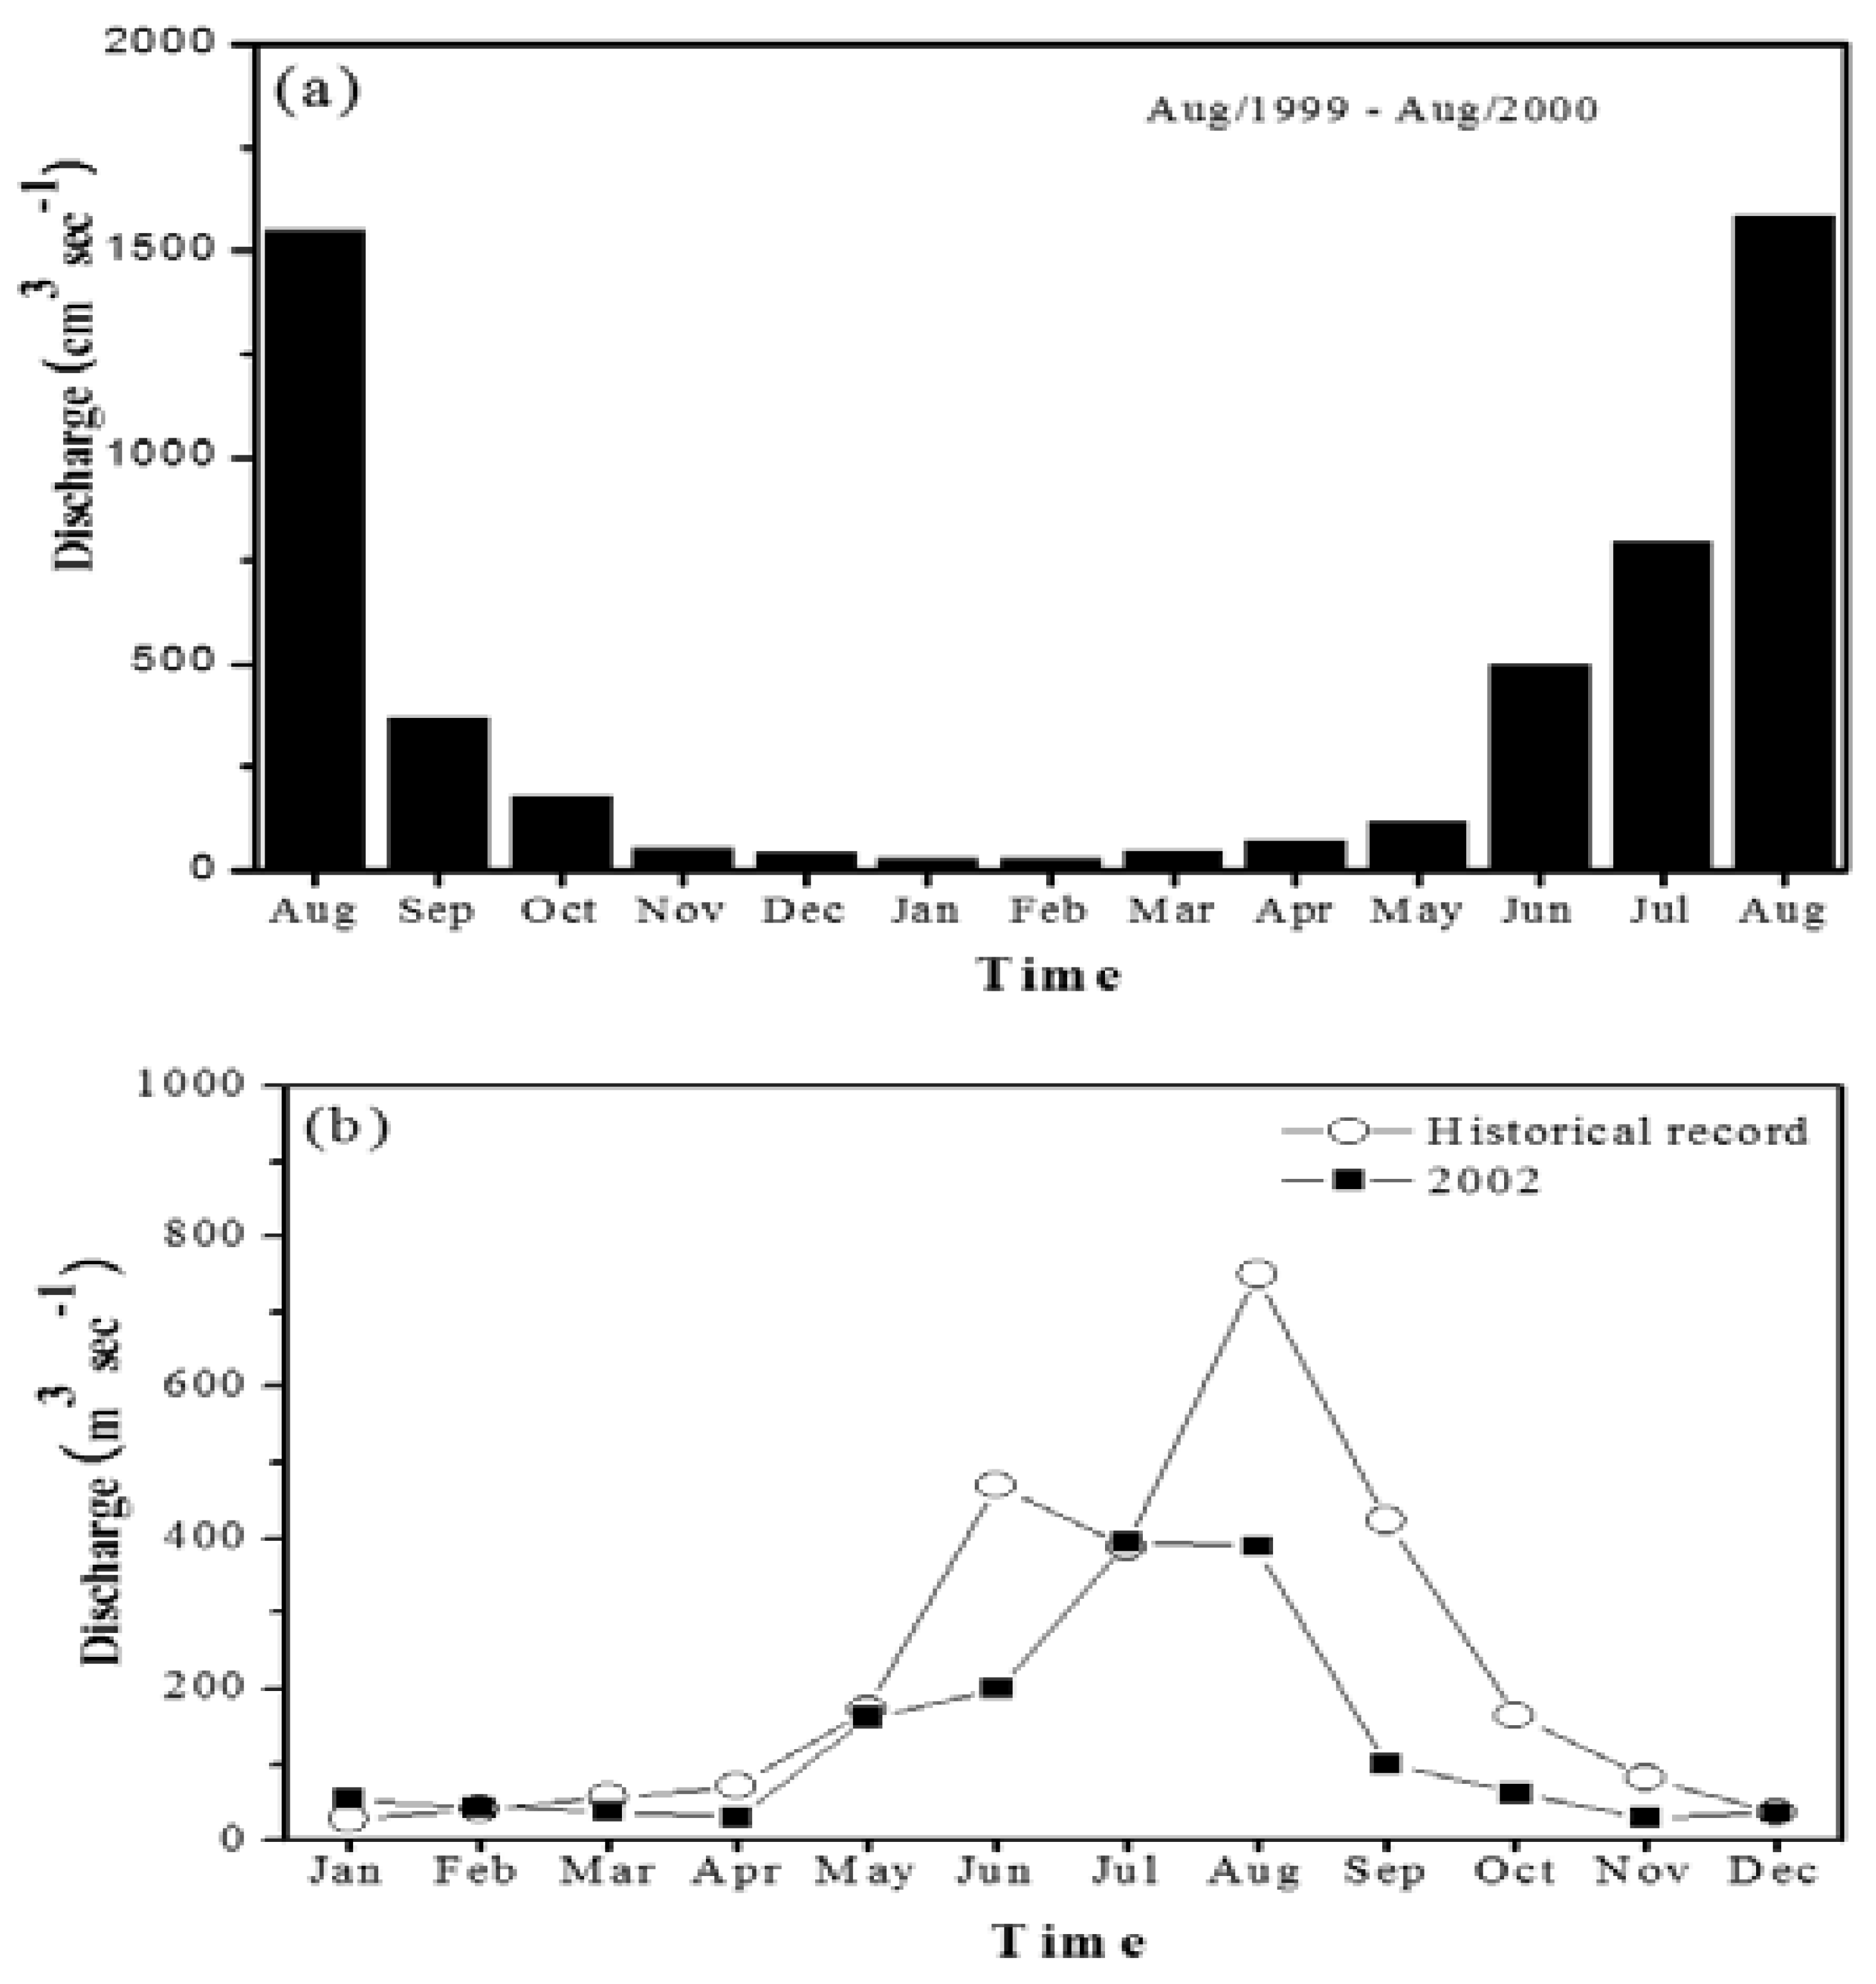
3.1. General Hydrological Characteristics and River Water Chemistry

Figure 2a shows the monthly variation of river discharge, which was much higher in the wet season (May–September) than in the dry season (October–April). The river discharge was also much higher in the 1999–2000 period than in the historical and 2002 records (Figure 2b). Water temperature varied accordingly with air temperature, ranging from 20 to 29 °C, being higher in summer than in winter. Conductivity ranged from 272 to 721 µS/cm, increased generally from the upper reach stations to the lower reach stations, reflecting an accumulation of dissolved ions through the river course. Conductivity was also higher in the dry season than in the wet season because of a dilution effect in the wet season. pH ranged from 7.6 to 8.3 and decreased generally from the upper reach to the lower reach. Dissolved oxygen generally decreased from the upper reach (annual mean: 7.6 mg L−1) to the lower reach (annual mean: 7.0 mg L−1), likely caused by the increase of non-point and point pollution from the upper reach to the lower reach.

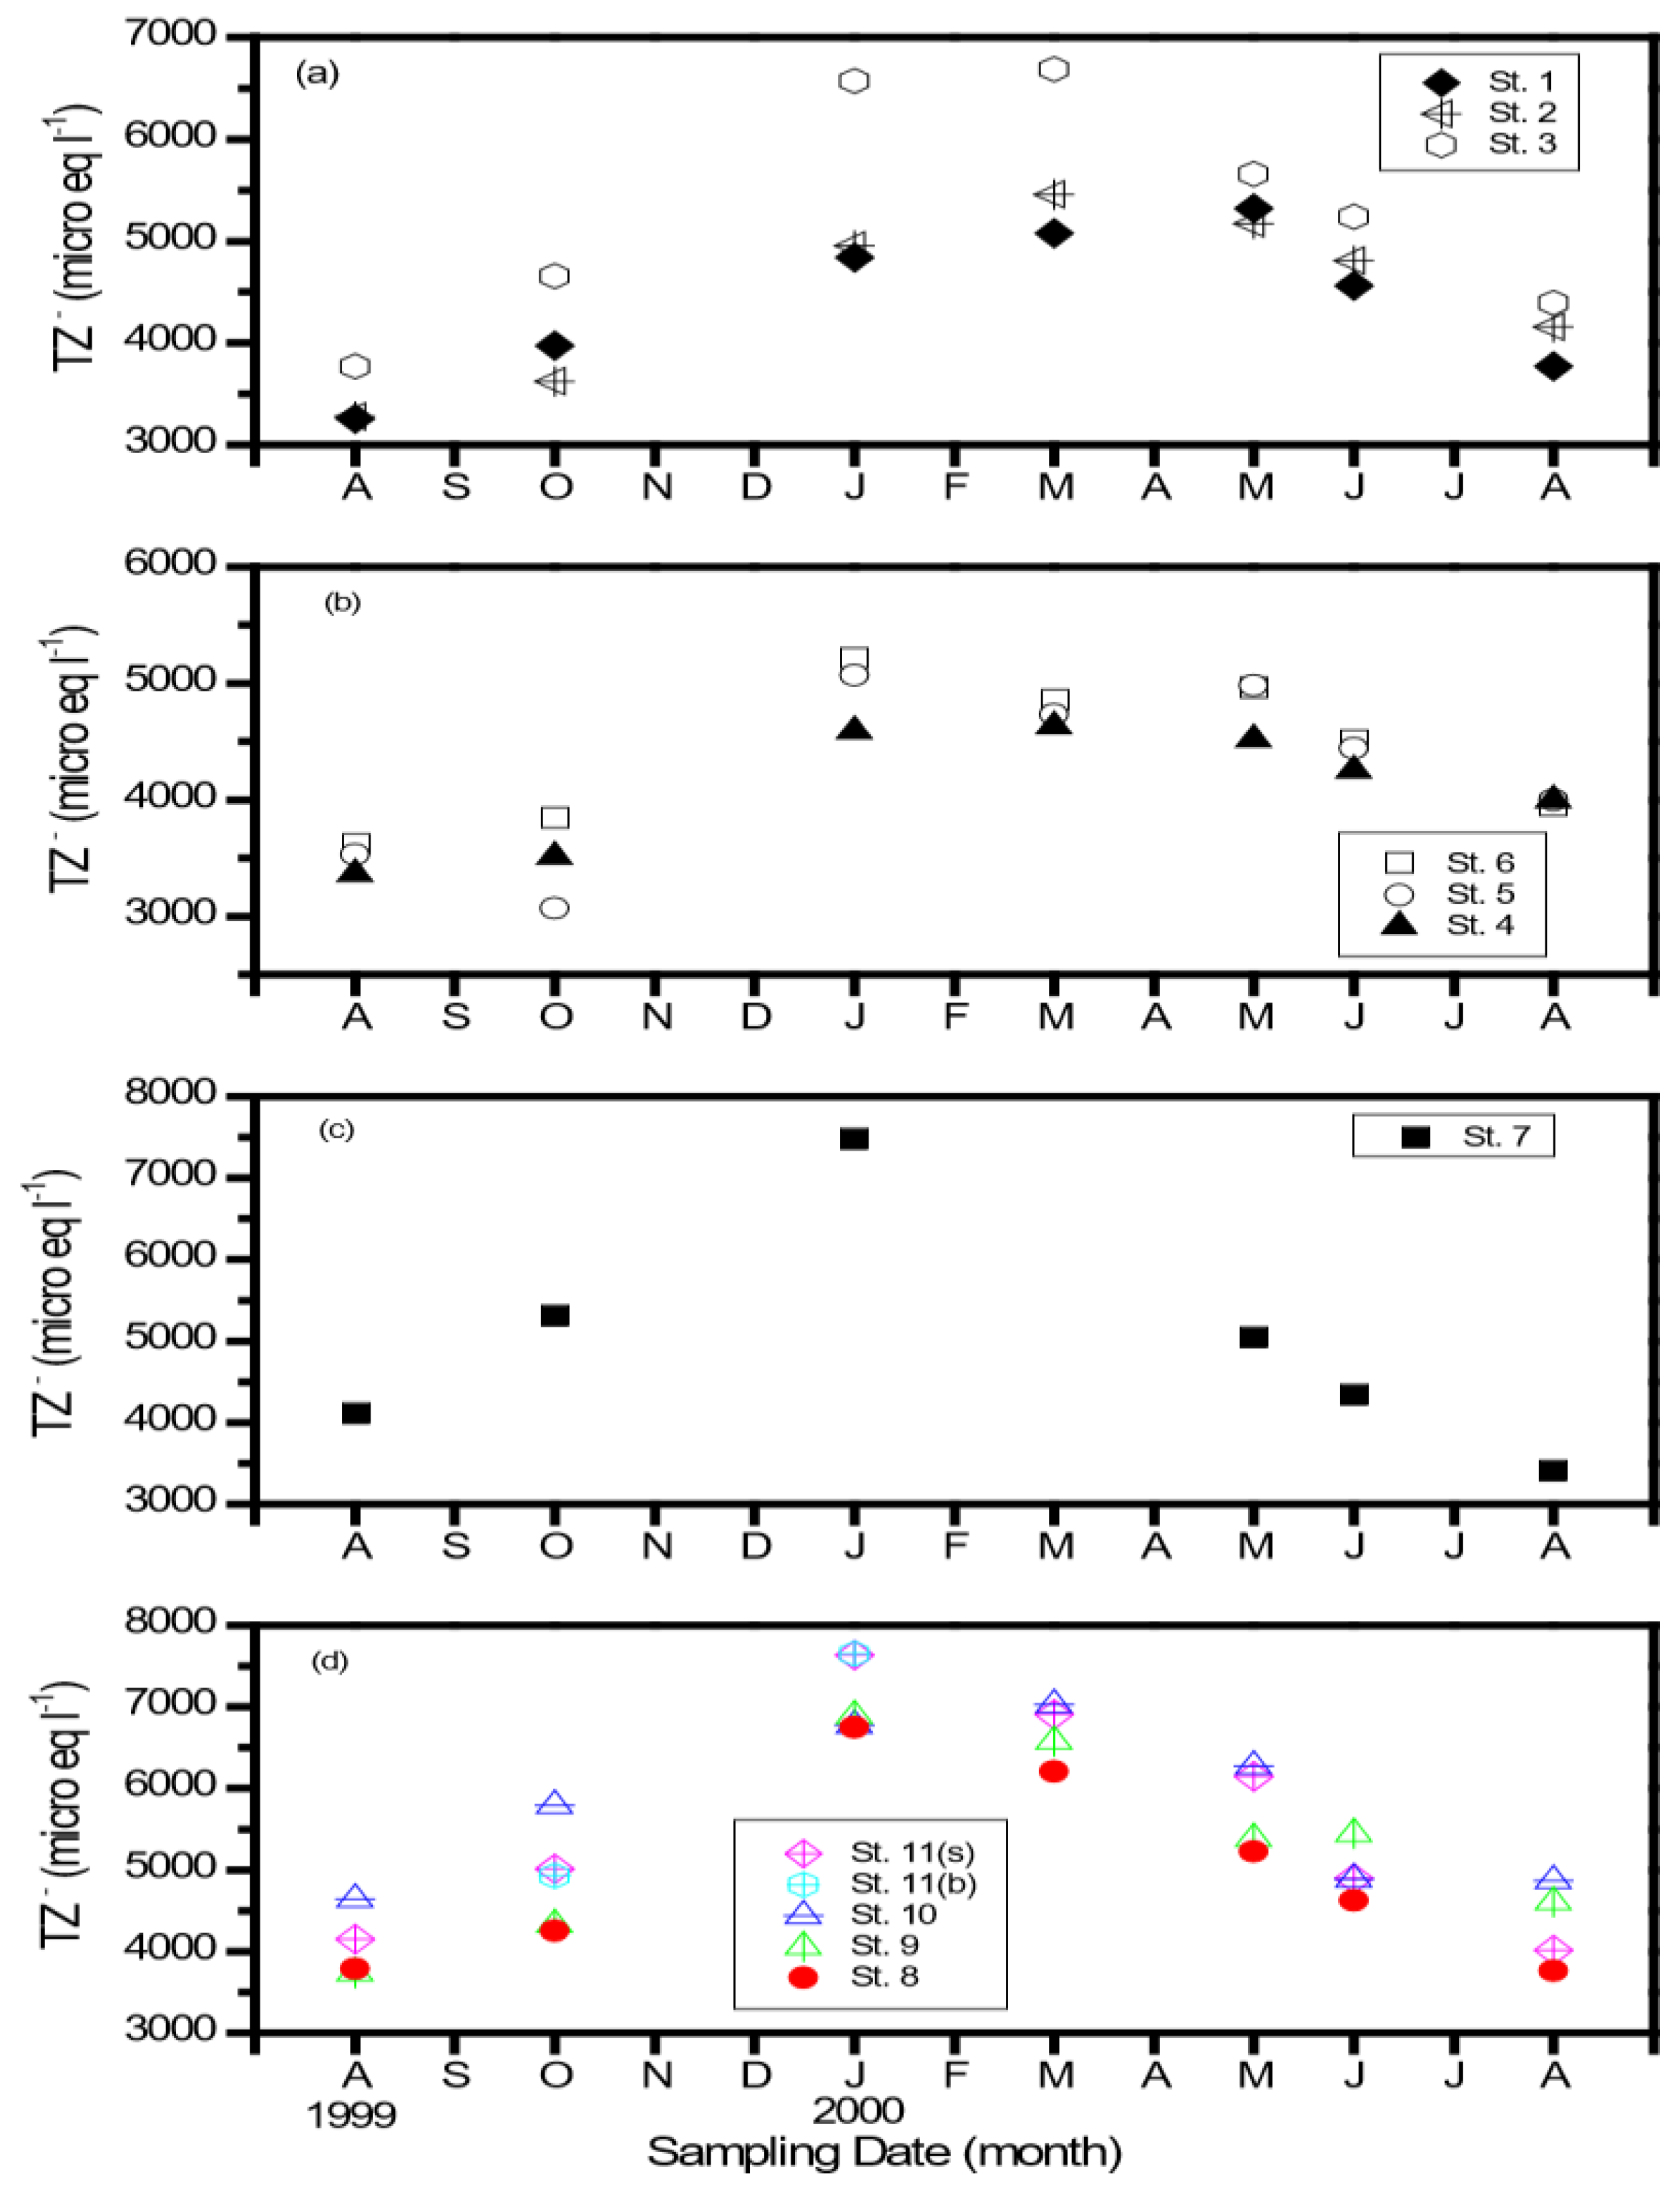
3.2. Distribution of Major Cations and Anions

Table 1 shows the distribution of major cations and anions from upper streams to the lower Kaoping River in the wet period (August 1999–July 2000). Concentrations ranged from 735 to 2313 μeq L−1 for calcium, from 291 to 705 μeq L−1 for magnesium, from 26 to 295 μeq L−1 for potassium, and from 180 to 1818 μeq L−1 for sodium in the river (Table 1). Concentrations of all cations increased generally from the upper reach to the lower reach.
The major cations were ranked as Ca2+ (46~51%) > Na+ (26~32%) > Mg2+ (18~19%) > K+ (4.5~4.9%) in terms of equivalent proportions in both upstream and lower reach.
Concentrations of anions ranged from 348 to 1254 μeq L−1 for sulfate, from 20 to 979 μeq L−1 for chloride, and from 2040 to 4471 μeq L−1 for carbonate in the river (Table 1). Concentrations of all anions increased from the upper reach to the lower reach, and the anions were ranked as HCO3 (69~72%) > SO42− (18.6~19.5%) > Cl (9.5–11%) in terms of equivalent contributions.
Spatial distribution patterns for all major ions in 2002 were similar to those in 1999–2000, showing increases from the upper reach to the lower reach, and are not displayed here again. Temporal variation of major ion concentrations was likely related inversely with river discharge by using the sum of anions (HCO3, Cl, SO42−) (TZ) as an example in 1999–2000 (Figure 3) because a high discharge tends to dilute the concentration of any ions. Temporal variation of major-ion, DOC, and Chl-a concentrations was also related inversely with river discharge in the river end-member (#11) in 2002 (Supplementary Figures S1 and S2). The charge balance between sum of cations and sum of anions (Σcations/Σanions) for each location and sampling time was within ±10%, and overall TZ+ (Σ(Ca2+, Mg2+, K+, Na+) correlated significantly with TZ (r = 0.9665, p < 0.0001).

3.3. Dissolved Inorganic and Organic Nutrients

Distribution of DIP in the wet period (August 1999–July 2000) ranged from 0.06 to 5.75 µM (annual mean: 2.8 µM) in the upper reach and from 0.12 to 11.5 µM (annual mean: 3.5 µM) in the lower reach. DIN ranged from 4.5 to 118 µM (annual mean: 32.4 µM) in the upper reach and from 34.1 to 206 µM (104 µM) in the lower reach. DSi ranged from 45.1 to 195 µM (annual mean: 120 µM) in the upper reach and from 55.6 to 258 µM (annual mean: 162 µM) in the lower reach. The increase of nutrients from the upper reach to lower reach implies the inputs of non-point and point sources from watersheds. Distribution of DON in the wet period ranged from 0.1 to 89 µM (annual mean: 14.9 µM) in the upper reach and from 0.5 to 253 µM (annual mean: 2.5 µM) in the lower reach. DOP ranged from 0.022 µM (upper reach) to 8.32 µM (lower reach) with an annual mean of 0.9 µM. Spatial distributions of DON and DOP also reflected the inputs of dissolved organic matter either from non-point sources or from wastewater inputs in the watershed.

3.4. Dissolved Inorganic Carbon (DIC) and Organic Carbon (DOC)

Distribution of DIC in the wet period ranged from 2249 to 4182 µM with an annual mean of 2785 µM in the Chi-Shan Stream, from 2022 to 2863 µM with an annual mean of 2312 µM in the Lao-Nung Stream, from 2065 to 4689 µM with an annual mean of 2859 µM in the Yei-Liao Stream, and from 2032 to 4571 µM with an annual mean of 3056 µM in the lower Kaoping River. DOC ranged from 27.3 to 123 µM (annual mean: 58.1 µM) in the Chi-Shan Stream, from 15.5 to 98.1 µM (annual mean: 37.4 µM) in the Lao-Nung Stream, from 17.8 to 136 µM (annual mean: 60.1 µM) in the Yai-Liao Stream, and from 16.0 to 136 µM (annual mean: 68.6 µM) in the lower Kaoping River. Concentrations of DIC and DOC were generally higher in the lower reach than in the upper reach and in the dry season than in the wet season.

3.5. Total Suspended Matter (TSM), Particulate Organic and Inorganic Carbon (POC, PIC) and Particulate Nitrogen (PN)

Distributions of TSM in the wet period ranged from 3.6 to 592 mg L−1 (annual mean: 91.3 mg L−1) in the Chi-San Stream, from 0.7 to 232 mg L−1 (annual mean: 77 mg L−1) in the Lao-Nung Stream, from 41.6 to 512 mg L−1 (annual mean: 224 mg L−1) in the Yai-Liao Stream, and from 2.7 to 429 mg L−1 (annual mean: 175 mg L−1) in the middle to lower Kaoping River.
POC ranged from 0.13 to 2.8 mg L−1 (annual mean: 0.68 mg L−1), in the Chi-San Stream, from 0.05 to 1.75 mg L−1 (annual mean: 0.42 mg L−1) in the Lao-Nung Stream, from 0.33 to 2.3 mg L−1 (annual mean: 1.05 mg L−1) in the Yai-Liao Stream and from 0.31 to 2.04 mg L−1 (annual mean: 1.3 mg L−1) in the middle to lower Kaoping River. PN ranged from 0.012 to 0.464 mg L−1 (annual mean: 0.096 mg L−1) in the Chi-San Stream, from 0.046 to 0.342 mg L−1 (annual mean: 0.159 mg L−1) in the Lao-Nung Stream, and from 0.04 to 0.412 mg L−1 (annual mean: 0.126 mg L−1) in the middle to lower Kaoping River.
Chlorophyll a ranged from 0.13 to 38.3 mg m−3 (annual mean: 7.29 mg m−3) in the Chi-San Stream, from 0.05 to 4.74 mg m−3 (annual mean: 1.01 mg m−3) in the Lao-Nung Stream, from 0.02 to 38.9 mg m−3 (annual mean: 15.5 mg m−3) in the Yai-Liao Stream, and from 0.10 to 231 mg m−3 (annual mean: 35.1 mg m−3) in the middle to lower Kaoping River. The higher concentration was usually found in the lower reach than in the upper reach, showing relatively abundant planktons in the lower river.

4. Discussion

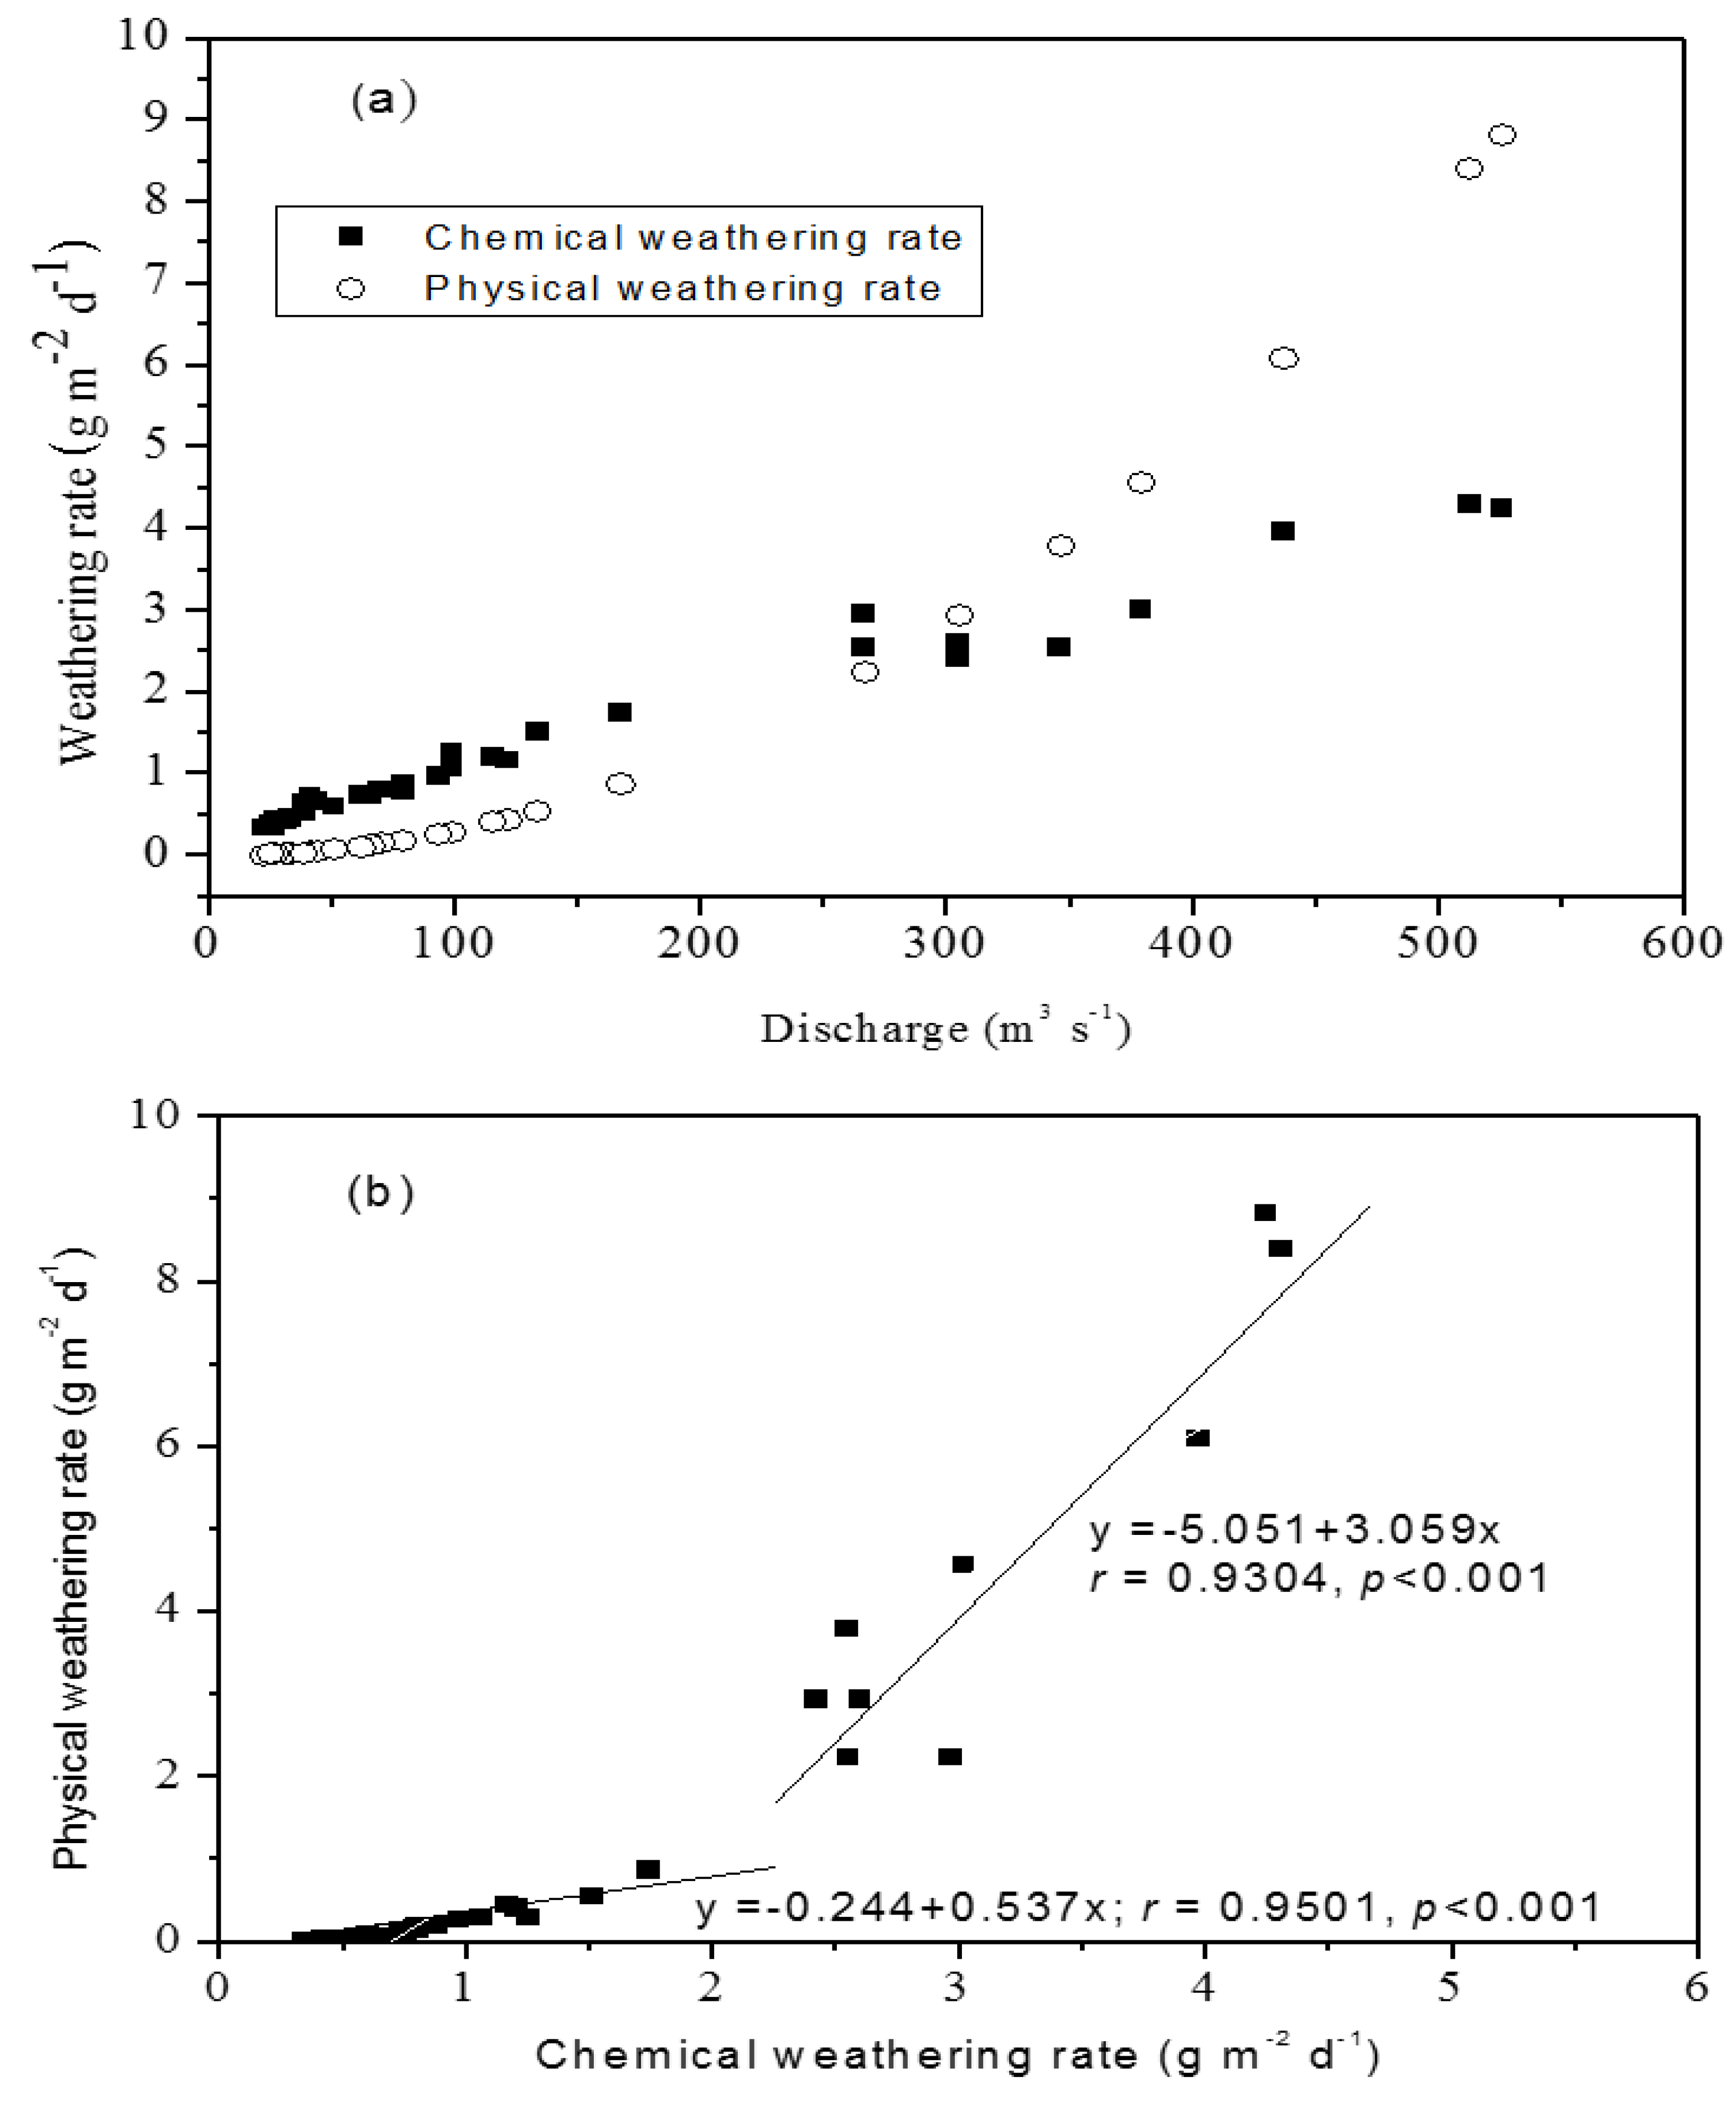
4.1. Physical Weathering Rates in the Kaoping Watershed

The physical weathering rate (PWR, or sediment yield) in each subset of the Kaoping watershed was derived from the sediment load and associated area in each gauged station. The sediment load in each station was not estimated from the measured TSM concentrations and water discharge because the sampling expeditions may not have covered all episodic events that determine overwhelmingly the annual sediment load. Instead, we employed the empirical relationships (Table 2) between sediment loads and discharge rates in gauged stations [22] to derive daily sediment loads that were then integrated into annual sediment loads. The empirical function was established from the daily discharge rate and recorded data of the sediment load for 2–3 sampling times per month provided by the WRB in Taiwan. For the non-gauged station in the lowest reach of the watershed (Station Wan-Da (#11), the river end-member), the sediment load was estimated by using the empirical function of neighborhood and the discharge rate of Station 11 (Qt, see last paragraph of Materials and Methods). The sediment load consistently increased from the upper reach to the lower reach, ranging from (0.2–0.3) × 106 ton year−1 at Station 1 and Station 4 to 12 × 106 ton year−1 at Station 11. The PWR corresponded to 549–840 g m−2 year−1 at Station 1 and Station 4 to 3600 g m−2 year−1 at Station 11 during the wet period between August 1999 and July 2000, approximately a 10-fold increase of the PWR from the upper reach to the river end-member. The value (3600 g m−2 year−1) was exactly the same as our previous report of sediment yield in the same watershed in 2007 [19], which may imply the typical sediment yield in the wet condition in the SMR watershed. This sediment yield was much higher than the previous report of Taiwan’s average (1300 g m−2 year−1 [1]), partly because of a recent increase in denudation and possibly because most episodic events were missed in assessing the previous island-wide average. Additionally, the Kaoping sediment yield was also much higher than those of global large rivers (Amazon (195 g m−2 year−1); Huanghe (1400 g m−2 year−1); Ganges/Brahmaputra (716 g m−2 year−1); Orinoco (152 g m−2 year−1) [35]), and slightly higher than the average (3000 g m−2 year−1) of global island rivers reported by Milliman and Syvitski [8], attributed largely to the special characteristics of the Kaoping SMR. However, the sediment yield decreased considerably to the level of 656 g m−2 year−1 during the drought year of 2002 when the rainfall and river discharge decreased considerably. The PWR was therefore a 5.5-fold difference between wet and drought years (Table 3). Apparently, the PWR was dependent exclusively on the variability of local and regional rainfall, which determined the river discharge.
An excellent relationship was previously found between the local rainfall and river discharge [12]. We also found a significant correlation between river discharge (annual mean, m3 s−1, y) and annual rainfall (mm, x) in the watershed (y = −90.2 + 0.1176x; r = 0.8235, p < 0.0001) during the period of 1979–2002, using the rainfall and discharge data collected by the WRB. The wet condition of 1999–2000 may have been caused by a strong La Niña year, and the drought year of 2002 may have been associated with the moderate level of El Niño events (https://ggweather.com/enso/oni.htm), despite the fact that the long-term El Niño Southern Oscillation (ENSO) cycle did not have a positive correlation with rainfall variability, caused probably by the effect of the Central Mountain Range in Taiwan [36]. Consequently, there was 4–5-fold difference between the two studied periods in the river discharge during the most ENSO-affected monsoon seasons (May–June) (Figure 2). In addition, three typhoons (Sam, Dan, and Kai-Tak) passed through and affected southern Taiwan between August 1999 and July 2000, but none of the typhoons affected southern Taiwan in 2002, causing a large difference in rainfall and river discharge (Figure 2) in the July–August months between the two periods. Apparently, the long-term variation of rainfall determined strongly the temporal variability of river discharge, and local and regional climatic variability controlled primarily the sediment yield and PWR in the Kaoping watershed.
In addition to rainfall intensity in driving the big difference of the PWR between wet and drought periods, the small basin area (3257 km2, Amazon: 6.15 × 10⁶ km2) and high basin relief (3997 m a.s.l.) and steep slope (Figure 1b) may have also been critical factors in elevating the PWR caused by increased rainfall. These effects may have been particularly obvious for the Kaoping River basin without the impacts of constructed dams and lakes. The PWR showed a 5.5-fold increase while the river discharge was increased by 3.04 fold only between drought and wet periods (Table 3). Previous studies have stressed the basin area and geological relief in controlling denudation rates of global drainage basins [2,8,37,38]. Intensive rainfall may have accelerated the denudation rate of the high-stand river basin, particularly for high rainfall from episodic events, as three typhoons had brought in huge rainfalls in the wet period compared with zero typhoons occurring in the drought period.
The land-use changes and enhanced soil erosion may have played additional roles in determining high total sediment yield [12]. Landslides are generally regarded as the major mechanism of hillslope erosion and are commonly triggered by deforestation and earthquake [39,40], and determined critically by rainfall intensity [41] in Taiwan. Lee et al. [42] found an increased mean daily sediment export from 0.42 Mt in the early stage (1970–1989) to 0.77 Mt in the recent stage (1990–2010) from 16 rivers in Taiwan and ascribed the increase to abundant rainfall and massive mass wasting. The landslide susceptibility maps calculated by the susceptibility model showed that the mid-upstream and upstream areas of the Kaoping River were highly susceptible to landslides, accounting for more than a 90% area of the basin [43]. The influence of land-use changing patterns in middle and lower watersheds may have also determined the distribution of TSM and TDS in the river waters [39,44]. Soil erodibility generally increases with the increase of rainfall for low land with low vegetable cover [45]. Chiang [46] reported the close relationship between rainfall intensity and soil erodibility in Taiwan. Intensive farming and poor practices of soil conservation lead primarily to the elevation of soil erosion rates. Chakrapani [38] also emphasized the large-scale human interventions affecting the present day sediment loads in global rivers.

4.2. Chemical Weathering Rates in the Kaoping Watershed

Chemical weathering is a crucial process in the cycle of elements at the earth’s surface and the major source of elements delivered by rivers to the oceans [47]. In this study, the chemical weathering rate (CWR) was derived from the total dissolved load of major cations (Ca2+, Mg2+, K+, Na+) and anions (Cl, HCO3, SO42−) corrected for atmospheric contributions. Accordingly, the spatial change of the CWR varied with the spatial change of major ions (Table 1) and increased from the upper reach to the lower reach, ranging from 539–850 g m−2 year−1 at Station 1 and Station 4 to 1140 g m−2 year−1 at Station 11 during the wet period (average discharge: 389 m3 s−1, Table 3) in August 1999–July 2000. The magnitude of the weathering rate was much higher than those reported as the global average (33–40 g m−2 year−1, [48]), means of Asia (32 g m−2 year−1, [49]), Europe average (42 g m−2 year−1, [49]), Zhujiang (114 g m−2 year−1, [50]), Changjiang (78.9 g m−2 year−1, [51]), Huanghe (Yellow River) (17.4 g m−2 year−1, [18]), Amazon (69.2 g m−2 year−1, [52]), and Orinoco (51.3 g m−2 year−1, [53]). The CWR decreased to 416 g m−2 year−1 at Station 11 during the drought period (average discharge: 128 m3 s−1) in 2002, but the rate was still higher than those in the large rivers. There was a 2.74-fold difference between wet and drought periods (Table 3).
Using the 2002 data set, we found that the CWR followed the PWR in depending exclusively on river discharge (Figure 4a), which in turn was determined by rainfall. The CWR was higher than the PWR in lower discharge (<200 m3 s−1) but much lower than the PWR in higher discharge (>300 m3 s−1) due to the dilute effect of dissolved loads and elevated denudation at high rainfall and river flow. Meanwhile, the CWR revealed a close correlation with the PWR in a two-stage manner (r = 0.9501, 0.9304; p < 0.001), with a higher sensitivity (slope) of relationship in the range of a CWR greater than 2.5 g m−2 day−1 (Figure 4b), showing differential responses of PWR and CWR to the intensity of rainfall and discharge. Thus, the high PWR appeared to be associated with the high CWR. Lyons et al. [54] also found a close association between chemical yield (Cy) and physical yield (Py) (Cy = 3089Py0.465; R2 = 0.822) in New Zealand watersheds. They ascribed the great influence on chemical yield by physical yield in high erosional watersheds to the results of rapid production of fresh surface, and subsequently the denudation was critical to the chemical weathering.
The concentration of TDS was also regarded as an indication of chemical weathering strength [3]. The concentration of TDS ranged from 223 mg L−1 to 554 mg L−1 in the Kaoping River, showing an increasing trend in the downstream direction that was generally higher in dry seasons than in wet seasons. The median of TDS concentration (328 mg L−1) was five times the global median of 65 mg L−1 [16], indicating a high strength of chemical weathering. Overall, the concentration of TDS varied inversely with river discharge (Q) in the log–log scale due to dilution effect (Figure 5a, r = −0.3805, p = 0.002), according to the following relationship proposed by Walling and Webb [55]:
C = aQb,
where C is the concentration of major ions or TDS (mg L−1), Q is river discharge (m3 s−1), a is the regression constant, and b is the regression exponent. The relationship between individual major ion and discharge was same as that of TDS-discharge, but the data are not presented for brevity. Nevertheless, the total load of TDS increased coincidently with the increase of discharge rates (Figure 5b, r = 0.9962, p < 0.0001), indicating that the chemical weathering rates and produced TDS were likely determined strictly by rainfall intensity and river discharge. The higher rainfall also enhanced the PWR and accelerated the rock and mineral dissolution and ion release in the environment, leading to an elevated CWR [4,56]. Despite lack of data in this study, Song et al. [57] did stress land-use change and vegetation cover playing important roles in determining silicate weathering condition and Si cycling in various lands and soils.
The weathering index (WI), defined by the ratio of Σ(Si + Al + Fe)/Σ(Ca + Mg + K + Na) in particulate matter in the river water [58], was higher in 1999–2000 (7.71 ± 1.88, ranging from 6.68 ± 1.58 in the upper stream to 8.28 ± 1.29 in the lower reach) than in 2002 (6.13 ± 1.17), corresponding to higher annual rainfall in 1999–2000 (1785 mm/year) than in 2002 (1038 mm/year). The WI was slightly lower than the values of the equatorial Orinoco River and Caroni River, based on the same rainfall (1785 mm/year) (Figure 6), which may have resulted from the difference in regional temperature. It may have also been caused by the high-stand and low buffering characteristics of sediments produced and transported in the SMR watershed.
However, the WI in 2002 fell exactly into the global trend of the relationship between WI and rainfall. Under humid conditions, alkali and alkaline earth cations (Ca, Mg, K, Na) are more mobile than those ions in silicate minerals (Si, Al, Fe) during weathering processes and result in a relatively high ratio (WI) in weathering products. Apparently, during the wet years (1999–2000) the slightly lower WI than the global trend under a specific rainfall may have been caused by a high sediment yield and moderate chemical weathering rate, despite the watershed having a relatively high rainfall determined by short periods of monsoon and typhoon events. An alternative method of using the chemical index of alternation (CIA = 100 [Al2O3/Al2O3 + CaO* + Na2O + K2O]), where CaO* is the CaO in the silicate fraction of rock, may also provide a solid assessment of the degree of chemical weathering [59]. The CIA values estimated from Kaoping River suspended particulates ranged from 57 to 86 (mean: 71) in the wet period and from 49 to 68 (mean: 57) in the drought period. The CIA conditions followed closely the previous report of moderate chemical weathering of the Kaoping River basin [60].
On the total denudation rate (sum of PWR and CWR), the magnitude was 4174 g m−2 year−1 during the wet period of 1999–2000 in the Kaoping watershed, showing an anomalously high rate compared to previous reports from the world [8,19]. The very high total denudation rate was likely attributed to an exceptionally high rate of physical weathering and a moderately high rate of chemical weathering, derived from the combined effects of high-stand relief, young geological formation, recent change of land use, vegetation cover, and episodic rain events during monsoon and typhoon seasons [12,19,61].

4.3. Mechanisms of Solutes Acquisition

The sources of major cations and anions are generally derived from carbonate and silicate weathering, as the rock weathering dominates all chemical weathering types and dictates the state of water chemistry in the river, according to Gibbs’s theory on the plot between the concentration of TDS and the ratio of Cl/(Cl + HCO3) or Na+/(Na+ + Ca2+) [62]. In this study, the relationship plot between the TDS ranges (223 mg L−1 to 554 mg L−1) and the ratio of Cl/Cl + HCO3 (0.07–0.272) falls in the domain that can be categorized as a typical weathering type dominated by rock weathering [62]. This derivation may be supported by the facts that there are no evaporitic deposits in the Kaoping watershed [23] and there is a relatively short wet season (June–September). Li et al. [63] reported that the major ions of river waters in Taiwan derived mainly from carbonate and silicate weathering. Recently, Blattmann et al. [24] stressed the importance of pyrite-derived sulfuric acid (4FeS2 + 15O2 +14H2O → 4Fe(OH)3 + 8H2SO4) weathering, together with carbonic acid weathering, on silicates and carbonates in the Kaoping River basin.
Given the condition of HCO3 sourced from carbonate and silicate weathering, the plot of (Ca2+ + Mg2+) versus HCO3 (Figure 7a) shows that both major cations and anions may have been derived from the same sources (i.e., reactions between carbonic acid and carbonates and silicates) because of a significant correlation (r = 0.776, p < 0.0001) between the two variables. However, most data deviate from the 1:1 trend line (equivalent basis), showing that an excess of (Ca2+ + Mg2+) may have been derived from sulfate weathering on silicate without producing bicarbonate in the river water in the absence of evaporate contributions [23,64]. The plot between (Ca2+ + Mg2+) and (HCO3 + SO42−) shows that all data are close to the 1:1 trend line but the excess of sulfate may have been derived from acid rain or human pollution (Figure 7b). The relationship between (Ca2+ + Mg2+) and SO42− (Figure 7c) also shows a large deviation from the 1:1 trend line, implying that both two components were not derived from dissolution of sulfate evaporates.
The plot of the sum of Na+ and K+ versus Cl (Figure 7d) indicates that (Na+ and K+) may not have derived from the dissolution of halite evaporates because most samples deviate above the 1:1 trend line that characterizes a pure source of halite evaporates. This condition implies that (Na+ and K+) were likely derived from sodium and potassium aluminosilicates weathering rather than from halite evaporite weathering. Judging from the Na and K stability diagrams, both Na+ and K+ appear to have been primarily controlled by silicate weathering as they fall on the equilibrium field of kaolinite and/or on the boundary of smectite–kaolinite domains (Figure 8).
Figure 9a also shows that the particulate Al/Si molar ratio in the upper reaches is largely close to two indicating smectites as the major weathering products and kaolinite as the secondary weathering product. Because the Kaoping River is a tropical river, it is reasonably thought that kaolinite was the dominant product of weathering sequences and both Na+ and K+ in the river water were mainly derived from the silicate weathering to the final minerals of smectite and kaolinite. However, the particulate Al/Si molar ratio was close to 1 during the wet season and close to 2 during the dry season (Figure 9b) in the river end-member (Station #11), in response to greater weathering intensity in the wet and hot season than in the dry and cold season, as well as in the lower reach than in the upper reach.
Bicarbonate was generally the major form of DIC, which was derived from the dissolution of carbonates and silicates due to the close relationship between (Ca2+ + Mg2+) and HCO3 (Figure 7a). Chloride and sulfate may have been derived mainly from silicate weathering after correction from the atmospheric contribution due to lack of evaporates in the river basin [23]. Previous studies on the sulfur isotope of sulfate in the river water demonstrated that sulfate was derived primarily from pyrite oxidation and carbonates were exclusively weathered by sulfuric acid in the Kaoping River catchments [24,64] without exclusion of pollution in the lower reach. H4SiO4 was the major component of Al-silicate and appeared to be derived mainly from silicate weathering.

4.4. Relative Contributions of Carbonate and Silicate Weathering

Relative contributions of carbonate and silicate weathering to major dissolved cations and anions may be estimated by the relationship between Na-normalized ratios (Mg/Na vs. Ca/Na and HCO3/Na vs. Ca/Na) in the river water and the end-members of pure evaporates, carbonates, and silicates (Figure 10). Apparently, all Na-normalized ratios of river water located between silicate and carbonate end-members. The end-members of evaporates, carbonates, and silicates were (Ca/Na = 0.17 ± 0.09; Mg/Na = 0.02 ± 0.01; HCO3/Na = 0.3 ± 0.3), (Ca/Na = 45 ± 25; Mg/Na = 15 ± 10; HCO3/Na = 90 ± 40), and (Ca/Na = 0.35 ± 0.25; Mg/Na = 0.24 ± 0.16; HCO3/Na = 1.0 ± 1.0), respectively [56]. In a first approximation, the contribution of carbonate weathering and silicate weathering to total dissolved ion load ranged from 27.2 to 68.7% (48.6 ± 9.5%) and from 36.7 to 76.2% (54.7 ± 10.2%), respectively. The averaged contribution proportions were close to those findings from Blattmann et al. [24], who reported 54 ± 8% for carbonate contribution and 46 ± 8% for silicate contribution. The estimates are likely reasonable because of the limited abundance of rock carbonate dominated by siliciclastic metasedimentary units in the Kaoping River catchment [23,24]. It is worth noting the effect of silicate weathering on net CO2 fluxes in the SMR watershed because of 3-fold higher CO2 fluxes derived from silicate weathering in orogenic zones than in stable basement regions [65].

4.5. Carbon Yields in the Watershed

The DIC was derived from the dissolution of carbonates and silicates as discussed in the above section, and DIC yield was the highest in the total carbon yield (Table 3). The DOC was derived from leaching through alpine and agricultural soils, as DOC concentration correlated well with POC concentration (r = 0.359, p < 0.005). The DOC concentration increased remarkably as water flowed through the agricultural zone. However, relatively low concentration and DOC yield (1.8–1.87 g m−2 year−1) compared with those in global large rivers [13,66] may have been caused by a steep slope and small watershed and lack of lake and wetlands in the river course. The DOC load was primarily determined by water discharge as the DOC load was significantly correlated with discharge (r = 0.932, p < 0.0001). POC and PIC distributions were highly dependent on the distribution of TSM in the river water. In general, POC concentration (by volume, mg L−1) increased with the increase of TSM (mg L−1), and both had a significant correlation (r = 0.688, p < 0.0001). However, the weight concentration (POC/TSM, %) decreased sharply with the increase of TSM, indicating the pronounced dilution of POC by inorganic mineral substances. Annual mean ratio of POC/PN was 8.9, which was close to the mean value (8.5 [66]) of global rivers. The ratio generally decreased from the upper reach to the lower reach, implying the increased contribution of planktons in the lower reach. The volume concentration of PIC was also correlated with the concentration of TSM (r = 0.5146, p < 0.0001). The watershed yield of each carbon component always increased from the upper reach to the lower reach.
The total carbon yield, summarized from DIC, DOC, PIC, and POC yields, was 146 g m−2 year−1, which was contributed predominantly by the DIC yield (91.5 g m−2 year−1; 63%), followed by POC yield (37 g m−2 year−1; 25.3%), PIC yield (15.2 g m−2 year−1; 10.4%), and DOC yield (1.87 g m−2 year−1; 1.28%) in the wet period. The total carbon yield was much higher than those from global rivers [13]. In addition, the DIC yield was much higher in the Kaoping River (91.5 g m−2 year−1, Table 3) than in the world’s large rivers (Amazon: 6.76 g m−2 year−1; Changjiang: 9.51 g m−2 year−1) and high-stand island river (Lanyang Hi: 50.0 g m−2 year−1). The DOC yield was lower in the Kaoping River (1.87 g m−2 year−1) than in the Amazon (4.07 g m−2 year−1), Orinoco (4.50 g m−2 year−1), and Lanyang Hi (4.40 g m−2 year−1). The POC yield was much higher in the Kaoping River (37 g m−2 year−1) than in the Amazon (2.27 g m−2 year−1), Changjiang (2.69 g m−2 year−1), and Lanyang Hi (23 g m−2 year−1). The PIC yield was lower in the Kaoping River (15.2 g m−2 year−1) than in the Huanghe (19.5 g m−2 year−1), but higher than in the Lanyang Hi (8.40 g m−2 year−1). Apparently, the total carbon yield was dominated by DIC yield and heavy contributions from carbonate and silicate weathering but fewer contributions from DOC production. Taking 54.7% of DIC yield as being derived from the silicate weathering (abovementioned), the consumption of atmospheric CO2 through silicate weathering in the catchment would be 0.298 MtC/year in the wet condition and 0.155 MtC/year in the drought period without considering the carbon release from chemical weathering. This carbon sink was on the same order of net sink (0.24 ± 0.13) MtC/year of atmospheric CO2 consumed over geological timescales in Taiwan [24].

4.6. Nutrient Yields and Human Influence

Nutrient yields may have been determined by natural and anthropogenic processes in the Kaoping watershed, which may have played an important role in transporting nutrients from the land to the ocean. Concentrations of nutrients always increased from the upper reach to the lower reach and were much higher in Station 11 than those in the unpolluted rivers. For instance, the concentration of NH4+ and NO3 in Station 11 were 10-fold and 30-fold magnitudes of those in the Amazon River clean water [13], respectively. The increased loads of DIN and DIP were largely attributed to wastewater inputs in the middle and lower reaches in addition to agricultural non-point source inputs in the whole watershed. According to Taiwan’s EPA Report [67], the input rates of total dissolved nitrogen and phosphorus from urban and animal wastewater were 55,610 and 4671 kg day−1, respectively. Thus, the naturally derived total dissolved N (571 kmol day−1) and P (129 kmol day−1) inputs were only 16% and 57% of those anthropogenic N and P inputs, respectively. The DIN/DIP ratio ranged from 16 to 115 in the river, which fell into two groups of ratios centering on 10 and 100, representing the typical sources derived from urbanized–industrialized watersheds and agricultural watersheds [68], respectively.
Consequently, the DIN and DIP yields were estimated to be 0.59 mol m−2 year−1 and 6.29 mmol m−2 year−1, respectively, in 1999–2000, as well as 0.53 mol m−2 year−1 and 5.43 mmol m−2 year−1, respectively, in 2002. The differences between the two periods were 4.54-fold for DIN and 1.16-fold for DIP. In addition, the yields of TDN and TDP were 0.74 mol m−2 year−1 and 11 mmol m−2 year−1, respectively, in 1999–2000, although we did not collect data for TDN and TDP in 2002.
Dissolved silicate was likely derived exclusively from the weathering of silicate minerals because of the little inputs of silicate from wastewater pollution. The yield also increased from the upper reach (0.21–0.27 mol m−2 year−1) to lower reach (0.41–0.55 mol m−2 year−1), corresponding to the increase of chemical weathering. There was a 1.32-fold difference for silicate yield between the periods of 1999–2000 (0.41 mol m−2 year−1) and 2002 (0.31 mol m−2 year−1). In addition to the anthropogenic impacts on nitrogen and phosphorus, all nutrient yields were apparently also controlled by local rainfall conditions in the Kaoping watershed.

5. Conclusions

Physical and chemical weathering rates increased remarkably from the upper reach to the lower reach in this steep SMR watershed. They were apparently determined by the high-stand relief, young and weak geological conditions, land-use change, and river discharge, which, in turn, was determined by rainfall driven mainly by episodic events of heavy rain in May-yu (monsoon) and typhoon seasons. Both weathering rates were very sensitive to annual rainfall influenced by ENSO events. They were also much higher than the world’s averages when the local climate was in the wet condition.
The moderate rate of chemical weathering, inferred from the chemical weathering index, may also have been caused by moderately high temperature and rainfall, but the steep watershed may not have been favorable in chemical leaching and mineral dissolution. Carbonate and silicate weathering contributed roughly equal amounts of the total dissolved ions to the river water. However, silicate weathering was mainly responsible for the dissolved loads of cations (K, Na) and anions (H4SiO4, Cl, SO42−) in the river water. Carbon yield was dominated by a DIC yield that was mainly contributed by carbonate and silicate weathering in the watershed. Nutrient yields, however, were considerably influenced by human impacts, particularly in the lower reach, except for the dissolved silicate yield that was derived mainly from silicate weathering.
Overall, the findings emphasize the combined effects of ENSO-driven rainfall changes and human perturbation on crucially determining the big difference in weathering rates and chemical yields between wet and drought periods in the Kaoping watershed. Such results may be applicable to other SMRs, particularly in Taiwan, in evaluating river transport of weathered and anthropogenic materials to oceans.

Supplementary Materials

The following are available online at https://www.mdpi.com/2071-1050/12/18/7689/s1, Figure S1: Temporal variability of dissolved major ions and discharge in the river end-member (Station 11) in 2002, Figure S2: Temporal variability of DIC, DOC, nutrients, Chl-a and discharge in the river end-member (Station 11) in 2002.

Author Contributions

The manuscript was written, reviewed and edited by J.-J.H. The data collection and analyses were performed by C.-Y.Y. and I-J.L. Conceptualization, J.-J.H.; methodology, J.-J.H., C.-Y.Y., I-J.L.; supervision, J.-J.H., Y.-H.L.; project administration, J.-J.H.; funding acquisition, J.-J.H.; data curation, Y.-H.L. All authors have read and agreed to the published version of the manuscript.

Funding

This research was funded by the Ministry of Science and Technology in Taiwan (MOST 106-2611-M-110-015-).

Acknowledgments

The authors would like to thank M.-H. Huang and Y.-H. Lin for their assistance in manuscript preparation.

Conflicts of Interest

The authors declare no conflict of interest. The funders had no role in the design of the study; in the collection, analyses, or interpretation of data; in the writing of the manuscript, or in the decision to publish the results.

References

  1. Li, Y.-H. Denudation of Taiwan Island since the Pliocene Epoch. Geology 1976, 4, 105–107. [Google Scholar] [CrossRef]
  2. Milliman, J.D.; Meade, R.H. World-Wide Delivery of River Sediment to the Oceans. J. Geol. 1983, 91, 1–21. [Google Scholar] [CrossRef]
  3. Chest, R. Marine Geochemistry; Chapman & Hall: London, UK, 2000; pp. 11–82. [Google Scholar]
  4. White, A.F.; Blum, A.E. Effects of climate on chemical_ weathering in watersheds. Geochim. Cosmochim. Acta 1995, 59, 1729–1747. [Google Scholar] [CrossRef]
  5. Stumm, W.; Wollast, R. Coordination chemistry of weathering: Kinetics of the surface-controlled dissolution of oxide minerals. Rev. Geophys. 1990, 28, 53–69. [Google Scholar] [CrossRef] [Green Version]
  6. Meybeck, M. Global chemical weathering of surfacial rocks estimated from river dissolved loads. Am. J. Sci. 1987, 287, 401–428. [Google Scholar] [CrossRef]
  7. Gaillardet, J.; Dupre, B.; Louvat, P.; Allègre, C. Global silicate weathering and CO2 consumption rates deduced from the chemistry of large rivers. Chem. Geol. 1999, 159, 3–30. [Google Scholar] [CrossRef]
  8. Milliman, J.D.; Syvistski, J.P.M. Geomorphic/tectonic control of sediment to oceans. J. Geol. 1992, 100, 525–544. [Google Scholar] [CrossRef]
  9. Milliman, J.D. Sediment discharge to the ocean from small mountainous rivers: The New Guinea example. Geomar. Lett. 1995, 15, 127–133. [Google Scholar] [CrossRef]
  10. Carey, A.E.; Goldsmith, S.T.; Lyons, W.B.; Gardner, C.B.; Hicks, D.M. Organic carbon yields from small, mountainous rivers, New Zealand. Geophys. Res. Lett. 2005, 32, L15404. [Google Scholar] [CrossRef]
  11. Milliman, J.D.; Farnsworth, K.L.; Albertin, C.S. Flux and fate of fluvial sediments leaving large islands in the East Indies. J. Sea Res. 1999, 41, 97–107. [Google Scholar] [CrossRef]
  12. Liu, J.T.; Hsu, R.T.; Hung, J.-J.; Chang, Y.-P.; Wang, Y.-H.; Rendle-Bühring, R.H.; Lee, C.-L.; Huh, C.-A.; Yang, R.J. From the highest to the deepest: The Gaoping River-Gaoping Submarine Canyon dispersal system. Earth Sci. Rev. 2016, 153, 274–300. [Google Scholar] [CrossRef]
  13. Degens, E.T.; Kempe, S.; Richey, J.E. Biogeochemistry of Major World Rivers; John Wiley & Sons: New York, NY, USA, 1991. [Google Scholar]
  14. Walling, D.E.; Webb, D.W. Material transport by world’s rivers: Evolving perpectives. In Water for Future: Hydrology in Perspective; IAHS Publication: Wallingford, UK, 1987; Volume 164. [Google Scholar]
  15. Hamid, A.; Bhat, S.U.; Jehangir, A. Local determinants influencing stream water quality. Appl. Water Sci. 2020, 10, 24. [Google Scholar] [CrossRef] [Green Version]
  16. Meybeck, M.; Helmer, R. The quality of rivers: From pristine stage to global pollution. Paleogeog. Paleoclim. Paleoecol. 1989, 75, 283–309. [Google Scholar] [CrossRef]
  17. Chen, X.; Zong, Y.; Zhang, E.; Xu, J.; Li, S. Human impacts on the Changjiang (Yangtze) River basin, China, with special reference to the impacts on the dry season water discharges into the sea. Geomorphology 2001, 41, 111–123. [Google Scholar] [CrossRef]
  18. Chen, J.; Wang, F.; Meybeck, M.; He, D.; Xia, X.; Zhang, L. Spatial and temporal analysis of water chemistry records (1958–2000) in the Huanghe (Yellow River) basin. Glob. Biogeochem. Cycles 2005, 19. [Google Scholar] [CrossRef]
  19. Hung, J.-J.; Yeh, Y.-T.; Huh, C.-A. Efficient transport of terrestrial particulate carbon in a tectonically-active marginal sea off southwestern Taiwan. Mar. Geol. 2012, 315, 29–43. [Google Scholar] [CrossRef]
  20. Hung, J.-J.; Hsu, C.-L. Present state and historical changes of trace metal pollution in Kaoping coastal sediments, southwestern Taiwan. Mar. Pollut. Bull. 2004, 49, 986–998. [Google Scholar] [CrossRef]
  21. Hung, J.-J.; Lu, C.-C.; Huh, C.-A.; Liu, J.T. Geochemical controls on distributions and speciation of As and Hg in sediments along the Gaoping (Kaoping) Estuary–Canyon system off southwestern Taiwan. J. Mar. Syst. 2009, 76, 479–495. [Google Scholar] [CrossRef]
  22. Water Resources Bureau. Hydrological Year Book of Taiwan; Ministry Economic Affairs: Taiwan, 2004. [Google Scholar]
  23. Ho, C.-S. An Introduction to the Geology of Taiwan: Explanatory Text of the Geologic Map of Taiwan, 2nd ed.; Central Geological Survey, Ministry of Economic Affairs: Taiwan, 1988. [Google Scholar]
  24. Blattmann, T.M.; Wang, S.-L.; Lupker, M.; Märki, L.; Haghipour, N.; Wacker, L.; Chung, L.-H.; Bernasconi, S.M.; Plötze, M.; Eglinton, T.I. Sulphuric acid-mediated weathering on Taiwan buffers geological atmospheric carbon sinks. Sci. Rep. 2019, 9, 2945. [Google Scholar] [CrossRef]
  25. Harrison, J.F.; Chang, C.-H.; Liu, C.-C. Identification of inventory-based susceptibility models for assessing landslide probability: A case study of the Gaoping River Basin, Taiwan. Geomat. Nat. Hazards Risk 2017, 8, 1730–1751. [Google Scholar] [CrossRef] [Green Version]
  26. Sparkes, R.; Lin, I.-T.; Hovius, N.; Galy, A.; Liu, J.T.; Xu, X.; Yang, R. Redistribution of multi-phase particulate organic carbon in a marine shelf and canyon system during an exceptional river flood: Effects of Typhoon Morakot on the Gaoping River–Canyon system. Mar. Geol. 2015, 363, 191–201. [Google Scholar] [CrossRef]
  27. Welschmeyer, N.A. Fluorometric analysis of chlorophyII aon the presence of chlorophyII b and phenopigments. Limnol. Oceanogr. 1994, 39, 1985–1992. [Google Scholar] [CrossRef]
  28. Hung, J.-J.; Hung, P.-Y. Carbon and nutrient dynamics in a hypertrophic lagoon in southwestern Taiwan. J. Mar. Syst. 2003, 42, 97–114. [Google Scholar] [CrossRef]
  29. Hung, J.-J.; Wang, S.-M.; Chen, Y.-L. Biogeochemical controls on distributions and fluxes of dissolved and particulate organic carbon in the Northern South China Sea. Deep Sea Res. Part II Top. Stud. Oceanogr. 2007, 54, 1486–1503. [Google Scholar] [CrossRef]
  30. Hung, J.-J.; Lin, C.; Hung, G.; Chung, Y. Lateral Transport of Lithogenic Particles from the Continental Margin of the Southern East China Sea. Estuar. Coast. Shelf Sci. 1999, 49, 483–499. [Google Scholar] [CrossRef] [Green Version]
  31. Grasshoff, K.; Ehrhardt, M.; Kremling, K. Methods of Seawater Analysis; Verlag Chimie: Weinheim, Germany, 1983; pp. 143–187. [Google Scholar]
  32. Pai, S.C.; Yang, C.C. Effects of acidity and molybdate concentration on the kinetics of the formation of the phosphoantimonylbdum blue complex. Anal. Chim. Acta 1990, 229, 115–120. [Google Scholar]
  33. Ridal, J.; Moore, R. A re-examination of the measurement of dissolved organic phosphorus in seawater. Mar. Chem. 1990, 29, 19–31. [Google Scholar] [CrossRef]
  34. David, L.T. Calculation of River Discharge. Loicz Rep. Stud. 2000, 14, 141–147. [Google Scholar]
  35. McLennan, S.M. Weathering and Global Denudation. J. Geol. 1993, 101, 295–303. [Google Scholar] [CrossRef]
  36. Wu, T.-T.; Lee, C.-P. The effects of El Niño Southern Oscillation on temperature and precipitation in Taiwan. In Proceedings of the 36th Ocean Engineering Conference in Taiwan, Taiwan, 4–5 December 2014; pp. 471–476, (in Chinese with Abstract in English). [Google Scholar]
  37. Summerfield, M.A.; Hulton, N.J. Natural controls of fluvial denudation rates in major world drainage basins. J. Geophys. Res. Space Phys. 1994, 99, 13871–13883. [Google Scholar] [CrossRef]
  38. Chakrapani, G.J. Factors controlling variations in river sediment loads. Curr. Sci. 2005, 88, 569–575. [Google Scholar]
  39. Hovius, N.; Stark, C.P.; Hao-Tsu, C.; Jiun-Chuan, L. Supply and Removal of Sediment in a Landslide-Dominated Mountain Belt: Central Range, Taiwan. J. Geol. 2000, 108, 73–89. [Google Scholar] [CrossRef]
  40. Dadson, S.J.; Hovius, N.; Chen, H.; Dade, W.B.; Hsieh, M.L.; Willett, S.D.; Hu, J.-C.; Horng, M.-J.; Chen, M.-C.; Stark, C.P.; et al. Links between erosion, runoff variability and seismicity in the Taiwan orogeny. Nature 2003, 426, 648–651. [Google Scholar] [CrossRef]
  41. Chen, Y.-C.; Chang, K.-T.; Chiu, Y.-J.; Lau, S.-M.; Lee, H.-Y. Quantifying rainfall controls on catchment-scale land-slide erosion in Taiwan. Earth Surf. Proc. Landf. 2012, 38, 372–382. [Google Scholar] [CrossRef]
  42. Lee, T.Y.; Huang, J.-C.; Lee, J.-Y.; Jien, S.-H.; Zehetner, F.; Kao, S.-J. Magnified Sediment Export of Small Mountainous Rivers in Taiwan: Chain Reactions from Increased Rainfall Intensity under Global Warming. PLoS ONE 2015, 10, e0138283. [Google Scholar] [CrossRef]
  43. Shou, K.J.; Wu, C.C.; Lin, J.F. Predictive analysis of landslide susceptibility in the Kao-Ping watershed, Taiwan under climate change conditions. Nat. Hazards Earth Syst. Sci. Discuss. 2015, 3, 575–606. [Google Scholar] [CrossRef]
  44. Kao, S.J.; Milliman, J.D. Water and Sediment Discharge from Small Mountainous Rivers, Taiwan: The Roles of Lithology, Episodic Events, and Human Activities. J. Geol. 2008, 116, 431–448. [Google Scholar] [CrossRef] [Green Version]
  45. Hudson, N. Soil Conservation, 3rd ed.; B.T. Batsford Ltd.: London, UK, 1995. [Google Scholar]
  46. Chiang, S.-H. Climate and soil erodibility (in Chinese). Sci. Mon. 1989, 20, 132–134. [Google Scholar]
  47. Martin, J.-M.; Whitfield, M. The Significance of the River Input of Chemical Elements to the Ocean. In Trace Metals in Sea Water; Springer Science and Business Media LLC: Berlin/Heidelberg, Germany, 1983; pp. 265–296. [Google Scholar]
  48. Meybeck, M. How to establish and use world budgets of riverine materials. In Physical and Chemical Weathering in Geochemical Cycles; Lerman, A., Meybeck, M., Eds.; Springer: Dordrecht, The Netherlands, 1988. [Google Scholar]
  49. Garrels, R.M.; Mackenzie, F.T. Evolution of Sedimentary Rocks; W.W. Norton & Co.: New York, NY, USA, 1971. [Google Scholar]
  50. Zhang, S.-R.; Lu, X.; Higgitt, D.L.; Chen, C.-T.A.; Sun, H.-G.; Han, J.-T. Water chemistry of the Zhujiang (Pearl River): Natural processes and anthropogenic influences. J. Geophys. Res. Space Phys. 2007, 112, F01011. [Google Scholar] [CrossRef]
  51. Chen, J.; Wang, F.; Xia, X.; Zhang, L. Major element chemistry of the Changjiang (Yangtze River). Chem. Geol. 2002, 187, 231–255. [Google Scholar] [CrossRef]
  52. Stallard, R.F.; Edmond, J.M. Geochemistry of the Amazon: The influence of geology and weathering environment on the dissolved load. J. Geophys. Res. Space Phys. 1983, 88, 9671–9688. [Google Scholar] [CrossRef]
  53. Edmond, J.; Palmer, M.; Measures, C.; Brown, E.T.; Huh, Y. Fluvial geochemistry of the eastern slope of the northeastern Andes and its foredeep in the drainage of the Orinoco in Colombia and Venezuela. Geochim. Cosmochim. Acta 1996, 60, 2949–2974. [Google Scholar] [CrossRef]
  54. Lyons, W.B.; Carey, A.E.; Hicks, D.M.; Nezat, C.A. Chemical weathering in high-sediment-yielding watersheds, New Zealand. J. Geophys. Res. Space Phys. 2005, 110, F01008. [Google Scholar] [CrossRef] [Green Version]
  55. Walling, D.E.; Webb, D.W. Solutes in River Systems, in Solute Processes; Trudgill, S.D., Ed.; John Wiley: Hoboken, NJ, USA, 1986; pp. 251–327. [Google Scholar]
  56. Gaillardet, J.; Dupré, B.; Allègre, C.J.; Negrel, P. Chemical and physical denudation in the Amazon River Basin. Chem. Geol. 1997, 142, 141–173. [Google Scholar] [CrossRef]
  57. Song, Z.; Wang, H.; Strong, P.J.; Li, Z.; Jiang, P. Plant impact on the coupled terrestrial biogeochemical cycles of silicon and carbon: Implications for biogeochemical carbon sequestration. Earth Sci. Rev. 2012, 115, 319–331. [Google Scholar] [CrossRef]
  58. Zhang, J. Geochemistry of Trace Metals from Chinese River/Estuary Systems: An Overview. Estuar. Coast. Shelf Sci. 1995, 41, 631–658. [Google Scholar] [CrossRef]
  59. Nesbitt, H.W.; Young, G.M. Early Proterozoic climates and plate motions inferred from major element chemistry of lutites. Nature 1982, 299, 715–717. [Google Scholar] [CrossRef]
  60. Selvaraj, K.; Chen, C.-T.A. Moderate Chemical Weathering of Subtropical Taiwan: Constraints from Solid-Phase Geochemistry of Sediments and Sedimentary Rocks. J. Geol. 2006, 114, 101–116. [Google Scholar] [CrossRef] [Green Version]
  61. Hung, J.-J.; Yeh, Y.-C. Quantifying Phosphorus Sources and Sinks in the Gaoping River-Sea System in Southwestern Taiwan. Estuar. Coast. 2018, 42, 425–438. [Google Scholar] [CrossRef]
  62. Gibbs, R.J. Mechanisms Controlling World Water Chemistry. Science 1970, 170, 1088–1090. [Google Scholar] [CrossRef]
  63. Li, Y.-H.; Chen, C.-T.; Hung, J.-J. Aquatic Chemistry of Lakes and Reservoirs in Taiwan. Terr. Atmos. Ocean. Sci. 1997, 8, 405. [Google Scholar] [CrossRef]
  64. Das, A.; Chung, C.-H.; You, C.-F. Disproportionately high rates of sulfide oxidation from mountainous river basins of Taiwan orogeny: Sulfur isotope evidence. Geophys. Res. Lett. 2012, 39, 39. [Google Scholar] [CrossRef]
  65. Huh, Y.; Edmond, J.M. The fluvial geochemistry of the rivers of Eastern Siberia: III. Tributaries of the Lena and Anabar draining the basement terrain of the Siberian Craton and the Trans-Baikal Highlands. Geochim. Cosmochim. Acta 1999, 63, 967–987. [Google Scholar] [CrossRef]
  66. Meybeck, M. Carbon, nitrogen, and phosphorus transport by world rivers. Am. J. Sci. 1982, 282, 401–450. [Google Scholar] [CrossRef]
  67. EPA (Taiwan) Report. The Planning of Pollution Control in the Kaoping River; EPA (Taiwan): Taiwan, 1993; p. 179. (in Chinese) [Google Scholar]
  68. Billen, G.; Lancelot, C.; Meybeck, M. N, P and Si Retention along the Aquatic Continuum from Land to Ocean. In Ocean Margin Processes in Global Change; Mantoura, R.F.C., Martin, J.-M., Wollast, R., Eds.; John Wiley & Sons: Hoboken, NJ, USA, 1991. [Google Scholar]
Figure 1. Sampling locations in upper streams (Chi-San Stream, Lao-Nung Stream, Yai-Liao Stream) and middle-lower branch (Kaoping) of the river in southwestern Taiwan, and the sampling stations are also renamed numerically for easy identification (a). The lower panel shows the elevation and the fraction of total river discharge in each sampling location (b).
Sustainability 12 07689 g001
Figure 2. Monthly variations of river discharge in the Kaoping River during the wet period of August 1999–August 2000 (a), and during the drought period of 2002, compared with the variability of historical records (1971–2000) (b). Data are provided by the Water Resources Bureau in Taiwan.
Sustainability 12 07689 g002
Figure 3. Monthly variations of total dissolved major anions (in terms of total equivalent charge, TZ, Σ(HCO3, Cl, SO42−)) in different sampling stations. From top to bottom panels are stations in the Chi-San Stream (a), Lao-Nung Stream (b), Yai-Liao Stream (c), and Kaoping River (d), respectively.
Sustainability 12 07689 g003
Figure 4. Relation plot between physical and chemical weathering rates and river discharge during the drought period (2002) (a), and the relationship between physical weathering rate and chemical weathering rate (b).
Sustainability 12 07689 g004
Figure 5. Relation plots and statistic correlation between total dissolved solids (TDS) and river discharge (Q, m3 s−1) in log–log scales (a), and between total dissolved load and river discharge (Discharge) in linear scales (b).
Sustainability 12 07689 g005
Figure 6. Comparison of chemical weathering indexes among the values derived from the Kaoping River during the periods of 1999−2000 (ο) and 2002 (□), and global river data (•) adopted from Zhang (1995).
Sustainability 12 07689 g006
Figure 7. Relation plots and statistic correlations between (Ca2+ + Mg2+) concentration and HCO3 concentration (a), between (Ca2+ + Mg2+) concentration and (HCO3 + SO42−) concentration (b), between (Ca2+ + Mg2+) concentration and SO42− concentration (c), and between (Na+ + K+) concentration and Cl concentration (d) in Kaoping River water for all data collected from various sampling times and stations. The 1:1 line is also plotted together with the data correlation in each figure for comparison.
Sustainability 12 07689 g007
Figure 8. Stability diagrams constructed from the thermodynamic equilibrium among clay minerals [48], and all collected data are labeled on the diagram to show the major weathering products in supporting the activity of K+ (a) and Na+ (b) in Kaoping River water.
Sustainability 12 07689 g008
Figure 9. Spatial and temporal variations in the molar ratio between particulate Si and particulate Al for samples collected at various sampling times (2002) and stations (a), and the ratios of samples collected from the wet season (■) and the drought season (□) (b) in the river end-member (Station #11) of Kaoping River.
Sustainability 12 07689 g009aSustainability 12 07689 g009b
Figure 10. Scatterplots between Mg/Na and Ca/Na molar ratios (upper panel), and between HCO3/Na and Ca/Na molar ratios (lower panel) during the drought period. The assigned end-member ratios of carbonate (oval), silicate (square), and evaporate (rectangle) are also plotted together with collected river data in each figure to derive the relative contribution of carbonate and silicate weathering in determining dissolved major ions in river water.
Sustainability 12 07689 g010
Table 1. Distribution of major cations and anions in the upper branches (Lao-Nung Stream, Chi-San Stream, Yai-Liao Stream) and the lower-reach Kaoping River in the wet period (August 1999–July 2000).
River branchCa2+Mg2+K+Na+HCO3ClSO42v
(Stream) μeq L−1
Lao-Nung (mean)10964121177782341350682
Lao-Nung (range)823–1331291–57026–270221–13092040–292420–794348–897
Chi-San (mean)11504971439572809346664
Chi-San (range)735–1761353–62535–295397–18182221–427929–907448–956
Yai-Liao (mean)12194581136642775362712
Yai-Liao (range) 1035–2281383–59915–200180–11142054–447181–768477–1077
Kaoping (mean)1553~5411377922994429842
Kaoping (range)1023–2313393–70516–251245–12782094–443317–997602–1254
Table 2. Empirical relationships between discharge (Q, [m3 s−1]) and flux of total suspended matter (TSM) and sediment load (sed load) in various sampling stations.
Sampling StationEmpirical RelationshipRegression CoefficientSignificant Level
Station 10 Log[TSM] = 0.0318 + 1.0095Log[Q]r = 0.8770p < 0.0001
Log[sed load] = −1.0649 + 2.0233Log[Q]r = 0.9659p < 0.0001
Station 9Log[TSM] = 0.4995 + 0.8755Log[Q]r = 0.8386p < 0.0001
Log[sed load] = −0.6061 + 1.8878Log[Q]r = 0.9565p < 0.0001
Station 6Log[TSM] = 0.9652 + 0.8681Log[Q]r = 0.8559p < 0.0001
Log[sed load] = −0.062 + 1.851Log[Q]r = 0.9616p < 0.0001
Station 5Log[TSM] = 0.0668 + 1.2804Log[Q]r = 0.8375p < 0.0001
Log[sed load] = −1.0451 + 2.3036Log[Q]r = 0.9395p < 0.0001
Station 1Log[TSM] = 0.2526 + 1.2755Log[Q]r = 0.7120p < 0.0001
Log[sed load] = −0.8285 + 2.279Log[Q]r = 0.8712p < 0.0001
Station 7Log[TSM] = 1.0218 + 0.8263Log[Q]r = 0.7618p < 0.0001
Log[sed load] = −0.0494 + 1.830Log[Q]r = 0.9323p < 0.0001
Station 2Log[TSM] = 0.3765 + 1.150Log[Q]r = 0.8560p < 0.0001
Log[sed load] = −0.6656 + 2.142Log[Q]r = 0.9516p < 0.0001
Station 4Log[TSM] = 0.4279 + 1.035Log[Q]r = 0.7771p < 0.0001
Log[sed load] = −0.6981 + 2.0712log[Q]r = 0.9322p < 0.0001
Table 3. Comparison of physical and chemical weathering rates as well as carbon and nutrient yields between two time periods.
ParameterAug. 1999–July 2000
(a)
Jan.–Dec. 2002
(b)
a/b
Physical weathering rate (g m−2 year−1)3.6 × 1030.656 × 1035.5
Chemical weathering rate (g m−2 year−1)1.14 × 1030.416 × 1032.74
POC yield (g m−2 year−1)37.02.9212.6
PIC yield (g m−2 year−1)15.21.2711.9
DOC yield (g m−2 year−1)1.871.81.04
DIC yield (g m−2 year−1)91.547.71.92
PN yield (g m−2 year−1)0.700.471.49
DIN yield (mol m−2 year−1)0.590.134.54
DIP yield (mmol m−2 year−1)6.295.431.16
DSi yield (mol m−2 year−1)0.410.311.32
River discharge (mean)
(m3 s−1)
3891283.04

