Article

Predictive Methodology for the Quantification of Environmental Aspects in Urban Infrastructures

by
Adolpho Guido de Araújo
*,
Arnaldo Manoel Pereira Carneiro
and
Rachel Perez Palha
Department of Civil Engineering, Universidade Federal de Pernambuco (UFPE), Acadêmico Hélio Ramas, s/n, Cidade Unversitária, 50740-530 Recife, Brazil
*
Author to whom correspondence should be addressed.
Sustainability 2020, 12(18), 7636; https://doi.org/10.3390/su12187636
Submission received: 14 August 2020 / Revised: 8 September 2020 / Accepted: 14 September 2020 / Published: 16 September 2020

Abstract

:
The interest in sustainability in the construction industry arose in the 1990s, and current studies have created models to predict environmental aspects. Previous quantitative research to investigate environmental aspects was based on the perception of specialists. The present article proposes a methodology applicable to urban infrastructure activities in order to quantify environmental aspects by applying duration and severity criteria, using calculations founded in the scientific literature. The quantitative methodology to assess environmental aspects calculated ten aspects for six construction activities based on duration and severity criteria, eliminating the judgement of the latter criterion of earlier methodologies. The results revealed five significant environmental aspects: greenhouse gas emissions, energy use, noise pollution, water pollution, and soil pollution, due to the type of construction, which required a large amount of equipment that impacted the atmosphere, soil, and water. Possibly for the first time, urban projects can be objectively assessed based on a methodology that quantifies environmental aspects in the pre-construction phase.

1. Introduction

Urbanization is related to three dimensions of sustainable development: economic, social, and environmental [1]. However, the difficulties in conciliating the need for economic growth with sustainability are dilemmas faced by developing countries [2]. During urban development processes worldwide, natural resources were widely used [3] due to the growth of cities with an increased demand for housing, buildings, and renovations, causing environmental impacts [4]. However, a series of environmental protection measures (certification systems, assessment methodologies, and environmental management guidelines) were proposed over the years to mitigate the adverse impacts during construction activities [5]. The supply of nature-based ecosystem services administered by humans are essential to their survival and quality of life [6]. These services are defined as contributions of ecosystems for the well-being of humanity, and economic activities and their classification are measurement aspects classified in three categories: provision, regulation, and cultural [7]. The guidelines proposed are a component of regulation.
The interest in sustainability in the construction industry arose during the 1990s [8]. The first guideline, denominated British Standards Institution (BSI) 7750, was published in 1992, in England, and the United Nations Conference on Development and Environment was held in Brazil in the same year [9]. In February 1993, the European Union presented a sustainable development program enacted by regulation (CEE) no. 1836/93 [10]. Three years later, the International Organization for Standardization (ISO) 14,001 guideline was published, based on BSI 7750, which established the requirements for implementing environmental management systems in organizations [11]. A number of studies were then conducted after these guidelines were implemented [12,13,14].
The processes to objectively identify environmental aspects evolved to prediction models, such as that which assessed the aspects of construction activities using quantitative methods that applied criteria to quantify environmental aspects through the use of a matrix model [4,5,12,13,15,16,17,18,19]. Predictive methodologies provided strategies to help the construction industry incorporate management practices that control the environmental impacts on building sites [4]. Thus, construction project managers were able to reorganize and revise construction timetables to reduce pollution and disturbance [15].
Environmental criteria are defined as elements applied to measure environmental performance level [20]. They are used to attribute significance to environmental impacts [19]; however, they should be encompassing, able to be independently verified, reproducible, and accessible [10]. Environmental criteria were used in civil construction to develop the following assessment methods: scale, probability, severity, stakeholders’ concerns, duration, and amount [12]. Building construction in densely populated urban areas requires the implementation of environmental assessment methods. The criteria related to construction activities were probability, severity, stakeholders’ concerns, duration, and amount [12,13].
Gangolells et al. [5] proposed a predictive methodology to identify and assess the environmental aspects of buildings in Europe using a matrix model, which selected the environmental criteria probability, severity, and duration. Medineckienė et al. [21] proposed a method to investigate the impacts on the health of the population and used the criteria duration, cost, severity, and amount in the numerical model. Advances were observed in studies that included stakeholders’ concerns and the degree of worker safety risk as criteria [16,17]. In 2014, a sustainability assessment tool, based on residential building criteria in Iran, was proposed to assess the different construction phases [22].
An index containing fifteen environmental sub-criteria related to severity and amount was created to measure the sustainability of building projects [23]. In 2016, a novel compound index was applied to assess the sustainability of a building, classifying construction according to its sustainability performance [24]. The quantitative methodologies of environmental aspects proposed to date have used the severity criterion subjectively via the perception of specialists [4].
Most of the studies were conducted in Anglo-American-European countries, and over time, China established a strong presence in this field [8]. In China, for example, a method was developed to identify the best construction plan aimed at minimizing environmental pollution [15,25,26], and a model to select the best construction method was described [27]. A framework denominated BEQUEST (Building Environmental Quality Evaluation for Sustainability through Time) was also created to serve as a guide for sustainable urban development projects [28]. Measurement and assessment indicators were then established for sustainable urban infrastructure [29]. A pioneering methodology was created to identify and classify the sustainability indicators [30]. A method to prioritize sustainability criteria for the urban planning process considered stakeholders’ opinions [31]. In 2016, a model was developed to assess the effectiveness of ecological indicators based on three pillars: degree of connection, coverage, and representation [32]. In relation to megaprojects, researchers devised a system of social indicators [33], analyzed sustainable impacts [34,35], and created assessments for sustainable infrastructures [3,36]. However, a systematic review of the Web of Science database found only 2.54% of the articles on the quantitative methods of environmental assessments [11]. Previous predictive methodologies that assessed environmental aspects were developed based on the perception of specialists and/or the subjective indications of authors to calculate severity criterion using Likert scales [4,5,12,13,15] and multicriteria decision methods to classify, measure, and assess environmental questions in the construction industry [37,38,39,40,41]. Multicriteria approaches also helped define integrated actions [42,43].
Some of the methodologies that identified indicators related to urban planning and construction projects were developed [30]. However, there are few studies on environmental aspects in the construction planning phase [26]. With rising population growth, the search for construction projects has increased, particularly in developing countries, with repercussions on the environment [44]. The models contributed to the sustainability of construction projects [18]. The initial stages of the projects provided alternatives that influenced economic, social, and environmental decisions [45].
This article aimed at developing a quantitative methodology to assess environmental aspects in the pre-construction phase of urban infrastructure projects using the objective criteria of duration and severity, whereby six construction activities and ten environmental aspects were evaluated. The article is divided into five sections. Section 2 presents a detailed description of the methodological model; Section 3 shows the results and model validation; and Section 4 and Section 5 contain the discussion and conclusions, respectively.

2. Materials and Methods

The creation of matrices is a basic approach that has been adopted to calculate the impacts of environmental criteria [19]. These tools have been widely used due to the facility of transforming values into interval scale, thereby enabling matrix operations [12]. As such, the set of these matrices makes it possible to quantify environmental aspects and assess their significance [13]. Thus, the matrices enabled measuring the environmental impacts in each stage and/or construction activity [5], and its wide use can be explained by the ease of application by consultants and researchers [12]. In addition, representation in the form of a matrix facilitates identifying activities and environmental aspects [4]. Due to advantages that matrix calculations may provide to the analysis of the possible environmental impacts on construction projects, this approach was adopted to develop this methodology. Thus, a matrix model was developed with two environmental criteria—severity and duration—in order to analyze ten aspects involving six urban infrastructure construction activities. Formulas validated in the scientific literature to establish the values of some environmental aspects of the severity criterion and days of activity at the building site were applied to define duration values.
The methodological framework consisted of four phases: prior analysis, identification and assessment of environmental aspects, and a numerical example based on a real case. The construction activities and environmental aspects were previously established. To identify the environmental aspects, the generating sources (construction activities) were analyzed in terms of their services. With a view to assessing the environmental aspects using the matrix model, the severity and duration criteria were calculated for the ten aspects and six construction activities, respectively, and converted into a five-point scale to enable the matrix operation. The fourth phase involved a numerical example based on a real case in order to apply the predictive methodology suggested in this study (Figure 1).

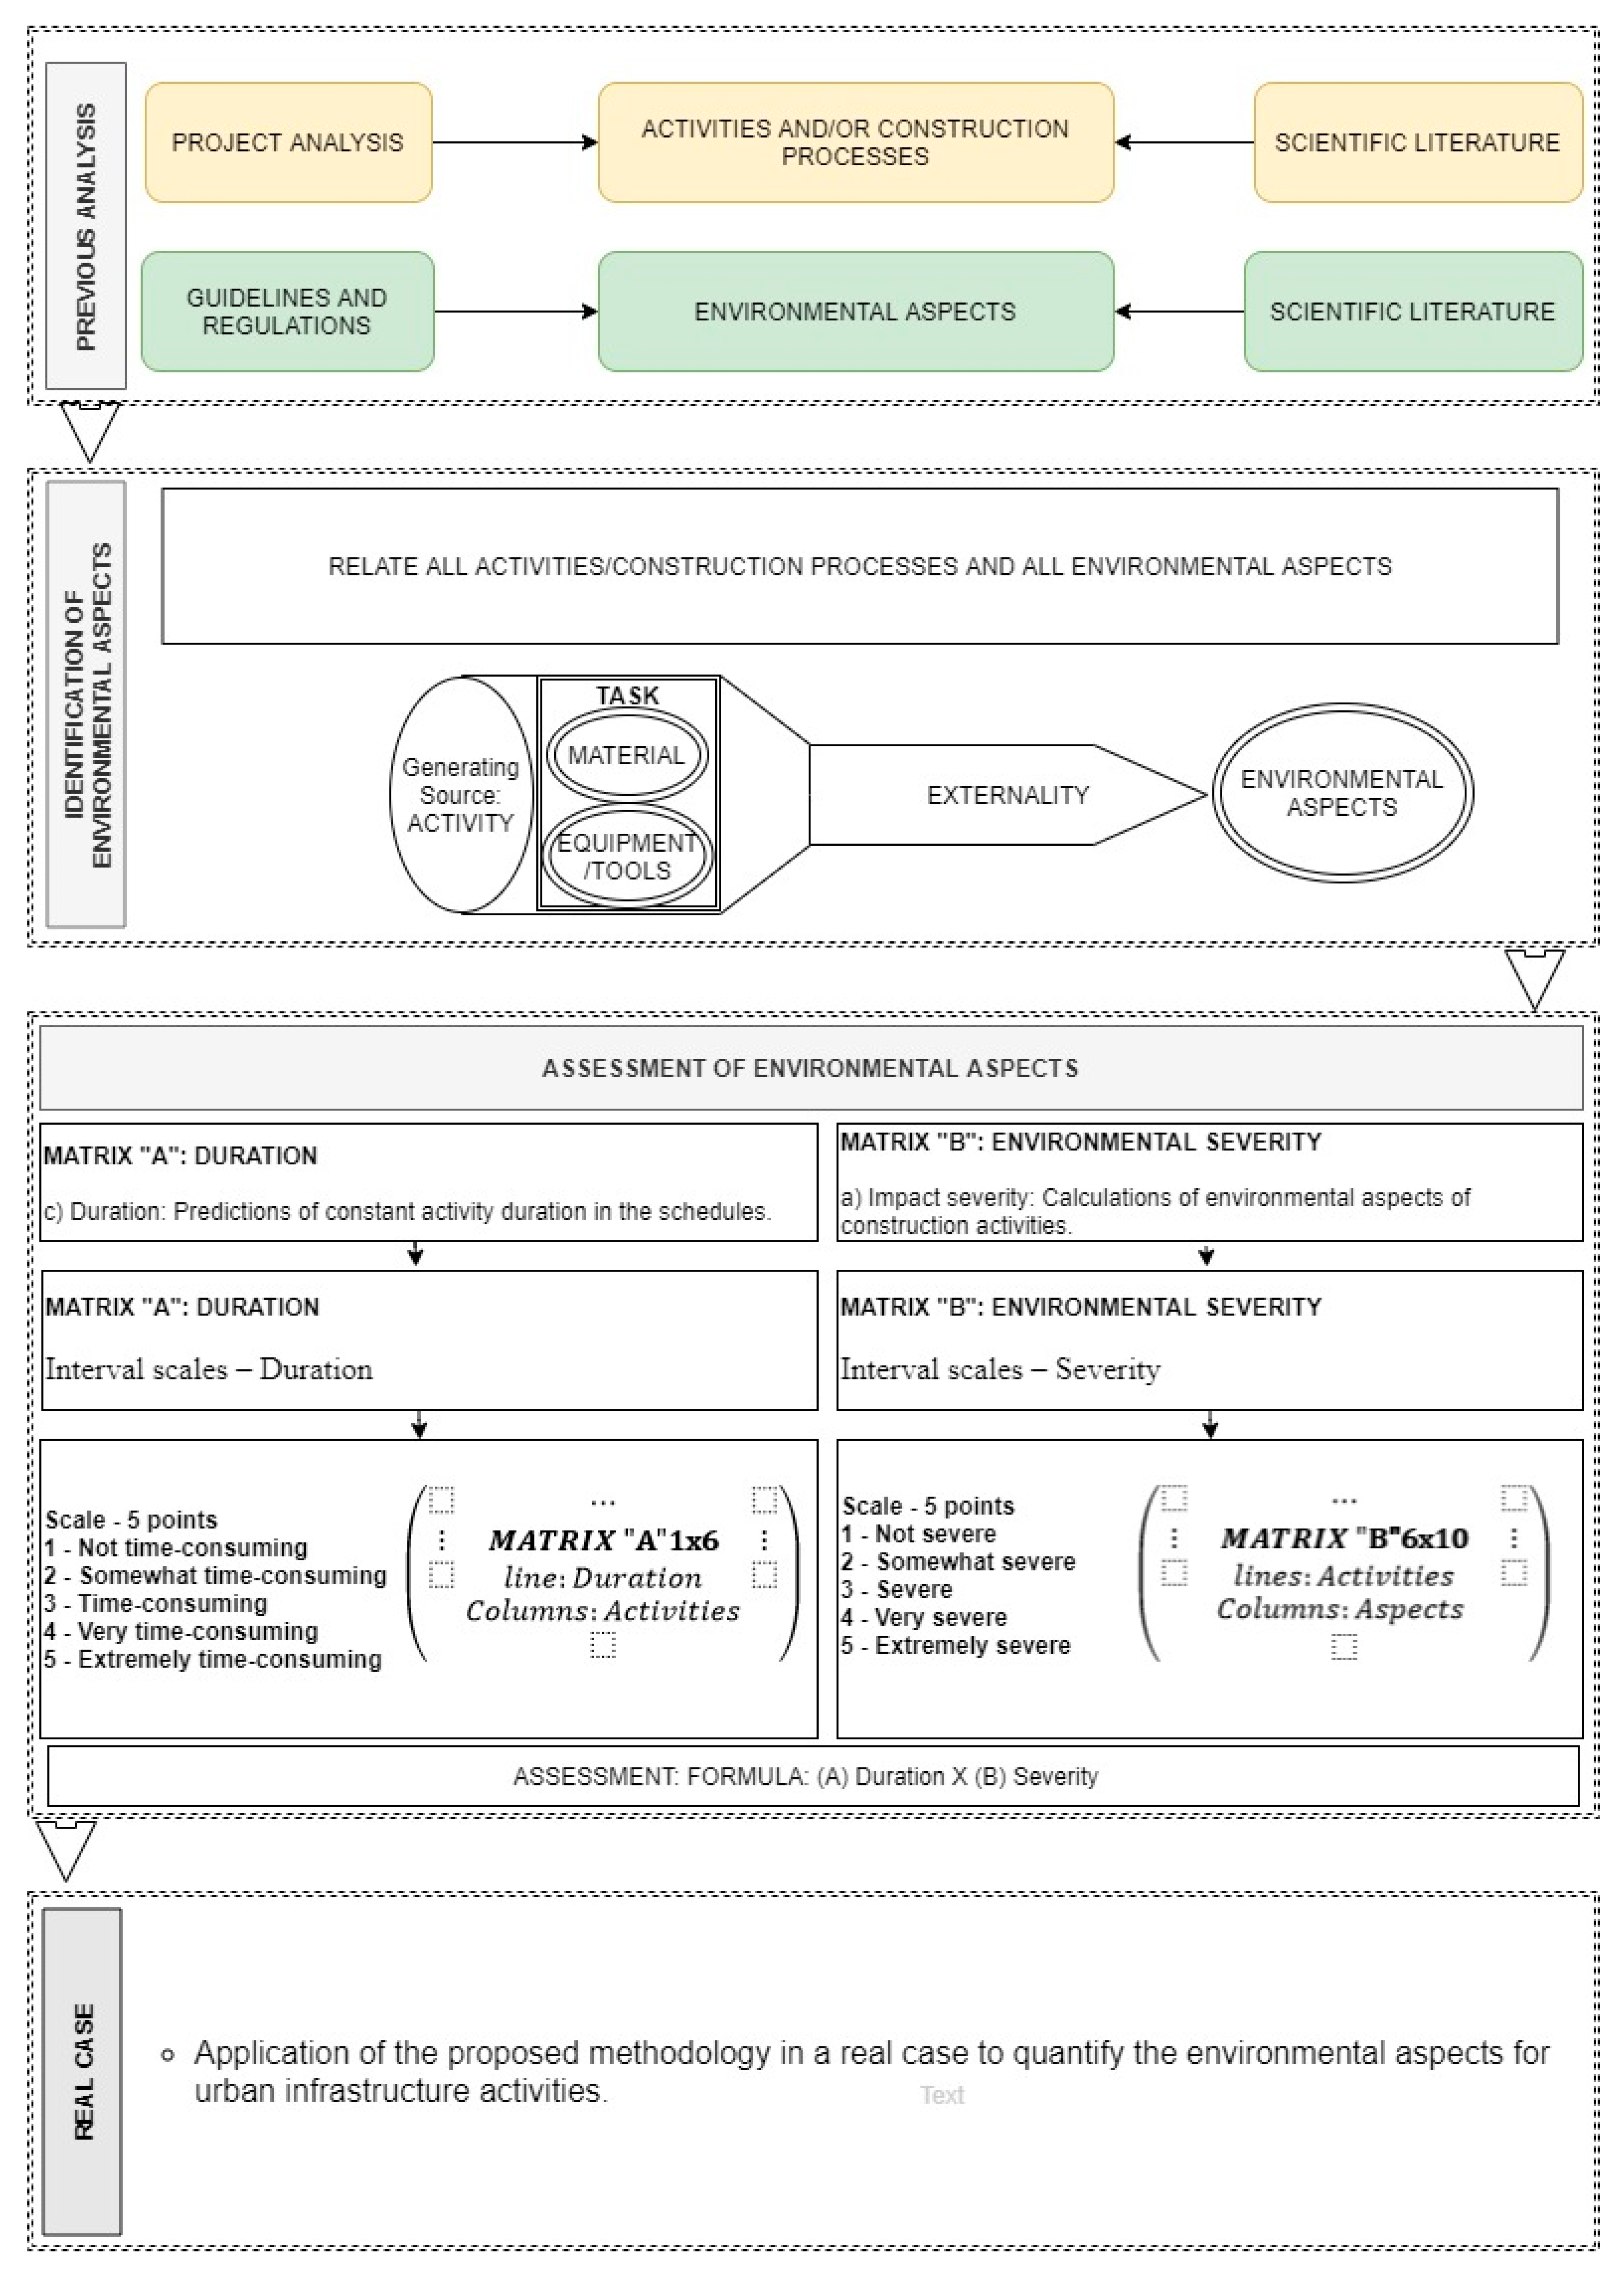
2.1. Previous Analysis

The articles on construction management and sustainability were investigated to identify which activities and/or construction processes and environmental aspects were previously considered, along with their current relationships to this proposal.

2.1.1. Activities and/or Construction Processes

The activities and/or construction processes were assessed and selected based on the scientific literature and a real case. A Work Breakdown Structure (WBS) was created based on the results of the previous phase and the activities and/or construction processes of the WBS: topographic, site clearing, earthworks, rainwater drainage system, water supply system, sewage system, electrical energy system, paving, curbing, landscaping, and construction squares.
In order to create this methodology, the most accurate levels of decomposition were adopted, as well as standardized activities of the urban development sector. In addition, the real case was a mandatory element in the selection of activities and/or construction processes to apply in the proposal, and six of the eleven stages identified in the real case contained relevant information and were selected for this methodology.

2.1.2. Environmental Aspects

The following environmental aspects were selected based on the categories identified in the literature review by Araújo et al. [11]: I1—Air emissions, I2—Water discharges, I3—Land discharges, I4—Resource and raw material use, I5—Waste, I6—Energy use, I7—Noise emissions, I8—Energy emissions, I9—Effects of biodiversity, I10—Local/Community environmental impacts, I11—Hazardous emissions, I12—Accidents/Incidents, I13—Archeological impacts.
A Relative Importance Index (RII) was created for the environmental aspects obtained for each first-degree environmental aspect using the ratio between In° and I n ° = 1 13 I n ° , where In° is the first-degree environmental aspect and I n ° = 1 13 I n ° is the sum of the thirteen aspects. The authors of the study selected the first seven, which are considered the most widely studied in the construction industry: I1—Air emissions, I2—Water discharges, I3—Land discharges, I4—Resource and raw material use, I5—Waste, I6—Energy use, I7—Noise emissions (Table 1).
The studies used to create the RII exhibited decompositions in nine of the thirteen environmental aspects, totaling twenty-eight second-degree environmental aspects, where, following the same pattern, a 2nd degree RII was attributed, as follows: I1-1—Air pollution, I1-2—Greenhouse gas emissions (GGE), I1-3—Total suspended particles (TPS), I1-4—Odor, I1-5—Volative organic compound emissions, I2-1—Water pollution (WP), I2-2—Water use (WU), I3-1—Soil alteration (SA), I3-2—Soil pollution (SOILP), I4-1—Resource and raw material use (RRMU), I4-2—Use of resources as energy, I4-3—Durable materials, I5-1—Construction and demolition waste (CDW), I5-2—Solid waste, I6-1—Energy use (EU), I6-2—Renewable energy uses, I7-1—Noise pollution (NP), I8-1—Vibration, I8-2—Heat, I8-3—Radiation, I9-1—Effects of biodiversity, I10-1—Transport, I10-2—Community, I10-3—Environmental impacts on neighboring areas, I11-1—Harzardous emissions, I12-1—Accidents/Incidents, I12-2—Fire, I13-1—Archeological impacts (Table 2).
To select the ten environmental aspects, the authors used those with the greatest proportions that were quantifiable and could occur in the real case used. The environmental aspect I1-1 (air pollution) was excluded for being generic. The ten aspects selected were: I1-2—Greenhouse gas emissions (GGE), I1-3—Total suspended particles (TPS); I2-1—Water pollution (WP), I2-2—Water use (WU), I3-1—Soil alteration (SA), I3-2—Soil pollution (SOILP), I4-1—Resource and raw material use (RRMU), I5-1—Construction and demolition waste (CDW), I6-1—Energy use (EU), and I7-1—Noise pollution (NP) (Table 2).

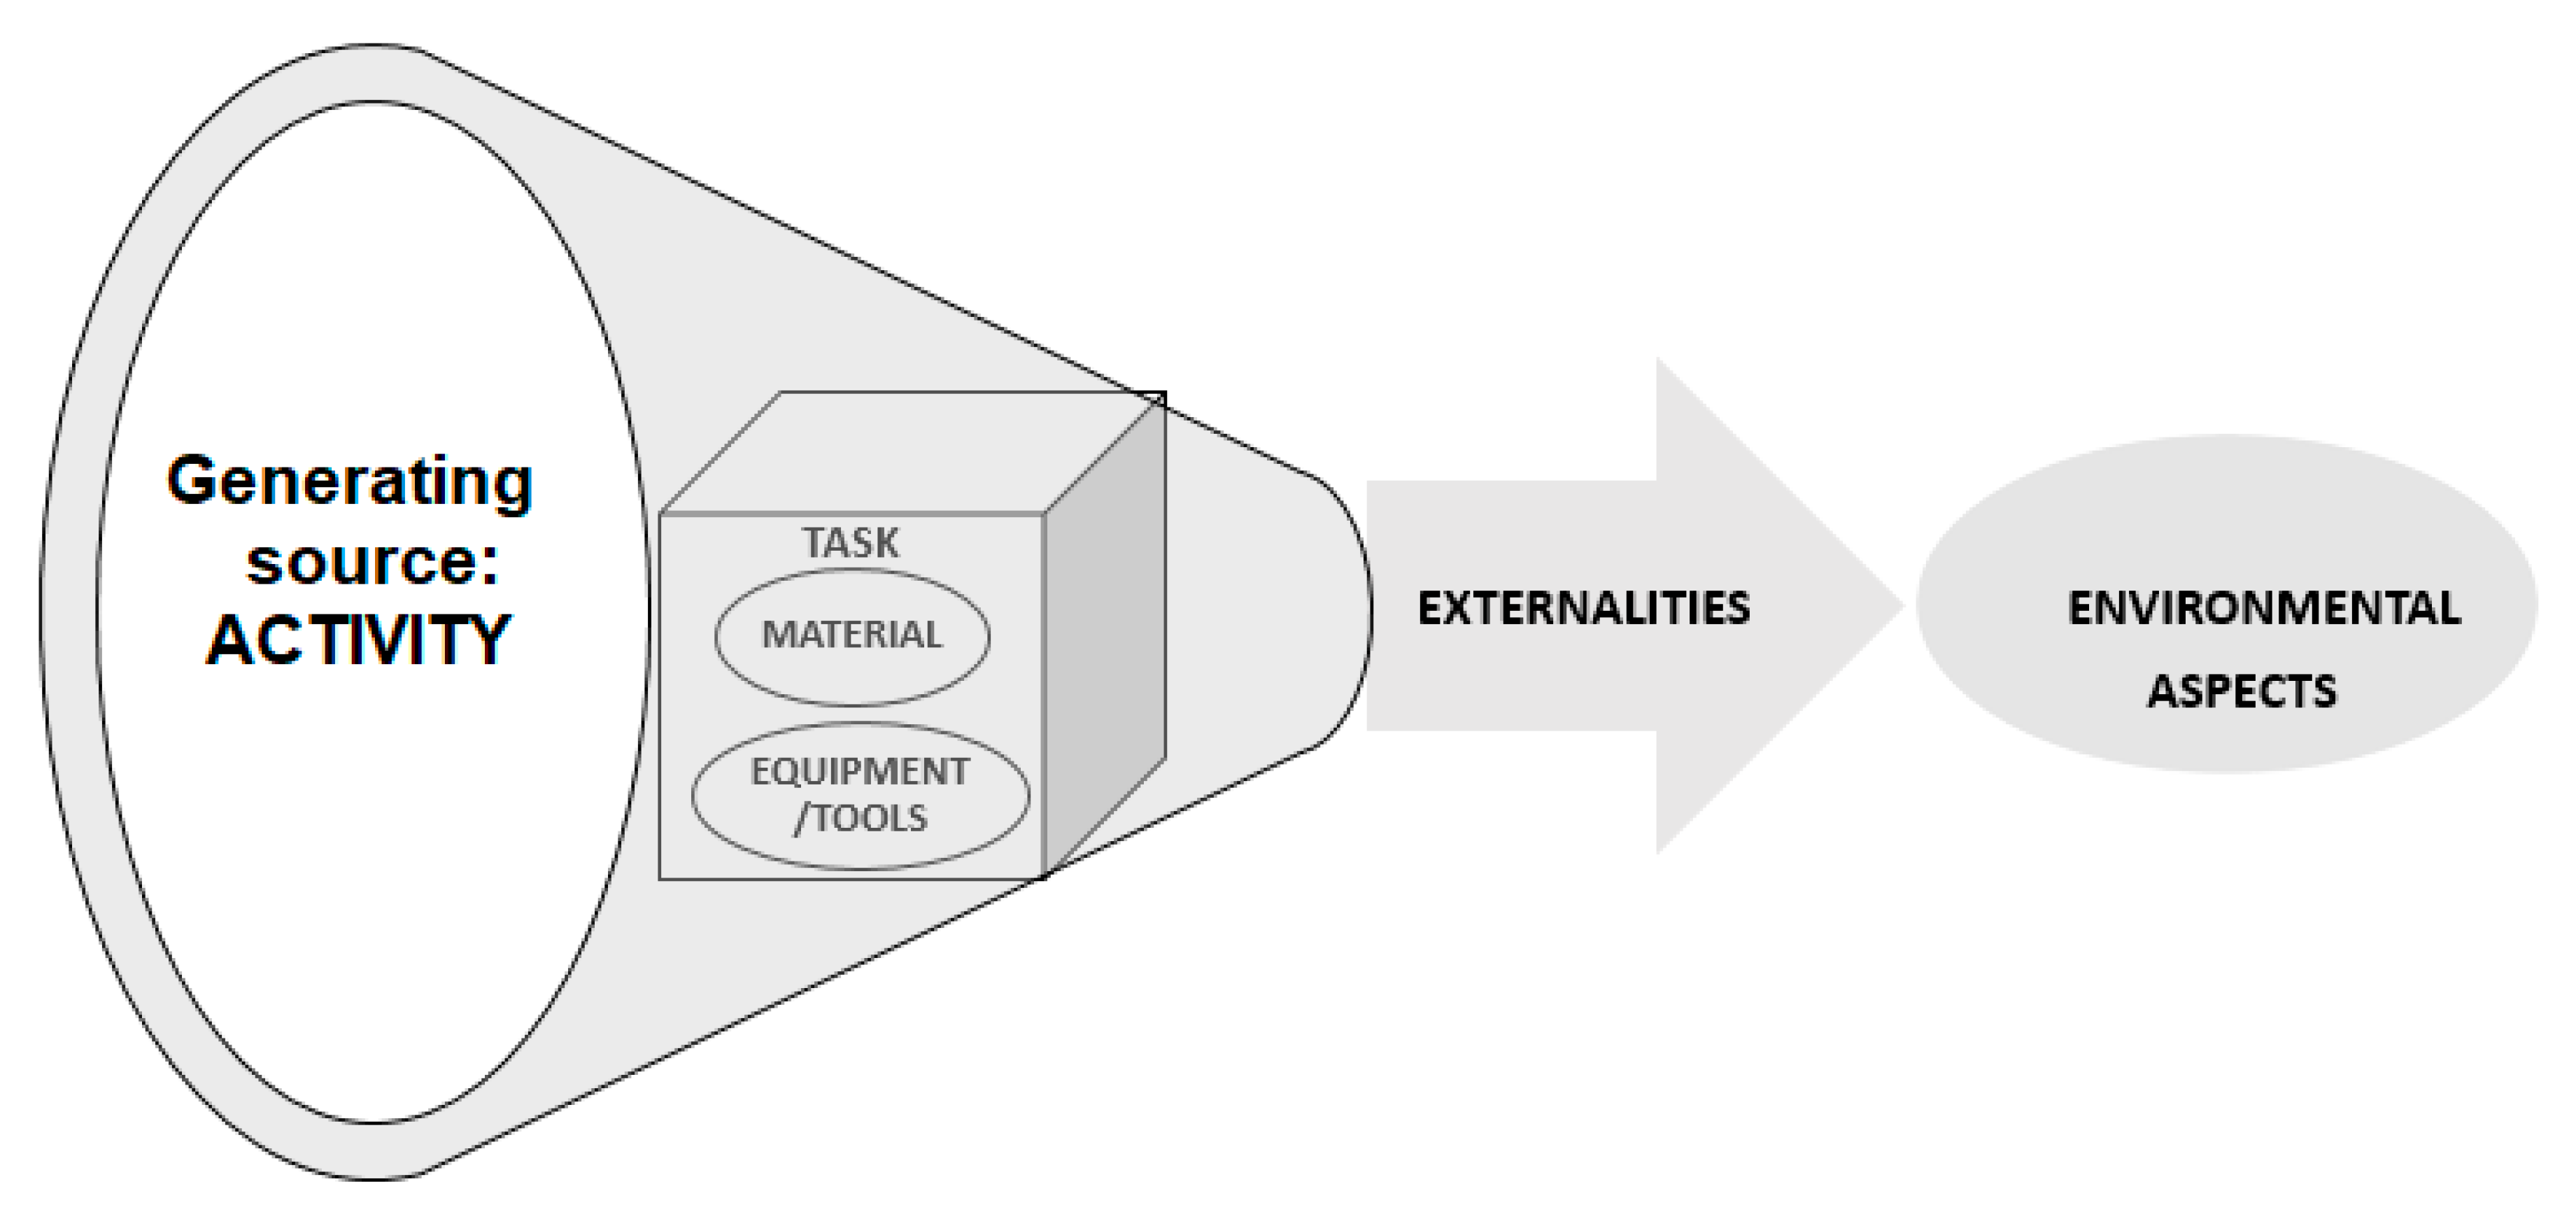
2.2. Identification of Environmental Aspects

The environmental aspects were determined, as shown in Figure 2. The generating source was identified (construction activity) by the project documents previously established in the WBS where the activities and/or construction processes of the prior analysis stage, and associated with the materials and equipment/tools used (elements of the budget and the company’s operational procedures) in order to determine the causes, develop tasks that describe the “methods” and “labor” employed (company’s operational procedures) and demonstrate the manner of execution. The information obtained was used to initiate the critical externality recognition phase, where the possible generations, emissions, and discharges to the environment were observed, taking into account all the previous flow. Finally, the environmental aspects originating in the externalities were recorded for each activity.
Reports were prepared for each activity, consisting of a description, the task, unit of measurement, and composition (material, labor, and equipment/tools), based on the composition and operational procedures recorded in the company’s quality system, externalities caused, and indication of environmental aspects.

2.3. Assessment of Significant Environmental Aspects

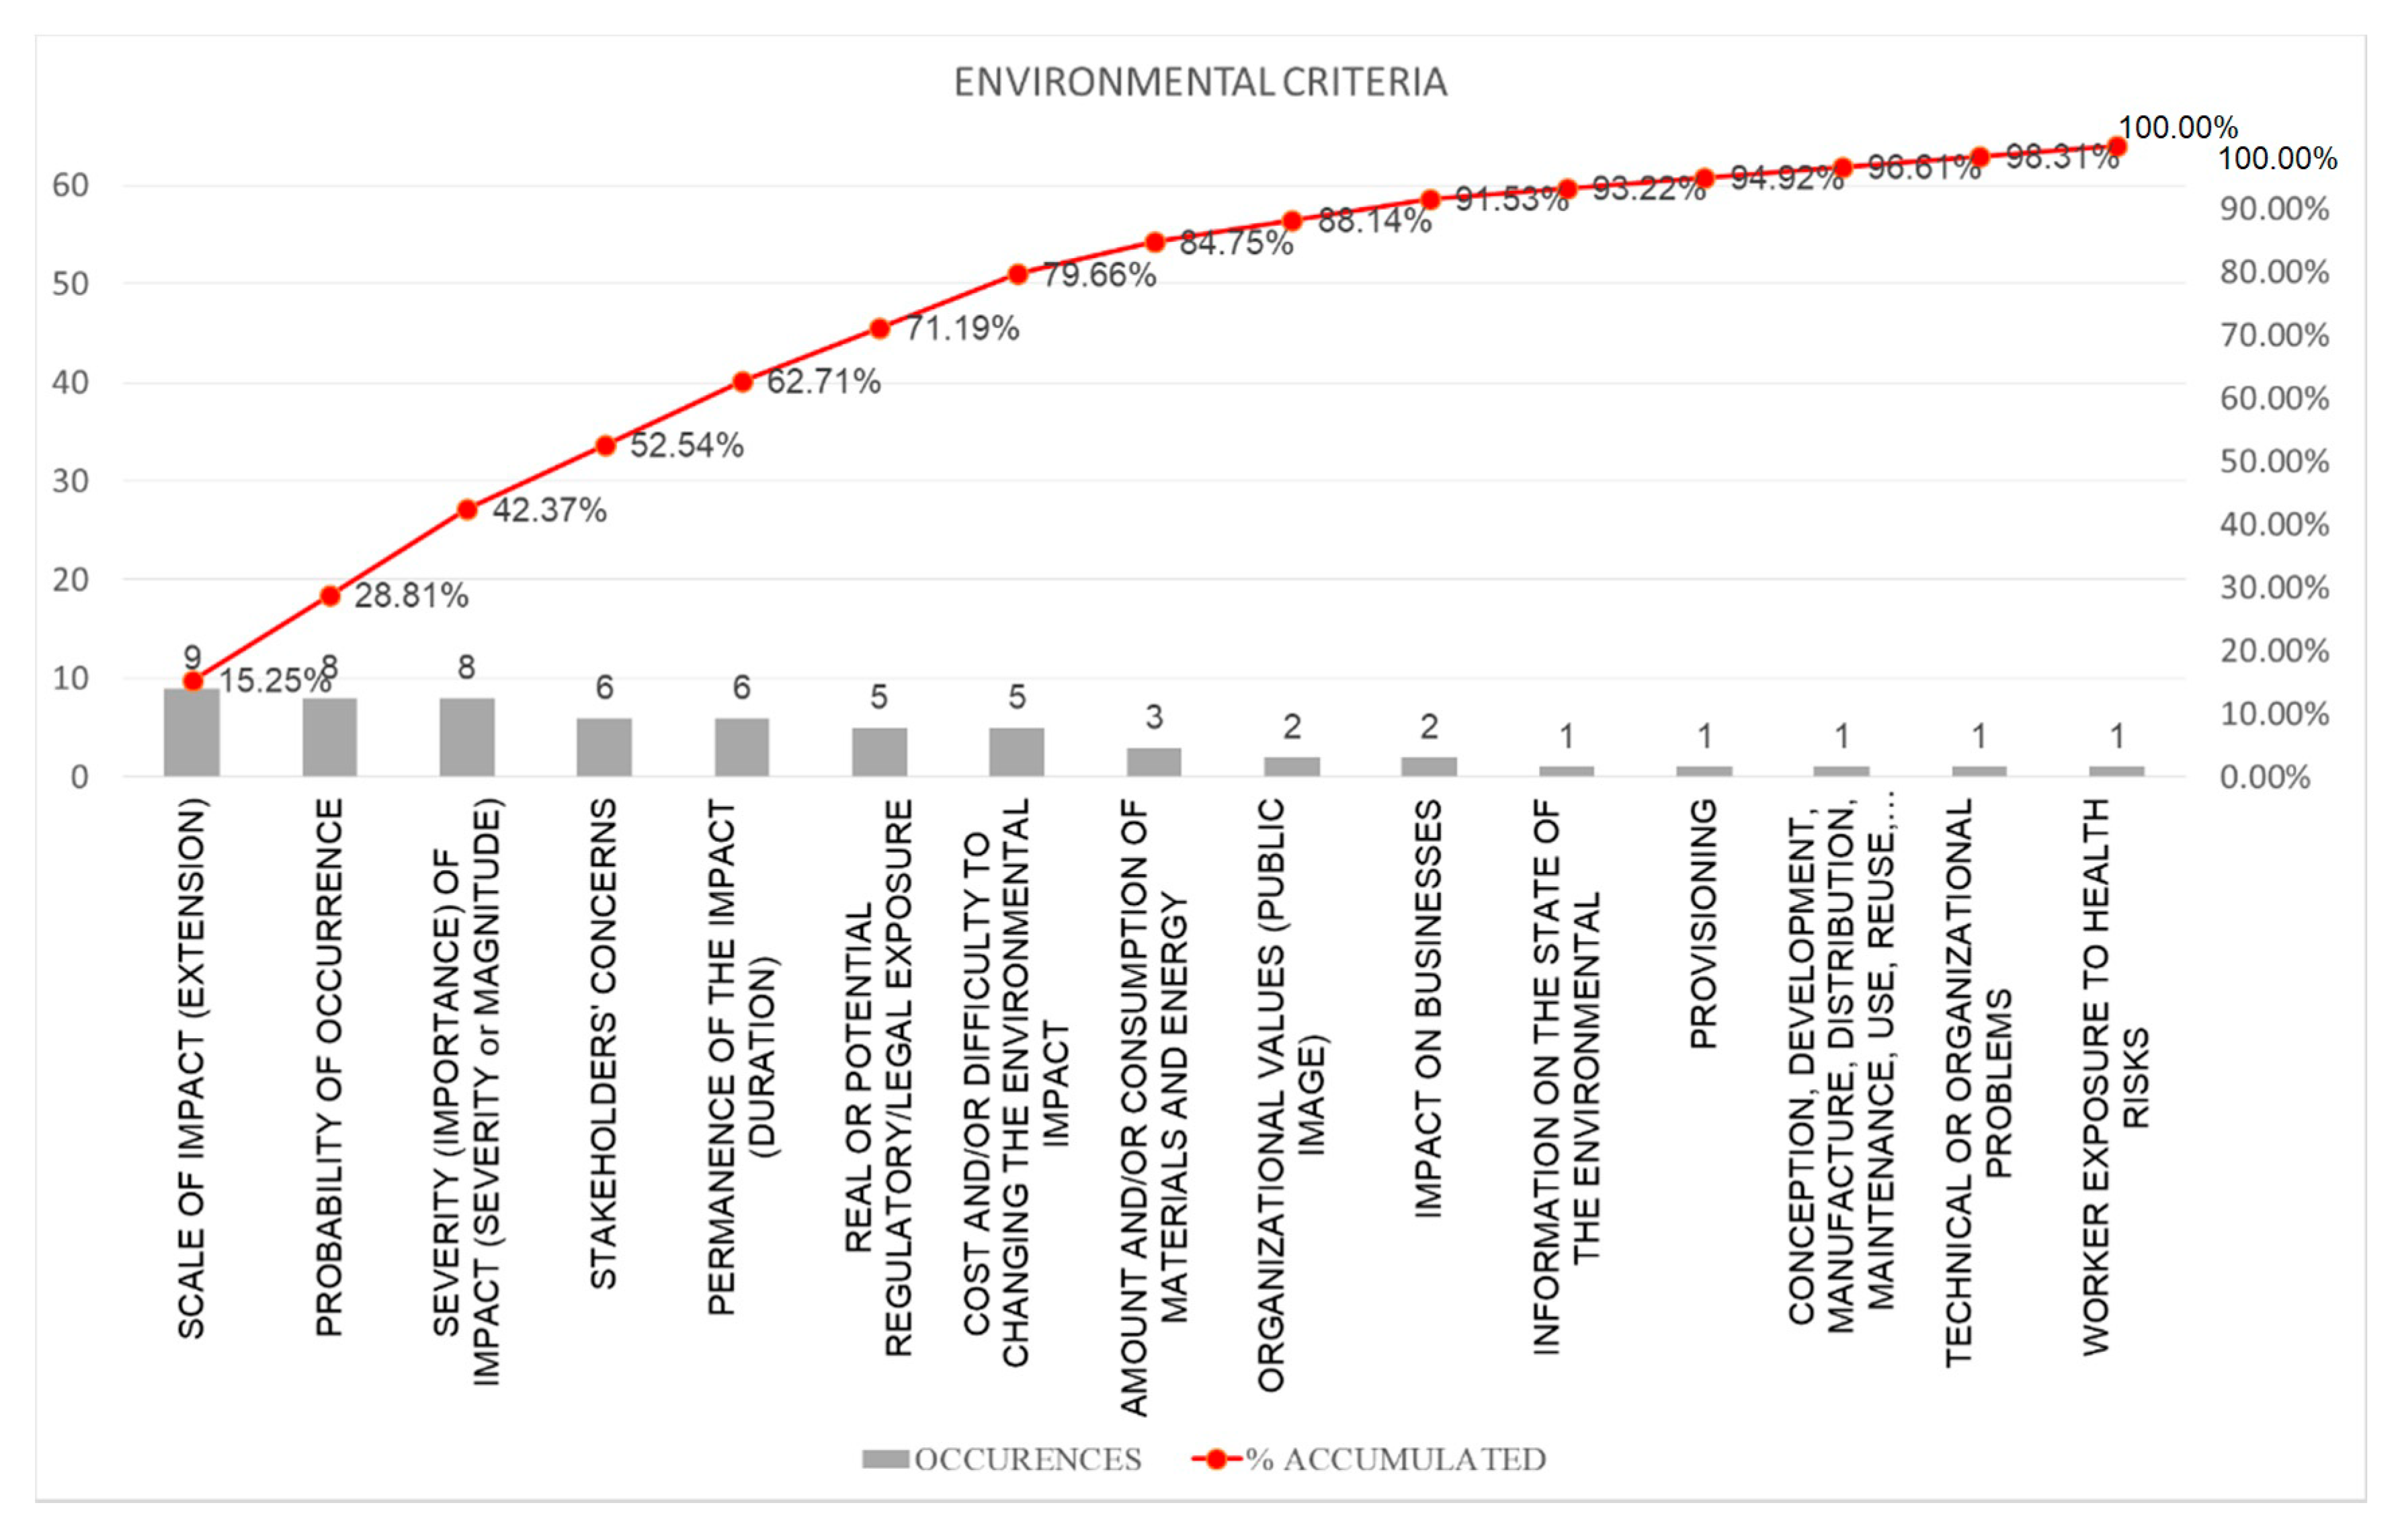
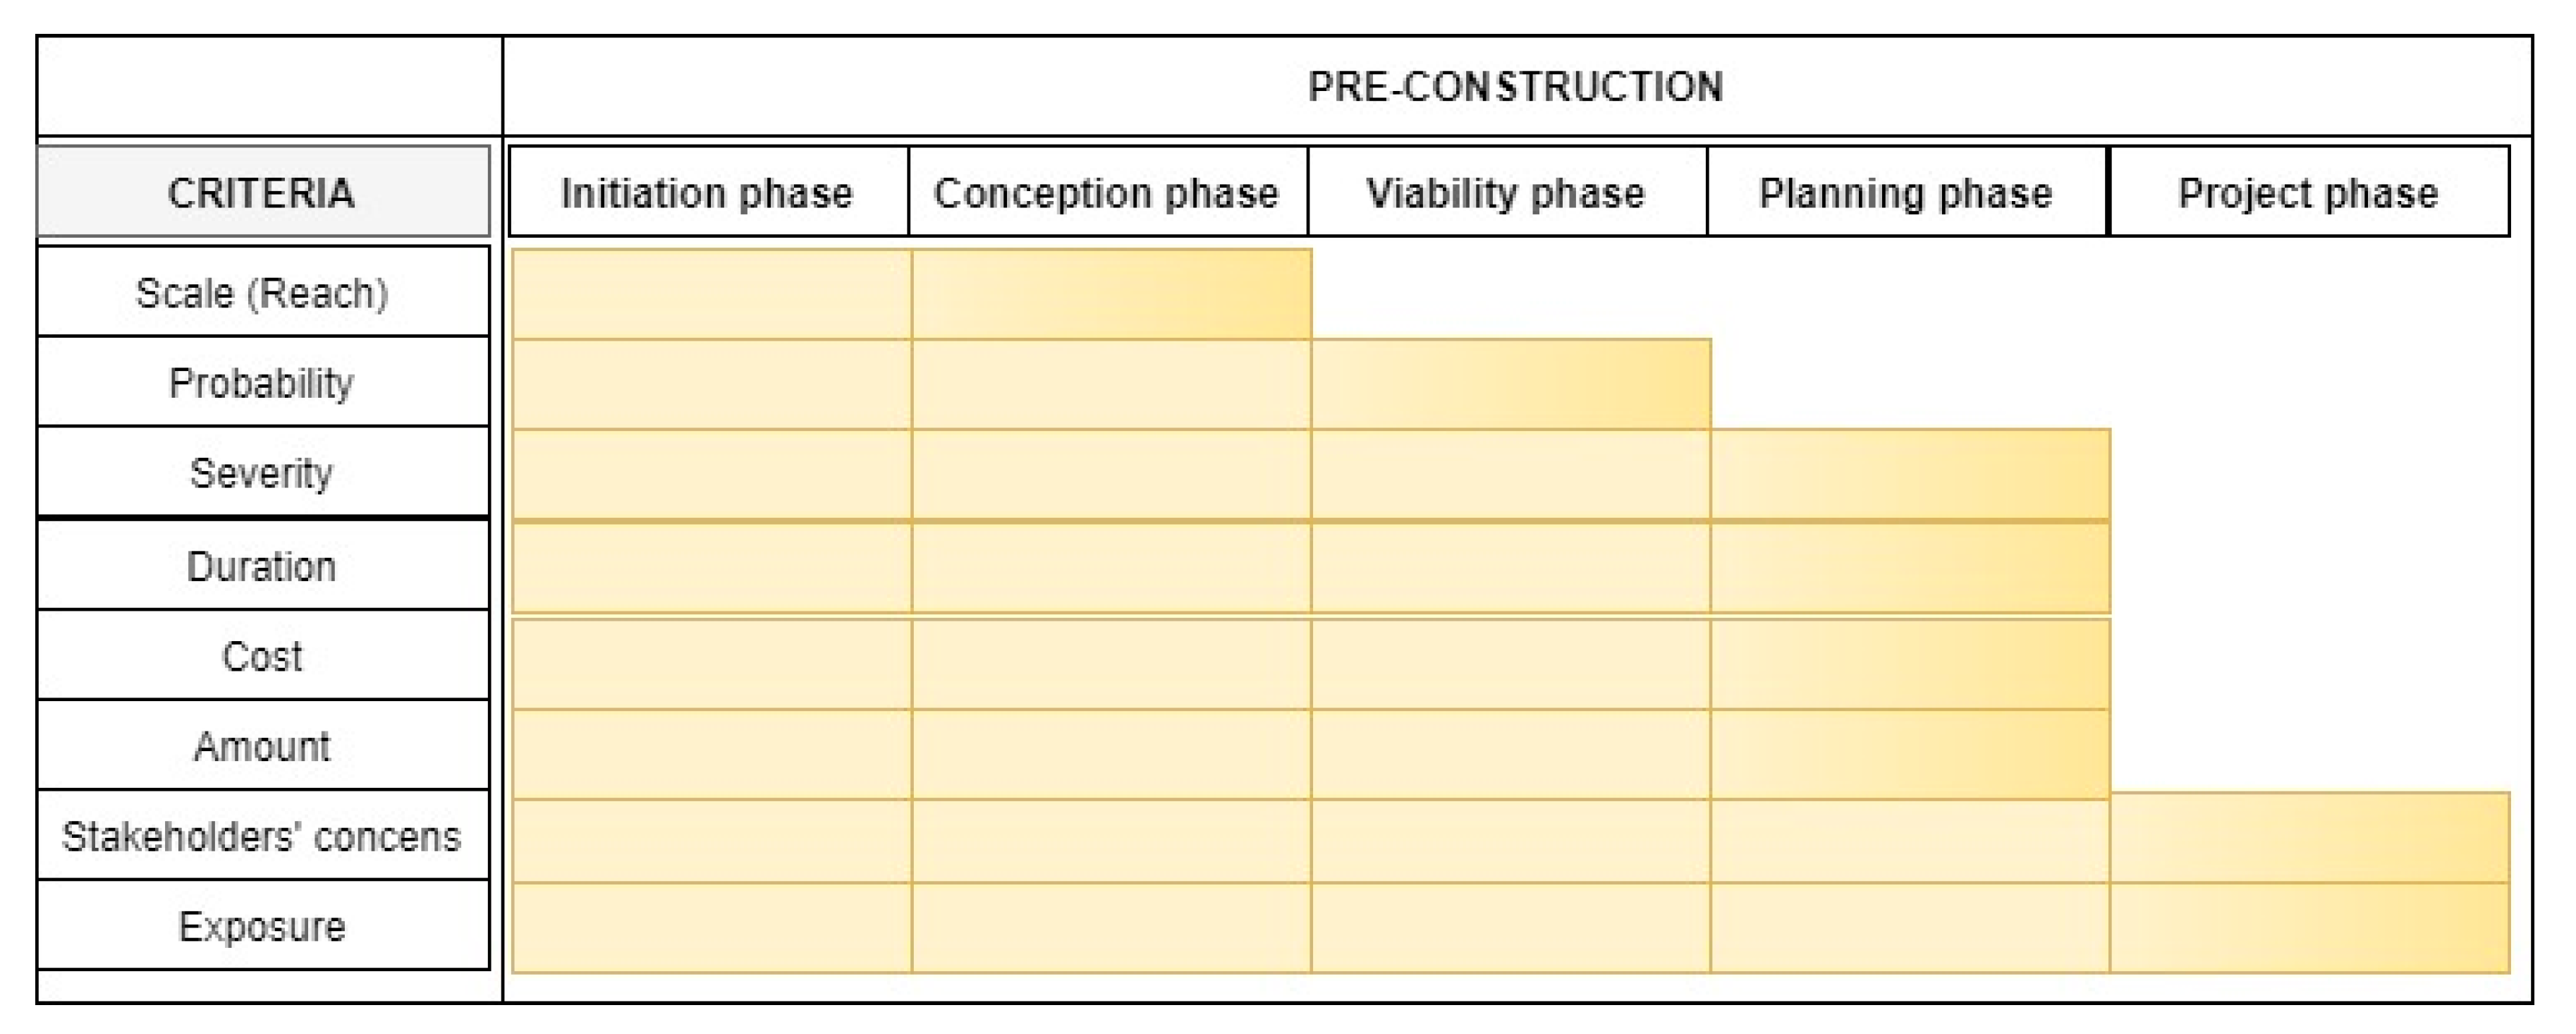
2.3.1. Environmental Criteria

The environmental criteria are based on the models that quantify environmental aspects. Significance was a relative concept and not defined in absolute terms; its assessment involved applying technical and judgement analysis [46]. A total of seventy environmental criteria were found in the literature, but repetitions were detected, and synonyms used due to the lack of consensual nomenclature. After being compiled, they were reduced to the following fifteen: scale, probability, severity, stakeholders’ concerns, duration, exposure, cost, amount, value of the organization, impact, state of the environment, provisioning, conception, technical problems, and risk exposure.
A Pareto chart was used to determine the environmental criteria most used in the studies [30]. The fifteen criteria were examined in order to obtain assertions applicable to the proposed methodology. Tool application indicated eight tools, two of which (severity and duration) were adopted for the following reasons: capacity to objectively quantify and easy identification in pre-construction documents. In decreasing order of frequency of the aforementioned methodologies (Figure 3), the criteria severity and duration were the first two of the fifteen criteria that exhibited purely objective data. The choice to use only severity and duration was based on the objective ability to collect data from project documents, without the need to obtain subjective information from specialists.
The life cycle of construction projects were divided into four stages: pre-construction, construction, use/maintenance, and demolition [25,38,47,48]. Each stage was subdivided into phases by different authors who studied life cycle assessment [47]. The pre-construction phase can be subdivided into the following: initiation, defining the scope, identifying resources, developing the budget, creating a timeline, and identifying risks [49], phases considered extremely important for the development of environmental impact prediction methodologies.
Assessments of civil infrastructures in the planning phase have become crucial for sustainability [36]. However, few studies have been conducted on the integration of environmental management aspects, primarily in the construction planning phase [26]. Many decisions are made in the planning phase, such as the selection of construction technologies, equipment and materials, establishment of tasks, construction site layouts, resource estimates, cost forecasts, project timelines, and identification of interactions [26].
Severity and duration are environmental criteria containing information from the initiation phase to the pre-construction planning phase. This information is more accurate in the planning phase, where the timetable and budget exhibit more reliable data (Figure 4).

2.3.2. Calculation of Environmental Criteria

The level of the environmental impact of the project was calculated by multiplying matrices “A” and “B”, where the results of environmental criteria converted into a five-point scale made it possible to execute the matrix operation. The scale was determined by the frequency range, calculated by the highest minus the lowest score, and divided by five. Interval “1” was the lowest value, and the others were the sums of the previous scores from the frequency range determined. Interval “5” was the highest values of the upper limit of Interval “4”, according to Equation (1).
FI = HIV LOV 5 ;   FI   starting   from   the   lowest   value
where:
  • FI: Interval;
  • HIV: Highest value;
  • LOV: Lowest value.
A formula was developed to calculate the environmental aspects of the project using two quantifiable environmental criteria: duration and severity, which were applied in the real urban building site of the present study. “Duration” was calculated using accurate information contained in the timetable document; “Severity” was determined based on the amounts described in the projects, budgets, and planning documents. The timetable information described in the duration of activities and budgetary, planning, and project data was used as input data, and matrix operations determined the total quantification of the environmental aspects for the real case used, as shown in the matrix Equation (2).
( M A T R I X   A 1 × 6 L i n e : D u r a t i o n C o l u m n s : A c t i v i t i e s ) ( M A T R I X   B 6 × 10 L i n e s : A c t i v i t i e s C o l u m n s : A s p e c t s   ) = [ M A T R I X   C 1 × 10   L i n e s : A c t i v i t i e s C o l u m n s : A s p e c t s ]
where:
  • MATRIX “A”: Activity duration matrix versus the predicted timetable;
  • MATRIX “B”: Severity matrix, where all the predicted environmental aspects were calculated for construction activities, considering their amounts;
  • MATRIX “C”: Total quantification of environmental aspects—shows the total score of each of the environmental aspects, considering all the construction activities in the project in question.

2.3.3. Calculating the Duration of Construction Activity

The values were obtained from the timetable in working days for six construction activities. This extended duration impacted the natural environment and/or people; for example, the use of equipment for prolonged periods increased noise pollution (NP), greenhouse gas emissions (GHG), and total suspended particles (TSPs).

2.3.4. Severity of Environmental Aspects

All six construction activities obtained severity results related to the ten environmental aspects. Some construction activities did not promote environmental aspects and/or their externalities were insignificant and were therefore considered zero. For example, the installation of precast posts for the “waste generation” environmental aspect was considered zero, as was the installation of PVC pipes in the water supply system for the “water consumption” environmental aspect.
The amount of TSPs were calculated using the methodology presented by Jung et al. [50], where fuel emissions, equipment traveling on unpaved roads, and earth loading and unloading were totaled (in grams). Emission factors were determined for the three types of emission, as suggested by the Environmental Protection Agency [51].
The fuel consumption rate of the equipment was calculated in grams (Equation (3)):
Emission rate = TSP emission factor (g/L) × consumption (L)
Rate of equipment traveling on unpaved roads, in grams and other equipment (unpaved) emission rates): (Equations (4) and (5))
Emission rate (dump truck; unpaved) = Emission fator (9.4241 g/vehicles) × km traveled
Emission rate (other equipment; unpaved) = Emission factor (0.000712 g/kg) × loads in kg
Rate of earth loading and unloading, in grams (Equation (6)):
Emission factor (0.000318 g/kg) × load in kg
Thus, the amounts of GHG were measured using the methodology suggested by Yim et al. [52], based on EPA (Environmental Protection Agency) equations [53]. First, emissions associated with construction materials were calculated and then material transport emissions, according to Equations (7) and (8), respectively:
GHG ( materials ) = i = 0 n Q i   ×   F i m
where:
  • GHG (materials): The total GHG from materials (concrete; steel, and wood) in kgCO2e;
  • Qi: The amount of construction material (in m³);
  • Fi: The GHG emission factor for construction material (in kgCO2e/m³).
GHG   ( transport ) = n = 1 ( ( Q i   ×   E l   ×   D i   ×   F e ) 5 )
where:
  • GHG (transport): The total GHG emissions from fuel combustion during transport of the main construction materials (in kgCO2e);
  • Qi: Amount of construction material “i” transported by land (in m³) assuming that the maximum load per truck is 5 m³;
  • El: Diesel consumption (in L/km per truck is 0.325 L/km);
  • Di: Total distance of construction materials “i” transported by land (in km);
  • Fe: Transport emission factors of diesel-powered trucks, which is 2.62 kgCO2e/L.
To obtain noise pollution (NP) values in decibels, the results reported by Haron et al. [54] were used as well as a number of indications of sound pressure levels of equipment obtained by Lee et al. [55], according to Equations (9) and (10):
Lp =   Lw 20 log 10 r   8 +   Δ L
where:
  • Lp: sound pressure level in the receiver;
  • Lw: sound pressure level in the source;
  • r: distance from the source to the receiver;
  • ΔL: Variation in average sound pressure level.
La   equ = 10   log 10 ( 10 L p 1 10 + 10 L p 2 10 + + 10 L p n 10 )  
where:
  • La equ: combined noise pollution of the equipment;
  • Lp: sound pressure level in the receiver calculated in Equation (9).
Soil alteration (SA) caused by the urban project were calculated by the authors of the present study, who proposed a simple equation. A number of descriptive studies helped to understand the phenomenon and develop the index, such as those by Li et al. [56], Qu and Long [57], and Wu et al. [58]. This index was denominated soil alteration index (SAI), according to Equation (11):
SAI = ( Pa Ta ) 100
where:
  • SOIL ALTERATION INDEX (SAI): relative quantification of the modification of natural soil by the project;
  • PRESERVED AREA (Pa): total preserved area in m2 (green) of the project;
  • TOTAL AREA (Ta): total area of the project.
Soil pollution (SOILP) was determined using an index developed by the authors. Adapted from Eikelboom et al. [59], 0.01% was established as the maximum soil pollution (MSP), as described in Equation (12):
MSP = ( 0.01 % Total   amount   of   material ) / Ta
where:
  • Amount of material: amount of material used in mg.
  • TOTAL AREA (Ta): total area of the Project in m2.
Water pollution (WP) was based on the theories of Belayutham et al. [60] and expressed in an index suggested by the authors, denominated water pollution index (WPI), according to Equation (13):
WPI = [ ( Vsa Ta ) LR ] 100
where:
  • WATER POLLUTION INDEX (WPI): Relative value of the vulnerability of project management decisions, considering the meteorological characteristics;
  • Vegetation suppression area (Vsa): some managers totally expose the area, resulting in total vegetation suppression;
  • Total area (Ta): Total area of the project in m2;
  • Local rainfall (LR): amount of rain predicted for the moment the activity is performed. For quantification, the authors used a scale between 0 and 1, relating the historical average rainfall in the region.
The calculations to measure RRMU were based on Thomas et al. [61], whereby the weighted impact coefficient of construction materials was multiplied by the amount of material, resulting in the total impact of the activity. The amount of waste produced during the construction process was excluded.
CDW was calculated based on Li et al. [62], who identified the amount of material, transformed it into a single measurement unit (in metric tons), and used the waste percentage to predict the amount of waste generated by the project. In the present study, the percentage of PVC pipe waste was extracted from an article by Mersiowsky [63]. Due to the absence of granite waste, the authors calculated the loss index according to Equation (14):
LI   ( % ) = ( ARM ATM ATM ) 100
where:
  • LI(%): loss index in percentage;
  • ARM: Amount of real material;
  • ATM: Amount of theoretical material.
Water use (WU) was restricted to water consumed in the production of materials and construction processes. According to Equation (15), water intensity information was obtained from Souza et al. [64] and the equation was adapted from Treloar [65]:
AMOUNT   OF   WATER = i = 1 ( Im   ( Kl / m 3 ) Amt   of   material   ( m 3 )
where:
  • AMOUNT OF WATER: total amount of water in the activity;
  • Im: water intensity of the material and/or construction process;
  • Amt of material: amount of material used.
Finally, energy use (EU) was calculated. The embedded energy of the activity is the sum of embedded energy needed to produce the material and that used in transport and/or the construction process. Based on Paulsen and Sposto [66] and the embedded energy information of Teodoro [67], the authors calculated the embedded energy of activities represented by Equations (16) and (17), respectively:
EEmaterial = k = 0 n EEFi Amtmt
where:
  • EEmaterial: embedded energy of the material;
  • EEFi: Embedded energy factor of the material in MJ/kg;
  • Amtmt: amount of material consumed in kg.
EEtm = k = 0 n Ami Di EC   mt
where:
  • Ami: amount of each material consumed in weight;
  • Di: distance traveled between the manufacturing facility and the building site.
  • EC mt: specific energy consumption during the cargo transport mode used in each leg.
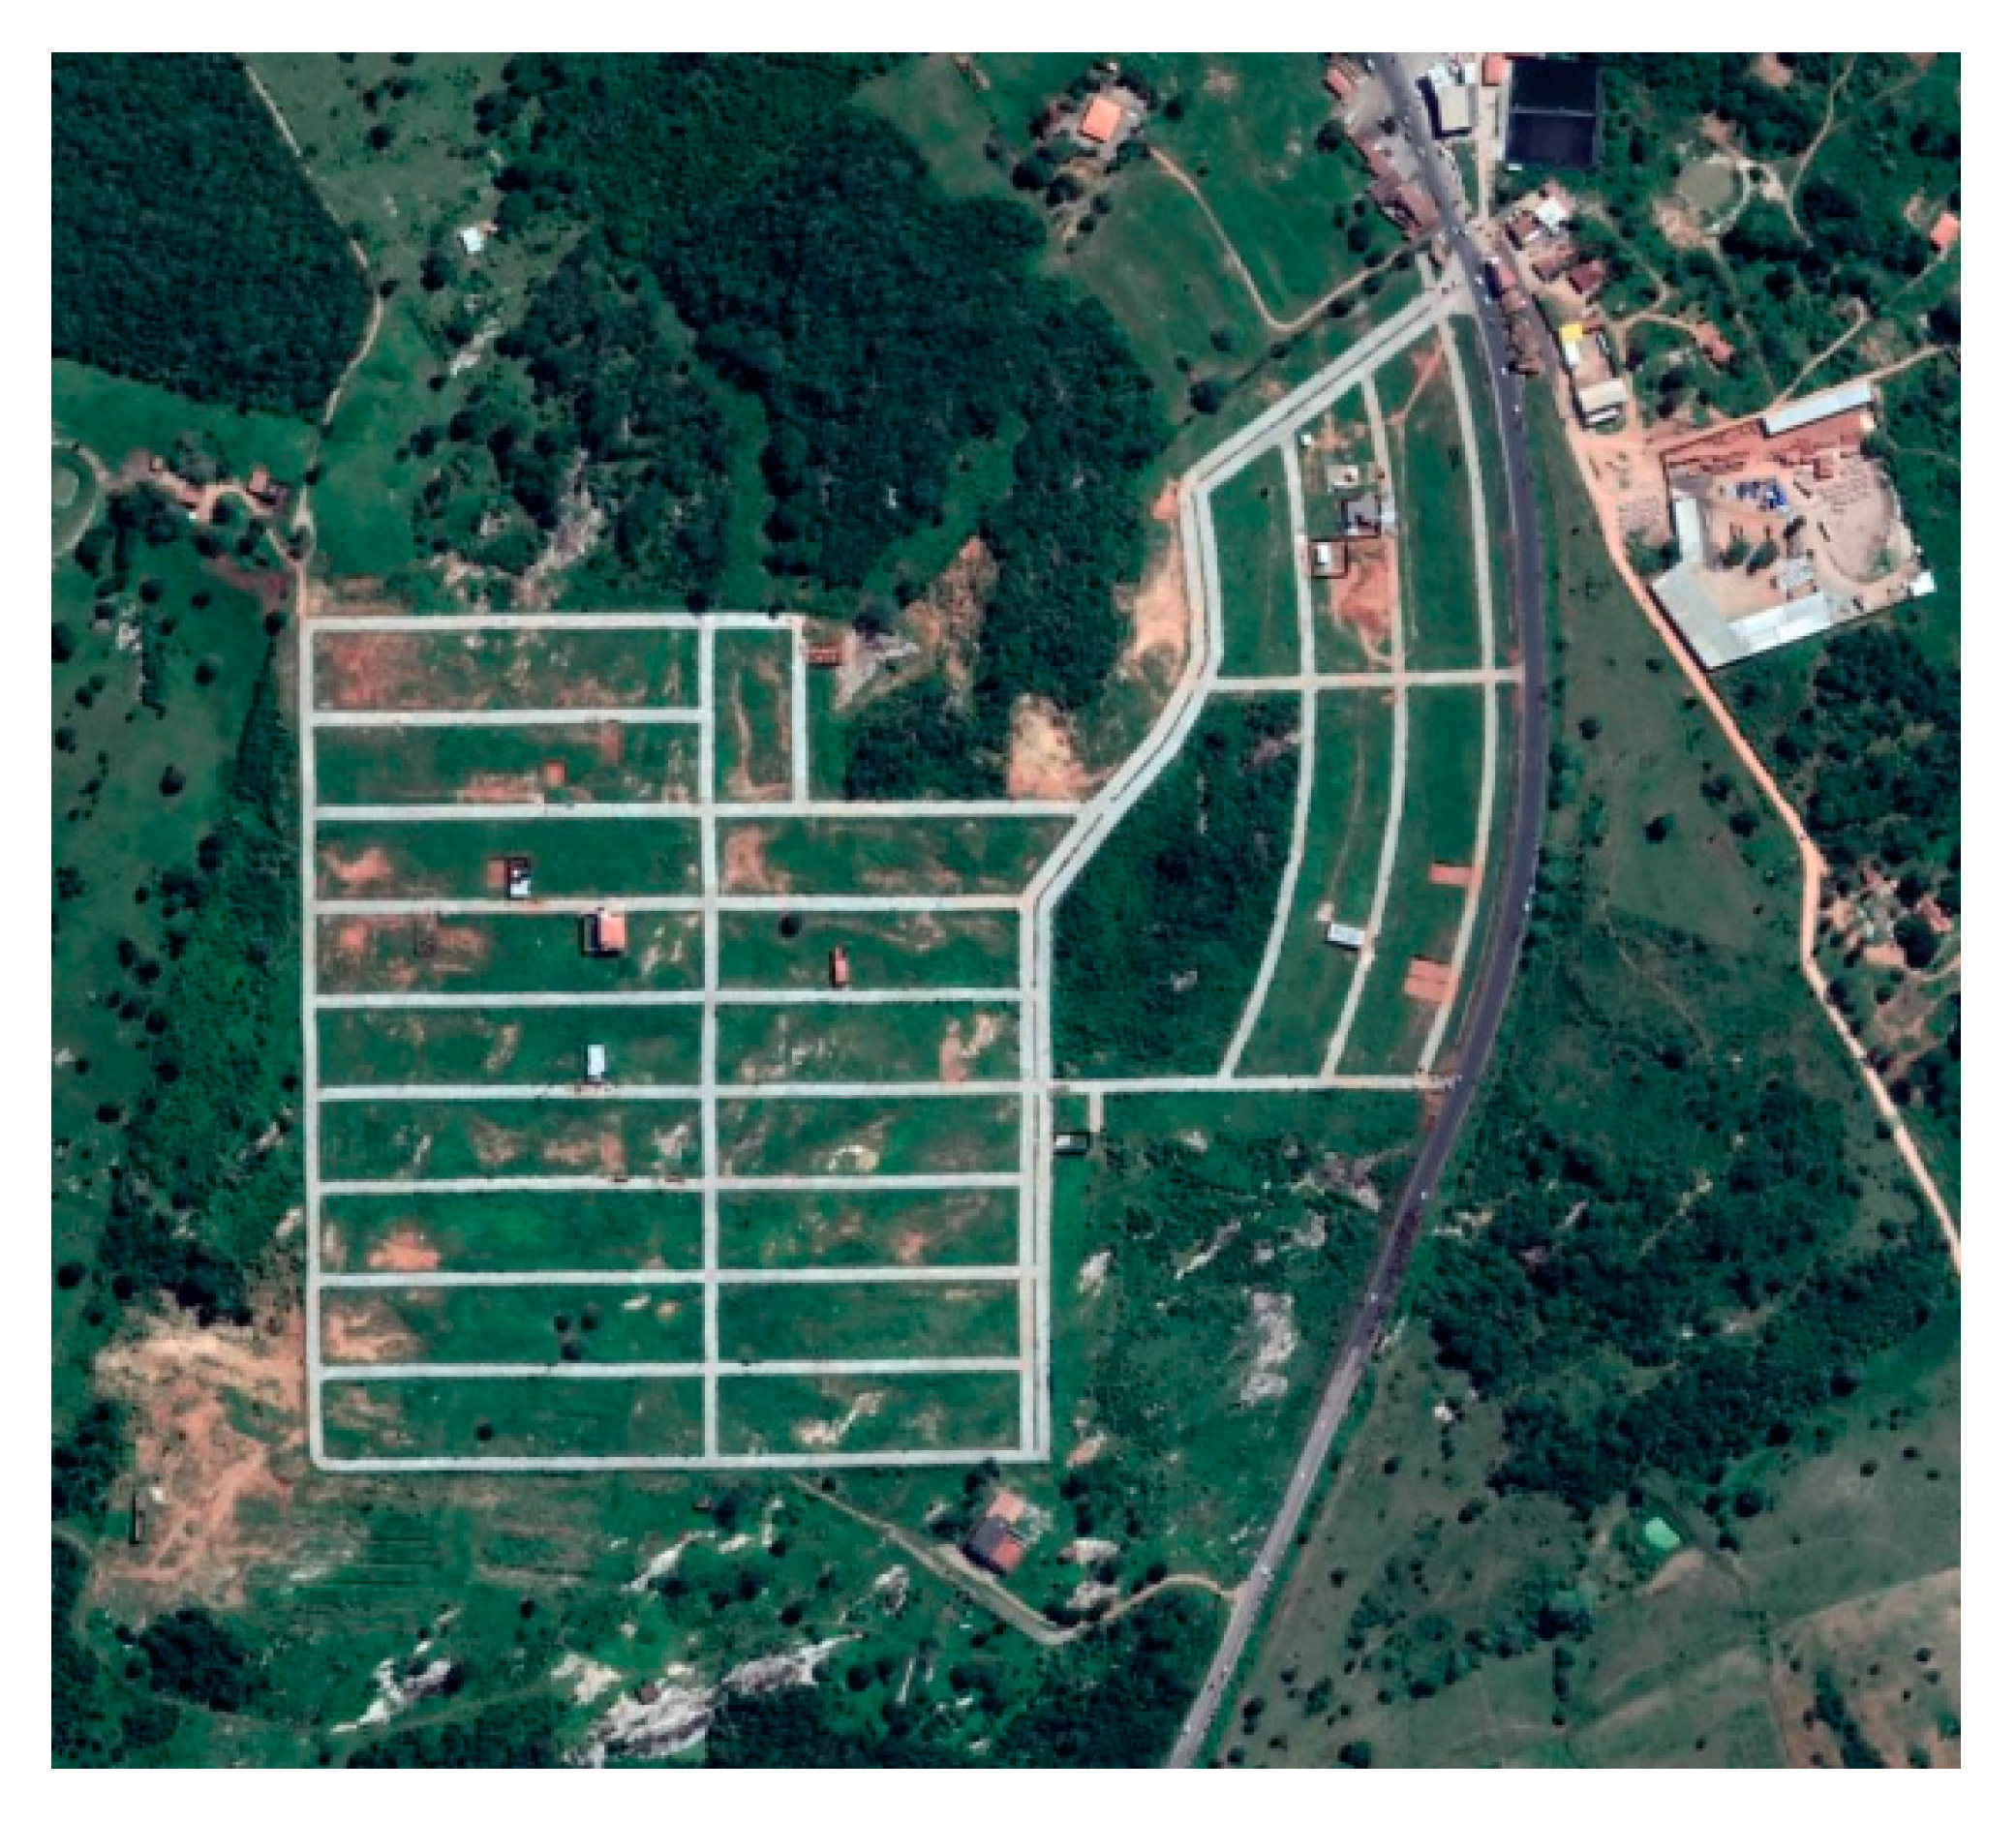
The ten environmental studies were calculated for the same planning, dimensioning, and management conditions. The calculations are presented in Table 3 and Table 4, and the calculation report of severity was developed according to the methodology used in this study.

2.4. Real Case

An urban development project, located in Northeastern Brazil, in the city of Santana do Ipanema, Alagoas state at coordinates 9°23′12″ S and 37°14′33″ W, was used as a real case.
It covers an area of 300,000 m2 divided into 147,236.64 m2 blocks and subdivided into 22 blocks with 847 lots. It contains 71,945.34 m2 of green area set aside to preserve the native vegetation and 27,000 m2 to install community equipment. In addition, 53,818.02 m2 was reserved for the road network of the project, where all the infrastructures were constructed. These consisted of earthworks, a rainwater draining system, water supply system, electrical energy system, paving, and curbing.
The project was conceived by the construction company. However, basic complementary projects were undertaken by outsourced businesses without compatibility between earthworks, the rainwater drainage system, electrical energy system, and paving, all with little information and few details.
The budget was drawn up by the company’s project team using quantity and price estimates from similar projects. The timetable used followed the company’s cash flow and was developed in conjunction with the financial sector and the engineering team.
The project is located in a peripheral region (Figure 5), in a natural environment that has been little anthropized. The urban project was launched on the real estate market in April 2014, and basic sanitation was the responsibility of future residents in the form of septic tanks, due to the lack of a local sewage treatment plant.

3. Results

3.1. Duration of Construction Activities

The construction activity duration criterion was incorporated into the calculations because of the importance of the extent of disturbance and/or exposure of environmental aspects to the natural environment and to people. In this case, prolonged duration made the natural environment and/or people vulnerable. For example, the use of equipment for extended periods increased noise emissions, GHG, and TSP. Thus, the activity duration factors were obtained based on the duration of activities and the total duration of the project reported in the company’s schedule: earthworks (150 days), rainwater drainage system (120 days), drinking water supply system (210 days), electrical energy system (150 days), paving (600 days), and curbing (600 days).
The results demonstrate that the most time-consuming activities were paving and curbing, followed by the installation of the water supply system, earthworks, and the electrical energy system. The rainwater drainage system took the least time to install. This information indicates the period of disturbance and harm to human life and the environment.
To construct Matrix A, the scale was determined using the frequency range, calculated by the longest duration (600 days) minus the shortest (120 days), divided by five, resulting in 96 days. Intervals were the sum of the previous score added to the frequency range determined. The following interval scales were established: Interval“1”, less than 120 days; Interval “2”, between 120 and 216 days; Interval “3”, between 216 and 312 days; Interval “4”, between 312 and 408 days, and Interval “5”, more than 408 days.

3.2. Severity of Environmental Aspects

The real case results for the severity criterion reveal the most significant environmental aspects of the activities involved in the project. The information obtained helped project stakeholders visualize the possible environmental aspects and their amounts.
The results demonstrate coherence and synergy between the important environmental aspects. Obvious correlations can be observed from the production network of the construction industry, as follows: the use of equipment produced externalities such as air emissions, the activities performed and construction processes discharged waste into the soil and water, and the extractions/applications of construction materials generated significant losses closely related to the waste produced and raw materials used.
Table 3 and Table 4 shows the quantification results of the environmental aspects of the real case. Thus, project managers can obtain predictive information on the environmental aspects during the planning phase. These results demonstrate the impacts of construction activities and provide important information to eliminate, mitigate, or accept the environmental aspects.
The first environmental aspect calculated was TSP, where the results showed 3,438,466.01 g distributed into six construction activities. Earthworks accounted for 89.93% of the total (3,092,263.15 g), where the main emissions included the fuel and road emission rates of 1,423,580.28 and 1,504,294.27 g, respectively.
The possible negative effects were demonstrated by the GHG results, which indicated a significant emission in transport, with 279,157.83 kgCO2e, totally explained by the typification of the activity. The results of the other activities show that the highest emissions were produced in the manufacture of construction materials, such as the rainwater drainage system (384,395.35 kgCO2e), with emissions related to the material (382,347.78 kgCO2e) and transport (2047.57 kgCO2e), and curbing (372,501.98 kgCO2e), with emissions for the material (370,517.76 kgCO2e) and transport (1,984.22 kgCO2e).
For NP, the results were normal, with earthworks causing the most disturbance, reaching 70.86 dB, measured from the source (equipment) to the receiver (nearest neighbor), a distance of 50.07 m.
The result of SA was 23.98%, which is “fair”, and demonstrates opportunities to improve the project. For SOILP, the results underscore two activities (the rainwater drainage system and curbing, with 718.03 and 695.81 mg/m2, respectively), because of the type of activity and contaminating power of precast concrete. Water pollution reveals the significant possibility of environmental damage in two activities, namely, earthworks (3.59%) and paving (3.59%), both with the same results in construction methods and intervention areas in identical plots of land.
The RRMU environmental aspect obtained a result of 5.642 × 10⁻⁷. Construction activities such as paving, the rainfall drainage system, and curbing absorbed significant amounts of materials and, therefore, exerted a high degree of impact. The paving result demonstrated the influence of material consumption, with 20,445,381.12 kg of granite, where even with the second lowest environmental impact coefficient (268,542 × 10−14) obtained the highest total environmental impact (5.491 × 10⁻⁷). CDW exhibited significant numbers at a total of 70,554.59 metric tons, with earthworks accounting for 98.76% of the total waste generated (69,677.15 metric tons of soil).
With respect to WU, the total amount consumed in the project was 1,032,624.73 L, where a significant portion was related to water used in construction materials, with the highest consumption observed in paving (632,684.42 L), concentrated in extraction processes (detonation and crushing) that use water jets to eliminate soil waste and impurities (605,775.41 L). EU showed total energy consumption of 11,685,537.71 MJ, distributed into two main categories: energy used in material manufacture (8,113,352.22 Mj) and embedded energy in transport (3,572,185.49 MJ).
The scales used in Matrix B were determined by the frequency ranges for each environmental aspect, calculated by the highest minus the lowest score, divided by five. Interval “1” represented the lowest score, while the other intervals were the sum of the previous score added to the frequency range determined (Table 5).

3.3. Matrix Calculation for the Environmental Impact Level of the Project

The scores between 1 and 5 on the matrices obtained from the individual environmental criterion values acquired from duration and severity (Table 3 and Table 4) and transformed by the interval ranges established for duration and severity (Table 5) enabled the matrix operation.
Matrix “A” represents the duration criterion; the activity duration values from the company’s timetable were converted into a five-point scale, as follows: 1—not time-consuming; 2—somewhat time-consuming; 3—time-consuming; 4—very time-consuming; 5—extremely time-consuming. The use of a five-point scale enabled the classification of construction activities in terms of the deadlines established in the timeline. This was one of the questions that is part of the analysis proposed, making it possible to compare the deadlines between the construction activities assessed in the real case. In addition, the creation of Matrix “A” made it possible to evaluate the impact of environmental aspects caused by changes and adaptations to the project timeline, helping managers in the decision-making process regarding activities whose timeline could be modified.
Matrix “B” represents the severity criterion, where each environmental aspect was calculated for the six activities, using specific methods and obtained from the input data of the amounts established in the budget and project. The results were subsequently converted to a five-point scale, as follows: 1—not severe; 2—somewhat severe; 3—severe; 4—very severe; 5—extremely severe. The interval scale of the vector space of Matrix “B” represents 10 environmental aspects in its columns, and six construction activities in its lines. The use of this matrix made it possible to analyze the correlation between a construction activity and each environmental aspect, thereby facilitating the identification of which construction activities generate more or less environmental impacts.
Matrix “C” presents the results of multiplying Matrices A and B, expressing the total score of each environmental aspect according to the matrix Equation (18).
       MATRIX   A      MATRIX   B        ( 2 1 2 2 5 5 ) ( 5 5 5 2 1 5 1 5 2 5 2 5 4 2 5 1 1 1 1 5 2 1 4 2 1 1 1 1 1 2 1 2 4 2 1 1 1 1 1 1 2 3 2 2 1 5 5 1 5 2 2 5 1 2 5 1 1 1 1 5 ) =     MATRIX   C ( TSP GHG NS SA SOILP AP RRMU CDW WU EU 38 61 45 34 41 45 37 25 39 56 )
The aspect with the largest environmental impact was GHG (61 points), followed by EU (56 points). Also obtaining high scores were AP (45 points), NP (45 points), SOILP (41 points), WU (39 points), TSP (38 points), RRMU (37 points), SA (34 points), and CDW (25 points). From these results, the managers are able to verify the total score of each environmental aspect considering all construction activities. This information enables the stakeholders to perceive that the greatest impact of this project is on Green House Gas emissions, followed by Energy Use. By verifying the input in matrices A and B, it is possible to verify that Curbing is the construction activity that is most impacting this project, enabling the managers to decide if they will modify this activity in order to lower the total score of these environmental aspects.

4. Discussion

The choice to develop a methodology for application in the pre-construction phase aimed to reduce, mitigate, or eliminate the environmental impacts, which enables a review of projects, budgets, and management of construction activities before they occur. This corroborates De Paula and Melhado [68] and Gultekin et al. [69], who reported that compliance with sustainable requirements does not depend only on technical solutions, but also on the management solutions adopted by companies in their projects. Shen et al. [39] argued that the efficacy of a viability study had a direct effect on the success of projects. Silva et al. [70] identified the need for specialists from different areas for urban planning tasks. According to Gharehbaghi et al. [71], assessments should be made with caution in order to ensure ecosystem protection against urban environmental problems.
Unlike Comello et al. [72], who conducted environmental studies on paving systems in the building sector, and Fernández-Sánchez and Rodríguez-López [30], who developed a methodology that identified opportunities and indicators applied in linear infrastructure projects, the present study proposes a predictive methodology applied to six urban infrastructure construction activities, and avoids the use of indicators, opting to calculate the environmental aspects.
A systematic review with meta-analysis [11] detected the absence of consensus in terms of the significant environmental aspects in the construction industry, with several aspects selected by different methods [5,13,15,25,28,40,48]. Guidelines differed regarding the aspects reported [10,46,73,74], with ISO 14004 [46] suggesting nine and EMAS (Eco-management and audit scheme) [10] suggesting 16 environmental aspects. As such, this study created an innovative model to improve critical, scientific, and standardized analysis in the identification of environmental aspects.
In the present study, a relative importance index was created to identify and hierarchize the most cited environmental aspects. Second-degree environmental aspects were adopted to avoid allocating them to different categories of first-degree aspects, thereby preventing repetitions. Ten environmental aspects were selected to represent the externalities of the construction industry. Similarly, Fernández-Sánchez and Rodríguez-López [30] used a relative importance index to prioritize the choice of indicators, as well as Tam et al. [40], who used pairwise comparison of the relative importance of the criterion to select and weigh sub-criteria.
The environmental criteria were chosen using a Pareto chart, with duration and severity selected as representative criteria because, according to the input data of the real case, they produce numerical information on the environmental aspects. Authors selected different environmental criteria in their studies to assess the environmental aspects [5,12,13,16,19]. EMAS [10] attributed the responsibility of establishing the criteria to the companies.
The methodology proposed here suggests that there are ideal moments in the development of the project to obtain information. For example, the scale criterion (scope) should be identified at conception, probability in the viability phase based on similar projects, severity, duration, cost, and amount at the end of the planning phase, with information on budgets, timetables and dimensioning, and stakeholders’ concern and exposure criteria in the phase of project presentation and judgement of those involved (Figure 4). Authors did not specify the ideal moment to obtain information [5,12,15].
Given the importance of the disturbance period and/or exposure to the natural environment and people, the duration criterion was selected and quantified using the total period of construction activity in days. This corroborates Chen et al. [15], who applied duration to quantify pollution and the risks generated by a construction project, and Gangolells et al. [5], who calculated the duration of environmental impacts in relation to the duration of the construction phase.
Previously, the severity criterion was assessed considering the perception of specialists by applying intervals [4,5,15]. Previous studies used only one environmental aspect—total suspended particles, heavy metal pollution, or air quality—to calculate the severity criterion [75]. Infrastructure investment decisions were based on complex environmental assessments [76]. In an innovative manner, the present study calculated the severity criterion for ten environmental aspects in six urban infrastructure construction activities, using formulas specifically applicable to each aspect, thereby eliminating the subjectivity of the judgement.
For the TSP environmental aspect, earthworks had the greatest environmental impact among the six infrastructure activities assessed. The results were consistent with the number of services and their operational emission factors. This agrees with Muleski et al. [77], who contend that road construction is one of the greatest villains in terms of environmental impacts.
The GHG results showed that the rainwater drainage system and curbing activities were polluters, due to the emissions caused by the concrete used to manufacture construction elements. However, we cannot ignore transport emissions, which, depending on the distances, may become relevant. Giesekam et al. [78], McPherson [79], and Hall [80] recognized that construction material emissions are significant sources of GHG. This environmental aspect prompted the development of sustainable materials for the construction industry in order to reduce emissions, as reported by Arıoğlu Akan et al. [81]. The design phase provided an opportunity for builders to use construction materials with lower emissions [82].
In the real case, NP exhibited values above the limits established by the Brazilian Association of Technical Guidelines [83], earthworks being the highest activity. The results depended directly on the amount of equipment forecast for this building site. Three factors influenced noise prediction: the equipment, distance to the receiver, and soundwave dispersion in the open building site. The prediction of NP in the pre-construction phase enables intervention in the construction plans in order to avoid noise above the limits established by construction guidelines, promoting reductions in this environmental aspect. This is in line with Haron et al. [54], who observed that the advantages of predicting the noise levels of construction equipment helped the real construction processes. Lee et al. [55] observed that the noise levels generated by construction equipment were essential for predictions in the construction industry processes.
In the pre-construction phase, SA was 23.98%, which was considered fair use of the soil. Given this prediction, designers could readjust the project to conserve and value natural elements. Li et al. [56] confirmed the important role of urban land use, and Qu and Long [57] underscored that any irrational use of land could have negative impacts on the environment.
The environment aspect SOILP demonstrated that the rainwater drainage system and curbing activities, when manufactured on site, increased the likelihood of chemical substances seeping into the soil. This corroborates Bossink and Brouwers [84], who reported that the elements of concrete cast on site were responsible for releasing chemical substances into the soil. Thus, the use of precast elements may mitigate and/or eliminate the environmental consequences [85].
The results of AP predict earthworks and paving activities as the highest polluters, associated with the sub-activities of vegetation suppression and soil compaction as potential risk factors for runoff, erosion, and contamination of surrounding water bodies. This agrees with Belayutham et al. [60], who underscored that conventional construction planning to meet time, cost, and quality goals produced negative consequences, such as erosion and sediment. The study of AP indicated solutions to reduce, eliminate, or mitigate this problem in operational planning, and implement temporary contention systems to block the spread of this impact. This corroborates Belayutham et al. [60], who recognized the importance of controlling erosion to reduce the risk of water pollution at the construction site.
RRMU, calculated using the methodologies described in ISO 14040 [86], ISO 14041 [87], ISO 14042 [88], and ISO 14043 [89], denominated life cycle assessment [61], showed that paving had the greatest impact due to the amount of material used. This finding is in line with Giama and Papadopoulos [90] and Hoxha et al. [91], who observed the relation between the environmental impact of construction material and the use of resources. The construction industry should opt for the rationalization, durability, and choice of materials with lower environmental impact coefficients. To that end, the choice of materials in the pre-construction phase, using pollution prevention criteria, waste reduction, and incorporated energy were essential for sustainability [91].
In the real case, CDW generated a greater volume of waste (soil) in earthworks, influenced by the topographic characteristics of the overall and earthworks projects. Gangolells et al. [92] reported that management practices help minimize waste generation. Li et al. [62] concluded that the substantial amount of waste produced compromises the sustainable development of cities. According to Fatta et al. [93], infrastructure activities were the most responsible for waste production.
Water use (WU) indicated paving as the highest consumer of this natural resource, due to the volume of construction materials used in this activity. For WU, the results of predicted water consumption demonstrated the need for new extraction processes and material manufacture as sustainable alternatives in order to decrease water consumption, such as chemical cleaning or air jets in granite production. Bardhan [94] indicated construction materials as important water consumers. According to Hoekstra et al. [95], water consumption represented important indicators to measure the sustainability of construction activities. However, McCormack et al. [96], Waidyasekara et al. [97,98], and Waylen [99] found a wide variation in the volume used at building sites, thereby producing unreliable information for intensities per unit of material.
Energy use (EU) was significant in three activities: earthworks, due to the embedded energy in soil transport, and the rainwater drainage system and curbing, due to the energy required to manufacture concrete materials. In general, energy consumption incorporated in the materials was greater when compared to its transport-related counterpart, corroborating other studies by Paulsen and Sposto [66], Teodoro [67], Treloar [65], and Treloar et al. [100], who associated the manufacture of construction materials with the increase in energy consumption. For this reason, Citherlet and Defaux [101] and Sartori and Hestnes [102] suggested the use of renewable energy to minimize the current consumption of the construction industry.
Finally, severity showed a direct relation between the amount, type of material, and activity and/or process used in the project, in addition to providing an early indication of the significant environmental aspects and enabling the management of the three dimensions of sustainability:
(a)
Economic: reducing amounts and duration, improving the productivity of activities;
(b)
Environmental: replacing conventional by alternative materials, as well as mitigating activities and opting for methods/processes that protect the environment;
(c)
Social: minimizing disturbance in the neighborhood and producing a project less aggressive to the environment and surrounding society.
Zobel and Burman [12], Whitelaw [19], Johnston et al. [13], and Gangolells et al. [5] used matrix models for environmental assessment in their studies, while Shen et al. [39], Eom and Paek [37], Tam et al. [40], and Chen et al. [26] used multicriteria models. Analysis of the performance of environmental aspects in the present study also used a matrix model, where duration was multiplied by severity and provided the result for each environmental aspect of the project. Of the ten environmental aspects, the following five had the greatest impact: GHG, EU, AP, NP, and SOILP, due to the type of construction, which required a large amount of equipment that impacted the atmosphere, soil, and water.

5. Conclusions

A methodology applicable to urban infrastructures activities in order to quantify environmental aspects by applying duration and severity criteria is proposed. The severity criteria are calculated considering those proposed in the scientific literature. The environmental aspect with the greatest impact was greenhouse gas emissions, which obtained 61 points. Among the six construction activities evaluated by the severity criterion for this aspect, three—earthworks, rainwater drainage system, and curbing—obtained the maximum score on the interval scale. The real case exhibited paving and curbing with longer timelines, promoting high greenhouse gas emissions.
The innovative quantitative methodology to assess urban development allows the scientific field to quantify environmental aspects via the basic documents developed in the pre-construction phase, especially design, timetables, and budgets. Applying this proposal in a real urban development case was essential. According to the results obtained here, environmental aspects such as greenhouse gas emissions, energy consumption, noise pollution, and water pollution were more significant and were classified as worrisome for the typology of construction activities. In addition, it enables quantification of the entire project, encompassing the sum of the values obtained in each environmental aspect assessed, and allows comparison with similar projects for general classification. The strength of this study lies in the quantification of environmental aspects using scientific methods for numerical calculation of the results, thereby excluding the perception of specialists to determine the severity of environmental aspects.
The construction industry, specifically urban infrastructures, needs to improve its environmental performance in order to produce more sustainable building projects. This article illustrates the most important environmental aspects for better material specifications, regionalization of construction processes, and replacement of potentially impacting activities. Moreover, diagnoses of possible environmental effects before the construction phase allows early decision-making. Applying this methodology in similar projects will allow comparison between building site performance and the establishment of benchmarks for similar projects.
This methodology could be adapted to other areas of the construction industry, such as commercial construction, highway construction, megaprojects, and other infrastructures, in order to enable more sustainable projects, thereby reducing environmental impacts. To that end, it will be necessary to develop an adaptation in terms of scale and aspects compatible with the types of projects to be studied. This methodology can also be implemented by developing software that facilitates and automates its use by researchers and users who work in the construction industry. This process may broaden the use of this proposal with a reduction in the time, complexity, and costs of analyzing criteria in the pre-construction phase, in addition to enabling the creation of a benchmark able to classify the environmental performances of projects based on the type analyzed.

Author Contributions

Conceptualization, A.G.d.A. and R.P.P.; methodology, A.G.d.A. and R.P.P.; validation, R.P.P. and A.M.P.C.; data curation, A.G.d.A.; writing—original draft preparation, A.G.d.A.; writing—review, A.G.d.A. and R.P.P.; supervision, R.P.P. and A.M.P.C. All authors have read and agreed to the published version of the manuscript.

Funding

This research received no external funding.

Acknowledgments

This study was financed in part by the Coordenação de Aperfeiçoamento de Pessoal de Nível Superior–Brazil (CAPES)—Finance Code 001. The author also would like to thank the anonymous reviewers for all valuable suggestions that enhanced the contribution of this paper.

Conflicts of Interest

The authors declare that they have no known competing financial interests or personal relationships that could have appeared to influence the work reported in this paper.

References

  1. UN-WUP. World Urbanization Prospects; United Nations: New York, NY, USA, 2018; Volume 12. [Google Scholar]
  2. Hosseini, M.R.; Banihashemi, S.; Martek, I.; Golizadeh, H.; Ghodoosi, F. Sustainable Delivery of Megaprojects in Iran: Integrated Model of Contextual Factors. J. Manag. Eng. 2018, 34, 05017011. [Google Scholar] [CrossRef]
  3. Krajangsri, T.; Pongpeng, J. Effect of Sustainable Infrastructure Assessments on Construction Project Success Using Structural Equation Modeling. J. Manag. Eng. 2017, 33, 04016056. [Google Scholar] [CrossRef]
  4. Borja, L.C.A.; César, S.F.; Cunha, R.D.A.; Kiperstok, A. A quantitative method for prediction of environmental aspects in construction sites of residential buildings. Sustainability 2018, 10, 1870. [Google Scholar] [CrossRef] [Green Version]
  5. Gangolells, M.; Casals, M.; Gassó, S.; Forcada, N.; Roca, X.; Fuertes, A. A methodology for predicting the severity of environmental impacts related to the construction process of residential buildings. Build. Environ. 2009, 44, 558–571. [Google Scholar] [CrossRef] [Green Version]
  6. Gutman, P. Ecosystem services: Foundations for a new rural-urban compact. Ecol. Econ. 2007, 62, 383–387. [Google Scholar] [CrossRef]
  7. Hein, L. Discussion Paper on Ecosystem Services: Towards a Classification of Ecosystem Services for SEEA; System of Environmental Economic Accounting EEA Revision Working Group 3 on Ecosystem Services: Glen Cove, NY, USA, 18 June 2018; p. 32. Available online: https://seea.un.org/sites/seea.un.org/files/documents/Forum_2018/seea_eea_expert_forum_2018_-_discussion_paper_on_ecosystem_services.pdf (accessed on 15 September 2020).
  8. Det Udomsap, A.; Hallinger, P. A bibliometric review of research on sustainable construction, 1994–2018. J. Clean. Prod. 2020, 254, 120073. [Google Scholar] [CrossRef]
  9. Kaminski, I. Road from Rio The Past, the Present and the Future of ISO 14001; International Organization for Standardization: London, UK, 2013. [Google Scholar]
  10. EMAS. Sistema Comunitário de Ecogestão e Auditoria; Portuguese Environment Agency: Amadora, Portugal, 2001; pp. 1–16.
  11. Araújo, A.G.; Pereira Carneiro, A.M.; Palha, R.P. Sustainable construction management: A systematic review of the literature with meta-analysis. J. Clean. Prod. 2020, 256, 120350. [Google Scholar] [CrossRef]
  12. Zobel, T.; Burman, J.O. Factors of importance in identification and assessment of environmental aspects in an EMS context: Experiences in Swedish organizations. J. Clean. Prod. 2004, 12, 13–27. [Google Scholar] [CrossRef]
  13. Johnston, A.; Hutchison, J.; Smith, A. Significant environmental impact evaluation: A proposed methodology. Eco-Manag. Audit. 2000, 7, 186–195. [Google Scholar] [CrossRef]
  14. Wells, C. BS7750 Environmental systems management. Proc. Inst. Civ. Eng.-Munic. Eng. 1993, 98, 119–123. [Google Scholar]
  15. Chen, Z.; Li, H.; Wong, C.T.C. Environmental management of urban construction projects in China. J. Constr. Eng. Manag. 2000, 126, 320–324. [Google Scholar] [CrossRef]
  16. Gangolells, M.; Casals, M.; Gassó, S.; Forcada, N.; Roca, X.; Fuertes, A. Assessing concerns of interested parties when predicting the significance of environmental impacts related to the construction process of residential buildings. Build. Environ. 2011, 46, 1023–1037. [Google Scholar] [CrossRef] [Green Version]
  17. Gangolells, M.; Casals, M.; Forcada, N.; Fuertes, A.; Roca, X. Model for Enhancing Integrated Identification, Assessment, and Operational Control of On-Site Environmental Impacts and Health and Safety Risks in Construction Firms. J. Constr. Eng. Manag. 2013, 139, 138–147. [Google Scholar] [CrossRef] [Green Version]
  18. Dabirian, S.; Khanzadi, M.; Taheriattar, R. Qualitative Modeling of Sustainability Performance in Construction Projects Considering Productivity Approach. Int. J. Civ. Eng. 2017, 15, 1143–1158. [Google Scholar] [CrossRef]
  19. Whitelaw, K. ISO 14001 Environmental Systems Handbook, 2nd ed.; Elsevier: Oxford, UK, 2004; ISBN 0750648430. [Google Scholar]
  20. ISO 14031 Environmental Management-Envirionmental Performance Evaluation-Guidelines; International Organization for Standardization: Geneva, Switzerland, 2004; p. 38.
  21. Medineckienė, M.; Turskis, Z.; Zavadskas, E.K. Sustainable Construction Taking Into Account the Building Impact on the Environment. J. Environ. Eng. Landsc. Manag. 2010, 18, 118–127. [Google Scholar] [CrossRef]
  22. Namini, S.B.; Shakouri, M.; Tahmasebi, M.M.; Preece, C. Managerial sustainability assessment tool for Iran’s buildings. Proc. Inst. Civ. Eng. Eng. Sustain. 2014, 167, 12–23. [Google Scholar] [CrossRef]
  23. Dobrovolskienė, N.; Tamošiūnienė, R. An index to measure sustainability of a business project in the construction industry: Lithuanian case. Sustainalibility 2016, 8, 14. [Google Scholar] [CrossRef] [Green Version]
  24. Hassan, O.A.B. An integrated approach to assessing the sustainability of buildings. J. Eng. Des. Technol. 2016, 14, 1–13. [Google Scholar] [CrossRef]
  25. Chen, Z.; Li, H.; Hong, J. An integrative methodology for environmental management in construction. Autom. Constr. 2004, 13, 621–628. [Google Scholar] [CrossRef]
  26. Chen, Z.; Li, H.; Wong, C.T.C. EnvironalPlanning: Analytic Network Process Model for Environmentally Conscious Construction Planning. J. Constr. Eng. Manag. 2005, 131, 92–101. [Google Scholar] [CrossRef]
  27. Ozcan-Deniz, G.; Zhu, Y. A system dynamics model for construction method selection with sustainability considerations. J. Clean. Prod. 2016, 121, 33–44. [Google Scholar] [CrossRef] [Green Version]
  28. Kilgarriff, Adam; Baisa, Vít; Bušta, Jan; Jakubíček, Miloš; Kovář, Vojtěch; Michelfeit, Jan; Rychlý, Pavel; Suchomel, Vít. A vision and methodology for integrated sustainable urban development: BEQUEST. Build. Res. Inf. 2002, 30, 83–94. [Google Scholar] [CrossRef]
  29. Li, F.; Liu, X.; Hu, D.; Wang, R.; Yang, W.; Li, D.; Zhao, D. Measurement indicators and an evaluation approach for assessing urban sustainable development: A case study for China’s Jining City. Landsc. Urban Plan. 2009, 90, 134–142. [Google Scholar] [CrossRef]
  30. Fernández-Sánchez, G.; Rodríguez-López, F. A methodology to identify sustainability indicators in construction project management - Application to infrastructure projects in Spain. Ecol. Indic. 2010, 10, 1193–1201. [Google Scholar] [CrossRef]
  31. Wallbaum, H.; Krank, S.; Teloh, R. Prioritizing Sustainability Criteria in Urban Planning Processes: Methodology Application. J. Urban Plan. Dev. 2011, 137, 20–28. [Google Scholar] [CrossRef]
  32. Lin, T.; Ge, R.; Huang, J.; Zhao, Q.; Lin, J.; Huang, N.; Zhang, G.; Li, X.; Ye, H.; Yin, K. A quantitative method to assess the ecological indicator system’s effectiveness: A case study of the Ecological Province Construction Indicators of China. Ecol. Indic. 2016, 62, 95–100. [Google Scholar] [CrossRef]
  33. Lin, H.; Zeng, S.; Ma, H.; Zeng, R.; Tam, V.W.Y. An indicator system for evaluating megaproject social responsibility. Int. J. Proj. Manag. 2017, 35, 1415–1426. [Google Scholar] [CrossRef]
  34. Akbari, S.; Khanzadi, M.; Gholamian, M.R. Building a rough sets-based prediction model for classifying large-scale construction projects based on sustainable success index. Eng. Constr. Archit. Manag. 2018, 25, 534–558. [Google Scholar] [CrossRef] [Green Version]
  35. Hosseini, M.R.; Banihashemi, S.; Rameezdeen, R.; Golizadeh, H.; Arashpour, M.; Ma, L. Sustainability by Information and Communication Technology: A paradigm shift for construction projects in Iran. J. Clean. Prod. 2017, 168, 1–13. [Google Scholar] [CrossRef]
  36. Jang, W.; Lee, S.K.; Han, S.H. Sustainable Performance Index for Assessing the Green Technologies in Urban Infrastructure Projects. J. Manag. Eng. 2018, 34, 04017056. [Google Scholar] [CrossRef]
  37. Eom, C.S.; Paek, J.H. Risk Index Model for Minimizing Environmental Disputes in Construction. J. Constr. Eng. Manag. 2009, 135, 34–41. [Google Scholar] [CrossRef]
  38. Ruiz, M.C.; Fernández, I. Environmental assessment in construction using a Spatial Decision Support System. Autom. Constr. 2009, 18, 1135–1143. [Google Scholar] [CrossRef]
  39. Shen, L.Y.; Lu, W.S.; Yao, H.; Wu, D.H. A computer-based scoring method for measuring the environmental performance of construction activities. Autom. Constr. 2005, 14, 297–309. [Google Scholar] [CrossRef]
  40. Tam, C.M.; Tam, V.W.Y.; Tsui, W.S. Green construction assessment for environmental management in the construction industry of Hong Kong. Int. J. Proj. Manag. 2004, 22, 563–571. [Google Scholar] [CrossRef]
  41. Tam, V.W.Y.; Tam, C.M.; Zeng, S.X.; Chan, K.K. Environmental performance measurement indicators in construction. Build. Environ. 2006, 41, 164–173. [Google Scholar] [CrossRef]
  42. Guarini, M.R.; Morano, P.; Sica, F. Historical school buildings. A multi-criteria approach for Urban sustainable projects. Sustainability 2020, 12, 1076. [Google Scholar] [CrossRef] [Green Version]
  43. Guarini, M.R.; Morano, P.; Sica, F. Integrated ecosystem design: An evaluation model to support the choice of eco-compatible technological solutions for residential building. Energies 2019, 12, 2659. [Google Scholar] [CrossRef] [Green Version]
  44. Zhang, X.; Wu, Y.; Shen, L.; Skitmore, M. A prototype system dynamic model for assessing the sustainability of construction projects. Int. J. Proj. Manag. 2014, 32, 66–76. [Google Scholar] [CrossRef] [Green Version]
  45. Shahtaheri, Y.; Flint, M.M.; de la Garza, J.M. Sustainable Infrastructure Multi-Criteria Preference Assessment of Alternatives for Early Design. Autom. Constr. 2018, 96, 16–28. [Google Scholar] [CrossRef]
  46. ISO 14004 Environmental Management Systems-General Guidelines on Principles, Systems and Support Techniques; International Organization for Standardization: Geneva, Switzerland, 2007; p. 53.
  47. Geng, S.; Wang, Y.; Zuo, J.; Zhou, Z.; Du, H.; Mao, G. Building life cycle assessment research: A review by bibliometric analysis. Renew. Sustain. Energy Rev. 2017, 76, 176–184. [Google Scholar] [CrossRef]
  48. Apanavičiene, R.; Daugeliene, A.; Baltramonaitis, T.; Maliene, V. Sustainability aspects of real estate development: Lithuanian case study of sports and entertainment arenas. Sustainability 2015, 7, 6497–6522. [Google Scholar] [CrossRef] [Green Version]
  49. Laili Jabar, I.; Ismail, F.; Mustafa, A.A. Issues in Managing Construction Phase of IBS Projects. Procedia-Soc. Behav. Sci. 2013, 101, 81–89. [Google Scholar] [CrossRef] [Green Version]
  50. Jung, S.; Kang, H.; Sung, S.; Hong, T. Health risk assessment for occupants as a decision-making tool to quantify the environmental effects of particulate matter in construction projects. Build. Environ. 2019, 161, 106267. [Google Scholar] [CrossRef]
  51. USEPA. Emission Factor Documentation for AP-42, Unpaved Roads; U.S. Environmental Protection Agency: Durham, NC, USA, 1998.
  52. Yim, S.Y.C.; Ng, S.T.; Hossain, M.U.; Wong, J.M.W. Comprehensive evaluation of carbon emissions for the development of high-rise residential building. Buildings 2018, 8, 147. [Google Scholar] [CrossRef] [Green Version]
  53. EPA. Documentation for Greenhouse Gas Emission and Energy Factors Used in the Waste Reduction Model (WARM)-Containers, Packaging, and Non-Durable Good Materials Chapters; U.S. Environmental Protection Agency: Durham, NC, USA, 2016.
  54. Haron, Z.; Yahya, K.; Jahya, Z. Prediction of noise pollution from construction sites at the planning stage using simple prediction charts. Energy Educ. Sci. Technol. Part A Energy Sci. Res. 2012, 29, 989–1002. [Google Scholar]
  55. Lee, H.P.; Wang, Z.; Lim, K.M. Assessment of noise from equipment and processes at construction sites. Build. Acoust. 2017, 24, 21–34. [Google Scholar] [CrossRef]
  56. Li, W.; Zhou, W.; Bai, Y.; Pickett, S.T.A.; Han, L. The smart growth of Chinese cities: Opportunities offered by vacant land. L. Degrad. Dev. 2018, 29, 3512–3520. [Google Scholar] [CrossRef]
  57. Qu, Y.; Long, H. The economic and environmental effects of land use transitions under rapid urbanization and the implications for land use management. Habitat Int. 2018, 82, 113–121. [Google Scholar] [CrossRef]
  58. Wu, Q.; Hao, J.; Yu, Y.; Liu, J.; Li, P.; Shi, Z.; Zheng, T. The way forward confronting eco-environmental challenges during land-use practices: A bibliometric analysis. Environ. Sci. Pollut. Res. 2018, 25, 28296–28311. [Google Scholar] [CrossRef]
  59. Eikelboom, R.T.; Ruwiel, E.; Goumans, J.J.J.M. The building materials decree: An example of a dutch regulation based on the potential impact of materials on the environment. Waste Manag. Ser. 2001, 1, 963–974. [Google Scholar]
  60. Belayutham, S.; González, V.A.; Yiu, T.W. A cleaner production-pollution prevention based framework for construction site induced water pollution. J. Clean. Prod. 2016, 135, 1363–1378. [Google Scholar] [CrossRef]
  61. Thomas, S.T.; Chan, J.H.L.; Chan, G.K.C.; Zou, J.W.W. Environmental impacts of construction material production. Proc. Inst. Civ. Eng. Eng. Sustain. 2017, 170, 169–184. [Google Scholar]
  62. Li, Y.; Zhang, X.; Ding, G.; Feng, Z. Developing a quantitative construction waste estimation model for building construction projects. Resour. Conserv. Recycl. 2016, 106, 9–20. [Google Scholar] [CrossRef]
  63. Mersiowsky, I. Mersiowsky 2002- Long-term fate PVC in landfills.pdf. Prog. Polym. Sci. 2002, 27, 2227–2277. [Google Scholar] [CrossRef]
  64. Souza, J.L.; Filho, F.d.A.d.S.; Neto, J.d.P.B. Pegada Hídrica Azul Dos Insumos Utilizados Na Blue Water Footprint of Supplies Used in Building. In Proceedings of the XXI SimpÓsio Brasileiro de Recursos Hídricos, Brasília, Brazil, 22–27 November 2015; pp. 1–7. [Google Scholar]
  65. Treloar, G.J. Extracting embodied energy paths from input-output tables: Towards an input-output-based hybrid energy analysis method. Econ. Syst. Res. 1997, 9, 375–391. [Google Scholar] [CrossRef]
  66. Paulsen, J.S.; Sposto, R.M. A life cycle energy analysis of social housing in Brazil: Case study for the program “mY HOUSE MY LIFE”. Energy Build. 2013, 57, 95–102. [Google Scholar] [CrossRef]
  67. Teodoro, M.I.T.d.M. Energia Embutida na Construção de Edificações no Brasil: Contribuições para o Desenvolvimento de Políticas Públicas a Partir de um Estudo de Caso em Mato Grosso do Sul. Ph.D. Thesis, University of São Paulo, São Paulo, Brazil, 2017. [Google Scholar]
  68. De Paula, N.; Melhado, S. Sustainability in Management Processes: Case Studies in Architectural Design Firms. J. Archit. Eng. 2018, 24, 05018005. [Google Scholar] [CrossRef]
  69. Gultekin, P.; Mollaoglu-Korkmaz, S.; Riley, D.R.; Leicht, R.M. Process Indicators to Track Effectiveness of High-Performance Green Building Projects. J. Constr. Eng. Manag. 2013, 139, A4013005. [Google Scholar] [CrossRef]
  70. Silva, M.M.; Hipel, K.W.; Kilgour, D.M.; Costa, A.P.C.S. Urban planning in Recife, Brazil: Evidence from a conflict analysis on the New Recife Project. J. Urban Plan. Dev. 2017, 143, 11. [Google Scholar]
  71. Gharehbaghi, K.; McManus, K.; Hurst, N.; Robson, K.; Myers, M. Complexities in mega rail transportation projects: “Sydney metro” and “Melbourne metro rail” insight. J. Eng. Des. Technol. 2019, 18, 18. [Google Scholar] [CrossRef]
  72. Comello, S.D.; Lepech, M.D.; Schwegler, B.R. Project-Level Assessment of Environmental Impact: Ecosystem Services Approach to Sustainable Management and Development. J. Manag. Eng. 2012, 28, 5–12. [Google Scholar] [CrossRef]
  73. ISO 14001 Environmental Management Systems-Requirements with Guidance for Use; International Organization for Standardization: Geneva, Switzerland, 2004; p. 34.
  74. ISO 21929-1 Sustainability in Building Construction—Sustainability Indicators; International Organization for Standardization: Geneva, Switzerland, 2011.
  75. Fu, Y.; Zhang, X. Mega urban agglomeration in the transformation era: Evolving theories, research typologies and governance. Cities 2020, 105, 102813. [Google Scholar] [CrossRef]
  76. van Eldijk, J.; Gil, J.; Kuska, N.; Patro, R.S. Missing links–Quantifying barrier effects of transport infrastructure on local accessibility. Transp. Res. Part D Transp. Environ. 2020, 85, 102410. [Google Scholar] [CrossRef]
  77. Muleski, G.E.; Kinsey, J.S.; Cowherd, C. Particulate emissions from construction activities. J. Air Waste Manag. Assoc. 2005, 55, 772–783. [Google Scholar] [CrossRef] [Green Version]
  78. Giesekam, J.; Barrett, J.; Taylor, P.; Owen, A. The greenhouse gas emissions and mitigation options for materials used in UK construction. Energy Build. 2014, 78, 202–214. [Google Scholar] [CrossRef]
  79. McPherson, D.L. Choice of Pipeline Material: PVC or Di Using A Life Cycle Cost Analysis. Available online: https://ascelibrary.org/doi/abs/10.1061/41069(360)126 (accessed on 15 September 2020).
  80. Hall, J.N. Briefing: A practical initiative for the construction industry. Proc. Inst. Civ. Eng. Eng. Sustain. 2010, 163, 181–183. [Google Scholar] [CrossRef]
  81. Akan, M.Ö.A.; Dhavale, D.G.; Sarkis, J. Greenhouse gas emissions in the construction industry: An analysis and evaluation of a concrete supply chain. J. Clean. Prod. 2017, 167, 1195–1207. [Google Scholar] [CrossRef]
  82. Sandanayake, M.; Zhang, G.; Setunge, S. Estimation of environmental emissions and impacts of building construction–A decision making tool for contractors. J. Build. Eng. 2019, 21, 173–185. [Google Scholar] [CrossRef]
  83. ABNT NBR 10151. Associação Brasileira de Normas Técnicas. Acústica-Avaliação do ruído em áreas Habitadas, Visando o Conforto da Comunifade-Procedimentos; Brazilian National Standards Organization: Rio de Janeiro, Brasil, 2000; p. 4. [Google Scholar]
  84. Bossink, B.A.G.; Brouwers, H.J.H. Construction Waste: Quantification and Source Evaluation. J. Constr. Eng. Manag. 1996, 122, 55–60. [Google Scholar] [CrossRef] [Green Version]
  85. Chen, Y.; Okudan, G.E.; Riley, D.R. Sustainable performance criteria for construction method selection in concrete buildings. Autom. Constr. 2010, 19, 235–244. [Google Scholar] [CrossRef]
  86. ISO 14040 Environmental Management-Life Cycle Assessment-Principles and Framework; International Organization for Standardization: Geneva, Switzerland, 2001; pp. 1–22.
  87. ISO 14041 Environmental Management—Life Cycle Assessment—Goal and Scope Definition and Inventory Analysis; International Organization for Standardization: Geneva, Switzerland, 1998; Volume 1998.
  88. ISO 14042 Environmental Management-Life Cycle Assessment-Life Cycle Impact Assessment; International Organization for Standardization: Geneva, Switzerland, 2000; pp. 2–7. Available online: https://link.springer.com/article/10.1007/BF02978514 (accessed on 15 September 2020).
  89. ISO 14043 Environmental Management-Life Cycle Assessment-Life Cycle Interpretation; International Organization for Standardization: Geneva, Switzerland, 2000; pp. 2–7. Available online: https://www.iso.org/standard/23154.html (accessed on 15 September 2020).
  90. Giama, E.; Papadopoulos, A.M. Assessment tools for the environmental evaluation of concrete, plaster and brick elements production. J. Clean. Prod. 2015, 99, 75–85. [Google Scholar] [CrossRef]
  91. Hoxha, V.; Haugen, T.; Bjorberg, S. Measuring perception about sustainability of building materials in Kosovo. Facilities 2017, 35, 436–461. [Google Scholar] [CrossRef] [Green Version]
  92. Gangolells, M.; Casals, M.; Forcada, N.; Macarulla, M. Analysis of the implementation of effective waste management practices in construction projects and sites. Resour. Conserv. Recycl. 2014, 93, 99–111. [Google Scholar] [CrossRef] [Green Version]
  93. Fatta, D.; Papadopoulos, A.; Avramikos, E.; Sgourou, E.; Moustakas, K.; Kourmoussis, F.; Mentzis, A.; Loizidou, M. Generation and management of construction and demolition waste in Greece—An existing challenge. Resour. Conserv. Recycl. 2003, 40, 81–91. [Google Scholar] [CrossRef]
  94. Bardhan, S. Assessment of water resource consumption in building construction in India. WIT Trans. Ecol. Environ. 2011, 144, 93–101. [Google Scholar]
  95. Hoekstra, A.Y.; Chapagain, A.K.; Aldaya, M.M.; Mekonnen, M.M. The Water Footprint Assessment Manual; Taylor & Francis Ltd.: London, UK, 2011; Volume 31, ISBN 9781849712798. [Google Scholar]
  96. McCormack, M.; Treloar, G.J.; Palmowski, L.; Crawford, R. Modelling direct and indirect water requirements of construction. Build. Res. Inf. 2007, 35, 156–162. [Google Scholar] [CrossRef] [Green Version]
  97. Waidyasekara, K.G.A.S.; De Silva, L.; Rameezdeen, R. Water use efficiency and conservation during construction: Drivers, barriers and practices. Built Environ. Proj. Asset Manag. 2016, 6, 553–566. [Google Scholar] [CrossRef]
  98. Waidyasekara, K.G.A.S.; De Silva, L.; Rameezdeen, R. Application of “R” principles to enhance the efficiency of water usage in construction sites. Built Environ. Proj. Asset Manag. 2017, 7, 400–412. [Google Scholar] [CrossRef]
  99. Waylen, C. WATER: The 2009 Progress Report on Reducing Water Usage on Construction Sites; Waterwise Ltd.: London, UK, 2011. [Google Scholar]
  100. Treloar, G.J.; Love, P.E.D.; Holt, G.D. Using national input/output data for embodied energy analysis of individual residential buildings. Constr. Manag. Econ. 2001, 19, 49–61. [Google Scholar] [CrossRef]
  101. Citherlet, S.; Defaux, T. Energy and environmental comparison of three variants of a family house during its whole life span. Build. Environ. 2007, 42, 591–598. [Google Scholar] [CrossRef]
  102. Sartori, I.; Hestnes, A.G. Energy use in the life cycle of conventional and low-energy buildings: A review article. Energy Build. 2007, 39, 249–257. [Google Scholar] [CrossRef]
Figure 1. Proposed Methodology to Assess Environmental Aspects (source: the authors).
Sustainability 12 07636 g001
Figure 2. Environmental aspect identification process (source: the authors).
Sustainability 12 07636 g002
Figure 3. Environmental criteria (source: the authors).
Sustainability 12 07636 g003
Figure 4. Degree of accuracy of pre-construction criteria (source: the authors).
Sustainability 12 07636 g004
Figure 5. Aerial photograph of the project (source: Google Earth, accessed on 21 March 2020).
Sustainability 12 07636 g005
Table 1. Relative importance index of 1st degree environmental aspects.
I 1I 2I 3I 4I 5I 6I 7I 8I 9I 10I 11I 12I 13
0.180.130.120.110.110.080.050.050.050.040.040.030.01
Notes: I1—Air emissions, I2—Water discharges, I3—Land discharges, I4—Resource and raw material use, I5—Waste, I6—Energy use, I7—Noise emissions, I8—Energy emissions, I9—Effects of biodiversity, I10—Local/Community environmental impacts, I11—Hazardous emissions, I12—Accidents/Incidents, I13—Archeological impacts (Source: Adapted from Fernández-Sánchez and Rodríguez-López [30]; Tam et al. [40]).
Table 2. Relative importance index of 2nd degree aspects.
I iI i-1I i-2I i-3I i-4I i-5
I 10.310.270.250.120.04
I 20.580.42
I 30.640.36
I 40.810.130.06
I 50.680.32
I 60.870.13
I 71.00
I 80.670.200.13
I 91.00
I 100.750.170.08
I 111.00
I 120.880.13
I 131.00
Notes: I1-1—Air pollution, I1-2—Greenhouse gas emissions (GGE), I1-3—Total suspended particles (TPS), I1-4—Odor, I1-5—Volative organic compound emissions, I2-1—Water pollution (WP), I2-2—Water use (WU), I3-1—Soil alteration (SA), I3-2—Soil pollution (SOILP), I4-1—Resource and raw material use (RRMU), I4-2—Use of resources as energy, I4-3—Durable materials, I5-1—Construction and demolition waste (CDW), I5-2—Solid waste, I6-1—Energy use (EU), I6-2—Renewable energy uses, I7-1—Noise pollution (NP), I8-1—Vibration, I8-2—Heat, I8-3—Radiation, I9-1—Effects of biodiversity, I10-1—Transport, I10-2—Community, I10-3—Environmental impacts on neighboring areas, I11-1—Harzardous emissions, I12-1—Accidents/Incidents, I12-2—Fire, I13-1—Archeological impacts (Source: Adapted from Fernández-Sánchez and Rodríguez-López [30]; Tam et al. [40]).
Table 3. Severity of Environmental Aspects.
DESCRIPTION OF SERVICESUNITAMOUNTTSPGHGNPSASOILP
EARTHWORKSm2300,000.003,092,263.15g279,157.83kgCO2e70.86dB23.98%0.00mg/m2
RAINWATER DRAINAGE SYSTEMm6698.0053,846.90g384,395.35kgCO2e61.46dB23.98%718.03mg/m2
DRINKING WATER SUPPLY SYSTEMm6698.005,083.54g17,477.43kgCO2e61.46dB23.98%0.00mg/m2
ELECTRICAL ENERGY SYSTEMunit222.001,487.95g59,801.02kgCO2e61.83dB23.98%0.00mg/m2
PAVINGm253,243.18262,144.07g143,261.11kgCO2e54.06dB23.98%0.00mg/m2
CURBINGm13,590.0023,640.40g372,501.98kgCO2e51.05dB23.98%695.81mg/m2
Table 4. Severity of Environmental Aspects.
DESCRIPTION OF SERVICESUNITAMOUNTAPRRMUCDWWUEU
EARTHWORKSm2300,000.003.59%0.00total impact69,677.15t161,454.06L3,241,499.60MJ
RAINWATER DRAINAGE SYSTEMm6698.000.067%7.147 × 10⁻⁹total impact30.96t112,191.25L3,327,247.19MJ
DRINKING WATER SUPPLY SYSTEMm6698.000.179%5.345 × 10⁻¹⁰total impact0.18t0.00L661,203.93MJ
ELECTRICAL ENERGY SYSTEMunit222.000.00%4.759 × 10⁻¹⁰total impact0.00t17,575.00L543,881.90MJ
PAVINGm253,243.183.59%5.491 × 10⁻⁷total impact816.28t632,684.42L687,586.83MJ
CURBINGm13,590.000.272%6.926 × 10⁻⁹total impact30.01t108,720.00L3,224,118.26MJ
Source: the authors.
Table 5. Interval scales–Severity.
TSP (g)-IntervalsScaleGHG (kgCO2e)-IntervalsScale
TSP < 1487.951GHG < 17,477.431
1,487.95 < TSP < 619,642.99217,477.43 < GHG < 90,861.012
619,642.99 < TSP < 1,237,798.03390,861.01 < GHG < 164,244.593
1,237,798.03 < TSP < 1,855,953.074164,244.59 < GHG < 237,628.174
TSP > 1,855,953.075GHG > 237,628.175
NP (dB)-IntervalsScaleSA (%)-IntervalsScale
NP < 51.051SA < 151
51.05 < NP < 55.01215 < SA < 252
55.01 < NP < 58.97325 < SA < 353
58.97 < NP < 62.93435 < SA < 454
NP > 62.935SA > 455
SOILP (mg/m2)-IntervalsScaleAP (%)-IntervalsScale
SOILP < 43.081AP < 0.7181
43.08 < SOILP < 86.1620.718 < AP < 1.4362
86.16 < SOILP < 129.2431.436 < AP < 2.1543
129.24 < SOILP < 172.3242.154 < AP < 2.8724
SOILP > 172.325AP > 2.8725
RRMU (total impact)-IntervalsScaleCDW (t)-IntervalsScale
RRMU < 1.098 × 10−71CDW < 13,935.431
1.098 × 10⁻⁷<RRMU < 2.196 × 10−7213,935.43 < CDW < 27,870.862
2.196 × 10⁻⁷<RRMU < 3.294 × 10−7327,870.86 < CDW < 41,806.293
3.294 × 10⁻⁷ <RRMU < 4.392 × 10−7441,806.29 < CDW < 55,741.714
RRMU > 4.392 × 10−75CDW > 55,741.715
WU (L)-IntervalsScaleEU (MJ)-IntervalsScale
WU < 126,536.881EU < 556,673.051
126,536.88 < WU < 253,073.762556,673.05 < EU < 1,113,346.102
253,073.76 < WU < 379,610.6431,113,346.10 < EU < 1,670,019.153
379,610.64 < WU < 506,147.5241,670,019.15 < EU < 2,226,693.204
WU > 506,147.525EU > 2,226,693.205
Source: the authors.

