Abstract
The Internet facilitates connections between a range of Dutch actors with a stake in the energy transition, including governments, environmental organizations, media outlets and corporations. These connections tease a hyperlink network affecting public access to information on energy transition issues. Despite its societal relevance, however, the characteristics of this network remain understudied. The main goals of this study are to shed some light on the topological characteristics of the Dutch energy transition hyperlink network and reveal the main topics discussed in the network. To do so, we longitudinally collected data from the interactions between key Dutch actors with a stake in the energy transition. Then, these data were analyzed by employing a mixed-method approach, social network analysis and topic modeling. The results of the social network analyses reveal the existence of a sparse network in which few private companies and associations emerge as the most authoritative actors and brokers. Furthermore, our analyses show substantial differences among the communication agendas of the organizations of the Dutch energy transition hyperlink network; while public institutions focus on global, national and local policy issues, private companies, associations and NGOs pay much more attention to employment issues.
1. Introduction
In The Netherlands, the energy transition (“energietransitie”) is mobilizing a wide variety of societal actors (public institutions, private companies, NGOs, universities and governmental bodies, among others) with a growing impetus—not even faltered during the recent pandemic crisis—in greening the energy sources. The path toward the energy transition, whose scope will arguably encompass the whole European Union if the recently proclaimed “Green New Deal” is successful, will trigger enormous changes in the energy sector [1] and in the economic and social spheres. Past energy transitions, such as those from biomass to coal or from coal to oil, deeply transformed our societies and economies. However, in comparison to the present energy transition, those transitions were merely technology led and occurred spontaneously, as a result of unleashing the transformative power encoded in the new forms of energy, sources and processes [2]. Today, for the first time in human history, these changes have become the goal, rather than the result of the onset of new “energy imperatives” [3]. The investment in energy production facilities and the introduction of low-carbon policies have made renewable sources increasing competitive compared to fossil fuels [1,4], generating a positive impact on many power markets across Europe. A wave of change is reaching, for instance, the automotive market, where it is estimated that 26.9 million electric vehicles will be sold by 2030, compared to only 3.2 million in 2019 [5].
In The Netherlands, the complexity of the energy transition process is the product of the interaction of multiple agents. New social actors, such as energy cooperatives, have become the drivers of innovation for a less carbon-intensive economy, albeit on a local scale [6]. Despite these evidences, much uncertainty remains about the direction the Dutch energy transition is heading to. This, of course, depends on the social engagement, investment capacity, infrastructural characteristics, technological advancement and political commitment of a country system.
Indeed, the energy transition is not only the product of the interplay between regulation and technology, but it also involves less evident social factors such as attitudes, social practices and communication agendas [7]. Previous research has shown how these social factors can facilitate or obstruct the penetration of new technologies [8,9], including more sustainable ones, while highlighting the role of knowledge and trust in technology in the formation of a certain attitude vis-à-vis, for instance, the acceptance of hydrogen fueled technologies [10,11]. Renewable energy facilities place a tangible burden on land and beneficiaries; thus behaviors, conflictual or cooperative, are specific to the territorial context [12]. Investigating the culturally embeddedness, i.e., how this complex phenomenon is represented and communicated within a specific cultural context, is crucial: a way to do so, is studying the channels through which information circulates among actors. Among these channels, the World Wide Web (the Web) has become a key space for searching and sharing information due to its ubiquity and frequency of use.
An unambiguous way to track interactions in the web is by detecting linked webpages, i.e., hyperlinks, which define the structure and the extent of the relationships among sources (see Section 1.2) and represent a real gateway for the underpinning of knowledge. In fact, a factor that affects the visibility of a website for a web user is the number of hyperlinks that connect it to other websites. Simply put, the more a website receives hyperlinks from other websites, the more this site is considered authoritative in the web, making it more relevant to users looking for information on, for instance, energy transition related topics. Indeed, this authoritativeness provides a preferential path in the search for information by the lay-person and influences the nature and quantity of knowledge acquired by more expert people [13,14,15].
The research investigating the salience of the “energy transition” topic on the Web is scant and mainly focus on the political field [16]. However, literature on related topics such as “climate change” and “global warming” is more abundant. This line of research focuses on exploring such social phenomena through the web or in social media (prominently Twitter) adopting two main approaches. The first one, focuses on investigating the topology of the networks shaped by the actors involved in the phenomenon and searches for patterns or structures that can provide insights on the existing relationship between them. The contributions of Williams et al. [17] on echo-chambers formation in the discussion on climate change, Elmer [18] on actors’ centrality in the energy policy web issue and the well-known contribution of Rogers & Marres [19] on the key players of the web debate on climate change, are a valid example of this stream of research. The second focuses on the content of this interactive exchange, investigates the way the phenomenon is described and communicated. Some examples in this area are the research on the climate change sentiment [20], on the skepticism about global warming [21] and, more recently, on the comparison of changes in climate change and global warming discourse [22]. Less frequently, however, there is a hybridization of the two approaches that allows, at the same time, to study the relationship of actors and the content of the interaction between them, as in the investigation of cross-ideology exposure on Twitter about global warming [23]. As pointed out by Park [24], investigating both aspects—relationship and content and overcoming the limitations of both approaches—can be helpful to have a close look on social phenomena [25], as, in the case of this research, the Dutch energy transition and its potential developmental direction(s).
Consequently, this study aims at exploring the discourse on energy transition by giving an answer to two over-arching questions: (a) who are the actors leading the Dutch energy transition online discourse? Moreover, (b) what are the dominant topics emerging in the Dutch energy transition online discourse?
1.1. Notes on the Dutch Energy Transition
Since the 1970s, The Netherlands promoted several research programs centered on the link between environment and technology [26,27] which led to the best-known and most documented program for the energy transition: the energy transition program” (ETP). This program set an ensemble of guidelines for achieving a “clean”, “affordable” and “secure” energy system. This program also affected the national environmental planning [28,29], which took the lead in promoting the dialogue about the energy transition among research institutions and policy makers [26]. Nevertheless, the Dutch transition process of the early 2000s, was mainly focused on the technological advancements and short-term gains [30,31].
The Netherlands, together with Germany, can be rightfully considered one of the leading European countries in the energy transition. In 2019, the country occupied the 9th position in the energy transition global ranking index [32,33], compiled by the World Economic Forum and based on several parameters such as the current energy system performance, the environmental sustainability and the security of the energy system. Another characteristic making The Netherlands one of the most active European countries in implementing energy transition policies [33] is the ability of the country to integrating business processes and research in a corporative and unique fashion [31,34]. Thus, the study of the Dutch energy transition can be a benchmark to compare the progress of other countries engaged in potentially less explicit and effective energy transition programs.
1.2. Hyperlink Networks
The prominent feature of the Web is the possibility to connect different social settings, organizations or geographical locations, in an all-encompassing virtual environment. Websites are linked through hyperlinks, defined as “a technological capability that allows, in principle, to seamlessly link a specific website with another” [35] (p. 57). Hyperlinks can be used as a lens for observing how individual and organization interactions shape reality representation. As such, hyperlinks emerge as a source of data for political, economic, sociological and ethnographic studies. Indeed, hyperlinks can be attributes of the website, containing information on the connected entities—and gates between different points in the web; the webpages. These gates are not randomly scattered on the web-space but replicate the communication intents of the website owner [36,37]. While these intents are website-specific, that is, dependent of the generating website, they also provide relevant information concerning their social function [38], i.e., satisfying the need for specific web-content information or reflecting trust or alliances between actors [39,40]. Moreover, hyperlinks can be employed to confer authority or endorsement by linking a website to authoritative and credible sources. In this regard, the amount of incoming hyperlinks is often used as an indicator of the authoritativeness and credibility of a website [24,41,42].
The Analysis of Hyperlink Networks: A Social a Network Analysis Approach
By representing websites as vertices (nodes) and hyperlinks as directional edges (links), it is possible to transpose the digital environment into a topological space [43]. The resulting network, on a large domain of nodes, reveals organized features and general properties, such as power law distributions [44] and it enables a sound quantitative investigation through, for instance, the application of well-developed methodologies [35].
Social network analysis (SNA) is an approach and a set of techniques used to study the exchange of resources between social actors [45]. SNA provides our study with theoretical lenses and measures for exploring interactions between Dutch actors participating in the online energy transition space. The core concepts of SNA (such as nodes, relations, ties and networks) can be used to describe and study online energy-related topics; by collecting relational data, it is possible to examine the topology of the underlying relational actors’ network and to infer knowledge on the actors’ characteristics and roles [42,46,47,48,49,50,51].
Web-based tools are usually applied to track and collect hyperlinks between websites for the construction of hyperlink networks [48,49,52]. Despite the advantages in terms of volume and accessibility of data, these data collection techniques present some limitations. One of these limitations is that the crawling parameters used by these search engines are undisclosed and researchers have no control over the hyperlink retrieval process [35]. Another limitation is that the analysis of the hyperlink network structure can only provide quantitative evidence of the communication processes, but it does not say anything about the content of such communications [53]. To overcome these limitations, this research combines a network approach with computational text analysis techniques, providing both information about the communication structure and the content of the communications.
Our methodology follows the behavior of the Internet users and it is anchored in the natural observation of the digital communication environment. More specifically, the hyperlink network is addressed as an object of study, as well as a source of data and a hermeneutical device. In so doing, we follow Rogers’ digital methods approach [54,55] which uses the epistemology of the Internet—its online groundedness—as methodological basis “in an effort to conceptualize research which follows the medium, captures its dynamics and makes grounded claims about cultural and societal change” [54] (p. 8).
1.3. Topic Modeling
Is it possible to extend the network approach to unveil the characteristics of the energy transition discourse in the sphere of web-communication? Many contributions from linguistics explored the relationships between concepts or meanings in a network [56,57,58], whereby each term or concept is represented by a node and the co-occurrence or logical proximity in a text acts as an edge. This method enables observing the extant semantic or logical affinity between nodes that are the underpinning clusters of concepts, characterized by a shared semantic background [59,60]. In this research, this technique is applied to unveil the topics involved in the energy transition process and reveal possible relations between topics in the actors’ discourse about the energy transition online.
The term topic model refers to a class of text analysis methods designed to encode the content of a text corpus. The core assumption of this methodology is that the meanings are relational ontologies, which depend on other linguistic signs to determine their nature [61]. Thus, a topic can be conceived as a recurring pattern of terms or a cluster of words characterized by high mutual co-occurrence. Unlike in traditional manual text encoding, in the automated encoding the topic generation process builds on probabilistic models to estimate the optimal number of topics and the distribution of these topics in the corpus.
In the last decade, machine-assisted text analysis tools have demonstrated to be an effective method to investigate topic probabilities distribution in the digital environment [62,63,64,65]. Text analysis on big data poses, on one hand, methodological challenges because each author of the documents refers to his representation of the phenomenon—the energy transition in this case—using his own vocabulary and writing style. On the other hand, as the textual data analyzed increases, the impact of the contributions of individual authors on the analysis gradually decreases. This reduces the uncertainties arising from stylistic and lexical variability, thus increasing the accuracy of the analysis. The computational approach to text analysis enables large amounts of data to be processed in very short timescales, enhancing the possibilities of studying socioeconomic phenomena on a large scale [66,67,68]. Properly employed, topic modeling provides time-efficient reading effort of the text and high substantive interpretability of the latent topics [69], while at the same time ensuring a lower impact of the biases derived from human coding. Thus, for the purpose of our research, we used the structural topic model (STM), a recent extension of the latent Dirichlet allocation (LDA) model that we explain next.
2. Materials and Methods
The exploration of the energy transition related contents in hyperlink networks poses many methodological challenges, especially concerning the retrieval of the data. Finding a representative sample of actors involved in this dynamic and rapidly expanding online communication process implies having access to a broad data source and the ability to distinguish between the actors that are involved in the energy transition process from those of the energy sector or adjacent markets. To meet these challenges, we adopted a mixed-method approach by combining social network analysis and computational textual analysis techniques in a three-step procedure (Figure 1).
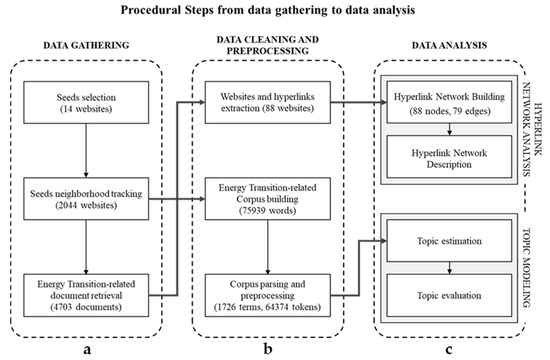
Figure 1.
Procedure designed to investigate the Dutch energy transition online debate. It revolves around three phases: (a) the data gathering phase, which includes, a snowball sampling of all websites connected to the seeds and the extraction of texts concerning the energy transition made by the sampled websites; (b) the data cleaning and preprocessing phase, aimed at filtering and preparing the data; (c) the data analysis phase, which combines social network analysis techniques and computational text analysis techniques.
To speed up the data collection process and make our methodology scalable to large amounts of data, we primarily used unsupervised or semi-supervised tools (see next section), both for textual contents and websites and hyperlink information.
2.1. Phase 1: Data Gathering
To collect data, we adopted two different sampling strategies; one aimed at identifying the Dutch actors and their links, and the other focused on collecting the content related to the energy transition created by these actors. To sample the actors, we used two sampling strategies: First, we employed a purposive sampling, also referred to as judgmental sampling or expert sampling. The main objective of a purposive sampling is to produce a sample based on expert knowledge of a population, which is selected in a non-random manner. By using this sampling strategy, we drew on the expertise of the project members to retrieve 14 seeds (see Table 1), covering a wide variety of key civil society actors with a stake in the Dutch energy transition.

Table 1.
List of seeds selected through the purposive sampling methodology.
We decided to use a purposive sampling because as Battaglia states this “is generally considered most appropriate for the selection of small samples often from a limited geographic area or from a restricted population definition, where inference to the population is not the highest priority” [70] (p. 525). Indeed, the relevance of these 14 seeds in the Dutch energy transition online space was cross validated by using Twitter data.
In order to enlarge the research sample, a snowball analysis procedure was applied [71,72]. The 14 seeds were used as a starting search criteria in the IssueCrawler, a web network location and visualization software, developed by the Social Media Foundation, which allows, given the web address of one or more websites, to track all other connected websites [73,74]. This crawler, after searching and extracting the websites connected with the seeds, tracks the hyperlinks occurring between them and returns all the web pages and hyperlinks retrieved. The snowball analysis consisted in a monthly collection of the data, from February 2019 to December 2019. The Issue Crawler crawled the specified 14 seed, captured the starting point outlinks of these seeds and retained them—one degree of separation. Indeed, a second and a third network collection were conducted at a two degrees of separation from the seeds (i.e., connected websites and the websites linked to them) to further expand the sample. Nevertheless, since in the third network collection (April 2019) no new websites were added to the sample, we decided to collect the subsequent networks by employing one degree of separation from our original 14 seeds.
The resulting dataset consisted of 2044 websites and 76,116 links. While considering the well-known homophily patterns that occur in directly connected network nodes [75,76,77,78], a large majority of our dataset included non-Dutch actors and actors not related to the energy transition. To filter these actors, all Dutch actors were identified. As inclusion rule, all the “.nl” websites were labeled as being Dutch websites. All non-country-specific extension (e.g., “.com”, “.org”, “.net”, etc.) which had a declared geographical position in The Netherlands on the Google search engine were included in the sample. As a result, the dataset was reduced to 145 actors and 156 hyperlinks (edges).
On the other hand, to collect the content related to the energy transition created by these 145 actors, a tool developed by the Social Media Foundation, the Lippmannian device [79] was used. This tool search, given a list of websites and one or multiple keywords, tracks all sentences containing the keywords from these sources. By using this tool, the Bing browser was queried for the keywords “energy transition” and its Dutch translation “energietransitie”. Then, each sentence containing these terms was retrieved and aggregated, together with the information on the source website. This procedure ended up with 4703 non-duplicated sentences created by 88 actors.
2.2. Phase 2: Data Cleaning and Preprocessing
The actor sub dataset was further cleaned through filtering the relation of the actors with the energy transition process. To do so, the information on the website source provided by the textual sampling phase was used. Only actors with at least one energy transition related content were included in the analysis. At the end of this procedure, a final dataset of 88 Dutch actors and their collection of sentences related to the energy transition was used as a sample in our analyses. To enrich our dataset 3 coders manually classified the type of organization found on the actor’s website. Each organization was classified in one of the mutually exclusive categories listed in Table 2.
Table 2.
Code numbers and categories applied for classifying the corpus. Descriptions adapted from Cambridge Dictionary (2020).
A first issue in the analysis of the collected textual data concerned its language of origin. For research purposes, all documents were translated into English using the cloud translation API [80] provided by Google. The 4703 sentences created by the actors were aggregated into a single corpus of 207,223 words. The distribution of the documents by type of organization (Figure 2) shows that private companies and associations are the organizations creating the largest number of documents (1700 and 1192, respectively). On the contrary, the average length of documents is almost homogeneous in each group, ranging between 256 and 299 characters.
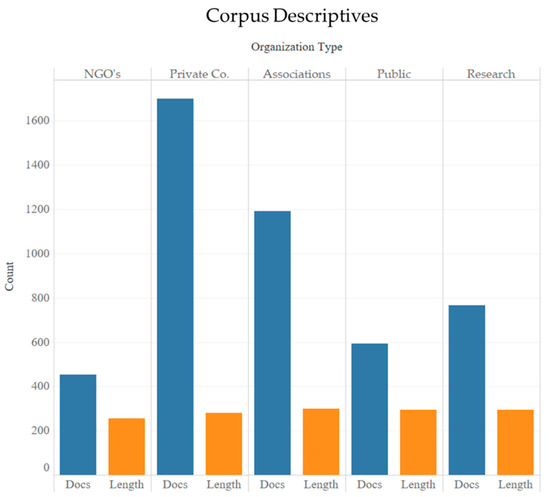
Figure 2.
Number of documents (Docs) collected and average length of the documents in characters (Length) by organization type.
Subsequently the corpus was cleaned and preprocessed according to the following procedure: each document was stemmed to reduce lexical variability. All the numeric characters, symbols, HTML tags and words with less than 3 characters were deleted from the corpus. Moreover, a list of 1063 stop words was removed from the corpus.
To focus the analysis on the most relevant words, all terms with frequency of occurrence in the corpus f < 5 were removed from the corpus. This procedure allowed to decrease further the lexical variability, with a little loss in terms of document inclusion since only 9 documents were excluded from the subsequent analysis (Figure 3).
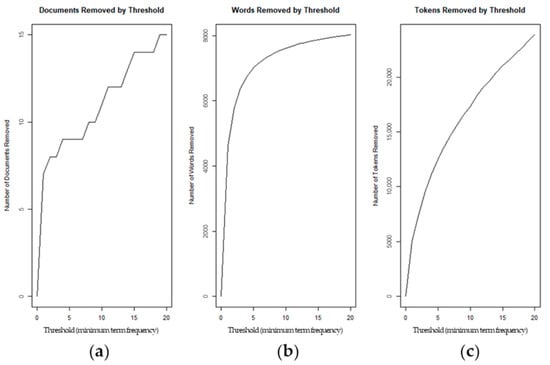
Figure 3.
PrepDocument function output (STM R package). (a) Number of documents removed by word-frequency threshold; (b) number of unique words removed by word-frequency threshold; (c) number of tokens removed by word-frequency threshold.
At the end of the cleaning phase, a total number of 1726 terms in 4693 documents were used for the topic model estimation.
2.3. Phase 3: Data Analysis
To explore the topics underlying the communications about energy transition we applied the procedure for the identification of the topics through the structural topic model.
LDA and STM
The latent Dirichlet allocation [81] is one of the most widely used probabilistic models for computational text analysis in social sciences and economics. Behind the algorithm’s generative process lays the assumption that each document can be modeled as a set of topics and that each topic can be modeled as a discrete distribution that defines the probability, for each word, to appear in a topic. Each document, intended as a bag-of-words (a set of terms having no semantic and syntactic complexity in which the position of the word in the text is irrelevant), is synthetically represented by the probability distribution of a K number of latent topics. Note that within an LDA model, the probability of observing a word in a particular position within a document is only a function of the topic and parameters of the model. More specifically, the LDA does not allow us to model changes in the estimation of topics and words within documents based on other relevant information, such as the time or the author of the documents. In order to provide a more accurate estimation of topics related to the energy transition process, this research uses an extension of the LDA, the structural topic model [82]. This model allows the use of metadata as parameters involved in the topic estimation [65], affecting its content (topical content) and proportion in the corpus (topical prevalence). In more detail, a data generative process is defined for each document. After this, the data are used to estimate the most likely values for the parameters in the model.
This process generates documents associated with metadata (Xd) starting from the distributions of documents (Dn), topics (Tn) and terms (Wn). As in the LDA, topics are defined as a mix of terms, where each term is associated with a specific probability of belonging to a topic; documents are defined as a mix of topics, implying the possibility of coexistence of multiple topics in a document.
Assuming that the type of organization promoting the communication could influence the issues discussed, we have included the variable “organization type” as a covariate in the model estimation. Since the STM is sensitive to initialization parameters, it was necessary to select in advance the number of topics to be extracted from the corpus. To reduce the arbitrariness of our choice, a procedure based on the work of Lee and Mimno [83] was adopted. Considering that the identification of the number of topics represents a partly discretionary choice, this procedure uses a data-driven approach to address this task. The procedure involves an interactive estimation of models to compare the fitness of different K parameter (the number of topics) settings. After an exploration of a wide range of model solutions, the interval K [10,20] was selected for a close exploration. The optimal number of topics to select was decided by taking into account the topic quality [82], a criterion based on the choice of the number of topics with the best ratio between two parameters:
- Semantic coherence [84], is part of the broader concept of mutual information. This metric, recognized as a reasonable surrogate to human coders judgement, presents higher scores for topics in which the most probable terms included have higher co-occurrence frequency within documents [85];
- Exclusivity refers to the specificity of the words associated with a topic. Topics can be considered exclusive if the most probable terms for a given topic are unlikely to appear within the most probable terms of other topics.
As stated by Schmiedel et al. “While semantic coherence focuses on the internal qualities of single topics, exclusivity takes the similarity between different topics of the same model into account” [86] (p. 18).
We opted for an optimal solution of K = 13 (Figure 4), a good compromise between exclusivity and semantic coherence. This parameter was used for the STM estimation.
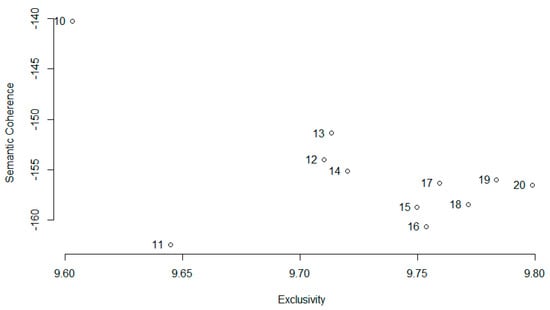
Figure 4.
Ratio plot of values of exclusivity and semantic coherence for different model solutions with K [10,20].
3. Results
A list of 14 seeds was used for a snowball sampling of Dutch actors engaged in the energy transition hyperlink-sphere. After a multistep cleaning and preprocessing procedure—both hyperlink network and text content—the topological characteristics of the networks and the main topics emerging in this relational space were analyzed.
3.1. The Hyperlink Network
Our results reveal the existence of a sparse network consisting of 88 nodes (actors) and 79 edges (hyperlinks). Table 3 below shows the descriptive statistics of this network, calculated by using the igraph package for R [87,88].
Table 3.
Network descriptive statistics 1.
Both the average path length and the clustering coefficient scores are quite small (2.482 and 0.043, respectively) suggesting that the network does not exhibit an heterogenous distribution of attributes over a wide spectrum [90,91].Thus, unlike many real networks, the nodes of the Dutch energy transition hyperlink network are rather isolated.
The network consists of 39 private companies, 25 associations, 10 NGOs, 8 research institutions and 6 public institutions. Cumulatively private companies and associations are the main creators of content about the energy transition, with 1700 and 1192 documents, respectively. Conversely, public institutions as RVO, Rijksoverheid and PBL and research institutions, as NVO and CE are the single major contributors (Figure 5). Topologically, the web-based communication structure of the energy transition revolves around few organizations acting as hubs of the network.
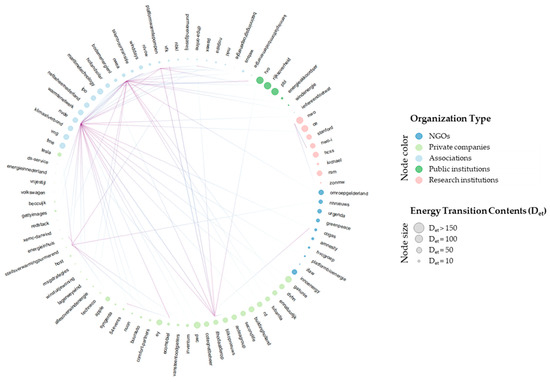
Figure 5.
Hierarchical edge bundling visualization of the hyperlink network. Nodes are actors grouped by organization type (node color); the node size is proportional to the number of energy transition related documents retrieved for each actor (node size). The edges, representing the hyperlinks, are directed from a source node (blue gradient) to a target node (red gradient).
Associations and private organizations are the most central players in the hyperlink network. Specifically, three associations (NVDE, NWEA and Netherlands Platform Warmtepompen) and two private companies (Itho Daalderop and Stadsverwarming Purmerend) have the highest scores of outdegree centrality (Figure 6), emerging as gatekeepers [92,93], i.e., actors that facilitate connections promoting links in the Dutch energy transition hyperlink network. In terms of indegree centrality, the most authoritative actors [24,41,42,94,95] are associations (NVDE, NWEA, Holland Solar, Dutch Heat Pump Association, BodemenergieNL), with the exception of RVO and Itho Daalderop, a public institution and a private company, respectively. Indeed, among the organization of the network, the indegree distribution is much more heterogenous, while the outdegree distribution shows a few highly connected nodes.
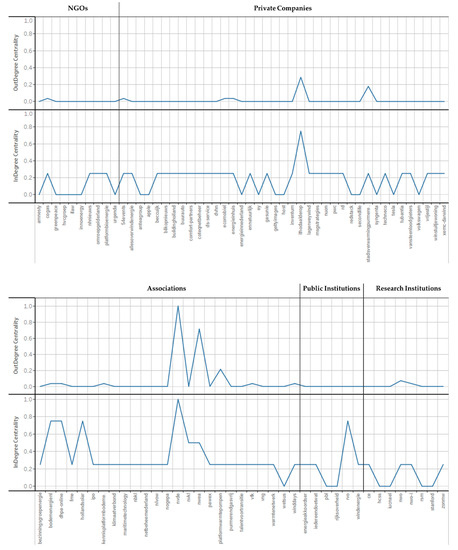
Figure 6.
Outdegree and indegree centrality of the actors in the hyperlink network. Centrality measures are standardized on a 0 to 1 scale.
These nodes, namely NWEA, NVDE and to a lesser extent Itho Daalderop and Stadsverwarming Purmerend, are also hubs for incoming hyperlinks, suggesting that being active in linking other nodes pays off in terms of reciprocal connections. Nevertheless, some associations such as RVO, BodemenergieNL, Daalderop, Hollandsolar, despite their low or inexistent linking activity (low outdegree), still receive much attention (high indegree) from the other nodes of the network.
3.2. The Structural Topic Model (STM)
Based on the most recurring terms and looking at the most representative documents, two coders assigned a label summarizing the main argument of each of topic (Table 4).
Table 4.
List of the latent topics extracted via STM. Based on the most recurring terms (right column) and looking at the most representative documents, a brief label was provided for each topic (left column).
“The Employment Implications of the Green” and “The Natural Gas Alternative” are the most relevant topic with 11.26% and 11.12% of frequency in the corpus (topical prevalence), respectively (Figure 7); the other most represented topics are “Policy Making for Climate“ and “The Heating Market” with a topical prevalence 10.49% and 9.12%, respectively. On the other side of the spectrum, “The Solar Energy Sector”, “Academy and Research Progress” and “Smart Cities and Energy Grid”, are the least addressed topics in the corpus, with a prevalence of 5.68%, 5.60% and 4.05%, respectively.
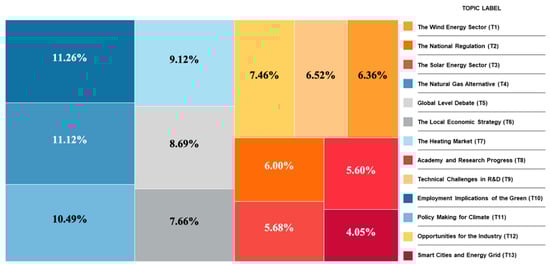
Figure 7.
Topic prevalence: the proportion (converted to%) of each of the 13 topics in the corpus. On the right side, a caption with the topic number (T) and the corresponding label.
To investigate the overlapping relationships between the topics in terms of topic co-existence in the corpus documents, a partial correlation matrix of the prevalence scores was calculated. Using the technique described in Epskamp & Fried [96], we built a sparse graph where each topic represents a node and each link is a significant correlation (ρ < 0.01) within a pair of nodes (Figure 8).
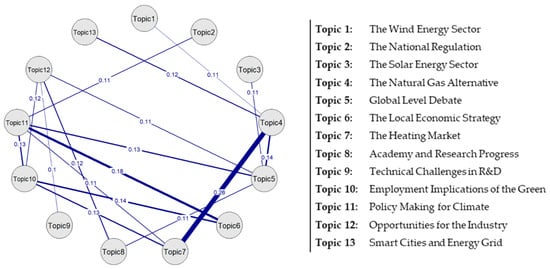
Figure 8.
Partial correlation graph of the topics. Edge thickness is proportional to the correlation scores (edge labels).
The strongest association emerges between the topics “The Natural Gas Alternative” and “The Heating Market” with a positive correlation of 0.26. Topic 11, “Policy Making for Climate” and “The local economic strategy”, have the second strongest association, with a correlation of r = 0.18. Other weaker correlations occur between Topic 11 and, respectively, Topic 5 (“Global level debate”, r = 0.13) and Topic 10 (“Employment Implications of Green”, r = 0.13). Topic 10, “Employment Implications of the Green”, is, in turn, weakly correlated with Topic 6 (“The local economic strategy”, r = 0.14) and Topic 7 (“The Heating Market”, r = 0.13), while Topic 5 shows a weak positive correlation with Topic 4: “The Natural Gas Alternative”. Topologically, “ Policy Making for Climate” and “Global level debate” are the most connected topics, while, remarkably, the “Technical challenges in R&D” together with the “Wind Energy Sector” and the “Solar Energy” are loosely connected.
Connections (edges) in topic-analysis highlight the extent of document contents overlap. Most connected topics are thus able to inbreed information through documents (websites) belonging to actors of different backgrounds. To understand the hierarchical structure of such interbreeding and how topics group around shared issues, a hierarchical clustering analysis was carried out. To do so, we used the R package stmCorrViz [82,97]. At the first level of clustering, STM topics tend to be grouped in 5 groups as shown in Table 5.
Table 5.
Hierarchical clustering of the latent topics. Topics are grouped in five clusters which are included in two main groups: Cluster Group I comprises Topics 1, 2, 6, 10 and 11. Cluster Group II comprises Topics 3, 4, 5, 7, 8, 9, 12 and 13. Next to each cluster, the most representative terms are reported.
Topic 1 and Topic 10, referring to “The Wind Energy Sector” and “Employment Implications of Green” group together around the terms “wind”, “cooperate”, “build”, “people”, “project”, “work”, “municipality”, representative terms of cluster Ia. The thematic link between Topic 6 and Topic 11, previously highlighted by the correlation graph, is reflected in the hierarchical correlation analysis, where the relationship between climate politics and local economic strategies is made clear in cluster Ib, through the terms “policy”, “agreement”, “region”, “climate”, “achieve”, “government”, “invest”. As expected, the intuitive association between “The Natural Gas Alternative” (Topic 4) and “The Heating Market” (Topic 7) is confirmed by the analysis and represented by the cluster IIa through the terms, “transport”, “nature”, “supply”, “source”, “heat”, “network”, “gas”. Another intuitive association, the one between Topic 8 and Topic 9, respectively “Academy and Research Progress” and “Technical challenges in R&D”, is confirmed and summarized by cluster IIb through the terms “technology”, “vision”, “develop”, “solution”, “environment”, “innovation”, “challenge”. Finally, the cluster IIc (“electricity”, “city”, “smart”, “storage”, “grid”, “environment”, “solar”) groups together the themes concerning “The Solar Energy Sector” and “Smart Cities and Energy Grid”.
Moreover, these first-level clusters can be aggregated into 2 macrogroups, cluster I and cluster II strongly characterized at a thematic level; cluster I, which comprises Topics 1, 2, 6, 10, 11, appears to focus on aspects of local, national and global policies and governance, as suggested by its characteristic terms: “government”, “work”, “project”, “agreement”, “municipality”, “policy”, “climate”. In contrast, cluster II, which comprises Topics 3, 4, 5, 7, 8, 9, 12, 13, focuses on technology development, research, industry and emphasizes terms such as “renew”, “electricity”, “gas”, “network”, “develop”, “technology”, “heat”.
Hoping to gain a better understanding of the relation between the type of organization and the topics discussed in the Dutch energy transition hyperlink network, we calculated the estimated differences in topic proportion between the 5 types of organizations. Figure 9 shows the results of the effect of the type of organization on the topical corpus prevalence. The 8 topics with higher estimated differences per organization-type level are shown.
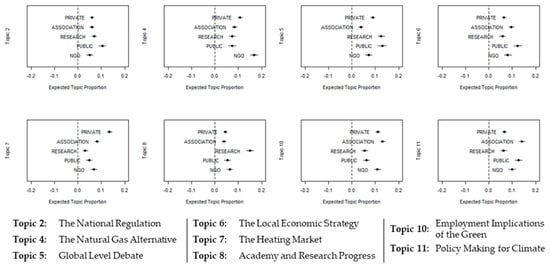
Figure 9.
Expected topic proportion by organization type of 8 topics. Point estimate shows the estimated differences in topic proportion between the five type of organizations.
The agenda of public institutions seems to be set on topics related to “The National Regulation” (Topic 2), “Global level debate” (Topic 5), “The local economic strategy” (Topic 6), “Policy Making for Climate” (Topic11). Indeed, our results show that some issues of paramount social relevance regarding the impact of energy transition on employment and research—represented by Topic 10, “Employment Implications of the Green” and Topic 8, “Academy and Research Progress”—are under-represented in the discussions of the public institutions.
Dutch associations contribute extensively to the communication on the aspects of local economic strategy adjustment (Topic 6). In addition, they seem to extensively discuss issues related to employment and climate policy (Topic 10 and Topic 11). Similarly, NGOs contribute to the communication on Topic 10, but their contributions seem to revolve around natural energy resources, “The Natural Gas Alternative” (Topic 4). As for the communication agenda of the research institutions, they seem to be limited to aspects of scientific progress (Topic 8) and its global impact (Topic 5). Moreover, the core topics discussed by private organizations concerns “The Heating Market” and the energy supply (Topic 4), although the contribution made by private companies to the debate on “Employment Implications of the Green” is also significant (Topic 10). For details on the marginal topic proportion of each of the covariate level on each Topic see the Appendix A.
4. Discussion
This study shows that the online discourse about the energy transition in The Netherlands is led by a relatively small number of actors. Among these actors, most of the contributions to the energy transition debate come from private companies and associations. Remarkably, none of the hundreds of energy cooperatives in The Netherlands, one of the largest communities in Europe, was collected through the snowball sampling, suggesting that these are either absent from the energy transition online space or disconnected from the actors collected via our methodology.
As for the structure of the hyperlink network, the actors seem to weave a sparse network. However, as highlighted by Park & Thelwall [35], a low network density and the absence of small world properties in hyperlink networks is quite frequent within the World Wide Web [98,99].
Moreover, since the energy transition process is characterized by strong innovation and structural changes, a low cohesion within actor groups (organization types) could reflect an adaptive need of the actors themselves [100]. In fact, as pointed by Gargiulo [101], high cohesion within groups can affect organization adaptation to significant changes in the environment. On the contrary, poor cohesion between actor groups is often seen as an obstacle to change and innovation. When this is the case, Newman suggests that it is desirable for public institutions to act as brokers between the various group of actors in the network.
In the hyperlink network of the Dutch energy transition, the organizations occupying a seemingly brokerage position are mainly associations and private companies (outdegree centrality). In fact, among all the public institutions, only RVO seems to play a brokerage role.
Moreover, together with associations such as Holland Solar, DHPA, NVDE and the Private company, Itho Daalderop, RVO is also the only public institution to be considered authoritative (indegree centrality) in the Dutch energy transition hyperlink network. This strong centrality of the associations in the Dutch network seems to be in line with a context which, as defined by Kemp [21], is characterized by a pronounced corporatism.
As for the topics discussed in the network, our analyses reveal the existence of 13 topics. Not surprisingly, “The Natural Gas Alternative” and the “The Heating Market” are two of the most relevant discussion topics. Despite the renewable energy target goal—of 32% of total energy sources by 2030 [74]—set in the regulatory framework “Clean Energy for All Europeans” (adopted in 2016), The Netherlands remains the second largest European producer of natural gas. This is partially due to the substantial fossil resources the country possesses [102]. Indeed, the natural gas is still the primary source of energy for heating Dutch houses [103].
Particularly relevant in the Dutch energy transition debate are the implications of the energy transition for the job market. The prominence of this issue highlights the real concerns of employers towards international regulations (Topic 11) and the resulting national economic strategies (Topic 6) for a “cleaner” industrial sector (Topic 12). These concerns have often generated frictions, as in October 2018, when the employer association VNO-NCW blocked the introduction of a national CO2 levy for the industrial sector [104].
The links among these issues, clearly emerged in the topic correlation graph, reflects the search for a better balance between policy making and economic production background.
In fact, the 13 topics tend to collapse into two macro-themes, (a) topics related to governance of local, national and global policies and (b) topics related to technological development aspects of the energy transition process.
It is also possible to observe substantial differences in the communication agendas of the organizations of the Dutch energy transition hyperlink network. Public institutions focus, for instance, on global, national and local policy issues and seem not to pay much attention to the research and employment implications of the energy transition. On the other hand, private companies, associations and NGOs pay much attention to the employment issues; the web-based communication promoted by research institutions is mainly self-referential, focusing on the academic sphere and the scientific progresses.
The failure of research and public institutions to address the issue of employment is a warning signal for the whole community involved in the energy transition process and, in particular, for those actors with a major (political) responsibility. While academics and public institutions succeed in connecting, in terms of topic contents with the corporate world, they seem to fail embracing the communication with the rest of society, represented in our network by associations and NGOs.
5. Conclusions
The aim of this study was to reveal the main actors of the Dutch energy transition hyperlink network and find the topics discussed in the network.
Our results show that few companies and associations emerge as the most authoritative actors and brokers in the network. Moreover, our topic model reveals that the ‘Employment Implications’ and the ‘Natural Gas’ are the two most discussed topics in the Dutch energy transition hyperlink network. In addition, our analyses reveal substantial differences among the communication agendas of the organizations of the Dutch energy transition hyperlink network; while public institutions focus on global, national and local policy issues, private companies, associations and NGOs pay much more attention to employment issues.
The path toward a low-carbon economy and a more sustainable society, for long and difficult that it may be, requires a cohesion of action, unseen in the hierarchical Dutch energy transition hyperlink network. In this network, some actors (e.g., public and research institutions) seem to be confined in communication echo chambers, revolving around discussions about the global aspects of the energy transition and its technological specificities and appear to fail to semantically interact with other actors, such as associations and NGOs, whose discourse revolve around the consequences for the employment of the energietransitie and its impact at a local level. A possible explanation for this to happen is the tendency of public institutions to focus on the regulatory aspects of the energy transition at a national level and at a supranational level, while failing to coordinate the debate on major social issues, such as the employment implications of the energy transition. Similarly, research institutions seem to fail in bridging the academic realm with the broader social landscape.
A higher centrality of Political Institutions in the Dutch energy transition hyperlink network, ideally supported by research institutions, could potentially lead to a wider integration of the local instances—e.g., NGOs-, while allowing a wider and more representative vision of the ongoing transition process.
Author Contributions
This article was written by N.L., M.E.D.V. and F.R. Funding acquisition and data collection by M.E.D.V.; methodology, data curation, formal analysis and writing—original draft preparation by N.L. The manuscript was reviewed, edited and revised by M.E.D.V. and F.R. All authors have read and agreed to the published version of the manuscript.
Funding
This research was funded by the NWO Sociale en Geesteswetenschappen (KI.18.015) Project: “Mapping the Ecologies of the energy transition Debate in the Dutch Digital Public Space”-PI: Marc Esteve Del Valle.
Acknowledgments
We would like to thank Tom Batens (EMMA) and Arnout Ponsioen (ANNE) for their collaboration in the ‘Mapping The Ecologies of the energy transition Debate in the Dutch Digital Public Space’ project and Karina Bergt (student at the Center for Media and Journalism Studies, University of Groningen, The Netherlands) for supporting the authors in the coding process.
Conflicts of Interest
The authors declare no conflict of interest.
Appendix A
Table A1.
Effect of the “organization type” covariate on the 13 topics. Table reports the estimated effect (ESTIMATE), of each level of the covariate (COV_LEVEL), the standard error (STD.ERROR) and lower and upper end of the 95% confidence interval (CI.LOWER and CI.UPPER).
Table A1.
Effect of the “organization type” covariate on the 13 topics. Table reports the estimated effect (ESTIMATE), of each level of the covariate (COV_LEVEL), the standard error (STD.ERROR) and lower and upper end of the 95% confidence interval (CI.LOWER and CI.UPPER).
| TOPIC | COV_LEVEL | ESTIMATE | STD.ERROR | CI.LOWER | CI.UPPER |
|---|---|---|---|---|---|
| 1 | Private | 0.067 | 0.004 | 0.059 | 0.075 |
| 1 | Association | 0.076 | 0.005 | 0.065 | 0.087 |
| 1 | Research | 0.076 | 0.007 | 0.063 | 0.091 |
| 1 | Public | 0.064 | 0.007 | 0.050 | 0.079 |
| 1 | NGO | 0.067 | 0.007 | 0.053 | 0.080 |
| 2 | Private | 0.061 | 0.004 | 0.053 | 0.069 |
| 2 | Association | 0.060 | 0.005 | 0.050 | 0.070 |
| 2 | Research | 0.069 | 0.006 | 0.057 | 0.081 |
| 2 | Public | 0.105 | 0.008 | 0.089 | 0.119 |
| 2 | NGO | 0.050 | 0.007 | 0.037 | 0.064 |
| 3 | Private | 0.071 | 0.005 | 0.062 | 0.081 |
| 3 | Association | 0.052 | 0.005 | 0.042 | 0.063 |
| 3 | Research | 0.083 | 0.006 | 0.070 | 0.095 |
| 3 | Public | 0.053 | 0.007 | 0.041 | 0.067 |
| 3 | NGO | 0.057 | 0.007 | 0.044 | 0.070 |
| 4 | Private | 0.107 | 0.005 | 0.098 | 0.118 |
| 4 | Association | 0.084 | 0.005 | 0.073 | 0.095 |
| 4 | Research | 0.074 | 0.007 | 0.061 | 0.088 |
| 4 | Public | 0.073 | 0.008 | 0.058 | 0.089 |
| 4 | NGO | 0.168 | 0.008 | 0.151 | 0.183 |
| 5 | Private | 0.088 | 0.005 | 0.079 | 0.098 |
| 5 | Association | 0.039 | 0.005 | 0.030 | 0.048 |
| 5 | Research | 0.126 | 0.008 | 0.111 | 0.140 |
| 5 | Public | 0.129 | 0.009 | 0.111 | 0.146 |
| 5 | NGO | 0.072 | 0.007 | 0.059 | 0.086 |
| 6 | Private | 0.064 | 0.004 | 0.056 | 0.072 |
| 6 | Association | 0.096 | 0.005 | 0.085 | 0.107 |
| 6 | Research | 0.058 | 0.006 | 0.045 | 0.070 |
| 6 | Public | 0.122 | 0.008 | 0.107 | 0.138 |
| 6 | NGO | 0.081 | 0.007 | 0.066 | 0.096 |
| 7 | Private | 0.135 | 0.005 | 0.125 | 0.145 |
| 7 | Association | 0.081 | 0.005 | 0.071 | 0.092 |
| 7 | Research | 0.032 | 0.006 | 0.021 | 0.043 |
| 7 | Public | 0.048 | 0.007 | 0.035 | 0.061 |
| 7 | NGO | 0.068 | 0.007 | 0.053 | 0.082 |
| 8 | Private | 0.045 | 0.004 | 0.037 | 0.053 |
| 8 | Association | 0.039 | 0.005 | 0.030 | 0.048 |
| 8 | Research | 0.150 | 0.008 | 0.134 | 0.164 |
| 8 | Public | 0.053 | 0.006 | 0.040 | 0.066 |
| 8 | NGO | 0.063 | 0.007 | 0.050 | 0.076 |
| 9 | Private | 0.066 | 0.005 | 0.057 | 0.075 |
| 9 | Association | 0.073 | 0.005 | 0.062 | 0.083 |
| 9 | Research | 0.084 | 0.007 | 0.072 | 0.098 |
| 9 | Public | 0.073 | 0.007 | 0.060 | 0.085 |
| 9 | NGO | 0.059 | 0.007 | 0.046 | 0.072 |
| 10 | Private | 0.111 | 0.005 | 0.101 | 0.120 |
| 10 | Association | 0.131 | 0.006 | 0.120 | 0.143 |
| 10 | Research | 0.054 | 0.006 | 0.042 | 0.067 |
| 10 | Public | 0.063 | 0.007 | 0.049 | 0.076 |
| 10 | NGO | 0.110 | 0.008 | 0.095 | 0.125 |
| 11 | Private | 0.067 | 0.005 | 0.058 | 0.076 |
| 11 | Association | 0.141 | 0.006 | 0.128 | 0.153 |
| 11 | Research | 0.062 | 0.007 | 0.050 | 0.075 |
| 11 | Public | 0.127 | 0.008 | 0.111 | 0.143 |
| 11 | NGO | 0.099 | 0.008 | 0.084 | 0.114 |
| 12 | Private | 0.069 | 0.005 | 0.060 | 0.078 |
| 12 | Association | 0.097 | 0.005 | 0.086 | 0.108 |
| 12 | Research | 0.101 | 0.007 | 0.087 | 0.114 |
| 12 | Public | 0.046 | 0.007 | 0.033 | 0.059 |
| 12 | NGO | 0.060 | 0.007 | 0.047 | 0.074 |
| 13 | Private | 0.048 | 0.003 | 0.043 | 0.054 |
| 13 | Association | 0.032 | 0.003 | 0.027 | 0.037 |
| 13 | Research | 0.030 | 0.003 | 0.023 | 0.036 |
| 13 | Public | 0.044 | 0.004 | 0.036 | 0.053 |
| 13 | NGO | 0.047 | 0.005 | 0.039 | 0.056 |
References
- Fattouh, B.; Poudineh, R.; West, R. The Rise of Renewables and Energy Transition: What Adaptation Strategy Exists for Oil Companies and Oil-Exporting Countries? Energy Transit. 2019, 3, 45–58. [Google Scholar] [CrossRef]
- Smil, V. World History and Energy. Encycl. Energy 2004, 6, 549–561. [Google Scholar]
- Smil, V. Energy in Nature and Society: General Energetics of Complex. Systems; MIT Press: Cambridge, MA, USA, 2008. [Google Scholar]
- BP Energy Outlook 2019 Edition. Available online: https://www.bp.com/content/dam/bp/en/corporate/pdf/energy-economics/energy-outlook/bp-energy-outlook-2018.pdf (accessed on 5 July 2020).
- Electric Vehicle Market Growth, Industry Trends, and Statistics by 2030 | COVID-19 Impact Analysis | MarketsandMarkets. Available online: https://www.marketsandmarkets.com/Market.-Reports/electric-vehicle-market-209371461.html (accessed on 5 July 2020).
- Van der Waal, E.C.; Van der Windt, H.J.; Van Oost, E.C. How Local Energy Initiatives Develop Technological Innovations: Growing an Actor Network. Sustainability 2018, 10, 4577. [Google Scholar] [CrossRef]
- Sovacool, B.K.; Geels, F.W. Further Reflections on the Temporality of Energy Transitions: A Response to Critics. Energy Res. Soc. Sci. 2016, 22, 232–237. [Google Scholar] [CrossRef]
- Alcorn, P.A. Social Issues in Technology: A Format for Investigation, 4th ed.; Prentice-Hall: Upper Saddle River, NJ, USA, 2003. [Google Scholar]
- Assefa, G.; Frostell, B. Social Sustainability and Social Acceptance in Technology Assessment: A Case Study of Energy Technologies. Technol. Soc. 2007, 29, 63–78. [Google Scholar] [CrossRef]
- Huijts, N.M.A.; Molin, E.J.E.; Steg, L. Psychological Factors Influencing Sustainable Energy Technology Acceptance: A Review-Based Comprehensive Framework. Renew. Sustain. Energy Rev. 2012, 16, 525–531. [Google Scholar] [CrossRef]
- Huijts, N.M.; Molin, E.J.E.; Chorus, C.G.; Van Wee, B. Public Acceptance of Hydrogen Technologies in Transport: A Review of and Reflection on Empirical Studies. In Transition towards Sustainable Mobility: The Role of Instruments, Individuals and Institutions; Geerlings, H., Shiftan, Y., Stead, D., Eds.; Ashgate: Hampshire, UK, 2012. [Google Scholar]
- Upham, P.; Oltra, C.; Boso, À. Towards a Cross-Paradigmatic Framework of the Social Acceptance of Energy Systems. Energy Res. Soc. Sci. 2015, 8, 100–112. [Google Scholar] [CrossRef]
- Bonacich, P. Power and Centrality: A Family of Measures. Am. J. Sociol. 1987, 92, 1170–1182. [Google Scholar] [CrossRef]
- Wasserman, S.F.; Faust, K.K. Social Network Analysis: Methods and Applications, Wasserman Social Network Analysis: Methods and Applications 1994; Cambridge University Press: New York, NY, USA, 1994. [Google Scholar]
- Everett, M.G.; Borgatti, S.P. Extending Centrality. In Models and Methods in Social Network Analysis; Carrington, P.J., Scott, J., Wasserman, S., Eds.; Cambridge University Press: Cambridge, UK, 2005. [Google Scholar]
- Kaiser, J.; Rhomberg, M.; Maireder, A.; Schlögl, S. Energiewende’s Lone Warriors: A Hyperlink Network Analysis of the German Energy Transition Discourse. Media Commun. 2016, 4, 18. [Google Scholar] [CrossRef]
- Williams, H.T.; McMurray, J.R.; Kurz, T.; Lambert, F.H. Network Analysis Reveals Open Forums and Echo Chambers in Social Media Discussions of Climate Change. Glob. Environ. Chang. 2015, 32, 126–138. [Google Scholar] [CrossRef]
- Elmer, G. Mapping the Cyber-Stakeholders: US Energy Policy on the Web. Commun. Rev. 2006, 9, 297–320. [Google Scholar] [CrossRef]
- Rogers, R.; Marres, N. Landscaping Climate Change: A Mapping Technique for Understanding Science and Technology Debates on the World Wide Web. Public Underst. Sci. 2016, 9. [Google Scholar] [CrossRef]
- Cody, E.M.; Reagan, A.J.; Mitchell, L.; Dodds, P.S.; Danforth, C.M. Climate Change Sentiment on Twitter: An Unsolicited Public Opinion Poll. PLoS ONE 2015, 10, e0136092. [Google Scholar] [CrossRef]
- Niederer, S. ‘Global Warming Is Not a Crisis!’: Studying Climate Change Skepticism on the Web. NECSUS Eur. J. Media Stud. 2013, 2, 83–112. [Google Scholar] [CrossRef]
- Shi, W.; Fu, H.; Wang, P.; Chen, C.; Xiong, J. Climatechange vs. Globalwarming: Characterizing Two Competing Climate Discourses on Twitter with Semantic Network and Temporal Analyses. Int. J. Environ. Res. Public Health 2020, 17, 1062. [Google Scholar] [CrossRef] [PubMed]
- Himelboim, I.; McCreery, S.; Smith, M. Birds of a Feather Tweet Together: Integrating Network and Content Analyses to Examine Cross-Ideology Exposure on Twitter. J. Comput. Mediat. Commun. 2013, 18, 154–174. [Google Scholar] [CrossRef]
- Park, H.W. Hyperlink Network Analysis: A New Method for the Study of Social Structure on the Web. Connections 2003, 25, 49–61. [Google Scholar]
- Pearce, W.; Niederer, S.; Özkula, S.M.; Sánchez Querubín, N. The Social Media Life of Climate Change: Platforms, Publics, and Future Imaginaries. Wiley Interdiscip. Rev. Clim. Chang. 2019, 10, e569. [Google Scholar] [CrossRef]
- Smith, A.; Kern, F. The Transitions Storyline in Dutch Environmental Policy. Environ. Politics 2009, 18, 78–98. [Google Scholar] [CrossRef]
- Laes, E.; Gorissen, L.; Nevens, F. A Comparison of Energy Transition Governance in Germany, The Netherlands and the United Kingdom. Sustainability 2014, 6, 1129–1152. [Google Scholar] [CrossRef]
- van Economische Zaken, M. Innovatie in Het Energiebeleid. In Energietransitie: Stand van Zaken en Het Vervolg; Ministry of Economic Affairs: Den Haag, The Netherlands, 2004; Volume 27, Available online: https://books.google.com.ph/books/about/Innovatie_in_het_energiebeleid.html?id=syLwNwAACAAJ&redir_esc=y (accessed on 5 July 2020).
- Kemp, R.; Rotmans, J. Transitioning Policy: Co-Production of a New Strategic Framework for Energy Innovation Policy in The Netherlands. Policy Sci. 2009, 42, 303. [Google Scholar] [CrossRef]
- Geels, F.W. Technological Transitions and System Innovations: A Co-Evolutionary and Socio-Technical Analysis; Edward Elgar Publishing: Cheltenham, UK, 2005. [Google Scholar]
- Kemp, R. The Dutch Energy Transition Approach. Int. Econ. Econ. Policy 2010, 7, 291–316. [Google Scholar] [CrossRef]
- Singh, H.V.; Bocca, R.; Gomez, P.; Dahlke, S.; Bazilian, M. The Energy Transitions Index: An Analytic Framework for Understanding the Evolving Global Energy System. Energy Strategy Rev. 2019, 26, 100382. [Google Scholar] [CrossRef]
- Energy Transition Index Ranking. Available online: https://reports.weforum.org/fostering-effective-energy-transition-2019/energy-transition-index/energy-transition-index-ranking (accessed on 5 July 2020).
- Nieuwenhuizen, T. Financial Risks Due to the Energy Transition: Insights from the Dutch Transport Sector. Master’s Thesis, Utrecht University, Utrecht, The Netherlands, 2019. [Google Scholar]
- Park, H.W.; Thelwall, M. Hyperlink Analyses of the World Wide Web: A Review. J. Comput. Mediat. Commun. 2003, 8, JCMC843. [Google Scholar] [CrossRef]
- Marres, N.; Rogers, R. Depluralising the Web, Repluralising Public Debate-the Case of the GM Food Debate on the Web. In Preferred Placement: Knowledge Politics on the Web; Rogers, R., Ed.; Jan van Eyck Editions: Maastricht, The Netherlands, 2000; pp. 113–136. [Google Scholar]
- Heimeriks, G.; van den Besselaar, P. Analyzing Hyperlinks Networks: The Meaning of Hyperlink Based Indicators of Knowledge Production. Int. J. Scientometr. Informetr. Bibliometr. 2006, 10, 1. [Google Scholar]
- Ackland, R.; O’neil, M. Online Collective Identity: The Case of the Environmental Movement. Soc. Netw. 2011, 33, 177–190. [Google Scholar] [CrossRef]
- Davenport, E.; Cronin, B. The Citation Network as a Prototype for Representing Trust in Virtual Environments. In The web of knowledge: A Festschrift in honor of Eugene Garfield; Information Today Inc.: Medford, NJ, USA, 2000; pp. 517–534. [Google Scholar]
- Park, H.W.; Kim, C.-S.; Barnett, G.A. Socio-Communicational Structure among Political Actors on the Web in South Korea: The Dynamics of Digital Presence in Cyberspace. New Media Soc. 2004, 6, 403–423. [Google Scholar] [CrossRef]
- Kleinberg, J.M. Authoritative Sources in a Hyperlinked Environment. In Proceedings of the Ninth Annual ACM-SIAM Symposium on Discrete Algorithms; Society for Industrial and Applied Mathematics: Philadelphia, PA, USA, 1998; pp. 668–677. Available online: https://dl.acm.org/doi/abs/10.5555/314613.315045 (accessed on 5 July 2020).
- Kleinberg, J.M. Authoritative Sources in a Hyperlinked Environment. J. ACM 1999, 46, 604–632. [Google Scholar] [CrossRef]
- Garton, L.; Haythornthwaite, C.; Wellman, B. Studying Online Social Networks. J. Comput. Mediat. Commun. 1997, 3, JCMC313. [Google Scholar] [CrossRef]
- Adamic, L.A.; Huberman, B.A.; Barabási, A.L.; Albert, R.; Jeong, H.; Bianconi, G. Power-Law Distribution of the World Wide Web. Science 2000, 287, 2115. [Google Scholar] [CrossRef]
- Haythornthwaite, C. Social Network Analysis: An Approach and Technique for the Study of Information Exchange. Libr. Inf. Sci. Res. 1996, 18, 323–342. [Google Scholar] [CrossRef]
- Halavais, A. National Borders on the World Wide Web. New Media Soc. 2000, 2, 7–28. [Google Scholar] [CrossRef]
- Henzinger, M.R. Hyperlink Analysis for the Web. IEEE Internet Comput. 2001, 5, 45–50. [Google Scholar] [CrossRef]
- Park, H.W.; Barnett, G.A.; Kim, C.-S. Political Communication Structure in Internet Networks: A Korean Case. Sungkok Journal. Rev. 2000, 11, 67–89. [Google Scholar]
- Gardner, I. Exploring the World Anti-Wind Farm Movement: A Hyperlink Network Analysis. Bang. Univ. Menai Pap. 2010, 2. Available online: http://www.bangor.ac.uk/so/research/documents/201002.pdf (accessed on 5 July 2020).
- Esteve Del Valle, M.; Borge Bravo, R. Leaders or Brokers? Potential Influencers in Online Parliamentary Networks. Policy Internet 2018, 10, 61–86. [Google Scholar] [CrossRef]
- Del Valle, M.E.; Bravo, R.B. Echo Chambers in Parliamentary Twitter Networks: The Catalan Case. Int. J. Commun. 2018, 12, 21. [Google Scholar]
- Baggio, R.; Scott, N.; Cooper, C. Network Science: A Review Focused on Tourism. Ann. Tour. Res. 2010, 37, 802–827. [Google Scholar] [CrossRef]
- Diesner, J.; Carley, K.M. A Methodology for Integrating Network Theory and Topic Modeling and Its Application to Innovation Diffusion. In Proceedings of the 2010 IEEE Second International Conference on Social Computing, Minneapolis, MN, USA, 20–22 August 2010; pp. 687–692. [Google Scholar]
- Rogers, R. The End of the Virtual: Digital Methods; Amsterdam University Press: Amsterdam, The Netherlands, 2009; Volume 339. [Google Scholar]
- Rogers, R. Digital Methods; MIT Press: Cambridge, MA, USA, 2013. [Google Scholar]
- Sowa, J.F. Semantic Networks. In Encyclopedia of Artificial Intelligence; Wiley and Sons: New York, NY, USA, 1987; pp. 1493–1511. [Google Scholar]
- Carley, K.M. Network Text Analysis: The Network Position of Concepts. In Text Analysis for the Social Sciences: Methods for Drawing Statistical Inferences from Texts and Transcripts; Lawrence Erlbaum: Mahwah, NJ, USA, 1997; Volume 4, pp. 79–100. [Google Scholar]
- Paranyushkin, D. Identifying the Pathways for Meaning Circulation Using Text Network Analysis. Nodus Labs 2011, 26. Available online: https://noduslabs.com/research/pathways-meaning-circulation-text-network-analysis (accessed on 5 July 2020).
- Tichy, N.M.; Tushman, M.L.; Fombrun, C. Social Network Analysis for Organizations. Acad. Manag. Rev. 1979, 4, 507–519. [Google Scholar] [CrossRef]
- Blei, D.M.; Lafferty, J.D. A Correlated Topic Model of Science. Ann. Appl. Stat. 2007, 1, 17–35. [Google Scholar] [CrossRef]
- de Saussure, F. Course in General Linguistics; Baskin, W., Ed.; Philosophical Library: New York, NY, USA, 1959. [Google Scholar]
- Turney, P.D.; Pantel, P. From Frequency to Meaning: Vector Space Models of Semantics. J. Artif. Intell. Res. 2010, 37, 141–188. [Google Scholar] [CrossRef]
- Mohr, J.W.; Bogdanov, P. Introduction—Topic Models: What They Are and Why They Matter; Elsevier: Amsterdam, The Netherlands, 2013. [Google Scholar]
- Roberts, M.E.; Stewart, B.M.; Tingley, D.; Airoldi, E.M. The Structural Topic Model and Applied Social Science. In Advances in Neural Information Processing Systems Workshop on Topic Models: Computation, Application, and Evaluation; Harrahs and Harveys, Lake Tahoe: Stateline, NV, USA, 2013; Volume 4. [Google Scholar]
- Roberts, M.E.; Stewart, B.M.; Airoldi, E.M. A Model of Text for Experimentation in the Social Sciences. J. Am. Stat. Assoc. 2016, 111, 988–1003. [Google Scholar] [CrossRef]
- Nassirtoussi, A.K.; Aghabozorgi, S.; Wah, T.Y.; Ngo, D.C.L. Text Mining for Market Prediction: A Systematic Review. Expert Syst. Appl. 2014, 41, 7653–7670. [Google Scholar] [CrossRef]
- Bholat, D.; Hansen, S.; Santos, P.; Schonhardt-Bailey, C. Text Mining for Central Banks. 2015. Available online: https://ssrn.com/abstract=2624811 (accessed on 5 July 2020).
- Eckley, P. Measuring Economic Uncertainty Using News-Media Textual Data. MPRA Paper No 64874. 2015. Available online: http://mpra.ub.uni-muenchen.de/64874 (accessed on 5 July 2020).
- DiMaggio, P.; Nag, M.; Blei, D. Exploiting Affinities between Topic Modeling and the Sociological Perspective on Culture: Application to Newspaper Coverage of US Government Arts Funding. Poetics 2013, 41, 570–606. [Google Scholar] [CrossRef]
- Battaglia, M.; Sampling, N.; Lavrakas, P.J. Nonprobability sampling. In Encyclopedia of Survey Research Methods; Sage: New York, NY, USA, 2008; pp. 523–526. [Google Scholar]
- Baltar, F.; Brunet, I. Social Research 2.0: Virtual Snowball Sampling Method Using Facebook. Internet Res. 2012, 22, 57–74. [Google Scholar] [CrossRef]
- Leventon, J.; Fleskens, L.; Claringbould, H.; Schwilch, G.; Hessel, R. An Applied Methodology for Stakeholder Identification in Transdisciplinary Research. Sustain. Sci. 2016, 11, 763–775. [Google Scholar] [CrossRef]
- Rogers, R. Mapping Public Web Space with the Issuecrawler. In Digital Cognitive Technologies; John Wiley & Sons, Ltd.: Hoboken, NJ, USA, 2013; pp. 89–99. [Google Scholar] [CrossRef]
- Rogers, R.; Salah, A.A.; Post-Doc, K.; Ben-David, A.; Post-Doc, N.W.O.; Gerlitz, C.; Rieder, B. Digital Methods Initiative. Retrieved Novemb. 2010, 30, 2011. [Google Scholar]
- Bae, S.; Choi, J.H. Cyberlinks between Human Rights NGOs: A Network Analysis. In Proceedings of the 58th Annual National Meeting of the Midwest Political Science Association, Palmer House Hilton, Chicago, IL, USA, 27–30 April 2000. [Google Scholar]
- Krebs, V. Working in the Connected World Book Network. Int. Assoc. Hum. Resour. Inf. Manag. J. 2000, 4, 87–90. [Google Scholar]
- McPherson, M.; Smith-Lovin, L.; Cook, J.M. Birds of a Feather: Homophily in Social Networks. Annu. Rev. Sociol. 2001, 27, 415–444. [Google Scholar] [CrossRef]
- Lauw, H.; Shafer, J.C.; Agrawal, R.; Ntoulas, A. Homophily in the Digital World: A LiveJournal Case Study. IEEE Internet Comput. 2010, 14, 15–23. [Google Scholar] [CrossRef]
- Tool Lippmannian Device. Available online: https://wiki.digitalmethods.net/Dmi/ToolLippmannianDevice (accessed on 5 July 2020).
- Cloud Translation Documentation | Google Cloud. Available online: https://cloud.google.com/translate/docs (accessed on 5 July 2020).
- Blei, D.M.; Ng, A.Y.; Jordan, M.I. Latent Dirichlet Allocation. J. Mach. Learn. Res. 2003, 3, 993–1022. [Google Scholar]
- Roberts, M.E.; Stewart, B.M.; Tingley, D. Stm: R Package for Structural Topic Models. J. Stat. Softw. 2014, 10, 1–40. [Google Scholar] [CrossRef]
- Mimno, D.; Lee, M. Low-Dimensional Embeddings for Interpretable Anchor-Based Topic Inference. In Proceedings of the 2014 Conference on Empirical Methods in Natural Language Processing (EMNLP), Doha, Qatar, 25–29 October 2014; pp. 1319–1328. [Google Scholar]
- Mimno, D.; Wallach, H.; Talley, E.; Leenders, M.; McCallum, A. Optimizing Semantic Coherence in Topic Models. In Proceedings of the 2011 Conference on Empirical Methods in Natural Language Processing, Edinburgh, UK, 27–31 July 2011; pp. 262–272. [Google Scholar]
- Roberts, M.E.; Stewart, B.M.; Tingley, D.; Lucas, C.; Leder-Luis, J.; Gadarian, S.K.; Albertson, B.; Rand, D.G. Structural Topic Models for Open-Ended Survey Responses. Am. J. Political Sci. 2014, 58, 1064–1082. [Google Scholar] [CrossRef]
- Schmiedel, T.; Müller, O.; vom Brocke, J. Topic Modeling as a Strategy of Inquiry in Organizational Research: A Tutorial with an Application Example on Organizational Culture. Organ. Res. Methods 2019, 22, 941–968. [Google Scholar] [CrossRef]
- Csardi, G.; Nepusz, T. The Igraph Software Package for Complex Network Research. InterJ. Complex Syst. 2006, 1695, 1–9. [Google Scholar]
- Csardi, M.G. Package ‘Igraph.’. Last Accessed 2013, 3, 2013. [Google Scholar]
- Fagiolo, G. Clustering in Complex Directed Networks. Phys. Rev. E 2007, 76, 026107. [Google Scholar] [CrossRef]
- Kochen, M. The Small World; Ablex Pub.: New York, NY, USA, 1989. [Google Scholar]
- Watts, D.J. Small-World Networks. In The Oxford Handbook of the Economics of Networks; Oxford University Press: Oxford, UK, 2016. [Google Scholar]
- Timur, S.; Getz, D. A Network Perspective on Managing Stakeholders for Sustainable Urban Tourism. Int. J. Contemp. Hosp. Manag. 2008, 20, 445–461. [Google Scholar] [CrossRef]
- Scott, J.; Carrington, P.J. The SAGE Handbook of Social Network Analysis; SAGE Publications: Thousand Oaks, CA, USA, 2011. [Google Scholar]
- Brin, S.; Page, L. The Anatomy of a Large-Scale Hypertextual Web Search Engine; Computer Networks: Amsterdam, The Netherlands, 1998; pp. 107–117. [Google Scholar]
- Borodin, A.; Roberts, G.O.; Rosenthal, J.S.; Tsaparas, P. Link Analysis Ranking: Algorithms, Theory, and Experiments. ACM Trans. Internet Technol. TOIT 2005, 5, 231–297. [Google Scholar] [CrossRef]
- Epskamp, S.; Fried, E.I. A Tutorial on Regularized Partial Correlation Networks. Psychol. Methods 2018, 23, 617. [Google Scholar] [CrossRef]
- Bostock, M.; Ogievetsky, V.; Heer, J.D. Data-Driven Documents. IEEE Trans. Vis. Comput. Graph. 2011, 17, 2301–2309. [Google Scholar] [CrossRef] [PubMed]
- Broder, A.; Kumar, R.; Maghoul, F.; Raghavan, P.; Rajagopalan, S.; Stata, R.; Tomkins, A.; Wiener, J. Graph Structure in the Web. Comput. Netw. 2000, 33, 309–320. [Google Scholar] [CrossRef]
- Meier, H. Global Civil Society from Hyperlink Perspective: Exploring the Website Networks of International NGOs. J. Contemp. East. Asia 2016, 15. [Google Scholar] [CrossRef]
- Newman, L.; Dale, A. The Role of Agency in Sustainable Local Community Development. Local Environ. 2005, 10, 477–486. [Google Scholar] [CrossRef]
- Gargiulo, M.; Benassi, M. Trapped in Your Own Net? Network Cohesion, Structural Holes, and the Adaptation of Social Capital. Organ. Sci. 2000, 11, 183–196. [Google Scholar] [CrossRef]
- Energy, Transport and Environment Indicators—2018 Edition. Available online: https://ec.europa.eu/eurostat/web/products-statistical-books/-/KS-DK-18-001 (accessed on 5 July 2020).
- Ministerie van Economische Zaken. Energy Report Transition to Sustainable Energy—Report. Available online: https://www.government.nl/documents/reports/2016/04/28/energy-report-transition-tot-sustainable-energy (accessed on 5 July 2020).
- Hofhuis, P.; van Schaik, P. Are the Dutch Going Green? Climate Politics in the Low Lands Heading towards Crunch Time. Available online: https://www.clingendael.org/sites/default/files/2019-01/PB_Are_the_Dutch_going_green.pdf (accessed on 5 July 2020).
© 2020 by the authors. Licensee MDPI, Basel, Switzerland. This article is an open access article distributed under the terms and conditions of the Creative Commons Attribution (CC BY) license (http://creativecommons.org/licenses/by/4.0/).