Article

How Circular Are the European Economies? A Taxonomic Analysis Based on the INEC (Index of National Economies’ Circularity)

Department of Economics and Agribusiness, University of Life Sciences in Lublin, Akademicka 13, 20-950 Lublin, Poland
Sustainability 2020, 12(18), 7613; https://doi.org/10.3390/su12187613
Submission received: 25 August 2020 / Revised: 10 September 2020 / Accepted: 14 September 2020 / Published: 15 September 2020
(This article belongs to the Collection Circular Economy and Sustainable Strategies)

Abstract

:
In this paper, the aggregate index of national economies’ circularity (INEC) was proposed and empirically verified. For this purpose, the taxonomic linear ordering method was used, which is a multi-criteria decision-making procedure. This method replaces the analysis of the phenomenon described by a set of indicators with an analysis using one aggregate indicator: the so-called ‘synthetic metric’. Based on 14 circular economy indicators that are available in the Eurostat database, the circularity indexes were constructed for 24 EU countries (including the United Kingdom). This allowed the author, on the one hand, to create a ranking of the countries, and on the other, to assign them to four groups, which were characterized by a similar level of circularity. This paper attempts to answer the following questions: how circular are the European economies? What are the main challenges in achieving circularity in Europe? Taking into account the INEC range [0,1], it should be noted that the level of circularity in the analysed European countries is low (an average of 0.3021). Therefore, the paper indicates the areas requiring improvement in this respect.

Graphical Abstract

1. Introduction

The concept of a ‘circular economy’ was first used in the literature by Pearce and Turner in 1990 [1]. Their publication, titled ‘Economics of Natural Resources and the Environment’, explains the process of transformation from a conventional (linear, open) to a circular economic system. A circular economy (CE) assumes the reduced consumption of raw materials, the design of products so that they can be easily disassembled and reused (eco-design), the extension of product life through maintenance and repairs, the use of secondary raw materials in products, and the recovery of raw materials from waste streams [2]. Over the past decade, the concept of CE has become one of the main topics of political and scientific discourse all over the world, and in particular in China and Europe [3,4].
The European Commission has adopted a new Circular Economy Action Plan, which is one of the main blocks of the European Green Deal [5], Europe’s new agenda for sustainable growth. The new Action Plan announces initiatives along the entire life cycle of products; for example, targeting their design, promoting circular economy processes, fostering sustainable consumption, and aiming to ensure that the resources used are kept in the EU economy for as long as possible [6,7].
Adherents of the concept claim that CE offers an innovative path towards sustainable development defined by the simultaneous achievement of economic results, social inclusion and environmental resistance, with benefits for the present and future generations [8]. According to the assumptions of a circular economy, reuse, regeneration and recycling are the preferred strategies for the maintenance of products in use [9].
Over the past decade, the number of publications dealing with circular economy has significantly increased. Related studies focused mainly on: the essence and origin of the concept of CE [10,11,12,13]; the barriers to and conditions of its implementation [4,14,15,16,17,18,19]; planning issues, including the formulation of a CE development strategy at various levels of management [4,11,14,18,20,21,22,23,24]; promoting good practices and models of CE implementation [13,14,23,25,26]; and comparing the circular economy with other social and economic concepts [12,13,27,28]. Particular attention was also devoted to issues of monitoring and evaluating the effects of a circular economy [14,29,30,31,32,33,34,35,36,37,38,39,40].
Along with the development of initiatives propagating circular economy, the question arose of how the progress and capacity of the undertaken activities should be measured. Reliable, correctly-selected and current data concerning CE is a significant element for shaping development strategies and using instruments boosting changes in that respect. It is difficult to create a uniform and, at the same time, comprehensive set of indicators to evaluate progress towards CE due to the complexity of the concept itself. Most authors agree that indicators must be based on strict criteria, repeatable, generally accepted and easy to understand [41,42].
Heshmati [14], using specific examples from China, indicates that—irrespective of the heterogeneity of enterprises, industries, regions and countries—separate sets of indicators must be developed at the micro, meso and macro levels, and within different areas of activity, including production, consumption, waste management and policy. The sets of indicators should take into account heterogeneity in different dimensions.
Saidani et al. [30], through a systematic review of literature, identified 55 different sets of circularity indicators designed by scientists, consulting companies and government agencies, taking into account different goals, scopes and potential applications. On these grounds, they proposed a comprehensive classification. In the designed taxonomy, covering 10 categories, the indicators were ordered according to criteria such as, for example: the CE implementation level (e.g., micro, meso, macro), the type of processes (maintenance, reuse, remanufacture, recycle), the prospect of circularity (actual, potential) and the degree of their cross-functionality (general, sectoral).
The European Commission [43] designed a set of indicators covering four core areas of activity: production and consumption; waste management; secondary raw materials; and competitiveness and innovativeness. Further detailed indicators were identified in those groups. The list was designed to capture the main elements of a circular economy. It makes use of the available data, whilst at the same time identifying areas in which new indicators must be developed, in particular to the extent of green public procurement and food waste. Each indicator can be interpreted individually, but such an interpretation does not provide grounds for a general assessment of the CE level in the respective country. Moraga et al. [32] expressed a similar opinion, proposing a classification of circular economy indicators according to reasoning of ‘what’ (CE strategies) and ‘how’ (measurement scope). They emphasized that a set of specific indicators should be used in the assessment of CE.
Achieving a circular economy is a complex process. Due to the high significance of circular economy to sustainable development, this paper aimed to assess the level of circularity of economies in selected member states of the European Union. The surveys attempted to fill an information gap in the comprehensive measurement of that phenomenon by designing a synthetic measure (INEC—Index of National Economies’ Circularity). This type of analysis provides answers to the following questions: (1) at what stage are the individual countries placed in terms of the CE? (2) What is the overall situation of EU countries according to the studied phenomenon? (3) What are the main challenges in achieving circularity in Europe?
In construing the INEC, a taxonomic linear ordering method that uses median and standard deviation was chosen and applied. The method can be characterized by its high resistance to the occurrence of extreme observations, which is specifically valuable in the analysis of EU countries. It can often be observed that the analysed countries differ significantly and have considerable disparity in the asymmetry of their index values. This is why the usage of the synthetic metric with the median seems to be more appropriate [44,45].
This paper is organized as follows. The next section presents the methodology for constructing a circular economy index. In the third section, the author develops a rating of EU countries according to their INEC values, discusses the results obtained and indicates directions for future research. An important component of the analysis is the categorization of the countries into four groups of high, medium–high, medium–low and low levels of circularity. The last section provides the conclusions drawn from the analyses.

2. Materials and Methods

The main goal of the research is to construct and empirically verify the aggregate index of national economies’ circularity (INEC). The proposed index will allow the author to assess and compare the level of circularity of the European countries. Based on the research interests, two hypotheses were formulated:
Hypothesis H1:
The overall level of circularity of the European economies is low.
Hypothesis H2:
There are significant differences in the circularity level between individual countries.
In empirical studies analysing multiple units described by means of more than one feature, multidimensional comparative analysis methods are used. They constitute a “formally coherent set of statistical methods used for purposeful selection of information about elements of a certain community and for detecting their mutual relationships” [46]. The main idea behind multidimensional comparative analysis is to create an aggregated indicator, also referred to as a synthetic variable, which provides the grounds for setting a hierarchy of studied objects according to the level of a multi-feature phenomenon. The first to propose such a measure was Z. Hellwig, who designed a synthetic development measure for the typological division of countries in terms of the level of their development, as well as their resources and the structure of their skilled human resources [47].
The stages in which the synthetic measures were designed are widely discussed in many works [47,48,49,50]. The joint publication by the OECD (the Statistics Directorate and the Directorate for Science, Technology and Industry) and the Econometrics and Applied Statistics Unit of the Joint Research Centre (JRC) of the European Commission in Ispra is especially noteworthy [48]. Within the framework of the undertaken studies, the INEC index was designed according to the following algorithm [49]:
  • The selection of the partial indicators describing a circular economy from Eurostat;
  • The standardization of the partial indicators according to the nature of their impact (stimulants/de-stimulants);
  • The determination of the value of the synthetic measure; INEC indices for respective countries;
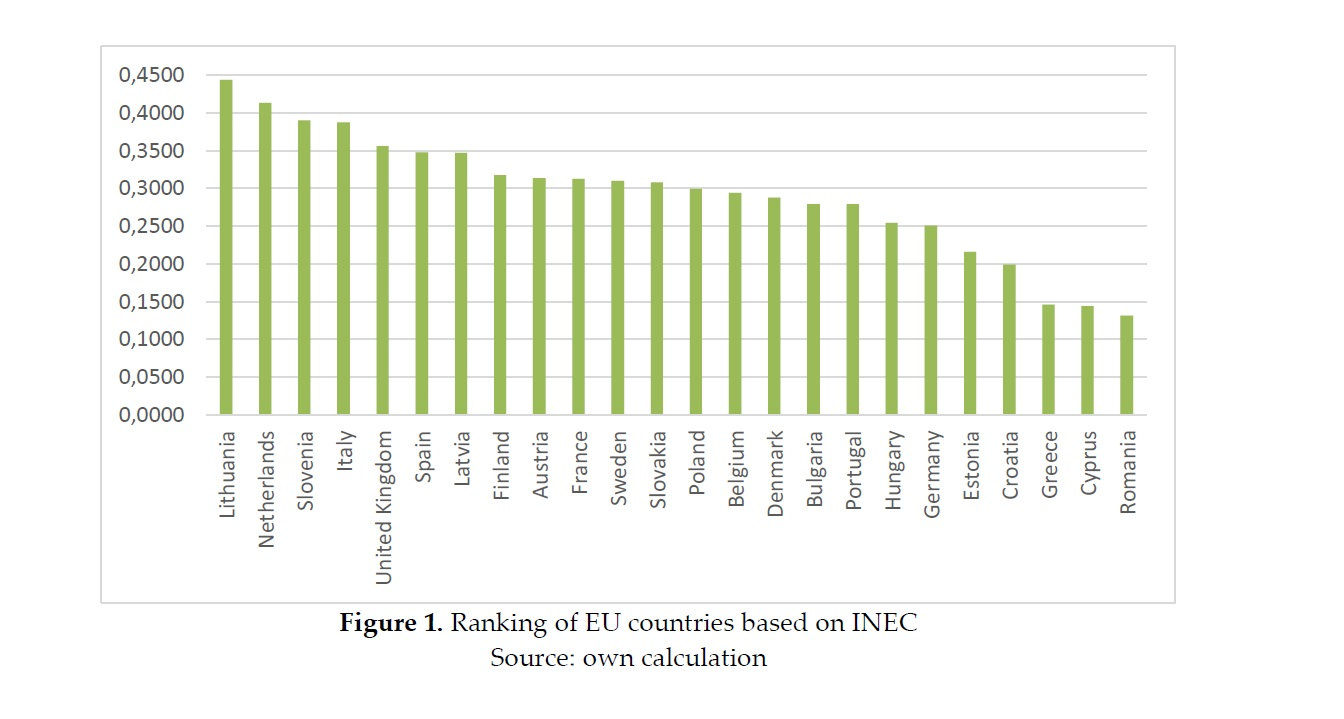
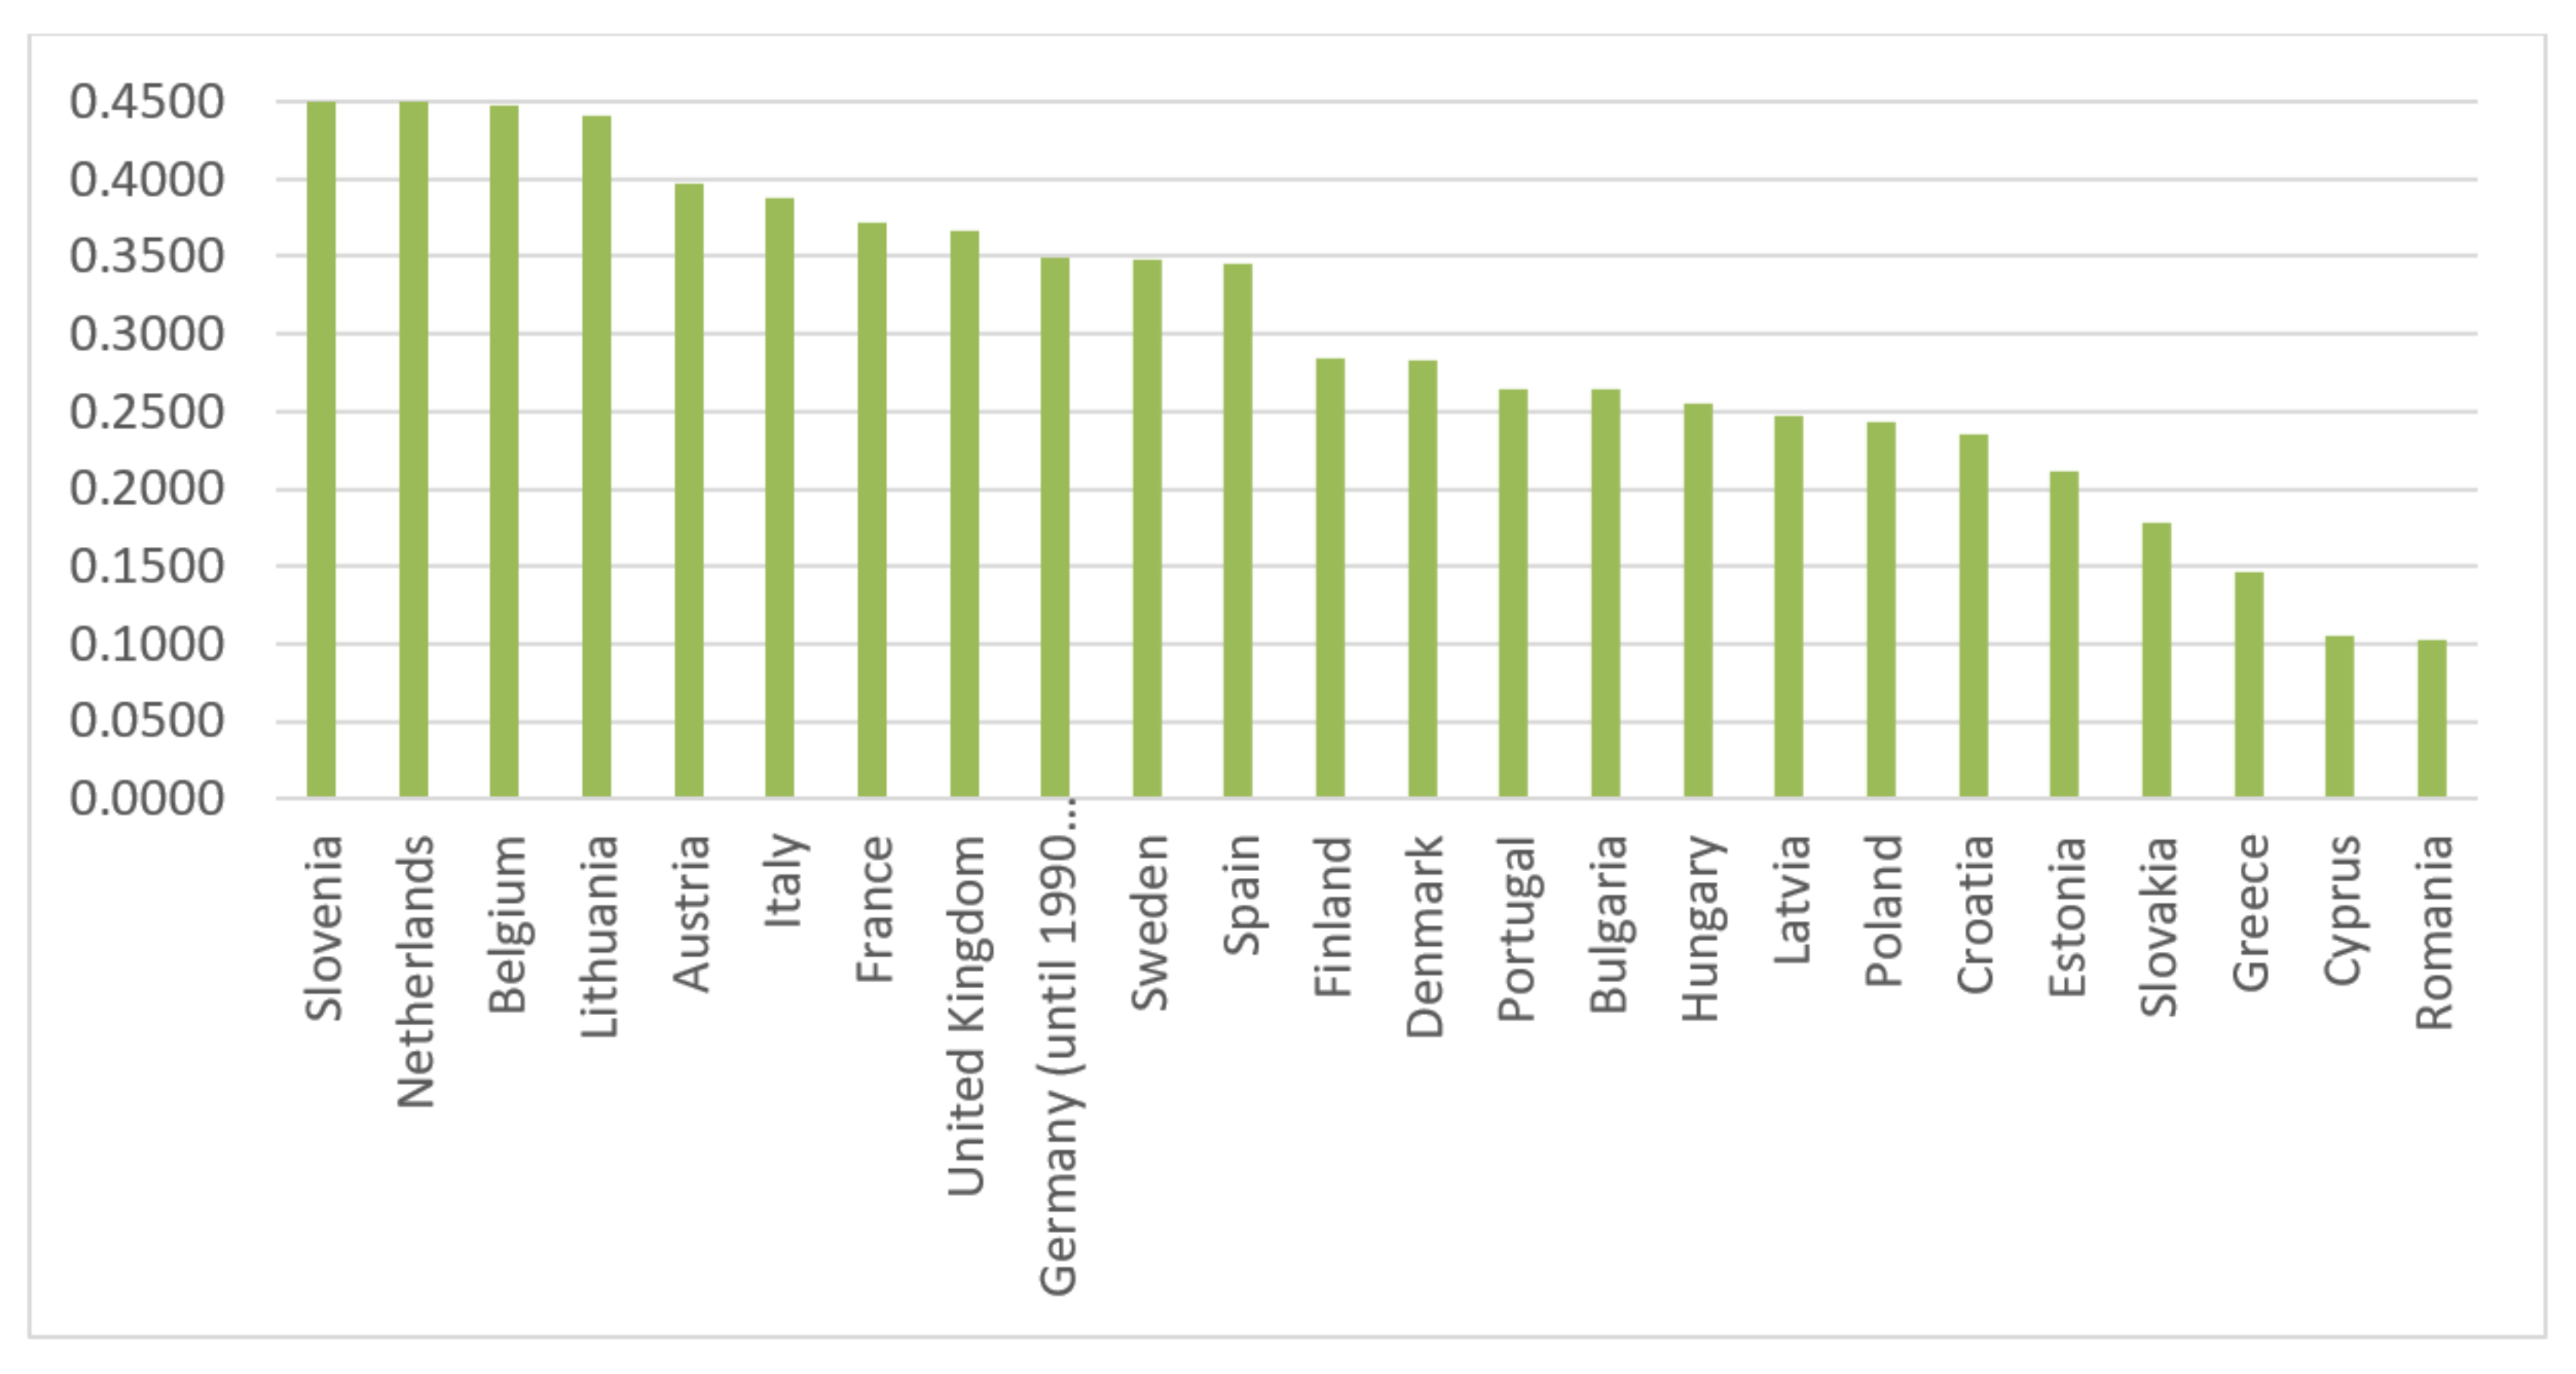
  • The linear hierarchization of countries in descending order, based on determined indices.
As emphasized in numerous studies [34], the problems that may occur in selecting indicators primarily include the difficulty in defining them properly and the lack of available data. For these two reasons, the available CE indicators database developed by the European Commission was selected (Table 1). As a result of an in-depth analysis of the data availability in the Eurostat database [51], 14 indicators and 24 countries were selected for the synthetic measure (INEC) calculation. Due to the existing information gap, two indicators (the gross investment in tangible goods in the circular economy sectors, and patents related to recycling and secondary raw materials) and four EU countries (the Czech Republic, Ireland, Luxembourg and Malta) were excluded from the study. The reference year, 2016, was chosen for the analysis. Most of the CE indicators included in the Eurostat database were given in relative terms, e.g., per capita, but three indicators for the import and export of recyclable raw materials were included only in absolute terms (in tonnes). For this reason, in order to ensure the comparability of the data between respective countries at this stage, the indicators were modified by converting them according to the number of inhabitants of their respective countries.
On the basis of the characteristics of the CE indicators in the Eurostat database [51], 11 were considered to be larger-the-better characteristics (stimulants) with a positive influence on the synthetic measure, while three were regarded as smaller-the-better characteristics (de-stimulants) which reduced the circularity index. Stimulants (selected indicators) are explanatory (independent) variables whose increased values cause an increase in the value of the dependent variable (INEC), while de-stimulants are explanatory variables whose increased values induce a decrease in the value of the dependent variable [52]. The values of the variables (Xj, j = 1,2,…,m) representing respective countries (Oi, i = 1,2,…,n) are presented as a matrix of observations (Equation (1)) in the following form:
X = x 11 x 1 m x n 1 x n m
Due to the fact that the set of diagnostic data (measures) contained indicators that could not be directly aggregated (due to different areas of activity and thus units of measurement), they were standardized using the relevant normalization formulas. The zero unitarization method was used, which can be represented as follows [53]:
for stimulants:
z i j =   x i j min ( x i j ) i max ( x i j ) i min ( x i j ) i
and for de-stimulants:
z i j =   max ( x i j ) i x i j max ( x i j ) i min ( x i j ) i
where:
  • zij is the normalized value of the j-th variable in the i-th country;
  • xij is the initial value of the j-th variable in the i-th country.
This method was selected because it was the only method to fulfil all the seven postulates formulated with reference to the use of normalization formulas [54]. The diagnostic features standardized as described above assume values in the range [0,1]. The closer the value to one, the better the situation in terms of the analysed feature, and the closer to zero, the worse the situation is. The results of the calculations (data standardization) for individual indicators and countries can be found in Supplementary Materials, Annex S1.
In the next step, the normalized values of the indicators formed the basis for the calculation of the median (formulas (Equations (4) and (5)) and standard deviation (Equation (6)) for each of the countries. The median values were determined using the formula [44,45]:
M e i = z m 2 i + z m 2 + 1 i 2
for an even number of observations, or:
M e i = z m 2 + 1 i
for an odd number of observations, where:
zi(j) is the j-th statistical ordinal for the vector (zi1, zi2, …, zim), i = 1, 2, …, n; j = 1, 2, …, m.
In turn, the standard deviation was calculated according to the following formula:
S e i = 1 m j = 1 m ( z i j z ¯ )
Based on the median and standard deviation, a CE index was developed for each country (Supplementary Materials, Annex S1):
I N E C i = M e i 1 S e i           I N E C i < 1
Values of the INEC closer to 1 indicate a higher level of circularity for the specific member state, resulting in a higher rank. This allowed the comparison of the member states of the EU, providing grounds for classifying them into uniform groups according to their level of circularity:
group     I :   I N E C i I N E C ¯ + S       high   level
group     II :   I N E C ¯ + S > I N E C i I N E C ¯     medium high   level
group   III :       I N E C ¯ > I N E C i I N E C ¯ S       medium low   level
group   IV :     I N E C i < I N E C ¯ S       low   level
where I N E C ¯ is the mean value of the synthetic measure, and S is the standard deviation of the synthetic measure.

3. Results and Discussion

Based on the applied method, the CE indexes were calculated for 24 EU member states. The outcomes of the studies are presented in Table 2 and in Figure 1. The analysis shows that four countries assigned to group I—Slovenia (0.5048), Netherlands (0.4742), Belgium (0.4471) and Lithuania (0.4411)—achieved the highest level of circularity. Group II was made up of seven countries with medium–high levels of INEC, while nine EU countries were classified into the medium–low group III. The lowest evaluation of the circularity among 24 member states was for Romania, with an INECi indicator of 0.1029. This country, together with Cyprus (0.1051), Greece (0.1465) and Slovakia (0.1781), was assigned the lowest rank; that is, IV. The average value of the synthetic measure for all of the analysed countries was 0.3021, which testifies to the very low general level of circularity of the national economies in EU member states. The deviation of the synthetic measures from their mean values was 0.1091, which means that the analysed phenomenon shows high variability between the respective countries. Thus, both research hypotheses were positively verified.
A deeper analysis of the CE indicators leads to a conclusion that only in five of them (35.7%) did the average standardized mean values exceed (0.5000). The remaining significant problems to be solved are:
  • The low levels of recyclable raw materials in trade exchange: imports from EU countries (average zi for 24 countries, 0.2108), exports to non-EU countries (0.2638), and imports from non-EU countries (0.2682).
  • The recycling rates of e-waste (0.2664) and bio-waste (0.3534).
  • The low use of circular materials (0.2810).
  • The low share of the workforce employed in the circular economy sectors (0.3961).
The indicated areas contributed to a generally low evaluation of the level of circularity of the national economies in the member states of the European Union. They require special attention from international institutions and countries to outline their CE strategy for the following years.
Looking at the respective countries closely, their strengths and weaknesses in implementing CE can be identified. Slovenia, with the best result among the 24 EU member states, owes its success mostly to its high ranks (0.8000–1.0000) in five indicators; among other things, the high degree of the recyclable raw material imports from non-EU countries, the significant share of the CE sectors in value added creation, the degree to which construction and demolition waste is recovered, and the low amount of waste produced according to GDP. On the other hand, activities concerning the recycling of e-waste and bio-waste, the export of recyclable raw materials to non-EU countries, and the circular material use rate must still be improved.
Romania, which was placed last in the ranking of the INEC, received the lowest normalized values of the indicators (0.0000–0.1000 in seven areas), i.e., the recycling rates of municipal waste and e-waste, circular material use rates, and imports and exports of recyclable raw materials. What is more, the average values (0.5000) were not exceeded in ten indicators (71.4%).
Countries such as Estonia, the Netherlands, Bulgaria, Belgium, Italy and Denmark had problems with the indicators of waste generation. In turn, Cyprus, Slovakia, Greece, Croatia and the countries of Central and Eastern Europe have not yet sufficiently resolved the issue of recycling and/or the recovery of selected groups of wastes. Considering the consumption of the so-called circular materials, the lowest results were recorded for Portugal, Greece and Cyprus. In turn, Slovakia, Poland and Finland are characterized by a low share of recyclable raw materials in international trade. Slovenia is the country with the highest value added indicator for entities from the CE sector, while Greece, Belgium, Romania and Portugal are at the end of the ranking. Belgium is also characterized by the lowest employment indicator in the CE sector. Considering only the indicators describing the competitiveness and innovativeness of the CE sectors, the best results were achieved by countries of Central and Eastern Europe, i.e., Latvia, Lithuania and Slovenia. Greece was at the bottom of the ranking.
Out of the studies carried out so far, it is difficult to identify those using synthetic measures (indices) for the comprehensive evaluation of circular economies. Previous research predominantly focused on the selection of only a few indicators for the evaluation of CE and, at the same time, was carried out using the example of a selected country or region of the EU.
Horvath et al. [29] classified EU member states according to their circular material use rate (CMU) and the ecological circulation index (ECI). While CMU illustrates the present level of the utilization of secondary raw materials, the ECI shows what this level should be in order to maintain balance with bio-capacity. The input–output analysis was used to design a general economic framework for monitoring CE in Austria [36]. In order to measure circularity, the authors proposed two headline indicators: the input socioeconomic cycling rate and the input ecological cycling rate. In turn, Avdiushchenko and Zając [33] developed a system of indicators allowing the measurement of progress towards a circular economy at a regional level in the countries of the European Union. Next, using Principal Component Analysis (PCA), they designed CE indices for the period 2005–2016 for all of Poland and for the Lesser Poland voivodeship.
The methodology proposed and presented in this paper provides a comprehensive and transparent framework for the evaluation of the level of circularity of EU national economies. The evaluation was based on a review of literature and the set of CE indicators proposed by Eurostat. The analysis of each indicator separately, in relation to individual countries, provides information on the strengths and weaknesses of the circularity, while the synthetic measures (INECi) allow for the comparison and categorization of individual countries, as well as the overall assessment of the level of circularity in the European Union.
While the proposed method provides an effective framework for the evaluation of the circularity of national economies, it can also be strengthened by further research. It would be helpful to assess its applicability and relevance to the rest of the EU countries. As of today, a large information gap does not allow the full evaluation of all of the countries. A second area for future research is to develop an effective system for the collection of more information and the expansion of the indicators set for an even more comprehensive CE assessment. The existing critical reviews of indicators [29,30,32,34] may be helpful here, but the basic condition for using them is access to reliable and measurable data. Another important direction for further research would be an in-depth analysis of the causes and determinants of the poor performance of some national economies. Moreover, the current analyses were focused on the static approach. Therefore, it would be worthwhile to include a dynamic analysis of the progress of individual countries over time, provided, of course, that appropriate data in this regard are obtained.

4. Conclusions

One of the main priorities of the EU’s new strategic agenda for 2019–2024 is to build a climate-neutral, green, fair and social Europe. To this end, among other things, in 2020, the European Commission prepared a new EU action plan regarding a circular economy. It is a future-oriented programme for a cleaner and more competitive Europe, co-created with economic entities, consumers and civil society organisations. The plan aims to accelerate the transformation changes required by the European Green Governance.
A circular economy is a complex issue, which inhibits its analysis. As a multi-criteria concept, it requires aggregated measures based on the integration of the various areas of activity which make it possible to determine whether the economy is circular. The novelty of this research comes from its comprehensive approach to the methodology of assessing the circularity phenomenon by constructing a synthetic measure (INEC) based on a set of non-aggregate indicators describing the CE. The proposed synthetic approach is relatively transparent, and is therefore easy to communicate. The CE indicators monitoring individual goals do not allow for a synthesis, which is an advantage of the Index of National Economies’ Circularity proposed in this paper. The INEC will contribute to the improvement in the field of monitoring, planning and implementing the assumptions of the circular economy. At the same time, the analysis of the mean standardized values of the CE indicators contributes to the identification of the strengths and weaknesses of the circular economy at the European level.
The research results allowed the author to formulate answers to the research questions posed in the paper. In response to question one, a ranking of the countries was created, presenting their individual stage in terms of the circular economy. In that respect, Lithuania ranked the best and Romania the worst. Moreover, based on the method applied, the EU member states were each classified into one of four groups identified according to the INEC. Taking into account the second research question, it should be concluded that the general level of circularity of the EU national economies is low, as evidenced by the average value of the INEC for all of the analysed countries (0.2929). In response to question three, the analysis of the average standardized values of the CE indicators shows that many areas need corrective measures to be undertaken by both international institutions and individual countries. In the upcoming years, one of the main challenges will be to increase the investments in the circular economy sectors, which will contribute to employment growth in these sectors. Furthermore, dynamic action requires a low level of circular material use, as well as the share of recyclable raw materials in trade exchange.

Supplementary Materials

The following are available online at https://www.mdpi.com/2071-1050/12/18/7613/s1, Annex S1: Standardization of the CE indicators and the INEC calculation.

Funding

This research was funded by the Ministry of Science and Higher Education of the Republic of Poland: funds awarded to the University of Life Sciences, Faculty of Agrobioengineering, grant number RKA/S/8/2020 (EFI).

Conflicts of Interest

The author declares no conflict of interest.

References

  1. Pearce, D.W.; Turner, R.K. Economics of Natural Resources and the Environment; Harvester Wheatsheaf: London, UK, 1990. [Google Scholar]
  2. Van Buren, N.; Demmers, M.; Van der Heijden, R.; Witlox, F. Towards a Circular Economy: The Role of Dutch Logistics Industries and Governments. Sustainability 2016, 8, 647. [Google Scholar] [CrossRef] [Green Version]
  3. Dajian, Z. Background, Pattern and Policy of China for Developing Circular Economy. Chin. J. Popul. Resour. Environ. 2008, 6, 3–8. [Google Scholar] [CrossRef]
  4. Pesce, M.; Tamai, I.; Guo, D.; Critto, A.; Brombal, D.; Wang, X.; Cheng, H.; Marcomini, A. Circular Economy in China: Translating Principles into Practice. Sustainability 2020, 12, 832. [Google Scholar] [CrossRef] [Green Version]
  5. European Commission. The European Green Deal; Report COM (2019) 640 final; European Commission: Brussels, Belgium, 2019. [Google Scholar]
  6. European Commission. Closing the Loop-An EU Action Plan for the Circular Economy; Report COM (2015) 614 final; European Commission: Brussels, Belgium, 2015. [Google Scholar]
  7. European Commission. A New Circular Economy Action Plan: For a Cleaner and More Competitive Europe; Report COM/2020/98 final; European Commission: Brussels, Belgium, 2020. [Google Scholar]
  8. Geissdoerfer, M.; Savaget, P.; Bocken, N.M.P.; Hultink, E.J. The Circular Economy–A new Sustainability Paradigm. J. Clean. Prod. 2017, 143, 757–768. [Google Scholar] [CrossRef] [Green Version]
  9. Graedel, T.E.; Reck, B.K.; Ciacci, L.; Passarini, F. On the Spatial Dimension of the Circular Economy. Resources 2019, 8, 32. [Google Scholar] [CrossRef] [Green Version]
  10. Rizos, V.; Tuokko, K.; Behrens, A. The Circular Economy. A Review of Definitions, Processes and Impacts; Research Report No. 2017/09; CEPS: Brussels, Belgium, 2017. [Google Scholar]
  11. Kovacic, Z.; Strand, R.; Völker, T. The Circular Economy in Europe. In Critical Perspectives on Policies and Imaginaries; Routledge: New York, NJ, USA, 2020; ISBN 9780367183585. [Google Scholar]
  12. Kirchherr, J.; Reike, D.; Hekkert, M. Conceptualizing the Circular Economy: An Analysis of 114 Definitions. Resour. Conserv. Recycl. 2017, 127, 221–232. [Google Scholar] [CrossRef]
  13. Ellen MacArthur Foundation. Towards the Circular Economy: Economic and Business Rationale for an Accelerated Transition; Ellen MacArthur Foundation: Cowes, UK, 2013. [Google Scholar]
  14. Heshmati, A. A Review of the Circular Economy and its Implementation; IZA Discussion Papers, No. 9611; Institute for the Study of Labor (IZA): Bonn, Germany, 2015. [Google Scholar]
  15. Busu, M. Adopting Circular Economy at the European Union Level and Its Impact on Economic Growth. Soc. Sci. 2019, 8, 159. [Google Scholar] [CrossRef] [Green Version]
  16. Hart, J.; Adams, K.; Giesekam, J.; Tingley, D.D.; Pomponi, F. Barriers and Drivers in a Circular Economy: The Case of the Built Environment. Procedia Cirp 2019, 80, 619–624. [Google Scholar] [CrossRef]
  17. Ritzén, S.; Sandström, G.Ö. Barriers to the Circular Economy–Integration of Perspectives and Domains. Procedia Cirp 2017, 64, 7–12. [Google Scholar] [CrossRef]
  18. De Mattos, C.A.; De Albuquerque, T.L.M. Enabling Factors and Strategies for the Transition Toward a Circular Economy (CE). Sustainability 2018, 10, 4628. [Google Scholar] [CrossRef] [Green Version]
  19. Robaina, M.; Villar, J.; Pereira, E.T. The Determinants for a Circular Economy in Europe. Environ. Sci. Pollut. Res. 2020, 27, 12566–12578. [Google Scholar] [CrossRef] [PubMed]
  20. Diemer, A.; Dierickx, F. Circular economy, a new paradigm for Europe? In Paradigms, Models, Scenarios and Practices for Strong Sustainability; Diemer, A., Nedelciu, E., Schellens, M., Morales, M.E., Oostdijk, M., Eds.; Editions Oeconomia: Clermont-Ferrand, France, 2020; pp. 159–178. [Google Scholar]
  21. Hartley, K.; Van Santen, R.; Kirchherr, J. Policies for Transitioning Towards a Circular Economy: Expectations from the European Union (EU). Resour. Conserv. Recycl. 2020, 155, 104634. [Google Scholar] [CrossRef]
  22. Morseletto, P. Targets for a Circular Economy. Resour. Conserv. Recycl. 2020, 153, 104553. [Google Scholar] [CrossRef]
  23. Fassio, F.; Minotti, B. Circular Economy for Food Policy: The Case of the RePoPP Project in The City of Turin (Italy). Sustainability 2019, 11, 6078. [Google Scholar] [CrossRef] [Green Version]
  24. Donati, F.; Aguilar-Hernandez, G.A.; Sigüenza-Sánchez, C.P.; De Koning, A.; Rodrigues, J.F.D.; Tukker, A. Modeling the Circular Economy in Environmentally Extended Input-Output Tables: Methods, Software and Case Study. Resour. Conserv. Recycl. 2020, 152, 104508. [Google Scholar] [CrossRef]
  25. Sosnovska, O.; Shtepa, O. Actual Aspects of Circular Economy Development. In Proceedings of the III International Scientific Congress Society of Ambient Intelligence 2020 (ISC-SAI 2020), Ukraine–Uzbekistan–Latvia–Poland, September 24–25; Advances in Economics, Business and Management Research; Atlantis Press: Amsterdam, The Netherlands, 2020; Volume 129, pp. 201–207. [Google Scholar] [CrossRef] [Green Version]
  26. Baran, B. The Circular Economy in EU Policy as a Response to Contemporary Ecological Challenges. Gospod. Nar. 2019, 4, 31–51. [Google Scholar] [CrossRef]
  27. Tóth, G. Circular Economy and its Comparison with 14 Other Business Sustainability Movements. Resources 2019, 8, 159. [Google Scholar] [CrossRef] [Green Version]
  28. Didenko, N.I.; Klochkov, Y.S.; Skripnuk, D.F. Ecological Criteria for Comparing Linear and Circular Economies. Resources 2018, 7, 48. [Google Scholar] [CrossRef] [Green Version]
  29. Horvath, B.; Bahna, M.; Fogarassy, C. The Ecological Criteria of Circular Growth and the Rebound Risk of Closed Loops. Sustainability 2019, 11, 2961. [Google Scholar] [CrossRef] [Green Version]
  30. Saidani, M.; Yannou, B.; Leroy, Y.; Cluzel, F.; Kendall, A. A Taxonomy of Circular Economy Indicators. J. Clean. Prod. 2019, 207, 542–559. [Google Scholar] [CrossRef] [Green Version]
  31. Sverko Grdic, Z.; Krstinic Nizic, M.; Rudan, E. Circular Economy Concept in the Context of Economic Development in EU Countries. Sustainability 2020, 12, 3060. [Google Scholar] [CrossRef] [Green Version]
  32. Moraga, G.; Huysveld, S.; Mathieux, F.; Andrea Blengini, G.; Alaerts, L.; Van Acker, K.; de Meester, S.; Dewulf, J. Circular Economy Indicators: What do they Measure. Resour. Conserv. Recycl. 2019, 146, 452–461. [Google Scholar] [CrossRef] [PubMed]
  33. Avdiushchenko, A.; Zając, P. Circular Economy Indicators as a Supporting Tool for European Regional Development Policies. Sustainability 2019, 11, 3025. [Google Scholar] [CrossRef] [Green Version]
  34. Sánchez-Ortiz, J.; Rodríguez-Cornejo, V.; Del Río-Sánchez, R.; García-Valderrama, T. Indicators to Measure Efficiency in Circular Economies. Sustainability 2020, 12, 4483. [Google Scholar] [CrossRef]
  35. Haupt, M.; Hellweg, S. Measuring the Environmental Sustainability of a Circular Economy. Environ. Sustain. Indic. 2019, 1, 100005. [Google Scholar] [CrossRef]
  36. Jacobi, N.; Haas, W.; Wiedenhofer, D.; Mayer, A. Providing an Economy-Wide Monitoring Framework for the Circular Economy in Austria: Status Quo and Challenge. Resour. Conserv. Recycl. 1918, 137, 156–166. [Google Scholar] [CrossRef]
  37. Moric, I.; Jovanović, J.Š.; Đoković, R.; Peković, S.; Perović, Đ. The Effect of Phases of the Adoption of the Circular Economy on Firm Performance: Evidence from 28 EU Countries. Sustainability 2020, 12, 2557. [Google Scholar] [CrossRef] [Green Version]
  38. Alaerts, L.; Van Acker, K.; Rousseau, S.; De Jaeger, S.; Moraga, G.; Dewulf, J.; De Meester, S.; Van Passel, S.; Compernolle, T.; Bachus, K.; et al. Towards a More Direct Policy Feedback in Circular Economy Monitoring via a Societal Needs Perspective. Resour. Conserv. Recycl. 2019, 149, 363–371. [Google Scholar] [CrossRef]
  39. Corona, B.; Shen, L.; Reike, D.; Rosales Carreón, J.; Worrell, E. Towards Sustainable Development through the Circular Economy—A Review and Critical Assessment on Current Circularity Metrics. Resour. Conserv. Recycl. 2019, 151, 104498. [Google Scholar] [CrossRef]
  40. Busu, M.; Trica, C.L. Sustainability of Circular Economy Indicators and Their Impact on Economic Growth of the European Union. Sustainability 2019, 11, 5481. [Google Scholar] [CrossRef] [Green Version]
  41. Balmford, A.; Bennun, L.; Ten Brink, B.; Cooper, D.; Côté, M.I.; Crane, P.; Dobson, A.; Dudley, N.; Dutton, I.; Green, R.E.; et al. The Convention on Biological Diversity’s 2010 Target. Science 2005, 307, 212–213. [Google Scholar] [CrossRef]
  42. Cornescu, V.; Adam, R. Considerations Regarding the Role of Indicators used in the Analysis and Assessment of Sustainable Development in the EU. Procedia Econ. Financ. 2014, 8, 10–16. [Google Scholar] [CrossRef] [Green Version]
  43. European Commission. Communication on a Monitoring Framework for the Circular Economy; COM(2018) 29 final; European Commission: Strasbourg, France, 2018. [Google Scholar]
  44. Strahl, D. Methods for Evaluation of Regional Development (Metody Oceny Rozwoju Regionalnego); AE Publishing House: Wrocław, Poland, 2006. [Google Scholar]
  45. Grzebyk, M.; Stec, M. Sustainable Development in EU Countries: Concept and Rating of Levels of Development. Sustain. Dev. 2015, 23, 110–123. [Google Scholar] [CrossRef]
  46. Gorzelak, G. Statistical Comparative Analysis-Theory and Practice (Statystyczna analiza porównawcza–Teoria a praktyka). Wiadomości Stat. 1981, 8, 16–19. [Google Scholar]
  47. Hellwig, Z. The Application of the Taxonomic Method to the Typological Division of Countries by Level of their Development as Well as Resources and Structure of Qualified Staff. (Zastosowanie metody taksonomicznej do typologicznego podziału krajów ze względu na poziom ich rozwoju oraz zasoby i strukturę wykwalifikowanych kadr). Przegląd Stat. 1968, 4, 307–326. [Google Scholar]
  48. OECD. Handbook on Constructing Composite Indicators. In Methodology and User Guide; OECD Publishing: Paris, France, 2008. [Google Scholar]
  49. Piotrowska, E.; Roszkowska, E. Analysis of the Diversity of Polish Voivodeships in Terms of the Level of Innovation (Analiza zróżnicowania województw Polski pod względem poziomu innowacyjności). Optim. Studia Ekon. 2011, 2, 65–85. [Google Scholar]
  50. Godlewska, J.; Sidorczuk-Pietraszko, E. Taxonomic Assessment of Transition to the Green Economy in Polish Regions. Sustainability 2019, 11, 5098. [Google Scholar] [CrossRef] [Green Version]
  51. Eurostat. Available online: https://ec.europa.eu/eurostat/data/database (accessed on 18 April 2020).
  52. Kasztelan, A.; Nowak, A.; Hawlena, J. Green Growth in Agriculture in the European Union: Myth or Reality. Eur. Res. Stud. J. 2019, 22, 35–48. [Google Scholar] [CrossRef]
  53. Kijek, A. Sector Risk of the Processing Industry. In Modeling and Assessment (Ryzyko Sektorowe Przemysłu Przetwórczego: Modelowanie i Ocena); UMCS Publishing House: Lublin, Poland, 2013. [Google Scholar]
  54. Jarocka, M. The Choice of a Formula of the Data Normalization in the Comparative Analysis of Multivariate Objects (Wybór formuły normalizacyjnej w analizie porównawczej obiektów wielocechowych). Econ. Manag. 2015, 1, 113–126. [Google Scholar]
Figure 1. Ranking of EU countries based on INEC. Source: own calculation.
Sustainability 12 07613 g001
Table 1. Indicators of a circular economy.
Indicator GroupsIndicators Used in the Analysis (Unit of Measure)Stimulant/Destimulant
Production and consumptionGeneration of municipal waste (kg per capita)D
Generation of waste excluding major mineral wastes per GDP unit (kg per thousand euro)D
Generation of waste excluding major mineral wastes per domestic material consumption (%)D
Waste managementRecycling rate of municipal waste (%)S
Recycling rate of packaging waste (%)S
Recycling rate of e-waste (%)S
Recycling of biowaste (kg per capita)S
Recovery rate of construction and demolition waste (%)S
Secondary raw materialsCircular material use rate (%)S
Imports of recyclable raw materials from non-EU countries (kg per capita)S
Exports of recyclable raw materials to non-EU countries (kg per capita)S
Imports of recyclable raw materials from EU countries (kg per capita)S
Competitiveness and innovationValue added at factor costs in the circular economy sectors (% of GDP)S
Gross investment in tangible goods in the circular economy sectors (% of GDP)S
Persons employed in the circular economy sectors (% of total employmentS
Patents related to recycling and secondary raw materials (per million inhabitants)S
Source: own elaboration based on the Eurostat database.
Table 2. Classification of 24 EU member states according to the value of the synthetic measure describing their level of circularity.
Group NumberCircularity LevelINEC RangeCountries
Ihigh0.4112-Slovenia, Netherlands, Belgium, Lithuania
IImedium-high0.3021–0.4112Austria, Italy, France, United Kingdom, Germany, Sweden, Spain
IIImedium-low0.1930–0.3021Finland, Denmark, Portugal, Bulgaria, Hungary, Latvia, Poland, Croatia, Estonia
IVlow−0.1930Slovakia, Greece, Cyprus, Romania
Source: own calculations.

