Spillover Index Approach in Investigating the Linkage between International Tourism and Economic growth in Central and Eastern European Countries


Abstract
1. Introduction
2. Literature Review and Development of Research Hypotheses
2.1. The Tourism Growth Determines Economic Growth (TLEG—Tourism-Led Economic Growth)
2.2. The Economic Growth Determines Tourism Growth (GLT—Growth-Led Tourism)
2.3. The Tourism Growth Determines Economic Growth and at the Same Time Economic Growth Determines Tourism Growth
2.4. Tourism and Economic Growth: Lack of Causality Relationship
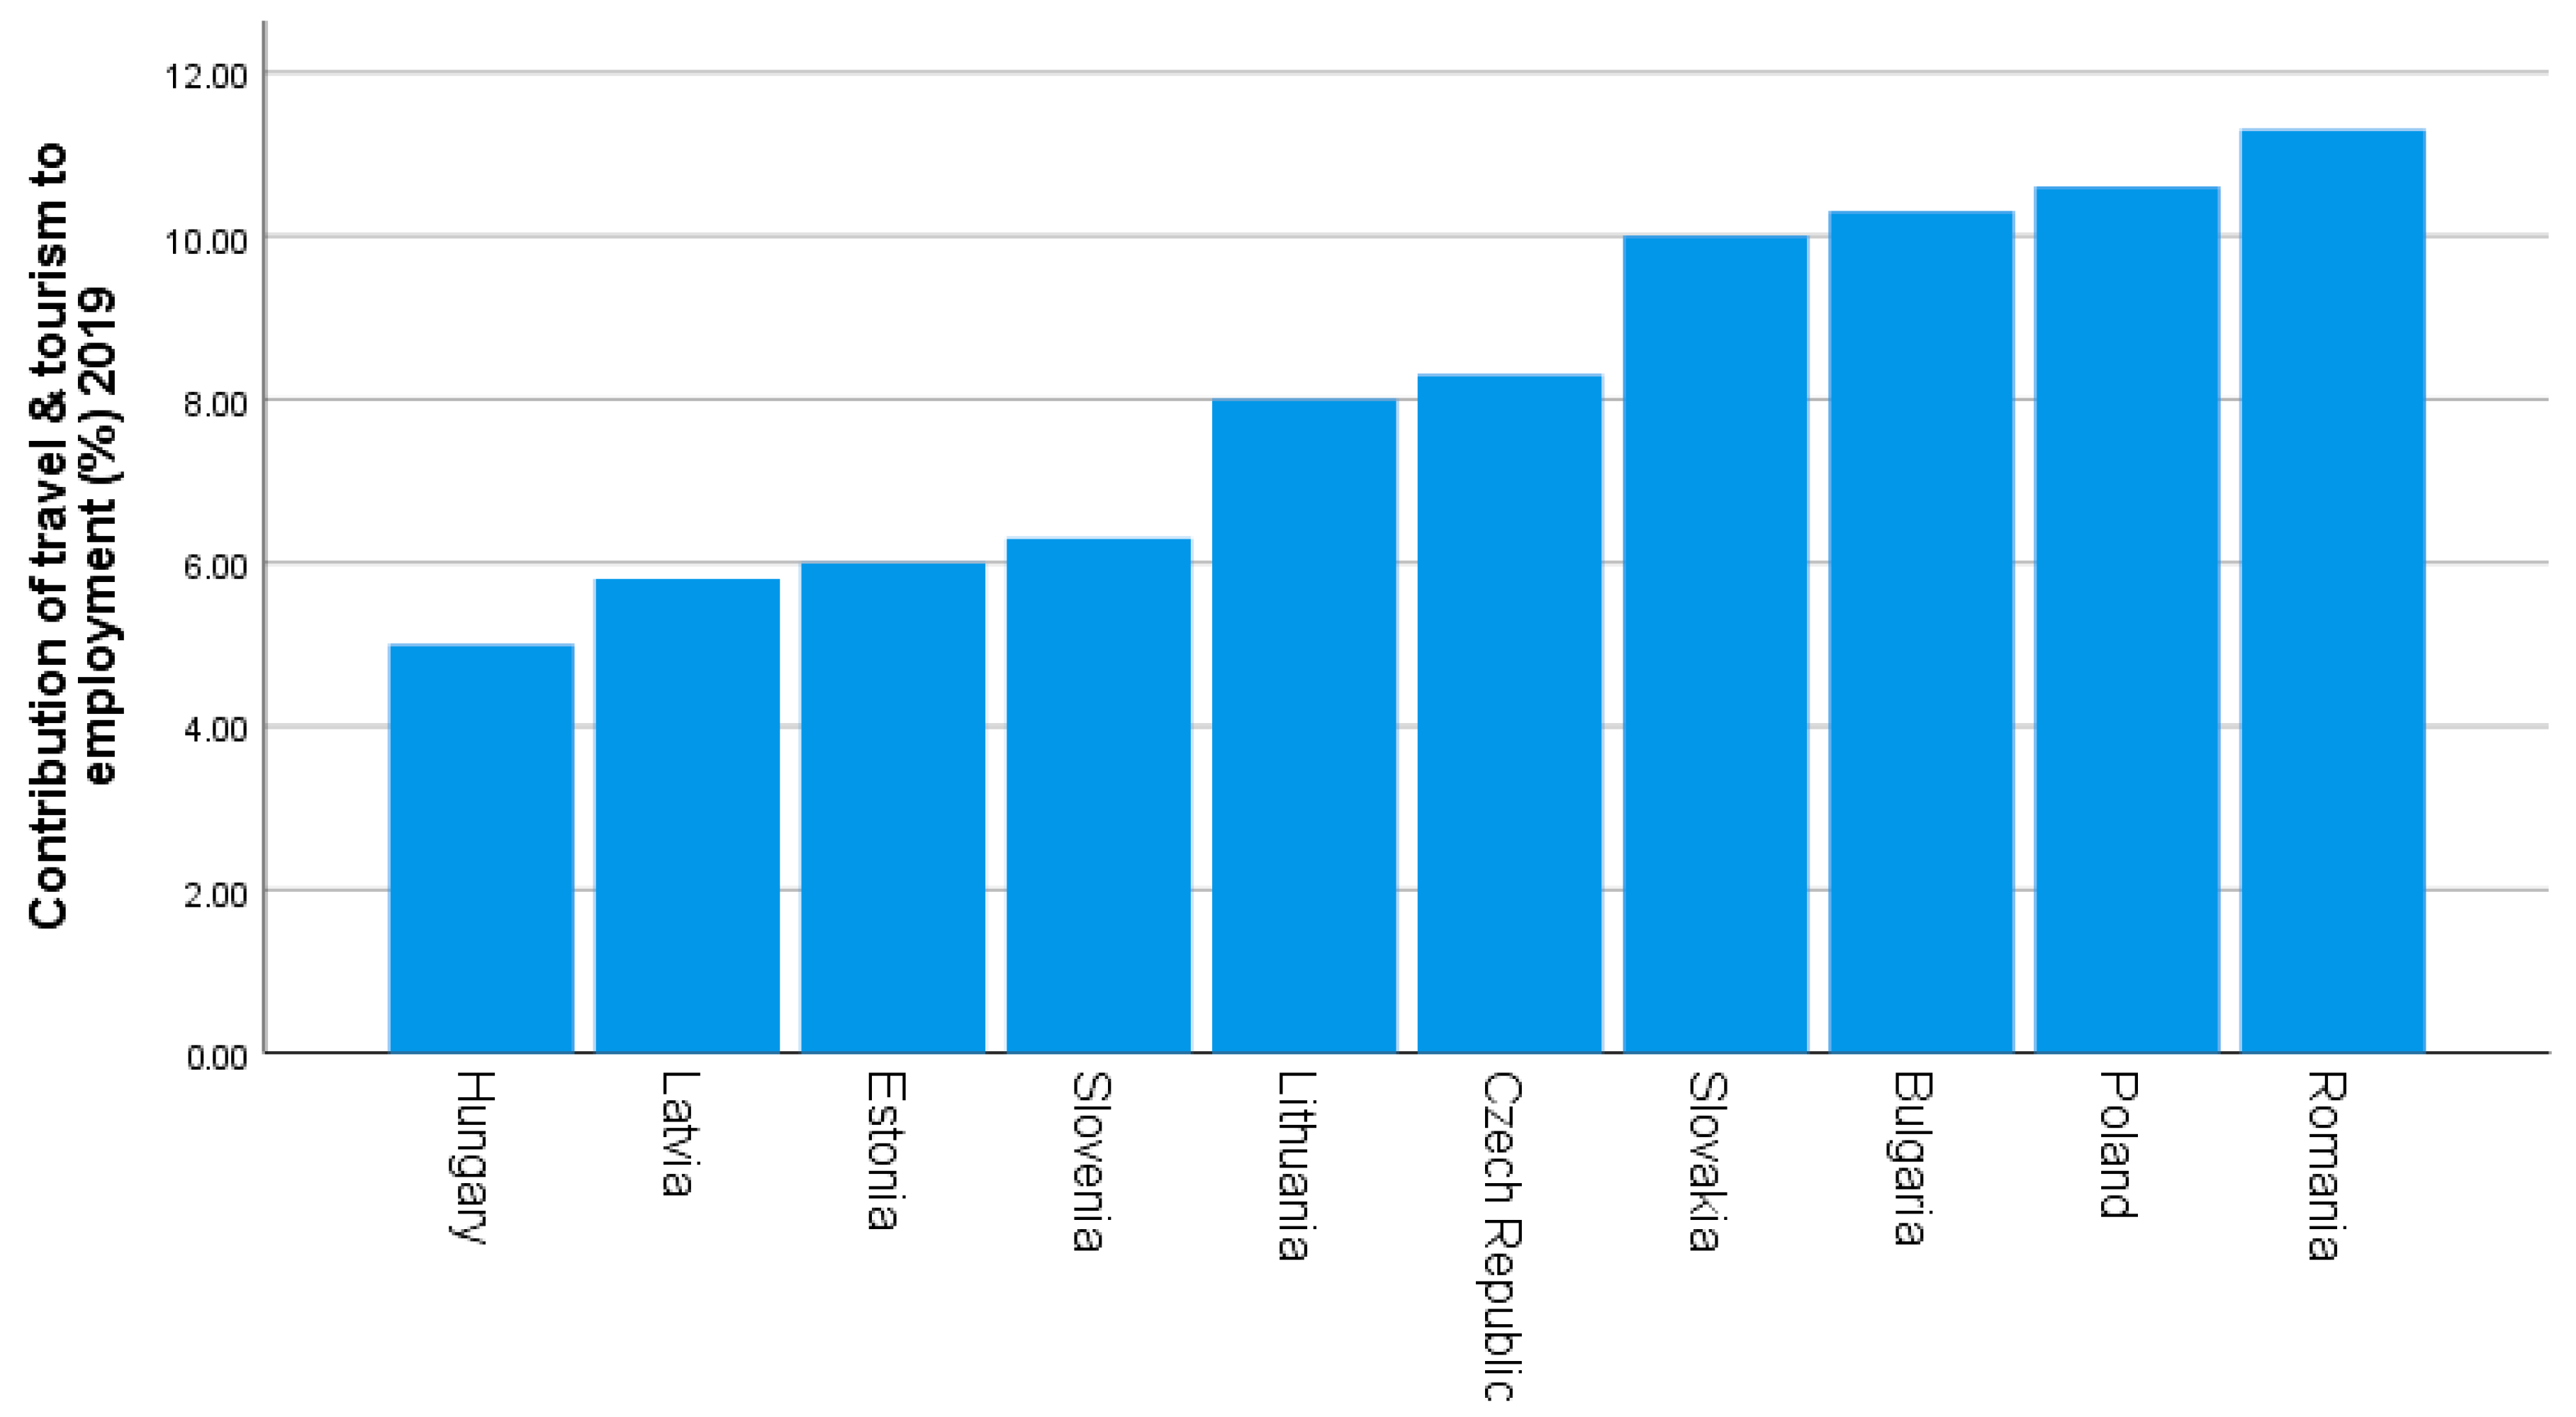
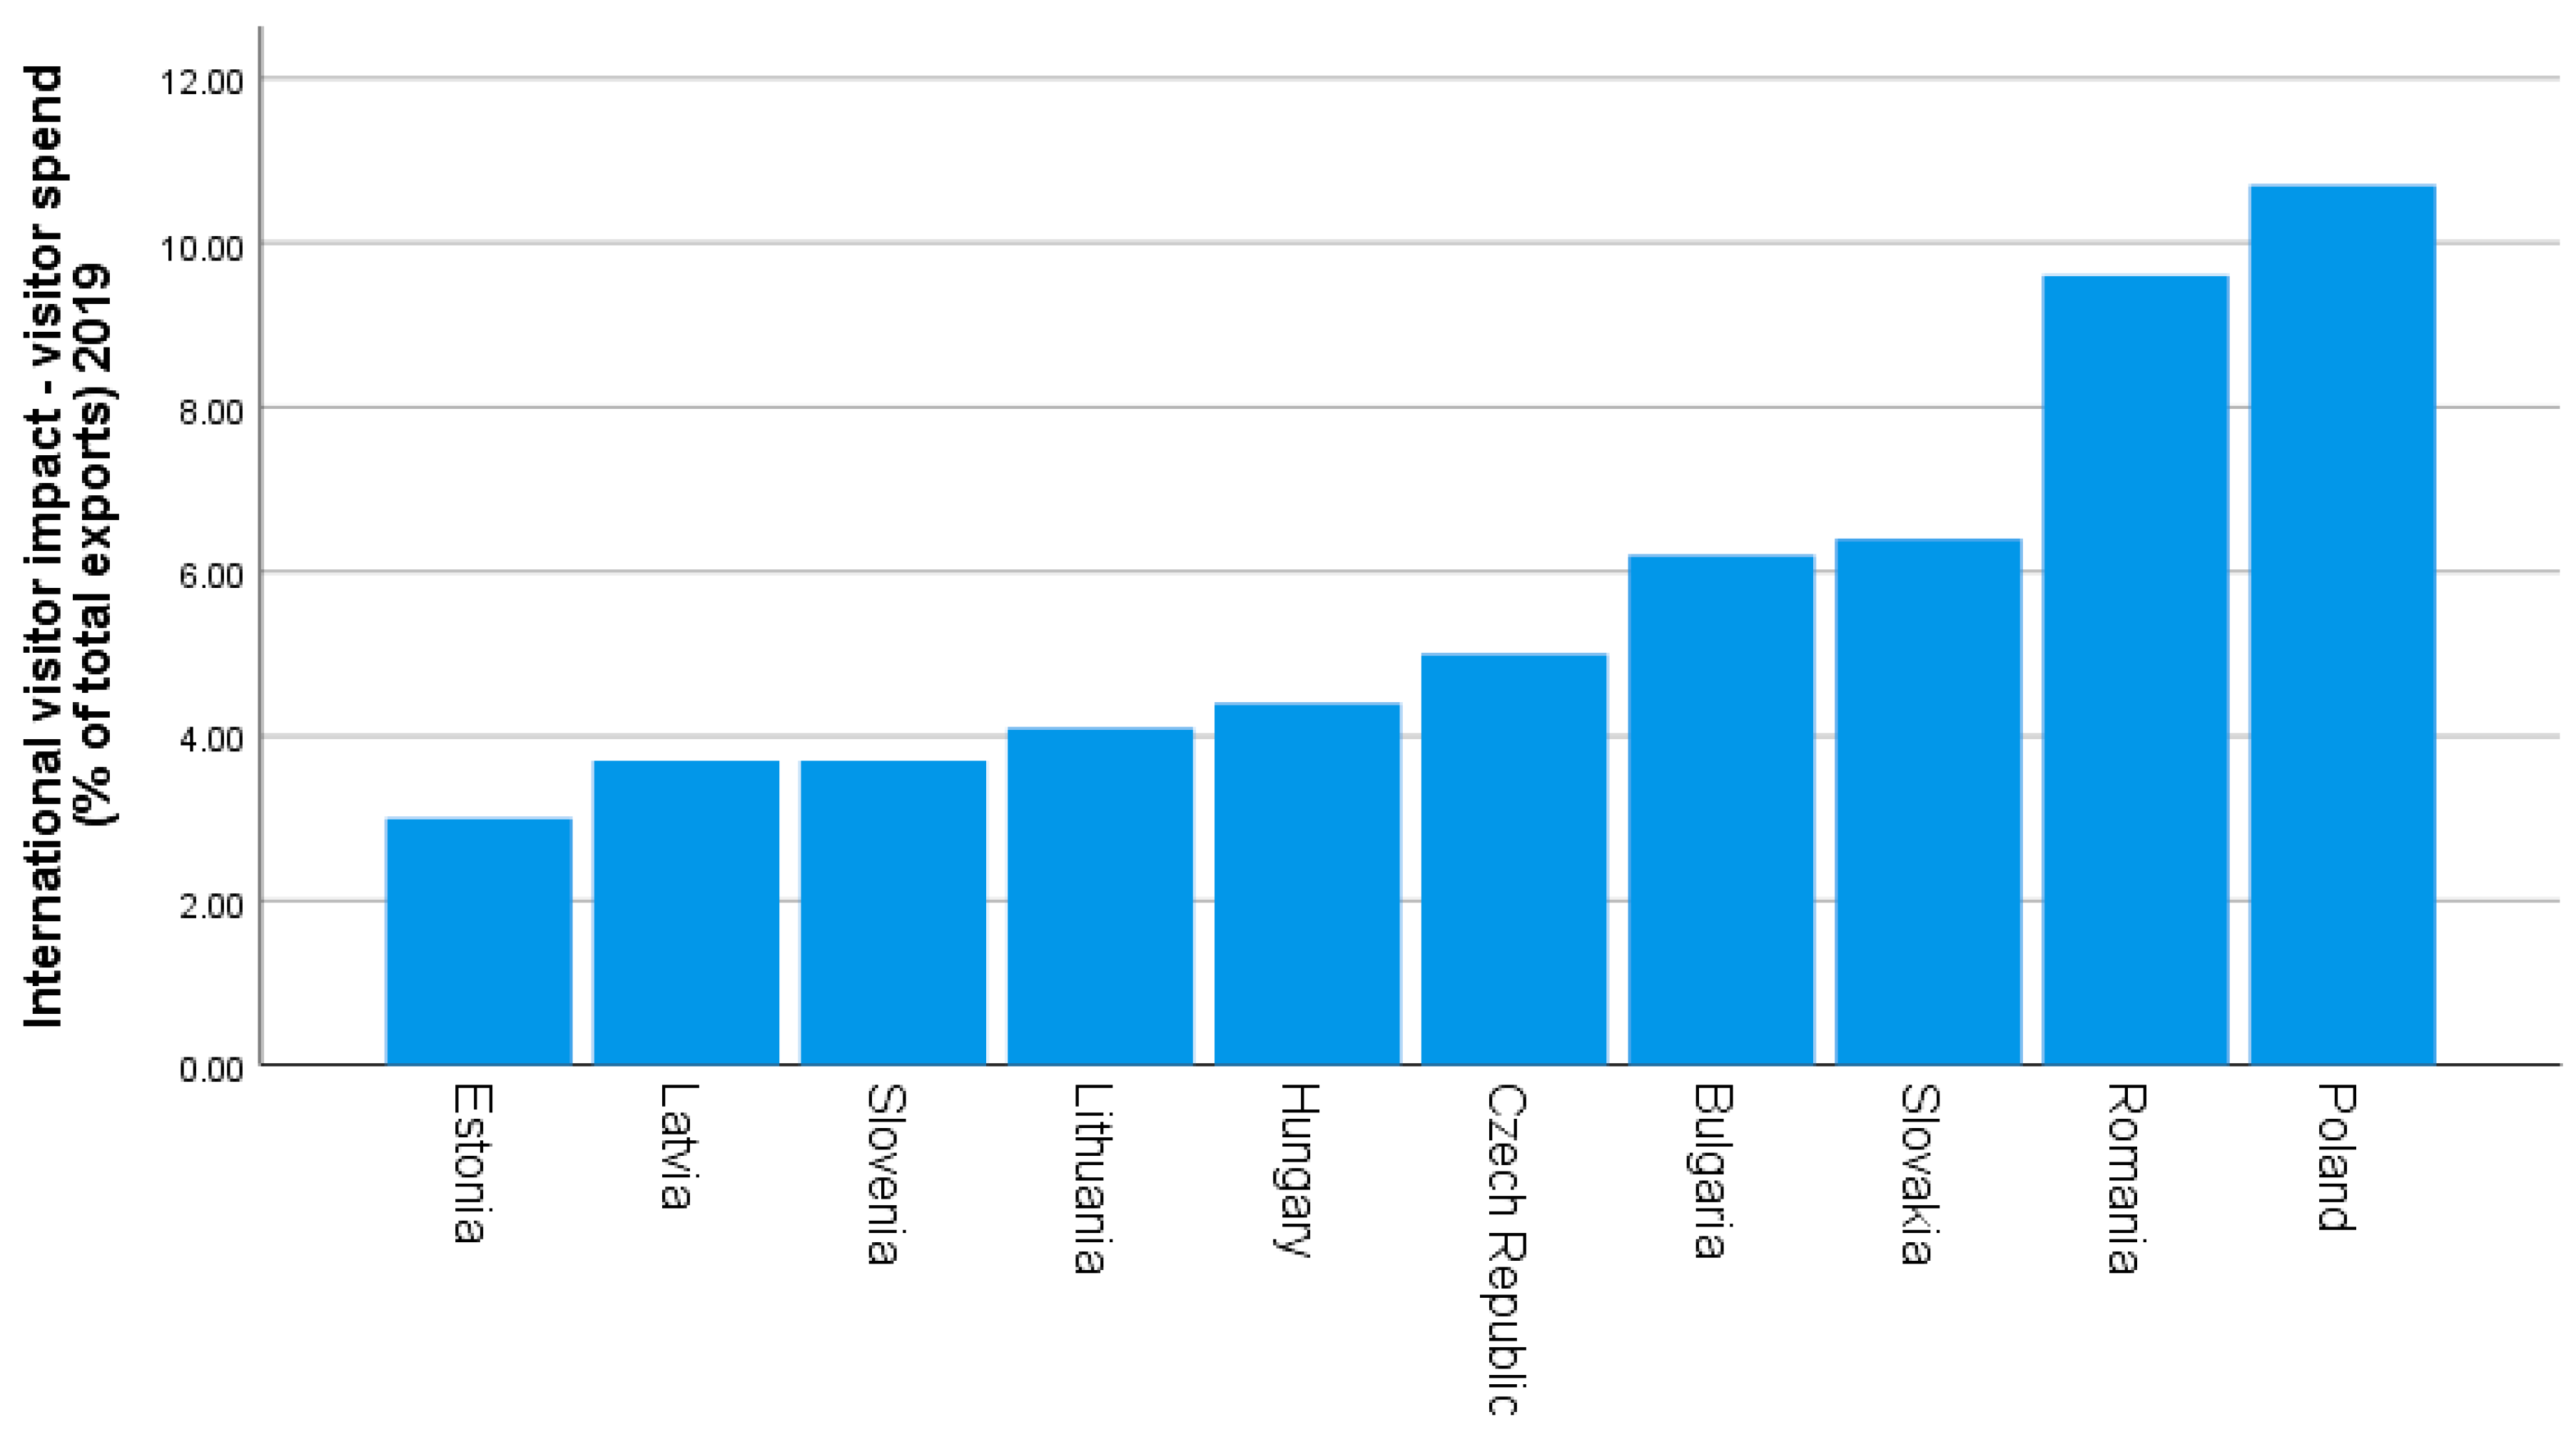
3. The Importance and the Economic Impact of Tourism in the CEE Countries
4. Methodology
- if in the Equation (1) there are only the statistically significant parameters , then the variable Granger causes the variable ;
- when in the Equation (2) there are the statistically significant parameters the variable Granger causes the variable ;
- when in the two equations there are both the parameters and the parameters which are statistically significant, there is a bidirectional Granger-causality relationship between the two variables and ;
- when none of the parameters and are statistically significant, then the variables are independent one from the other.
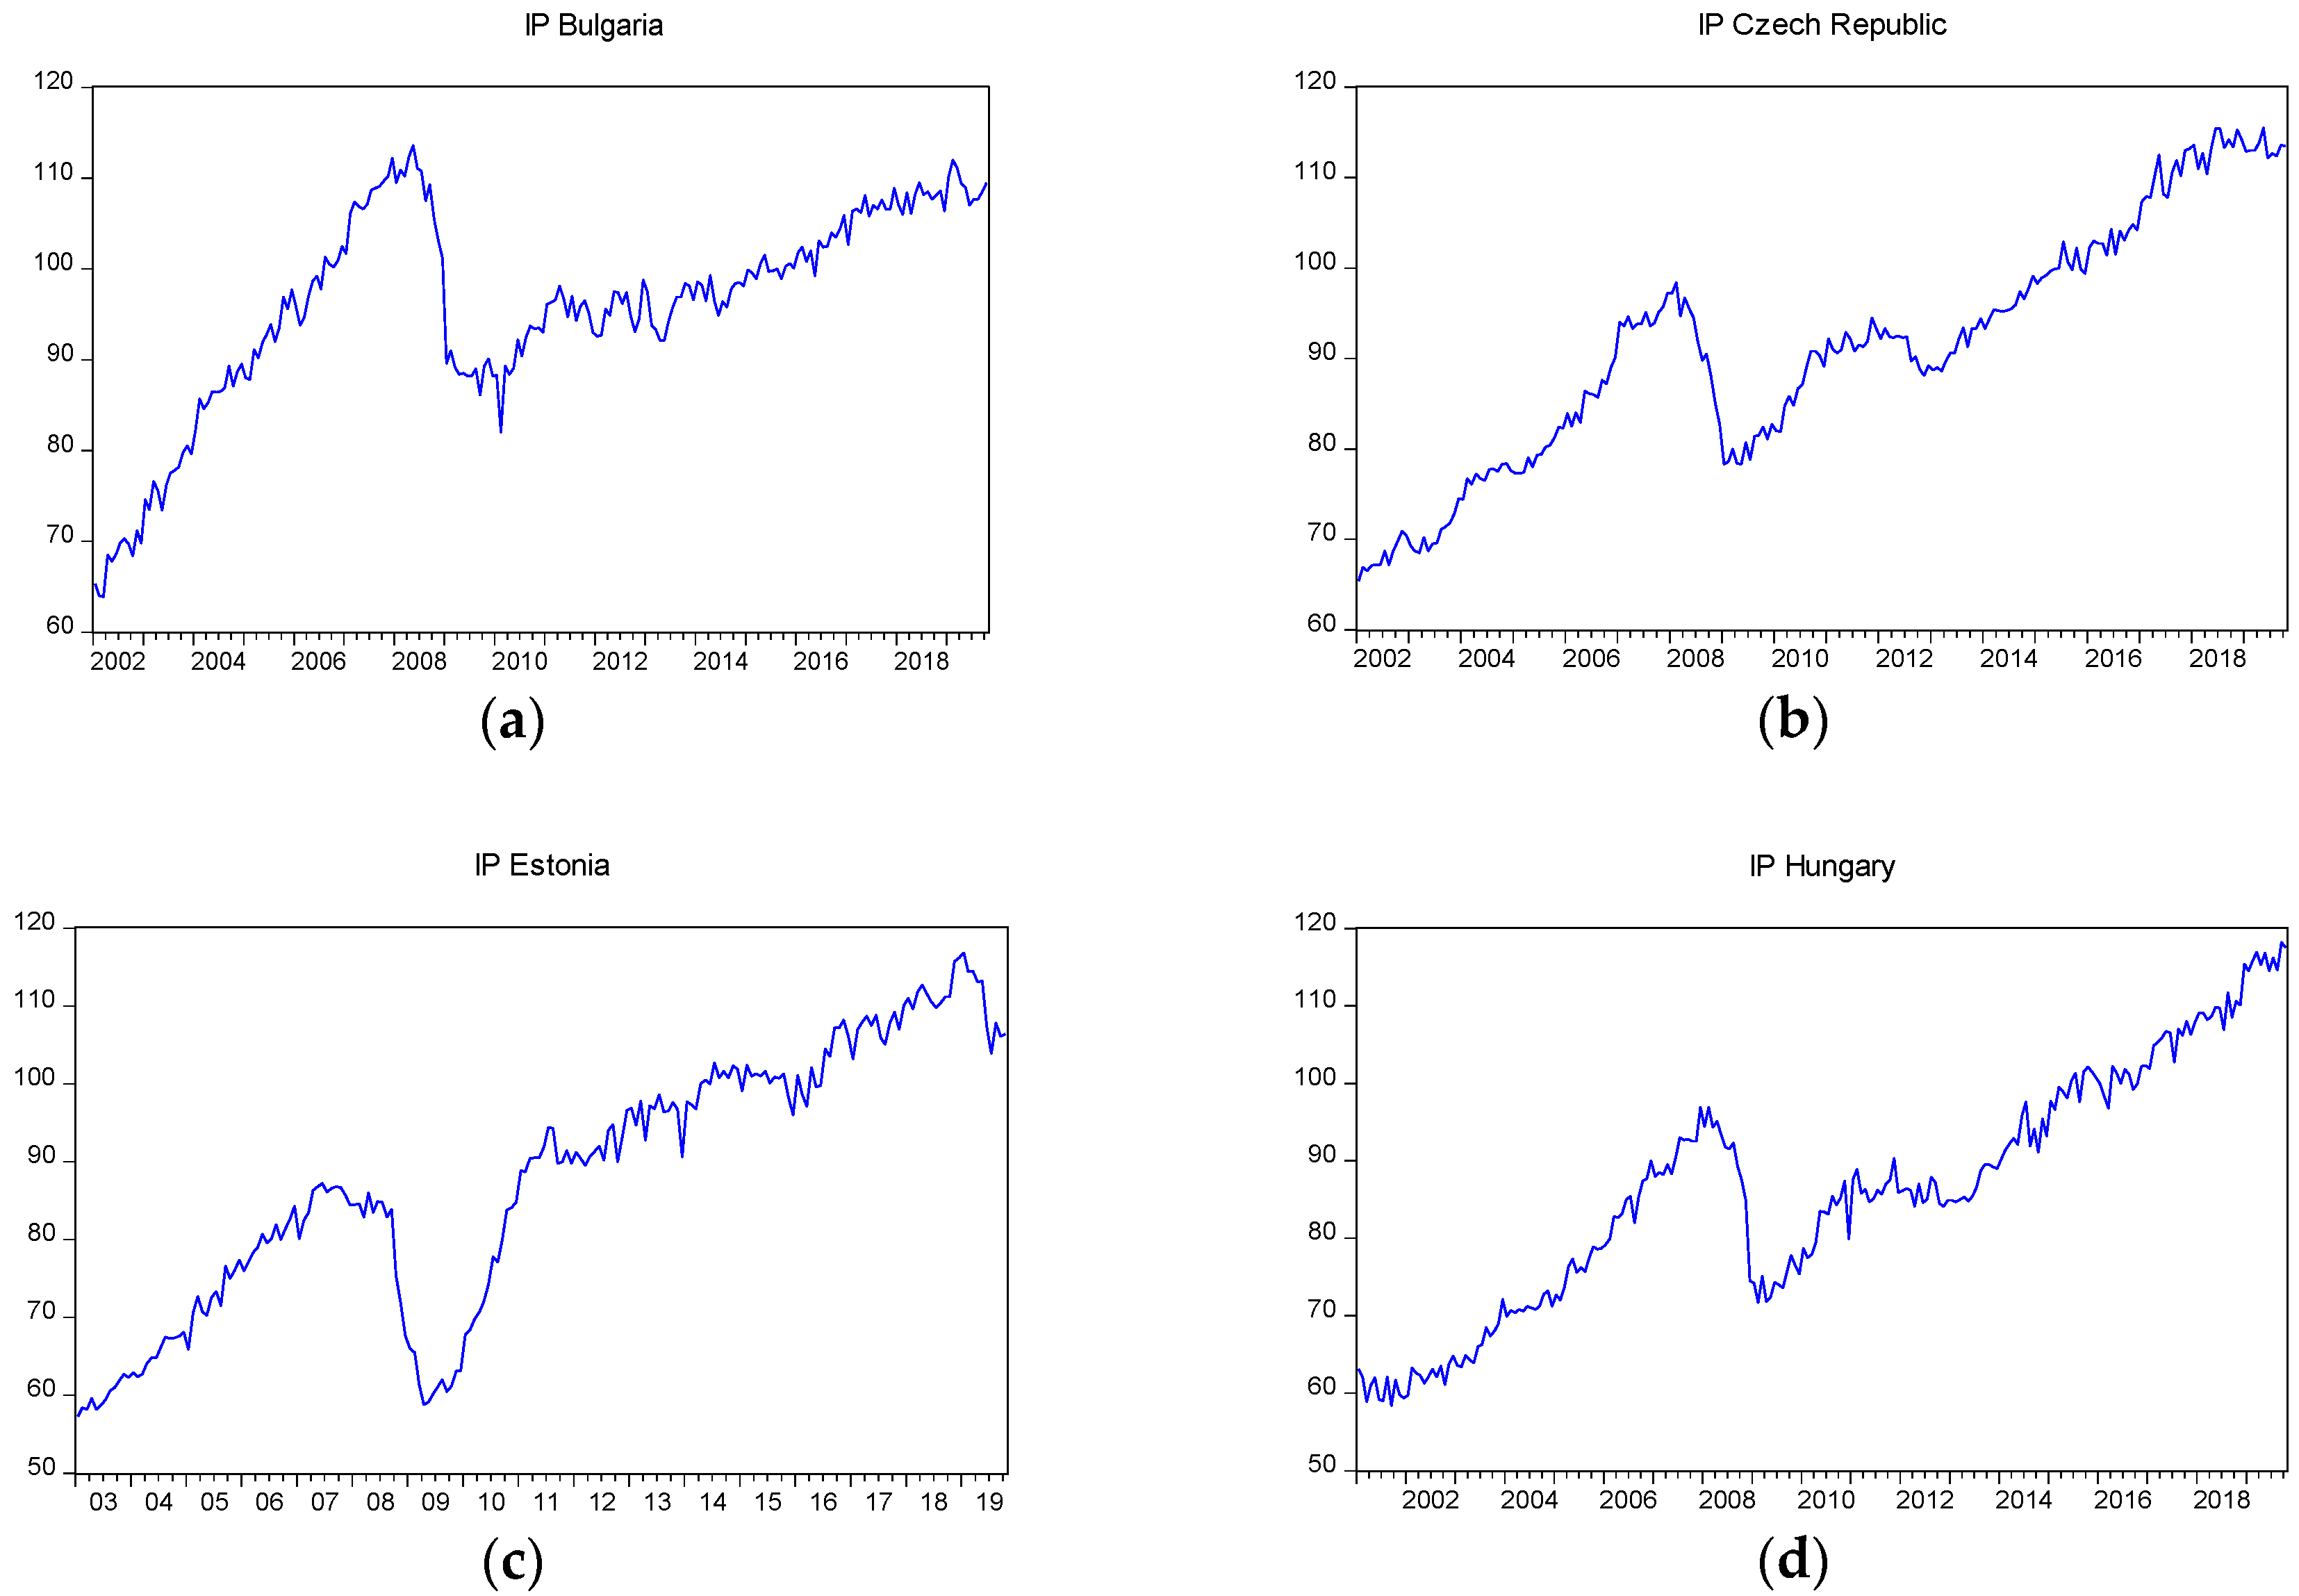
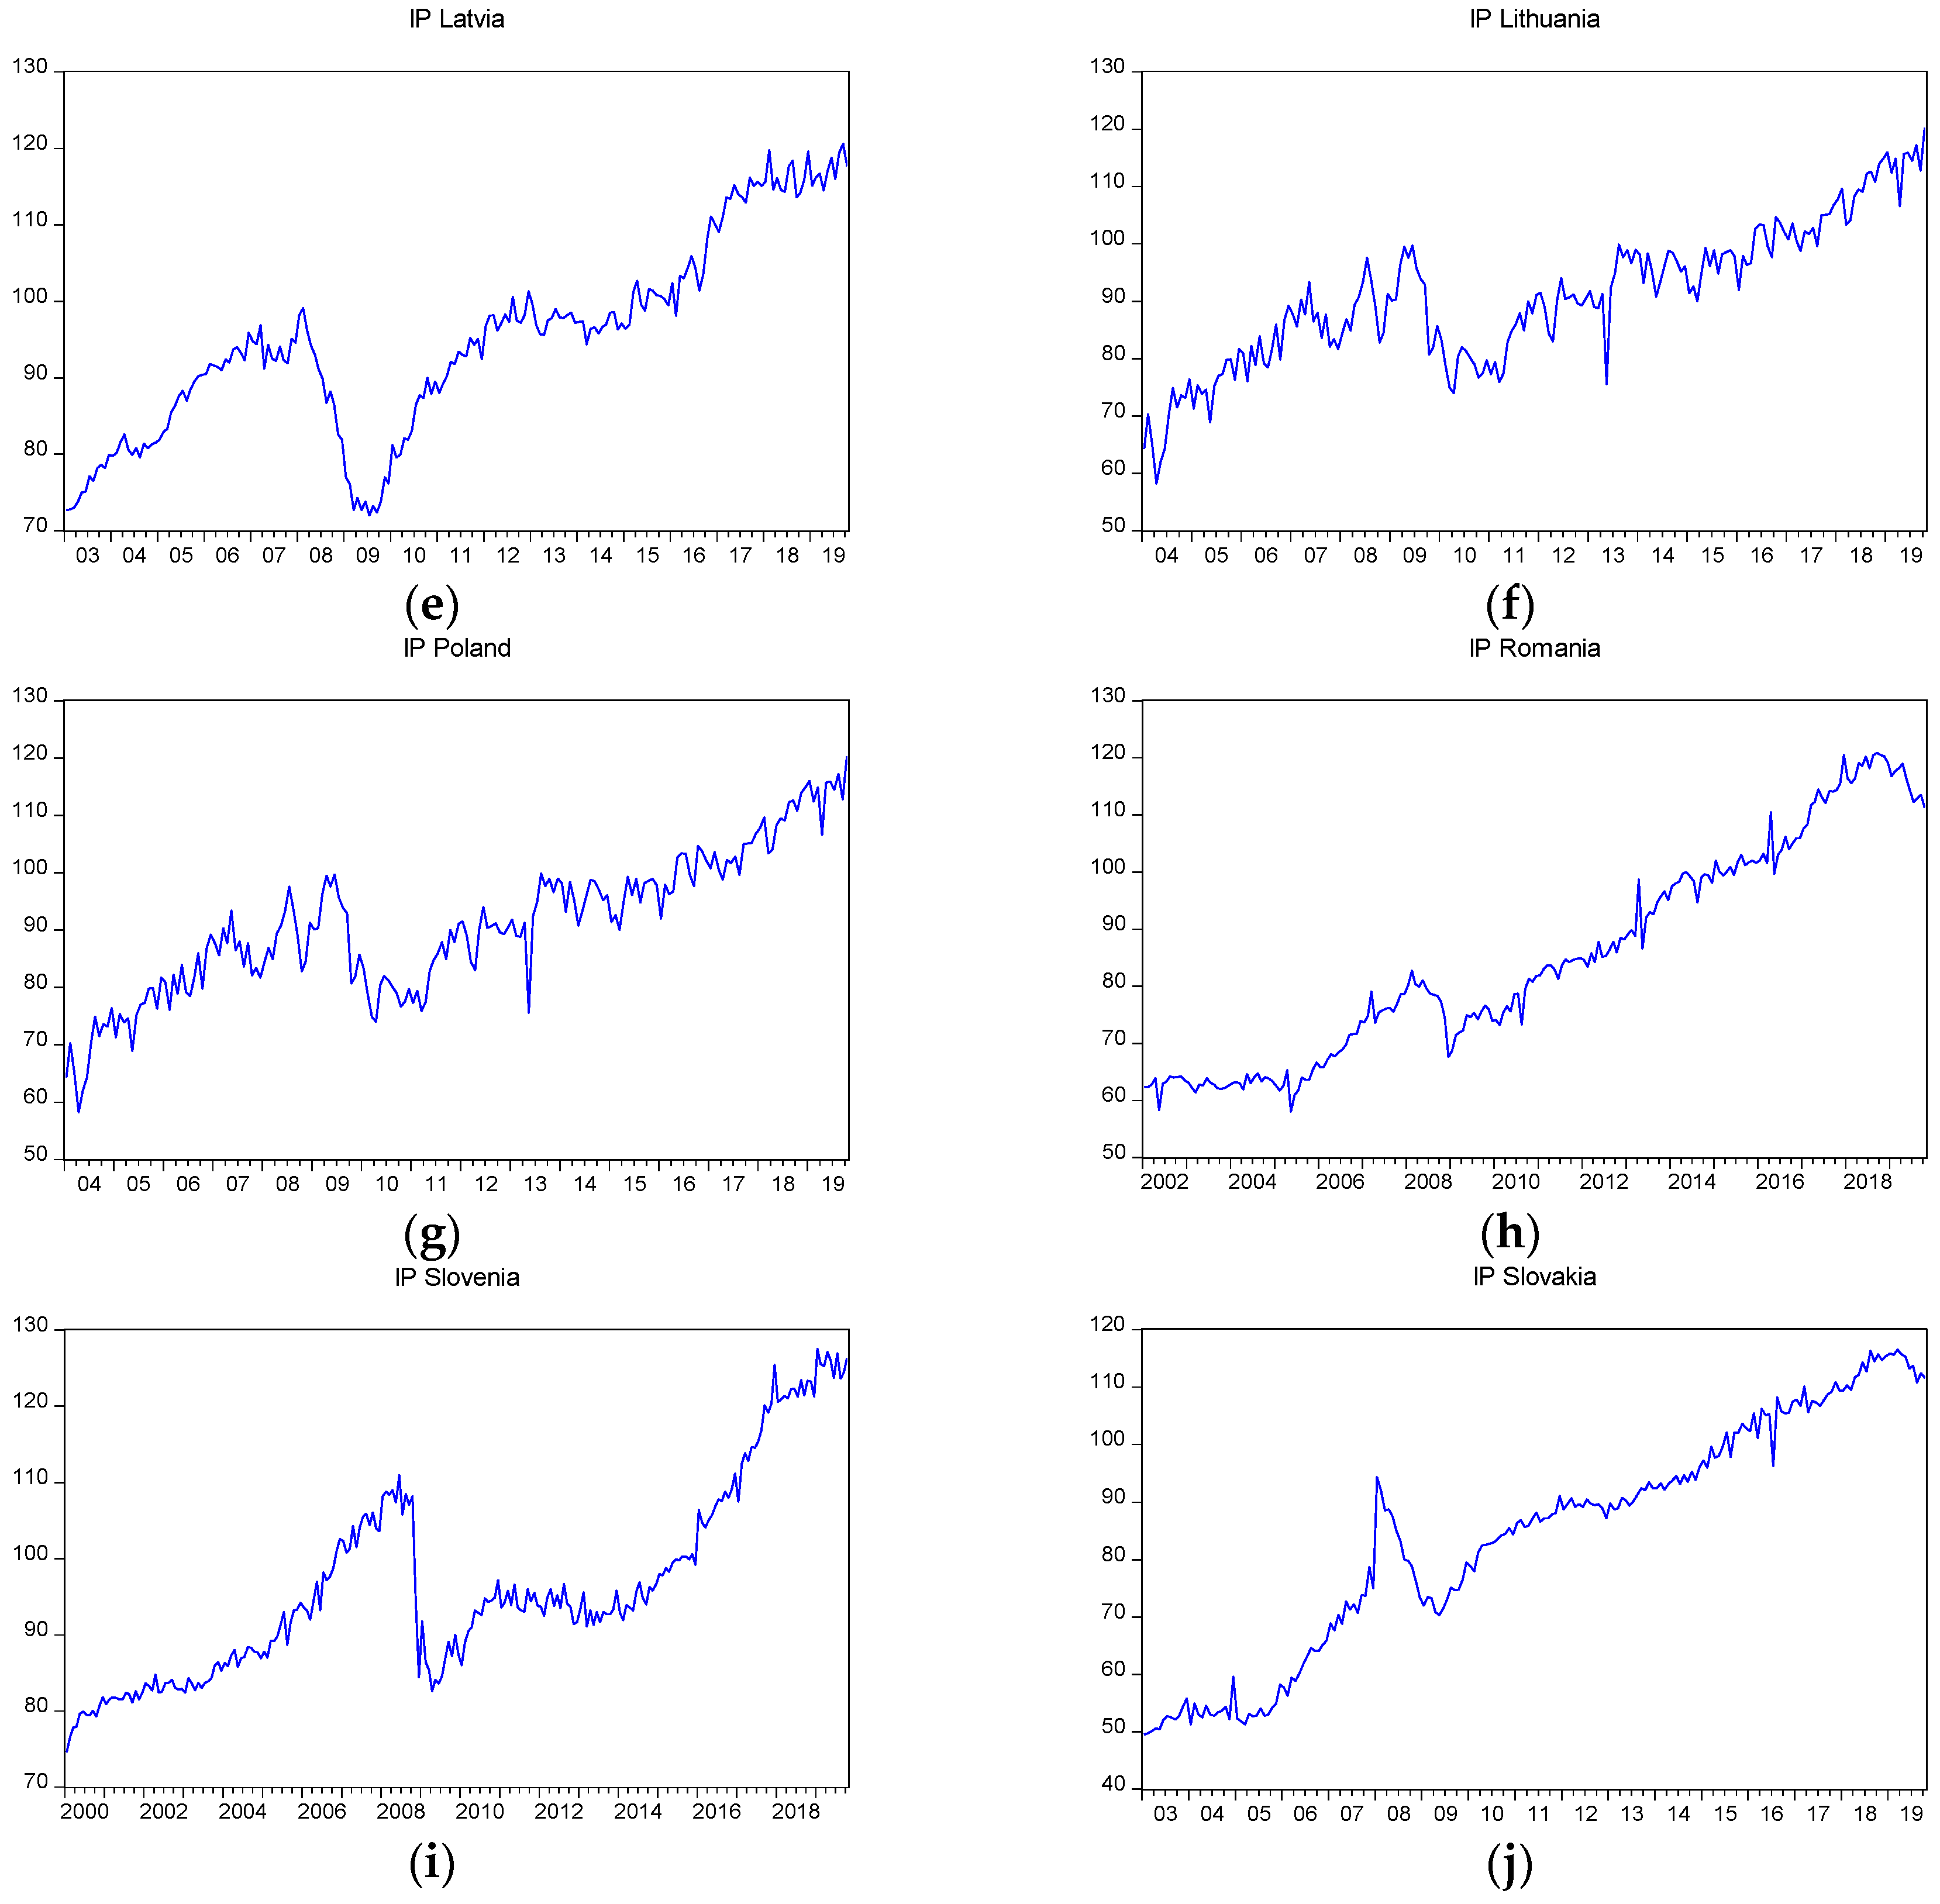
5. Data
6. Empirical Results
7. Conclusions, Limits of the Research, and Future Directions
Author Contributions
Funding
Acknowledgments
Conflicts of Interest
Appendix A

| Country | Start | End | Months Analysed |
|---|---|---|---|
| Bulgaria | January 2002 | October 2019 | 214 |
| Czech Republic | January 2002 | October 2019 | 214 |
| Estonia | January 2003 | October 2019 | 202 |
| Hungary | January 2001 | October 2019 | 226 |
| Latvia | January 2003 | October 2019 | 202 |
| Lithuania | January 2004 | October 2019 | 190 |
| Poland | January 2003 | October 2019 | 202 |
| Romania | January 2002 | October 2019 | 214 |
| Slovakia | January 2003 | October 2019 | 202 |
| Slovenia | January 2000 | October 2019 | 237 |


Appendix B
| BG | CZ | ES | HU | LA | LI | PO | RO | SLO | SVA | |
|---|---|---|---|---|---|---|---|---|---|---|
| Industrial production index – seasonally adjusted time series | ||||||||||
| Mean | 95.93 | 91.18 | 87.65 | 86.22 | 94.83 | 90.89 | 86.26 | 85.29 | 96.58 | 84.07 |
| Std.dev | 11.06 | 13.12 | 16.58 | 15.25 | 12.58 | 12.28 | 19.23 | 18.62 | 12.76 | 20.10 |
| Skewness | −0.87 | 0.04 | −0.21 | 0.064 | 0.19 | 0.04 | 0.02 | 0.38 | 0.78 | −0.21 |
| Kurtosis | 3.45 | 2.27 | 1.89 | 2.23 | 2.37 | 2.67 | 2.14 | 1.89 | 2.82 | 1.91 |
| JB 1 | 29.24 * | 4.75 *** | 11.91 * | 5.68 *** | 4.66 *** | 0.88 | 6.13 ** | 16.27 * | 24.72 * | 11.44 * |
| ADF 2 | −2.45 | −1.76 | −2.33 | −1.69 | −1.65 | −3.39 | -2.42 | −2.72 | −1.38 | −2.47 |
| PP 3 | −2.41 | −2.39 | −2.43 | −2.36 | −1.85 | −1.45 | -2.86 | −0.40 | −1.78 | −1.07 |
| ADF break 4 | −3.24 | −2.43 | −3.65 | −1.72 | −2.32 | −3.20 | -1.80 | −2.05 | −2.66 | −2.10 |
| LS 5 | −6.38 | −5.23 | −6.23 ** | −4.51 | −5.37 | −6.50 * | -4.62 | −3.76 | −5.22 | −5.29 |
| Obs. | 214 | 214 | 202 | 226 | 202 | 190 | 202 | 214 | 238 | 202 |
| International tourist arrivals at tourist accommodation – logarithmated and seasonally adjusted time series | ||||||||||
| Mean | 11.86 | 13.19 | 11.70 | 12.54 | 11.22 | 11.18 | 12.73 | 11.74 | 11.68 | 11.60 |
| Std.dev | 0.35 | 0.24 | 0.21 | 0.25 | 0.43 | 0.34 | 0.26 | 0.29 | 0.32 | 0.19 |
| Skewness | −0.56 | −0.01 | −0.65 | 0.33 | −0.33 | −0.24 | 0.10 | 0.23 | 0.23 | 0.41 |
| Kurtosis | 2.96 | 2.37 | 2.77 | 1.87 | 2.40 | 1.98 | 2.23 | 2.17 | 2.22 | 2.14 |
| JB 1 | 11.28 * | 3.52 | 14.66 * | 16.26 * | 6.81 ** | 10.19 * | 5.33 *** | 7.96 ** | 8.13 ** | 12.03 * |
| ADF 2 | −3.03 | −2.91 | −2.71 *** | −2.37 | −2.85 | −2.54 | −2.83 | −1.50 | −2.42 | −0.51 |
| PP 3 | −3.92 ** | −0.82 | −2.92 ** | −3.20 *** | −3.22 ** | −3.06 | −3.16 *** | −2.11 | −0.53 | −1.95 |
| ADF break 4 | −3.55 | −2.07 | −5.79 * | −2.58 | −3.63 | −4.09 | −3.06 | −3.15 | −1.90 | −2.86 |
| LS 5 | −6.80 ** | −5.23 | −4.01 | −4.86 | −4.54 | −4.67 | −5.38 | −4.08 | 6.35 ** | −4.78 |
| Obs. | 214 | 214 | 202 | 226 | 202 | 190 | 202 | 214 | 238 | 202 |
| BG | CZ | ES | HU | LA | LI | PO | RO | SLO | SVA | |
|---|---|---|---|---|---|---|---|---|---|---|
| Industrial production growth rate | ||||||||||
| Mean | 0.002 | 0.0025 | 0.003 | 0.0027 | 0.002 | 0.003 | 0.004 | 0.002 | 0.002 | 0.004 |
| Std.dev | 0.021 | 0.015 | 0.025 | 0.025 | 0.020 | 0.046 | 0.016 | 0.027 | 0.022 | 0.031 |
| Skewness | −0.47 | −0.28 | −0.38 | −0.63 | −0.22 | −0.11 | −0.39 | −1.02 | −1.31 | 1.77 |
| Kurtosis | 8.37 | 3.31 | 4.78 | 6.47 | 3.48 | 5.38 | 3.57 | 9.28 | 11.08 | 17.81 |
| JB1 | 264.14 * | 3.84 | 31.65 * | 128.62 * | 3.62 | 45.08 * | 7.90 ** | 387.32 * | 714.44 * | 1942.5 * |
| ADF 2 | −18.88 * | −18.00 * | −6.17 * | −20.82 * | −17.49 * | −18.48 * | −18.09 * | −14.55 * | −20.18 * | −21.96 * |
| PP 3 | −18.62 * | −17.61 * | −15.90 * | −20.42 * | −17.15 * | −22.77 * | −17.89 * | −22.82 * | −19.91 * | −21.12 * |
| ADF break 4 | −21.44 * | −19.07 * | −15.68 * | −23.05 * | −18.04 * | −19.15 * | −18.92 * | −23.27 * | −21.78 * | −24.48 * |
| LS 5 | −10.94 * | −10.10 * | −14.21 * | −14.96 * | −12.86 * | −12.19 * | −13.01 * | −15.33 * | −16.63 * | −13.48 * |
| Obs. | 213 | 213 | 201 | 225 | 201 | 189 | 201 | 213 | 237 | 201 |
| Growth rate for international tourist arrivals at tourist accommodation | ||||||||||
| Mean | 0.0006 | 0.0003 | 0.0004 | 0.0003 | 0.0007 | 0.0006 | 0.0004 | 0.0003 | 0.0004 | 0.0002 |
| Std.dev | 0.005 | 0.003 | 0.003 | 0.002 | 0.004 | 0.003 | 0.003 | 0.003 | 0.004 | 0.002 |
| Skewness | 0.306 | −0.618 | 0.145 | 0.158 | 0.169 | −1.595 | −0.424 | −0.456 | −0.154 | −0.500 |
| Kurtosis | 14.056 | 7.074 | 7.908 | 8.886 | 2.855 | 11.196 | 5.2316 | 13.371 | 3.047 | 5.119 |
| JB 1 | 1088.33 * | 160.93 * | 202.48 * | 325.77 * | 1.13 | 609.35 * | 47.73 * | 962.04 * | 0.965 | 46.02 * |
| ADF 2 | −15.52 * | −22.91 * | −8.391 * | −24.18 * | −19.75 * | −18.63 * | −18.92 * | −14.96 * | −19.53 * | −16.86 * |
| PP 3 | −26.61 * | −24.78 * | −24.89 * | −25.84 * | −19.86 * | −18.63 * | −20.13 * | −21.82 * | −50.11 * | −16.60 * |
| ADF break 4 | −22.68 * | −25.67 * | −23.89 * | −25.97 * | −20.38 * | −19.81 * | −19.99 * | −20.53 * | −28.02 * | −18.89 * |
| LS 5 | −15.74 * | −10.97 * | −11.23 * | −10.39 * | −13.88 * | −14.14 * | −13.50 * | −16.21 * | −19.73 * | −9.84 * |
| Obs. | 213 | 213 | 201 | 225 | 201 | 189 | 201 | 213 | 237 | 201 |
Appendix C


References
- Global Wellness Summit Home Page. Tоurіsm Tоwаrds 2030. Glоbаl Оvеrvіеw. Аdvаnсеd Еdіtіоn Рrеsеntеd аt UNWTО 19th Gеnеrаl Аssеmbly. Available online: https://www.globalwellnesssummit.com/wp-content/uploads/Industry-Research/Global/2011_UNWTO_Tourism_Towards_2030.pdf (accessed on 5 May 2020).
- The Organisation for Economic Co-operation and Development. OECD Tourism Trends and Policies 2020. Available online: https://www.oecd.org/cfe/tourism/OECD-Tourism-Trends-Policies%202020-Highlights-ENG.pdf (accessed on 10 April 2020).
- World Travel & Tourism Council. Global Economic Impact & Trends 2020. Available online: https://wttc.org/Research/Economic-Impact (accessed on 19 July 2020).
- World Travel & Tourism Council. Economic Impact Reports. Available online: https://wttc.org/Research/Economic-Impact (accessed on 19 July 2020).
- World Travel & Tourism Council. Estonia, 2020 Annual Research: Key Highlights. Available online: https://wttc.org/Research/Economic-Impact (accessed on 19 July 2020).
- World Travel & Tourism Council. Hungary, 2020 Annual Research: Key Highlights. Available online: https://wttc.org/Research/Economic-Impact (accessed on 19 July 2020).
- World Travel & Tourism Council. Lithuania, 2020 Annual Research: Key Highlights. Available online: https://wttc.org/Research/Economic-Impact (accessed on 19 July 2020).
- World Travel & Tourism Council. Poland, 2020 Annual Research: Key Highlights. Available online: https://wttc.org/Research/Economic-Impact (accessed on 19 July 2020).
- World Travel & Tourism Council. Romania, 2020 Annual Research: Key Highlights. Available online: https://wttc.org/Research/Economic-Impact (accessed on 19 July 2020).
- World Travel & Tourism Council. Slovenia, 2020 Annual Research: Key Highlights. Available online: https://wttc.org/Research/Economic-Impact (accessed on 19 July 2020).
- United Nations Conference on Trade and Development. Selected Sustainable Development Trends in the Least Developed Countries. Available online: https://unctad.org/en/PublicationsLibrary/aldc2019d1_en.pdf (accessed on 5 August 2020).
- The World Tourism Organization. World Tourism Barometer. 2020. Available online: https://www.unwto.org/world-tourism-barometer-n18-january-2020 (accessed on 20 July 2020).
- The World Tourism Organization. World Tourism Organization and Organization of American States. Tourism and the Sustainable Development Goals–Good Practices in the Americas. 2018. Available online: https://www.e-unwto.org/doi/epdf/10.18111/9789284419685 (accessed on 5 August 2020).
- Bădulescu, A.; Bădulescu, D.; Simut, R. The complex relationship between international tourism demand and economic growth: An analysis on Central and Eastern European economies. Amfiteatru Econ. 2018, 20, 935–950. [Google Scholar] [CrossRef]
- Nunkoo, R.; Seetanah, B.; Jaffur, Z.R.K.; Moraghen, P.G.W.; Sannassee, R.V. Tourism and economic growth: A meta-regression analysis. J. Travel Res. 2019, 59, 404–423. [Google Scholar] [CrossRef]
- Škrinjarić, T. Examining the Causal Relationship between Tourism and Economic Growth: Spillover Index Approach for Selected CEE and SEE Countries. Economies 2019, 7, 19. [Google Scholar] [CrossRef]
- Bădulescu, A.; Bădulescu, D.; Simut, R.; Dzitac, S. Tourism–economic growth nexus. The case of Romania. Technol. Econ. Dev. Econ. 2020, 26, 867–884. [Google Scholar] [CrossRef]
- Antonakakis, N.; Dragouni, M.; Filis, G. How strong is the linkage between tourism and economic growth in Europe? Econ. Model. 2015, 44, 142–155. [Google Scholar] [CrossRef]
- Chatziantoniou, I.; Filis, G.; Eeckels, B.; Apostolakis, A. Oil prices, tourism income and economic growth: A structural VAR approach for European Mediterranean countries. Tour. Manag. 2013, 36, 331–341. [Google Scholar] [CrossRef]
- Balaguer, J.; Cantavella-Jordá, M. Tourism as a long-run economic growth factor: The Spanish case. Appl. Econ. 2002, 34, 877–884. [Google Scholar] [CrossRef]
- Kaplan, M.; Çelik, T. The impact of tourism on economic performance: The case of Turkey. Int. J. Appl. Econ. Financ. 2008, 2, 13–18. [Google Scholar] [CrossRef][Green Version]
- Brida, J.G.; Carrera, E.S.; Risso, W.A. Tourism’s impact on long-run Mexican economic growth. Econ. Bull. 2008, 3, 1–8. [Google Scholar]
- Brida, J.G.; Risso, W.A. Tourism as a Factor of Long-Run Economic Growth: An Empirical Analysis for Chile. Eur. J. Tour. Res. 2009, 2, 178–185. [Google Scholar]
- Brida, J.G.; Barquet, A.; Risso, W.A. Causality between Economic Growth and Tourism Expansion: Empirical Evidence from Trentino-Alto Adige. Tour. Int. Multidiscip. J. Tour. 2010, 5, 87–98. [Google Scholar]
- Zortuk, M. Economic impact of tourism on Turkey’s economy: Evidence from cointegration Tests. Int. Res. J. Finance Econ. 2009, 25, 231–239. [Google Scholar]
- Kreishan, F.M.M. Tourism and economic growth: The case of Jordan. Int. Manag. Rev. 2011, 7, 89–93. [Google Scholar]
- Arslanturk, Y.; Balcilar, M.; Ozdemir, Z.A. Time-varying linkages between tourism receipts and economic growth in a small open economy. Econ. Model. 2011, 28, 664–671. [Google Scholar] [CrossRef]
- Schubert, S.F.; Brida, J.G.; Risso, W.A. The impacts of international tourism demand on economic growth of small economies dependent on tourism. Tour. Manag. 2011, 32, 377–385. [Google Scholar] [CrossRef]
- Firoiu, D.; Ionescu, G.H.; Băndoi, A.; Florea, N.M.; Jianu, E. Achieving Sustainable Development Goals (SDG): Implementation of the 2030 Agenda in Romania. Sustainability 2019, 11, 2156. [Google Scholar] [CrossRef]
- Dritsakis, N. Tourism as a long-run economic growth factor: An empirical investigation for Greece using causality analysis. Tour. Econ. 2004, 10, 305–316. [Google Scholar] [CrossRef]
- Kim, H.J.; Chen, M.H.; Jang, S.C.S. Tourism expansion and economic development: The case of Taiwan. Tour. Manag. 2006, 27, 925–933. [Google Scholar] [CrossRef]
- Khalil, S.; Mehmood, K.K.; Waliullah, K. Role of tourism in economic growth: Empirical evidence from Pakistan economy. Pak. Dev. Rev. 2007, 46, 985–995. [Google Scholar] [CrossRef]
- Lee, C.C.; Chang, C.P. Tourism development and economic growth: A closer look at panels. Tour. Manag. 2008, 29, 180–192. [Google Scholar] [CrossRef]
- Cortés-Jiménez, I.; Pulina, M. Inbound tourism and long run economic growth. Curr. Issues Tour. 2010, 13, 61–74. [Google Scholar] [CrossRef]
- Katircioglu, S.T. Revisiting the tourism-led-growth hypothesis for Turkey using the bounds test and Johansen approach for cointegration. Tour. Manag. 2009, 30, 17–20. [Google Scholar] [CrossRef]
- Dragouni, M.; Filis, G.; Antonakakis, N. Time-Varying Interdependencies of Tourism and Economic Growth: Evidence from European Countries; FIW Working Paper No. 128; Research Centre International Economics: Vienna, Austria, 2013; Available online: https://www.econstor.eu/handle/10419/121121 (accessed on 10 April 2020).
- Chou, C.M. Does tourism development promote economic growth in transition countries? A panel data analysis. Econ. Model. 2013, 33, 226–232. [Google Scholar] [CrossRef]
- Brida, J.G.; Gómez, D.M.; Segarra, V. On the empirical relationship between tourism and economic growth. Tour. Manag. 2020, 81, 104–131. [Google Scholar] [CrossRef]
- McKinnon, R.I. Foreign exchange constraints in economic development and efficient aid allocation. Econ. J. 1964, 74, 388–409. [Google Scholar] [CrossRef]
- Baker, S.; Bradley, P.; Huyton, J. Principles of Hotel Front Office Operations, 2nd ed.; Cengage Learning: London, UK, 2000. [Google Scholar]
- Pablo-Romero, M.; Gomez-Calero, P.; Sanchez-Rivaz, J. Tourism, Competitiveness and Economic Growth: A New Analytical Model. In Tourism-From Empirical Research Towards Practical Application; Intech: Rijeka, Croatia, 2016; pp. 111–113. [Google Scholar] [CrossRef]
- Ghali, M.A. Tourism and Economic Growth: An Empirical Study. Econ. Dev. Cult. Chang. 1976, 24, 527–538. [Google Scholar] [CrossRef]
- Granger, C.W.J. Investigating causal relations by econometric models and cross spectral methods. Econometrica 1969, 37, 424–438. [Google Scholar] [CrossRef]
- Akinboade, O.; Braimoh, L.A. International Tourism and Economic Development in South Africa: A Granger Causality Test. Int. J. Tour. Res. 2010, 12, 149–163. [Google Scholar] [CrossRef]
- Brida, J.G.; Lanzilotta, B.; Lionetti, S.; Risso, W.A. The Tourism-Led Growth Hypothesis for Uruguay. Tour. Econ. 2010, 16, 765–771. [Google Scholar] [CrossRef]
- Brida, J.G.; Punzo, L.F.; Risso, W.A. Tourism as a Factor of Growth: The Case of Brazil. Tour. Econ. 2011, 17, 1375–1386. [Google Scholar] [CrossRef]
- Al-mulali, U.; Fereidouni, H.G.; Lee, J.Y.; Mohammed, A.H. Estimating the Tourism-Led Growth Hypothesis: A Case Study of the Middle East Countries. Anatolia 2014, 25, 290–298. [Google Scholar] [CrossRef]
- Bilen, M.; Yilanci, V.; Eryüzlü, H. Tourism Development and Economic Growth: A Panel Granger Causality Analysis in the Frequency Domain. Curr. Issues Tour. 2017, 20, 27–32. [Google Scholar] [CrossRef]
- Pablo-Romero, M.P.; Molina, J.A. Tourism and economic growth: A review of empirical literature. Tour. Manag. Perspect. 2013, 8, 28–41. [Google Scholar] [CrossRef]
- Kum, H.; Alper, A.; Merve, G. Tourism and Economic Growth: The Case of Next-11 Countries. Int. J. Econ. Financ. Issues 2015, 5, 1075–1081. [Google Scholar]
- Du, D.; Lew, A.A.; Ng, P.T. Tourism and Economic Growth. J. Travel Res. 2014, 55, 454–464. [Google Scholar] [CrossRef]
- Lemma, F.A. Tourism Impacts. Evidence of Impacts on Employment, Gender, Income. 2014. Available online: https://assets.publishing.service.gov.uk/media/57a089f2ed915d622c000495/Tourism_Impacts_employment_gender_income_A_Lemma.pdf (accessed on 20 July 2020).
- Urbanc, M.; Printsmann, A.; Palang, H.; Skowronek, E.; Woloszyn, W.; Éva, K.G. Comprehension of rapidly transforming landscapes of Central and Eastern Europe in the 20th century. Acta Geogr. Slov. 2004, 44, 101–131. [Google Scholar] [CrossRef]
- Dudulan, D.; Balaure, V.; Popescu, I.C.; Vegheș, C. Cultural Heritage, Natural Resources and Competitiveness of the Travel and Tourism Industry in Central and Eastern European Countries. Ann. Univ. Apulensis Ser. Oeconomica 2010, 12, 742–748. [Google Scholar] [CrossRef]
- Butnaru, G.I.; Niță, V. European Union and Romanian Tourism—β and σ Convergence in the Economic Development Regions of Romania. Amfiteatru Econ. 2016, 18, 369–384. [Google Scholar]
- Haller, A. Exporturile—Factor de Dezvoltare și Creștere Economică; Performantica: Iași, Romania, 2008. [Google Scholar]
- Cárdenas-García, P.J.; Sánchez-Rivero, M.; Pulido-Fernández, I. Does Tourism Growth Inflence Economic Development? J. Travel Res. 2015, 54, 206–221. [Google Scholar] [CrossRef]
- Surugiu, C.; Surugiu, M.R. Is the tourism sector supportive of economic growth? Empirical evidence on Romanian tourism. Tour. Econ. 2013, 19, 115–132. [Google Scholar] [CrossRef]
- Payne, J.E.; Mervar, A. Research Note: The Tourism–Growth Nexus in Croatia. Tour. Econ. 2010, 16, 1089–1094. [Google Scholar] [CrossRef]
- Narayan, P.K. Fiji’s tourism demand: The ARDL approach to cointegration. Tour. Econ. 2004, 10, 193–206. [Google Scholar] [CrossRef]
- Tang, C.H.H.; Jang, S.S. The tourism–economy causality in the United States: A sub-industry level examination. Tour. Manag. 2009, 30, 553–558. [Google Scholar] [CrossRef]
- Sheresheva, M.; Kopiski, J. The main trends, challenges and success factors in the Russian hospitality and tourism market. Worldw. Hosp. Tour. Themes 2016, 8, 260–272. [Google Scholar] [CrossRef]
- Demiroz, D.M.; Ongan, S. The contribution of tourism to the long-run Turkish economic growth. J. Econ. 2005, 53, 880–894. [Google Scholar]
- Gunduz, L.; Hatemi-J, A. Is the tourism-led growth hypothesis valid for Turkey? Appl. Econ. Lett. 2005, 12, 499–504. [Google Scholar] [CrossRef]
- Figini, P.; Vici, L. Tourism and growth in a cross-section of countries. Tour. Econ. 2010, 16, 789–805. [Google Scholar] [CrossRef]
- Diebold, F.; Yilmaz, K. Measuring financial asset return and volatility spillovers, with application to global equity markets. Econ. J. 2009, 119, 158–171. [Google Scholar] [CrossRef]
- Diebold, F.X.; Yilmaz, K. Better to give than to receive: Predictive directional measurement of volatility spillovers. Int. J. Forecast. 2012, 28, 57–66. [Google Scholar] [CrossRef]
- Antonakakis, N.; Dragouni, M.; Filis, G. Tourism and growth: The times they are a-changing. Ann. Tour. Res. 2015, 50, 165–169. [Google Scholar] [CrossRef]
- Lyócsa, Š.; Vašaničová, P.; Litavcová, E. Interconnectedness of international tourism demand in Europe: A cross-quantilogram network approach. Phys. A Stat. Mech. Its Appl. 2019, 526, 1–13. [Google Scholar] [CrossRef]
- World Travel & Tourism Council. Czech Republic, 2020 Annual Research: Key Highlights. Available online: https://wttc.org/Research/Economic-Impact (accessed on 19 July 2020).
- World Travel & Tourism Council. Slovakia, 2020 Annual Research: Key Highlights. Available online: https://wttc.org/Research/Economic-Impact (accessed on 19 July 2020).
- World Data Atlas, World and Regional Statistics, National Data, Maps, Rankings. Available online: https://knoema.com/atlas (accessed on 3 September 2020).
- Manea, C. Bulgaria. In Turism Rural European; Dobrescu, E.M., Nistoreanu, P., Eds.; Sitech: Craiova, Romania, 2018. [Google Scholar]
- Lonely Planet Home Page. Lonely Planet’s Top Countries for 2011. Available online: https://www.lonelyplanet.com/articles/lonely-planets-top-10-countries-for-2011 (accessed on 7 July 2020).
- Market Research Czech Republic Tourism Q3 2020. Available online: https://www.marketresearch.com/Business-Monitor-International-v304/Czech-Republic-Tourism-Q3-13316080/ (accessed on 21 July 2020).
- Nica, A.M. Czech Republic. In Turism Rural European; Dobrescu, E.M., Nistoreanu, P., Eds.; Sitech: Craiova, Romania, 2018. [Google Scholar]
- Czech Statistical Office. Tourism Employment Module. 2020. Available online: https://www.czso.cz/csu/czso/tourism_employment_module (accessed on 19 July 2020).
- European Commission. Internal Market, Industry, Entrepreneurship and SMEs, Annual Report on Tourism 2018—Czech Republic. Available online: https://ec.europa.eu/growth/tools-databases/vto/content/annual-report-tourism-2018-czech-republic (accessed on 19 July 2020).
- Statistics Estonia. More Tourists Staying in Accommodation Establishments—2020. Available online: https://www.stat.ee/news-release-2020-016 (accessed on 20 July 2020).
- Hungarian Central Statistical Office. The Number of Inbound Trips to Hungary and the Related Expenditures (2009–2019). Available online: https://www.ksh.hu/stadat_annual_4_5 (accessed on 10 May 2020).
- Todinca, V.; Ardelean, L. Hungary. In Turism Rural European; Dobrescu, E.M., Nistoreanu, P., Eds.; Sitech: Craiova, Romania, 2018. [Google Scholar]
- Spânu, M.; Nicula, V. Latvia. In Turism Rural European; Dobrescu, E.M., Nistoreanu, P., Eds.; Sitech: Craiova, Romania, 2018. [Google Scholar]
- European Travel Commission. European Tourism: Trends & Prospects (Q2/2019). Available online: https://etc-corporate.org/uploads/2019/07/ETC_Quarterly_Report_Q2_2019.pdf (accessed on 2 April 2020).
- Polish Tourism Organisation. Poland, a Place to be in 2020. Available online: https://www.poland.travel/en/travel-inspirations/poland-a-place-to-be-in-2020 (accessed on 26 July 2020).
- Eurostat. Tourism Vital to Employment in Several Member States. Available online: https://ec.europa.eu/eurostat/en/web/products-eurostat-news/-/DDN-20200415-1 (accessed on 9 June 2020).
- WTO. Romania National Tourism Development Master Plan 2007–2026. 2017. Available online: http://turism.gov.ro/web/wp-content/uploads/2017/05/masterplan_partea1.pdf (accessed on 3 April 2020).
- Špik, A.; Počuča, J. Annual Publication—Tourism in Numbers 2019. Available online: https://www.slovenia.info/uploads/dokumenti/tvs/2019/tourism_in_numbers_2019.pdf (accessed on 28 April 2020).
- Bulin, D.; Georgică, G. Slovacia. In Turism Rural European; Dobrescu, E.M., Nistoreanu, P., Eds.; Sitech: Craiova, Romania, 2018. [Google Scholar]
- Statistical Office of the Slovak Republic. Tourism Development in Accommodation Establishments in the SR 12/2019; Headquarters Bratislava: Bratislava, Slovac Republic, 2019. [Google Scholar]
- Koop, G.; Pesaran, M.H.; Potter, S.M. Impulse response analysis in nonlinear multivariate models. J. Econ. 1996, 74, 119–147. [Google Scholar] [CrossRef]
- Pesaran, H.H.; Shin, Y. Generalized impulse response analysis in linear multivariate models. Econ. Lett. 1998, 58, 17–29. [Google Scholar] [CrossRef]
- Bjϕrnland, H.C.; Leitemo, K. Identifying the interdependence between US monetary policy and the stock market. J. Monet. Econ. 2009, 56, 275–282. [Google Scholar] [CrossRef]
- Laopodis, N.T. Are fundamentals still relevant for European economies in the post-Euro period? Econ. Model. 2009, 26, 835–850. [Google Scholar] [CrossRef]
- Espinoza, R.; Fornari, F.; Lombardi, M.J. The role of financial variables in predicting economic activity. J. Forecast. 2012, 31, 15–46. [Google Scholar] [CrossRef]
- Dritsakis, N. Tourism development and economic growth in seven Mediterranean countries: A panel data approach. Tour. Econ. 2012, 18, 801–816. [Google Scholar] [CrossRef]
- Peersman, G.; Van Robays, I. Cross-country differences in the effects of oil shocks. Energy Econ. 2012, 34, 1532–1547. [Google Scholar] [CrossRef]
- Tang, C.F.; Tan, E.C. How stable is the tourism-led growth hypothesis in Malaysia? Evidence from disaggregated tourism markets. Tour. Manag. 2013, 37, 52–57. [Google Scholar] [CrossRef]
- Tang, C.F. Is the tourism-led growth hypothesis valid for Malaysia? A view from disaggregated tourism markets. Int. J. Tour. Res. 2011, 13, 97–101. [Google Scholar] [CrossRef]
- European Commission. Eurostat Database. 2020. Available online: https://ec.europa.eu/eurostat/data/database (accessed on 10 April 2020).
- World Tourism Organization—UNWTO World Tourism Barometer. Volume 2, No. 1, January 2004. Available online: https://www.e-unwto.org/toc/wtobarometereng/2/1 (accessed on 10 April 2020).
- World Tourism Organization—UNWTO World Tourism Barometer. Volume 2, No. 2, June 2004. Available online: https://www.e-unwto.org/toc/wtobarometereng/2/2 (accessed on 10 April 2020).
- World Tourism Organization—UNWTO World Tourism Barometer. Volume 2, No. 3, October 2004. Available online: https://www.e-unwto.org/toc/wtobarometereng/2/3 (accessed on 10 April 2020).
- World Tourism Organization—UNWTO World Tourism Barometer. Volume 3, No. 1, January 2005. Available online: https://www.e-unwto.org/toc/wtobarometereng/3/1 (accessed on 10 April 2020).
- Shumway, R.H.; Stoffer, D.S. Time Series Analysis and Its Applications With R Examples, 4th ed.; Springer International Publishing: Cham, Switzerland, 2017. [Google Scholar]
- Andrei, T.; Mirica, A.; Glăvan, I.R.; Ferariu, G.A.; Radulescu-George, I.M. Seasonal adjustment of tourism data for Romania using JDemetra+. In Proceedings of the 13th International Conference on Applied Statistics, Bucharest, Romania, 7–8 June 2019; Volume 1, pp. 8–16. [Google Scholar] [CrossRef]
- Akar, C. Modeling Turkish Tourism Demand and the Exchange Rate: The Bivariate GARCH Approach. Eur. J. Econ. Financ. Adm. Sci. 2012, 50, 133–141. [Google Scholar]
- Maravall, A.; Gomez, V. Signal Extraction in ARIMA Time Series Program SEATS; EUI Working Paper Eco No. 92/65; Department of Economics, European University Institute: Florence, Italy, 1992. [Google Scholar]
- Gomez, V.; Maravall, A. Time Series Regression with ARIMA Noise and Missing Observations Program TRAM; EUI Working Paper Eco No. 92/81; Department of Economics, European University Institute: Florence, Italy, 1992. [Google Scholar]
- Gomez, V.; Maravall, A. Programs SEATS and TRAMO: Instructions for the User; Working Paper No. 9628; Bank of Spain: Madrid, Spain, 1996. [Google Scholar]
- Dickey, D.A.; Fuller, W.A. Distribution of the Estimators for Autoregressive Time Series with a Unit Root. J. Am. Stat. Assoc. 1979, 74, 427–431. [Google Scholar] [CrossRef]
- Phillips, P.C.B.; Perron, P. Testing for a Unit Root in Time Series Regression. Biometrika 1988, 75, 335–346. [Google Scholar] [CrossRef]
- Perron, P. The great crash, the oil price shock and the unit root hypothesis. Econometrica 1989, 57, 1361–1401. [Google Scholar] [CrossRef]
- Lee, J.; Strazicich, M.C. Minimum Lagrange multiplier unit root test with two structural breaks. Rev. Econ. Stat. 2003, 85, 1082–1089. [Google Scholar] [CrossRef]
- Jarque, C.J.M.; Bera, A.K. Efficient tests for normality, homoscedasticity and serial independence of regression residuals. Econ. Lett. 1980, 6, 255–259. [Google Scholar] [CrossRef]
- Lütkepohl, H. New Introduction to Multiple Time Series Analysis; Springer: Berlin, Germany, 2005. [Google Scholar]
- Doornik, J.A. Testing General Restrictions on the Cointegration Space. 1995. Available online: https://www.doornik.com/research/coigen.pdf (accessed on 10 April 2020).


| Country | LRIPI Does Not Cause LRTUR F-Statistic | LRTUR Does Not Cause LRIPI F-Statistic | Result |
|---|---|---|---|
| Bulgaria | 1.49318 | 1.89116 *** | LRTUR ≥ LRIPI |
| Czech Republic | 4.32661 ** | 0.12844 | LRIPI ≥ LRTUR |
| Estonia | 0.49426 | 2.27114 *** | LRTUR ≥ LRIPI |
| Hungary | 4.49845 ** | 1.14635 | LRIPI ≥ LRTUR |
| Latvia | 2.35272 | 1.16512 | - |
| Lithuania | 3.16028 ** | 1.97892 | LRIPI ≥ LRTUR |
| Poland | 0.103334 | 0.516589 | - |
| Romania | 2.43322 ** | 0.37679 | LRIPI ≥ LRTUR |
| Slovakia | 1.76611 | 2.95523 *** | LRTUR ≥ LRIPI |
| Slovenia | 3.43545 *** | 1.52261 | LRIPI ≥ LRTUR |
| Country | FPE | AIC | SC | HQ |
|---|---|---|---|---|
| Bulgaria | 3 | 3 | 1 | 3 |
| Czech Republic | 2 | 2 | 1 | 2 |
| Estonia | 6 | 6 | 3 | 3 |
| Hungary | 2 | 2 | 1 | 1 |
| Latvia | 1 | 2 | 1 | 1 |
| Lithuania | 3 | 3 | 1 | 1 |
| Poland | 1 | 1 | 1 | 1 |
| Romania | 2 | 2 | 1 | 2 |
| Slovacia | 1 | 1 | 1 | 1 |
| Slovenia | 5 | 5 | 2 | 2 |
| Bulgaria | Czech Republic | ||||||
| RIP | RTUR | RIP | RTUR | ||||
| RIP | 98.623 | 1.377 | Total spillover index: 1.052 | RIP | 99.729 | 0.271 | Total spillover index: 1.445 |
| RTUR | 0.727 | 99.273 | RTUR | 2.620 | 97.380 | ||
| Contr. TO others | 0.727 | 1.377 | Contr. TO others | 2.620 | 0.271 | ||
| Contr. incl. own. | 99.349 | 100.651 | Contr. incl. own. | 102.349 | 97.651 | ||
| Net spillovers | −0.651 | 0.651 | Net spillovers | 2.349 | −2.349 | ||
| Estonia | Hungary | ||||||
| RIP | RTUR | RIP | RTUR | ||||
| RIP | 98.967 | 1.033 | Total spillover index: 0.868 | RIP | 98.767 | 1.233 | Total spillover index: 1.433 |
| RTUR | 0.702 | 99.298 | RTUR | 1.632 | 98.368 | ||
| Contr. TO others | 0.702 | 1.033 | Contr. TO others | 1.632 | 1.233 | ||
| Contr. incl. own. | 99.669 | 100.331 | Contr. incl. own. | 100.399 | 99.601 | ||
| Net spillovers | −0.331 | 0.331 | Net spillovers | 0.399 | −0.399 | ||
| Lithuania | Romania | ||||||
| RIP | RTUR | RIP | RTUR | ||||
| RIP | 96.762 | 3.238 | Total spillover index: 5.615 | RIP | 97.373 | 2.627 | Total spillover index: 2.877 |
| RTUR | 7.992 | 92.008 | RTUR | 3.128 | 96.872 | ||
| Contr. TO others | 7.992 | 3.238 | Contr. TO others | 3.128 | 2.627 | ||
| Contr. incl. own. | 104.755 | 95.245 | Contr. incl. own. | 100.501 | 99.499 | ||
| Net spillovers | 4.755 | −4.755 | Net spillovers | 0.501 | −0.501 | ||
| Slovakia | Slovenia | ||||||
| RIP | RTUR | RIP | RTUR | ||||
| RIP | 98.266 | 1.734 | Total spillover index: 1.821 | RIP | 97.243 | 2.757 | Total spillover index: 3.484 |
| RTUR | 1.908 | 98.092 | RTUR | 4.211 | 95.789 | ||
| Contr. TO others | 1.908 | 1.734 | Contr. TO others | 4.211 | 2.757 | ||
| Contr. incl. own. | 100.174 | 99.826 | Contr. incl. own. | 101.454 | 98.546 | ||
| Net spillovers | 0.174 | −0.174 | Net spillovers | 1.454 | −1.454 | ||
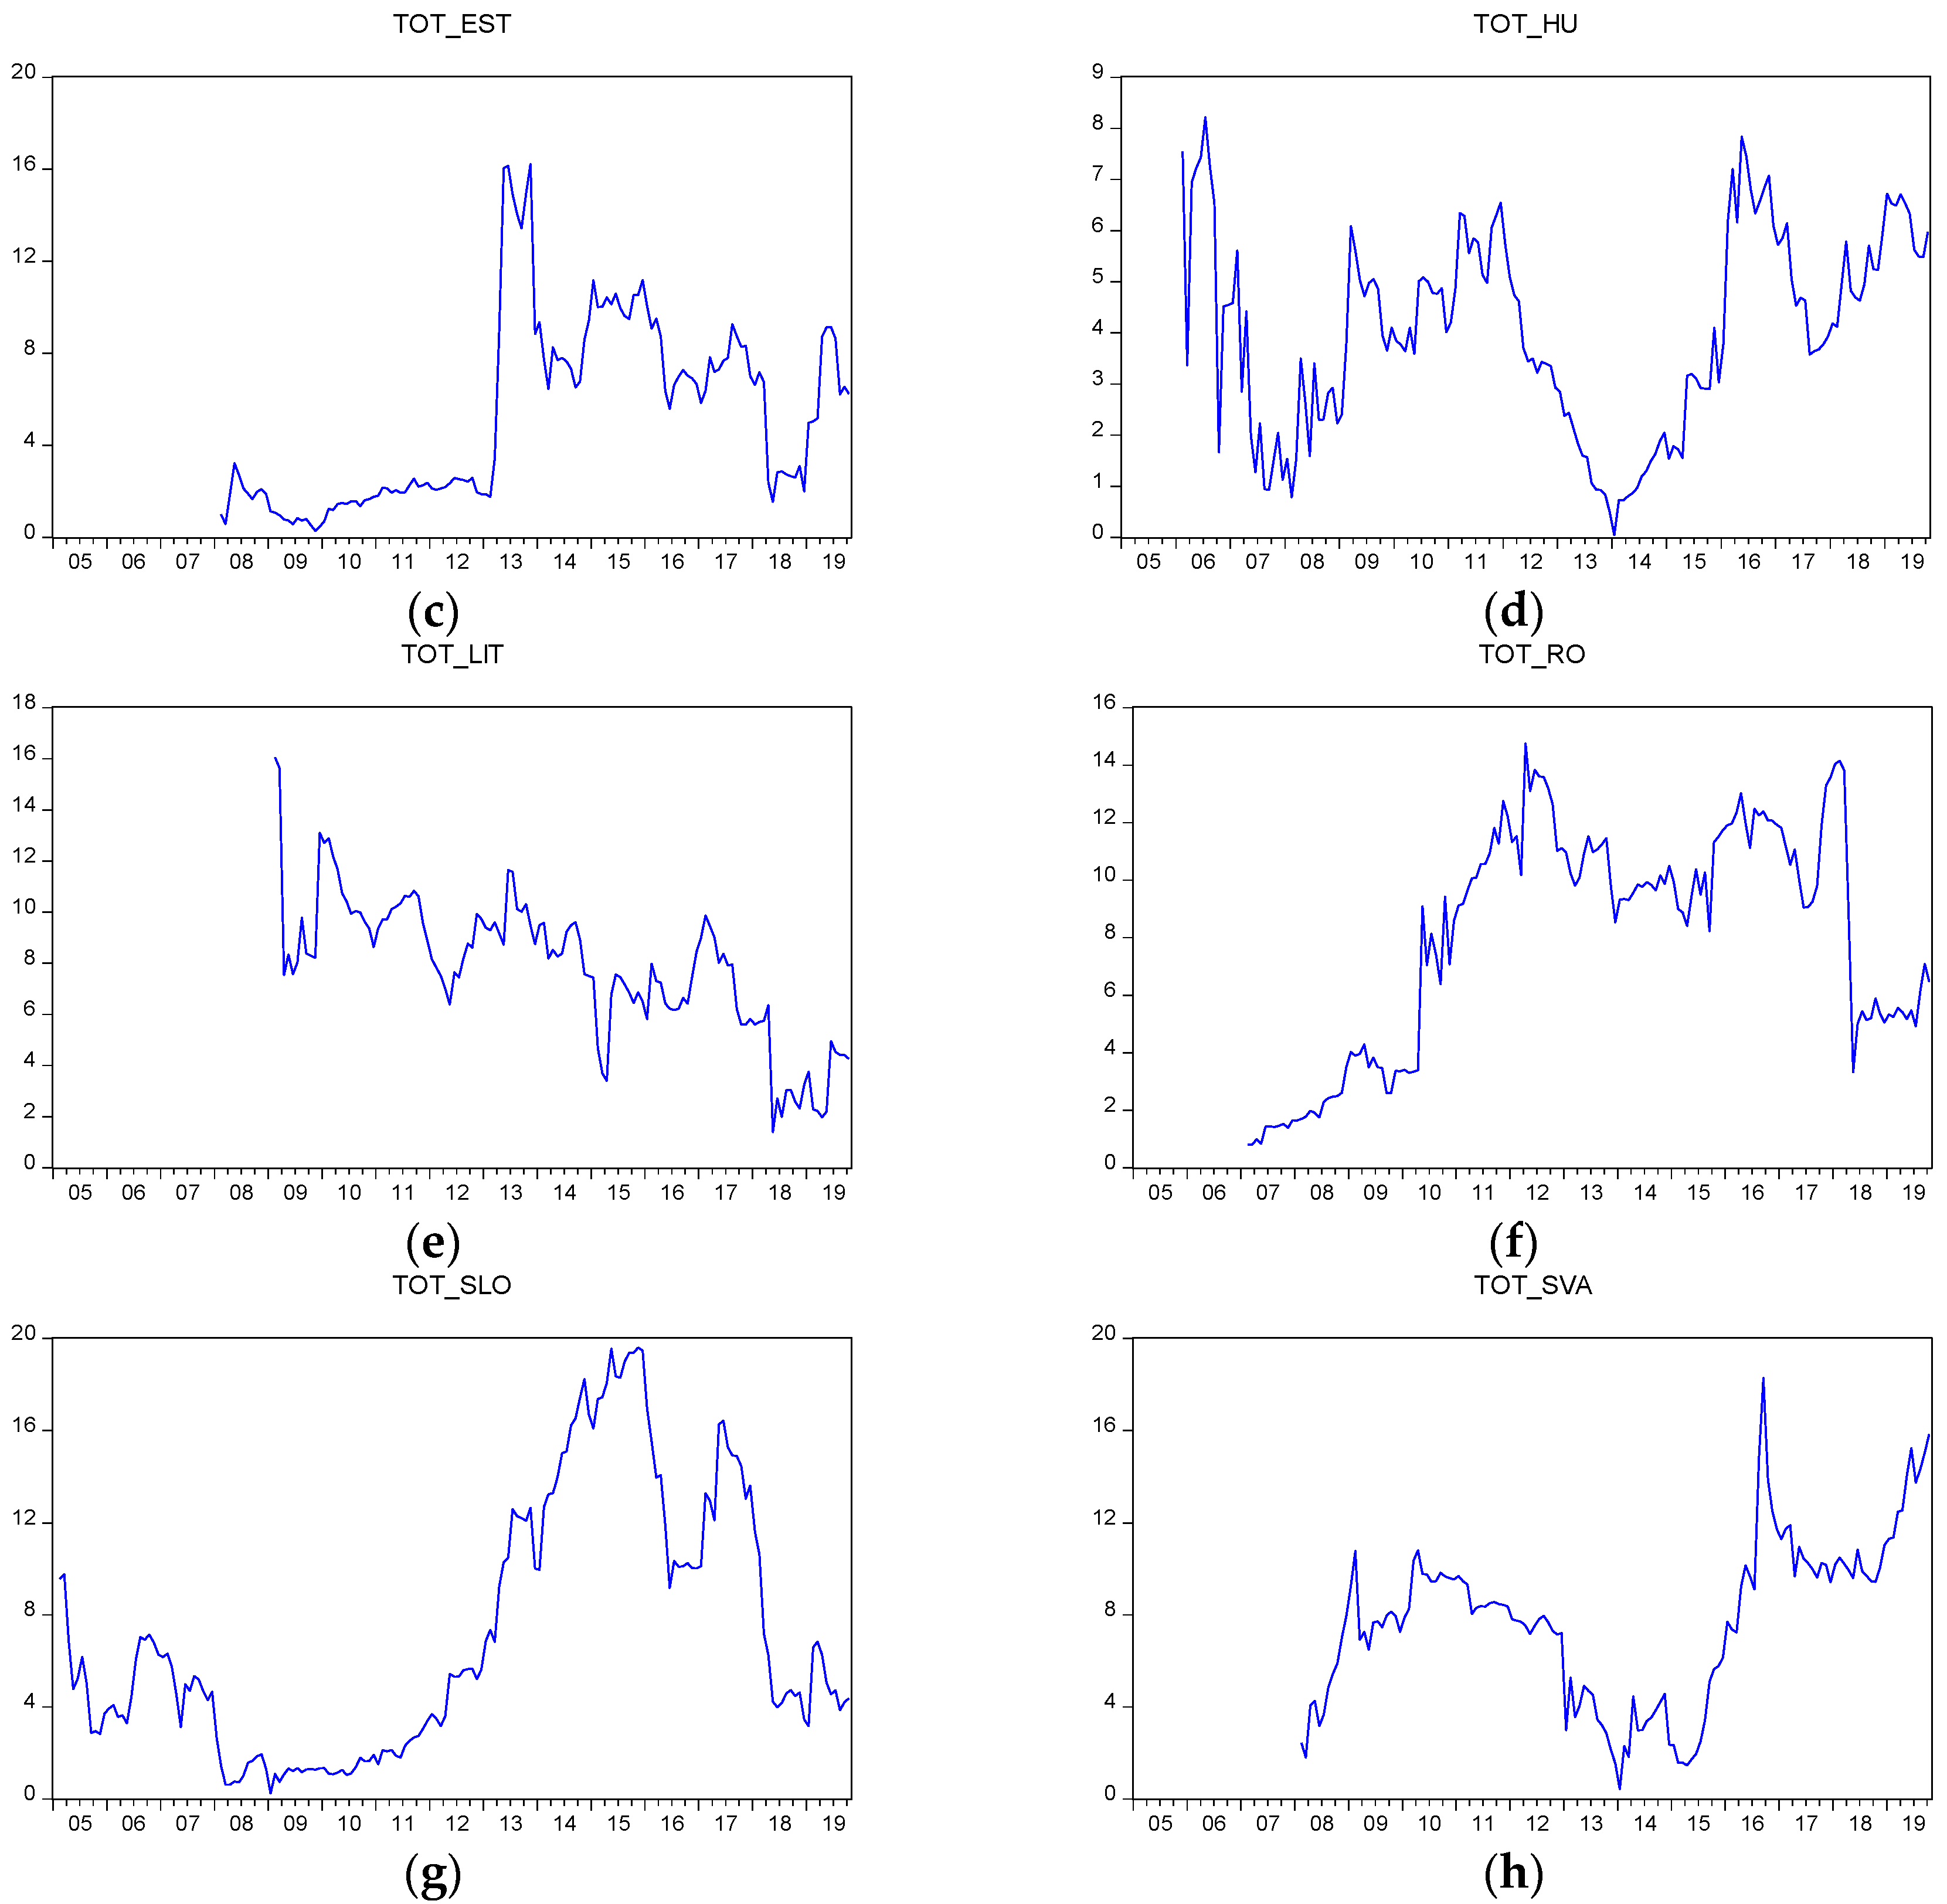
| Mean | Maximum | Minimum | Std. Dev. | Observations | |
|---|---|---|---|---|---|
| TOT_BG | 2.137163 | 9.576 | 0.281 | 1.864597 | 153 |
| TOT_CZ | 4.326379 | 14.624 | 0.537 | 3.25609 | 153 |
| TOT_EST | 5.26927 | 16.22 | 0.285 | 3.975054 | 141 |
| TOT_HU | 4.025291 | 8.212 | 0.041 | 1.952532 | 165 |
| TOT_LIT | 7.817008 | 16.058 | 1.395 | 2.756687 | 129 |
| TOT_RO | 7.999359 | 14.756 | 0.803 | 3.946686 | 153 |
| TOT_SLO | 7.161441 | 19.605 | 0.238 | 5.553055 | 177 |
| TOT_SVA | 7.718156 | 18.281 | 0.427 | 3.560974 | 141 |
© 2020 by the authors. Licensee MDPI, Basel, Switzerland. This article is an open access article distributed under the terms and conditions of the Creative Commons Attribution (CC BY) license (http://creativecommons.org/licenses/by/4.0/).
Share and Cite
Chirilă, V.; Butnaru, G.I.; Chirilă, C. Spillover Index Approach in Investigating the Linkage between International Tourism and Economic growth in Central and Eastern European Countries. Sustainability 2020, 12, 7604. https://doi.org/10.3390/su12187604
Chirilă V, Butnaru GI, Chirilă C. Spillover Index Approach in Investigating the Linkage between International Tourism and Economic growth in Central and Eastern European Countries. Sustainability. 2020; 12(18):7604. https://doi.org/10.3390/su12187604
Chicago/Turabian StyleChirilă, Viorica, Gina Ionela Butnaru, and Ciprian Chirilă. 2020. "Spillover Index Approach in Investigating the Linkage between International Tourism and Economic growth in Central and Eastern European Countries" Sustainability 12, no. 18: 7604. https://doi.org/10.3390/su12187604
APA StyleChirilă, V., Butnaru, G. I., & Chirilă, C. (2020). Spillover Index Approach in Investigating the Linkage between International Tourism and Economic growth in Central and Eastern European Countries. Sustainability, 12(18), 7604. https://doi.org/10.3390/su12187604