Article

Consumer Valuation of Remanufactured Products: A Comparative Study of Product Categories and Business Models

Department of Industrial and Information Systems Engineering, Soongsil University, Seoul 06978, Korea
*
Author to whom correspondence should be addressed.
Sustainability 2020, 12(18), 7581; https://doi.org/10.3390/su12187581
Submission received: 20 August 2020 / Revised: 10 September 2020 / Accepted: 11 September 2020 / Published: 14 September 2020
(This article belongs to the Section Sustainable Management)

Abstract

:
Understanding consumer valuation of remanufactured products is vital to the success of the remanufacturing business. However, whether and how product categories and business models influence the consumer valuation have not been investigated in detail. To test the effects of product categories and business models on the consumer valuation and acceptance of remanufactured products empirically, this study presents a survey on the relative value of remanufactured products perceived by the consumers. Six product categories (low-end laptops, high-end laptops, smartphones, gaming consoles, printers, and water purifiers) and two business models (the buying model and the rental model) were selected as the factors. Negative perception (NP), purchase intention (PI), and acceptable prices (APs) were used as measures of the perceived value. A group of 95 students from a Korean university participated in the survey. Statistical hypothesis testing shows that both the product categories and the business models cause significant differences in the relative value of remanufactured products. Especially, the results indicate that certain product categories are more advantageous for remanufacturing from a consumer-demand viewpoint. The results also show that the suitability of the rental model varies across the product categories; for certain categories, the rental model can be a better option for remanufacturing.

1. Introduction

Promoting sustainable production and consumption and embracing circularity in the supply chain have emerged as the most pressing issues facing the manufacturing industry [1,2]. Remanufacturing can be an effective solution to overcome this challenge [3]. Remanufacturing is a process of returning used products to a like-new state by reconditioning or replacing their component parts [4,5]. It enables the manufacturing companies to offer more affordable and greener products to the market and helps them comply with environmental legislation and regulations [6]. Accordingly, remanufacturing has gained increasing attention in various fields, such as electronics, machinery and equipment, aerospace and automotive, and furniture, as a means of facilitating a circular economy and a method to achieve both economic and environmental sustainability [7].
However, despite its growing importance and popularity, many companies, especially in the consumer-goods market, are reluctant to implement remanufacturing [8]. One of the major challenges in remanufacturing of consumer goods is the lack of knowledge about the consumer market. Especially, research on consumer valuation of remanufactured products (what consumers think of the remanufactured products and how they value them) is still in its infancy [9,10,11].
Previous studies on consumer valuation have focused on identifying the factors influencing the consumers’ purchase intention or their willingness to pay (WTP) for a remanufactured product. Previous studies have found that both the consumer characteristics (greenness, attitude, knowledge, involvement, etc.) and the product attributes (brand, price, warranty, etc.) are among the major factors influencing the value of remanufactured products [9,11,12,13,14,15,16,17,18,19,20,21]. However, only a few studies have investigated the influences of product categories and business models. Most studies have dealt with a single category of products, which makes it difficult to compare the suitability of different product categories for remanufacturing business. More importantly, most previous studies have considered only the buying model where the consumers purchase and own the product. Although rental and sharing (hereinafter referred to as the rental model) are gaining increasing interest as alternative business models to buying [22,23,24], relatively little is known about the effect of the business models on the consumer valuation and acceptance of remanufactured products.
The purpose of this study is to test the effects of product categories and business models on the consumer valuation of remanufactured products empirically. Certain product categories can be naturally more attractive to consumers in the remanufactured goods market and more likely to be accepted at a higher price. Identifying such categories of appropriateness to remanufacturing is necessary and valuable for successful remanufacturing businesses. Clarifying the suitability of the rental model for remanufactured products also provides useful insights for remanufacturing businesses. It helps explore new business opportunities in the rental market. A comparative study of product categories and business models is necessary in this regard. To the best knowledge of the authors, the current study is the first of its kind highlighting the effect of product categories and business models together.
More specifically, this study presents a survey on the relative value of remanufactured products (i.e., the value of remanufactured products compared to their original new versions) to address the following research questions (RQs):
  • RQ1: Does the product category influence the relative value of remanufactured products? From the consumer-demand perspective, which product categories are more appropriate for remanufacturing?
  • RQ2: Does the business model make any difference in the relative value of the remanufactured product? Can the rental model be recommended to the remanufacturing business?
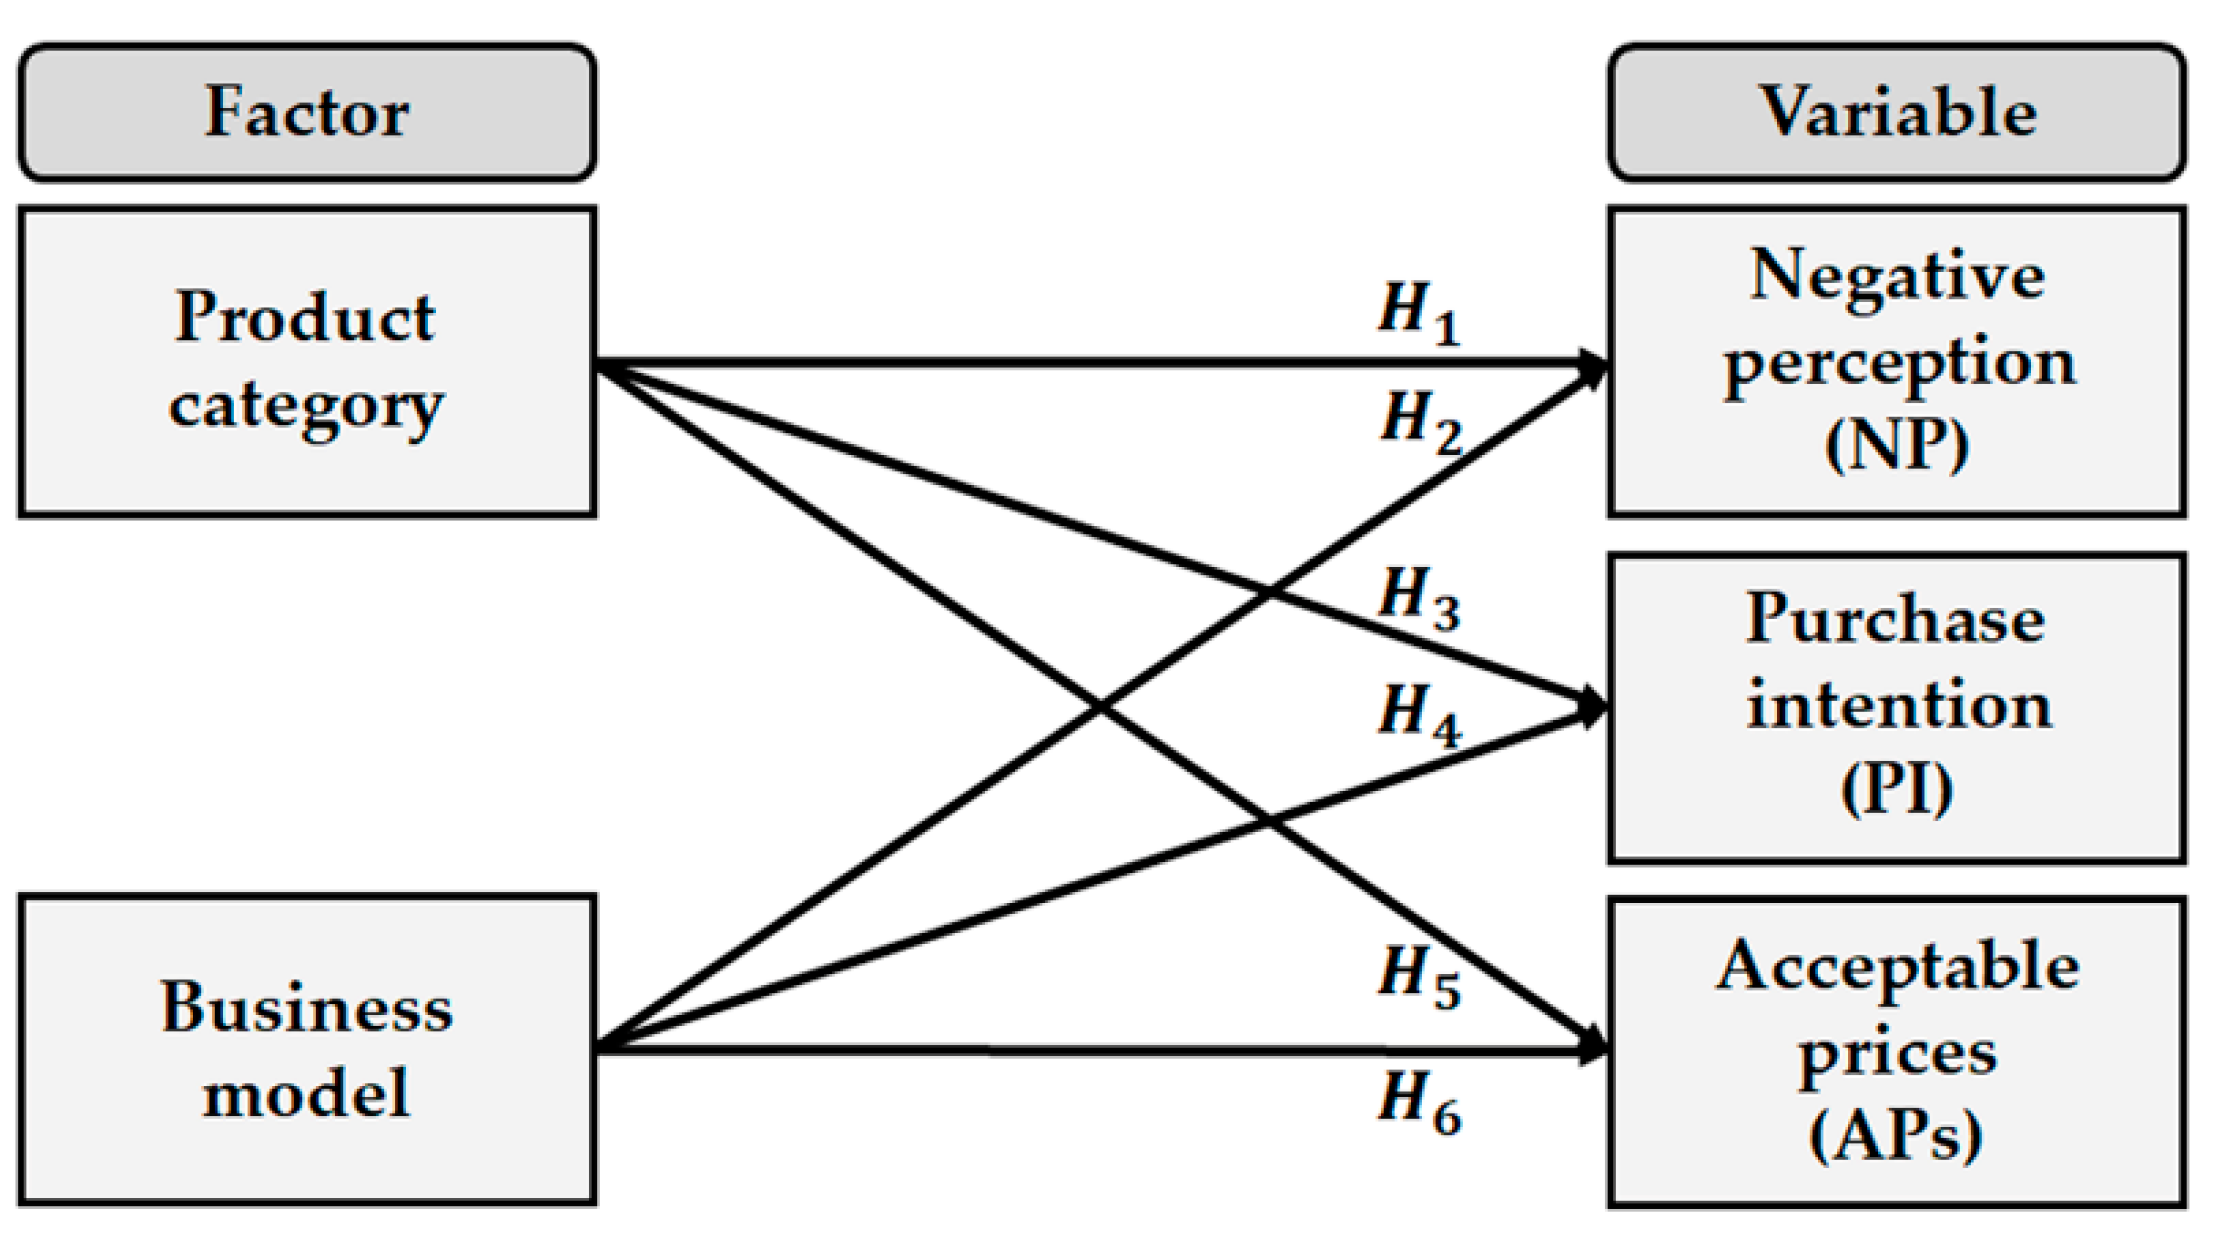
Figure 1 illustrates the conceptual framework of the survey. Product categories and business models are the two factors of interest. In this study, six product categories that represent a variety of personal and home electronics were chosen for the survey. These were low-end laptops, high-end laptops, smartphones, gaming consoles, printers, and water purifiers. The existence of active rental markets and the familiarity of the intended participants (university students in South Korea) with the categories were reflected in selecting the categories. The number of categories was determined considering the response burden on the participants. For the business models, the two most popular cases were considered: the buying and the rental models.
The dependent variable is the relative value of the remanufactured products. In this study, it was assessed from three different perspectives: negative perception (NP), purchase intention (PI), and acceptable prices (APs). Table 1 shows the definition of the dependent variables. NP and PI are the concepts that frequently appear in the literature (e.g., [12,18,21,25]). APs, adopted from the Van Westendorp price sensitivity meter (PSM) [26,27], are an extended concept of WTP. Unlike previous studies that have focused only on the WTP, i.e., the too expensive price (e.g., [20,28,29,30]), this study examines various acceptable prices, including too cheap, cheap, reference, expensive, and too expensive prices, as well as the range of acceptable prices (Figure 2). APs have been suggested as a measure of consumer valuation for the first time in this study.
The survey was conducted using a direct method [27], providing the participants with the new product profile and asking them to write down the NP, PI, and APs for the remanufactured version of the product. The participants in the survey were 95 students from a Korean university. For the collected data, statistical testing was conducted. The chi-square test of independence was performed for NP and PI analyses, and the one-way analysis of variance (one-way ANOVA) and the t-test were performed for AP analyses.
The survey results showed that both the product categories and the business models created a significant difference in the relative value of remanufactured products. In the buying model, some categories showed a lower NP and a higher PI, which implied greater market potential. It was observed that the mean difference in the too expensive price (maximum AP) was surprisingly not statistically significant among the product categories, however, the mean too cheap price (minimum AP) at which the consumers started doubting the product quality was revealed as significantly different. The results demonstrated that the market potential of remanufactured products varies across product categories, and there are product categories that are naturally more advantageous for remanufacturing than others are. When the business model was changed to rental, the NP, the PI, and the APs of all product categories differed significantly from the buying model. NP decreased in all categories, whereas PI showed different results depending on the product categories (decreasing in low-end laptops and smartphones, while increasing in others). The mean acceptable price ranges (APRs) increased in all the categories, which suggests either a decreased too cheap price (for laptops, smartphones, and water purifiers) or an increased too expensive price (for gaming consoles and printers). The results imply that suitability of the rental model varies across the product categories; for certain categories, the rental model can be a good option for the remanufacturing business.
The rest of the study is organized as follows. Section 2 reviews the relevant literature. Section 3 describes the study method, including the hypotheses and the survey questionnaires. Section 4, Section 5, Section 6 present the results, and Section 7 discusses the implications of the results. Section 8 concludes the study along with the future research directions.

2. Relevant Literature

From a process-flow perspective, remanufacturing consists of three processes: take-back of the used products, remanufacturing operations, and remarketing of the remanufactured products. For successful remanufacturing, all three processes should be managed and optimized in a coordinated manner [31,32]. Although significant research has been done on take-back management and remanufacturing operations, remarketing has received relatively less attention [9,11]. Especially, research on consumer valuation of remanufactured products is still in an early stage.
Table 2 shows a summary of the previous studies. Most previous studies have targeted identifying the factors influencing the consumers’ PI or WTP for remanufactured products.

2.1. PI for Remanufactured Products

Vazifehdoust et al. [13] aimed to seek the factors that influence the PI in green products. This study showed that the consumers’ positive attitude was the critical factor in PI and attitude was significantly affected by the marketing variables such as the quality, green advertising, and green labeling. Jiménez-Parra et al. [9] conducted a survey on the potential consumers of remanufactured laptops to gain an insight into the key drivers of their PI. The effects of attitude towards purchasing, subjective norm (i.e., social pressure), motivations (latest technology, cheap price, greenness), and marketing mix variables were investigated.
Wang et al. [14] explored the factors that affect the consumers’ PI through an empirical study in the Chinese automobile spare parts industry. The results indicated that PI is directly influenced by the purchase attitude and the perceived behavioral control of consumers and indirectly influenced by perceived risk, perceived benefit, and product knowledge via attitude. Wang and Hazen [15] examined how PI is affected by the consumer knowledge of the remanufactured products. It was found that consumer knowledge indirectly influences the PI via perceived value and risk. According to the research, PI is positively influenced by the perceived value and negatively influenced by the perceived risk. The perceived value is influenced by quality, cost, and green knowledge, and the perceived risk is influenced by quality and cost knowledge. Khor and Hazen [10] studied how the consumer attitude, the subjective norms, and the perceived behavioral control affect the PI of remanufactured consumer electronic products. In addition, they discussed the difference between the consumer’s PI and the actual purchase behavior. Lack of knowledge about the greenness of remanufacturing, and negative perception towards the remanufactured condition were discussed as the possible reasons. Hazen et al. [33] explored the consumer intention to switch from new to remanufactured products. The positive influences of new-product price, government incentive, environmental benefit, and attitude were observed. The moderating effect of attitude was also discussed. Wahjudi et al. [34] investigated the factors that affect PI of remanufactured short-life cycle products like mobile phones. The results indicated that consumers’ attitudes and knowledge about the products have a positive impact on the PI. Additionally, the indirect impact of perceived benefit and perceived risk through attitude was noticed.
Bittar [18] investigated the effect of brand equity and price ratio on PI. Both the factors were revealed as significant. It was also shown that the effect of brand equity becomes stronger when the price ratio is high compared to the case when it is low. Mugge et al. [35] investigated differences between various customer groups concerning their evaluation of refurbished smartphones. Clustering was performed based on individual characteristics such as involvement, knowledge, innovativeness, value consciousness, environmental consciousness, social-adjustment function, and value-expressive function. Six distinct consumer groups were defined and the potential of incentives for increasing their purchase intention was discussed. Wang et al. [16] examined the influence of green-attribute information of the remanufactured products (energy saving, material saving, and emission reducing) and the green certification on the consumers’ perceived green value and trust, and finally, the PI.
Milios and Matsumoto [25] presented the results of a survey of Swedish consumers, analyzing their PI of remanufactured automotive parts. Consumers’ knowledge of remanufactured auto parts and their perception of associated benefits and risks were considered as the factors. The results revealed that Swedish consumers have limited knowledge about remanufactured auto parts, but nevertheless, they do recognize the benefits of using remanufactured auto parts. In contrary to most previous studies indicating consumers’ perceived risks as a negative factor, the authors highlighted that consumers are less preoccupied with the risks. Wang et al. [36] proposed an advanced model identifying determinants of consumers’ PI of remanufactured products. Their factors were similar to those from other studies, but they differentiated consumers’ attitudes into experiential attitude and instrumental attitude, subjective norm into normative social influence and informational social influence, and perceived behavioral control into product knowledge, perceived risk, and perceived inconvenience. Interactions of the factors were also taken into account. They suggested that experiential and instrumental attitude, normative and informational social influence, product knowledge, and past experience are positive determinants of the PI, while perceived inconvenience and perceived risk are negative determinants.

2.2. WTP and Other Relevant Measures

Using an experimental auction, Michaud and Llerena [30] investigated factors of WTP for remanufactured products. The study focused on the effect of four factors: the information about environmental impacts of production processes, informed environmental benefits of the product, proportion of remanufactured components, and identity of the remanufacturer. The study found that remanufactured products were valued less by the consumers compared to the new ones. Interestingly, informing consumers of the environmental benefits of remanufactured products did not increase the WTP of remanufactured ones, however, lowered the WTP of new ones.
Hazen et al. [37] focused on the effect of consumers’ ambiguity tolerance and perceived quality on WTP. The study presented that ambiguity about remanufacturing makes consumers’ WTP decrease. As the ambiguity increases, consumers doubt the quality of products. Hamzaoui-Essoussi and Linton [19] investigated the influence of newness, product category, and brand name on WTP. The WTP for greener (recycled/remanufactured), branded greener, and branded new products were compared. The findings suggested that WTP for greener products is largely affected by brand, and such brand effects are determined by the product category. Abbey et al. [38] presented empirical studies on the role of perceived quality risk (perceived risk of functionality and cosmetic defects) on WTP. In addition, the study analyzed the variability of the WTP ratio (i.e., the ratio between WTP for a remanufactured product and WTP for a corresponding new product) among consumers.
Subramanian and Subramanyam [20] analyzed eBay transaction data to find out drivers of price differentials between new and remanufactured products. It was found that seller reputation and authorized remanufacturers raise the price of remanufactured products. Abbey et al. [11] examined the drivers of product attractiveness in the remanufactured consumer goods market. The effects of multiple factors including price discounts, brand equity, quality attributes, negative attributes, green attributes, and consumer greenness were discussed for three types of products: technology, household, and personal products.
Van Nguyen et al. [39] developed a demand prediction model for remanufactured products using machine learning techniques. More than 5600 product listings on www.Amazom.com were analyzed, and various factors were taken into account including positivity of product description, number of product pictures, warranty information disclosure, stock information, price difference between remanufactured and corresponding new products, product promotion rate, overall product rating, number of service failures and number of service successes, number of helpfulness votes, number of answered questions, average sentiment of customer reviews, and brand equity.
Lieder et al. [40] analyzed the relationship between consumer demographic data and their choice of business models. Various business models having different payment schemes, environmental friendliness, and service levels were considered, including purchasing or renting a remanufactured product. Using both machine learning (support vector machine and simulation approaches), the choice behavior of a larger population was estimated based on the survey data of a small consumer group. As for the product category, a single category of washing machine was considered.

2.3. Contributions of the Current Study

Recent studies have shown that both consumer characteristics (such as attitude, subjective norms, product knowledge, greenness, risk aversion, involvement, etc.) and product attributes (such as price, green attributes, brand, remanufacturer identity, warranty, etc.) are the major determinants of PI and WTP. However, the possible influence of product categories and business models has gained relatively less attention in the previous studies.
As shown in Table 2, most studies have dealt with a single category of products under the buying model with the product category and business model considered as control variables. This makes it complicated to address the RQs, i.e., the role of product categories (RQ1) and the role of business models (RQ2) in differentiating consumer valuation. Hamzaoui-Essoussi and Linton [19], Subramanian and Subramanyam [20], and Abbey et al. [11] presented the exceptional studies that incorporated the effect of product categories. They pointed out that consumer valuation of remanufactured products varies with product category significantly. However, they considered only the WTP, price differential, and attractiveness, respectively, and none of them investigated the possible effects of business models as only the traditional buying model was considered. Although some researchers have projected that the rental model has a positive effect on the remanufacturing industry (e.g., [8,41,42,43]), its effects on the consumer valuation have not been investigated in detail. Lieder et al. [40] presented a unique study taking into account various business models of a remanufactured product, but the effect of product category was not examined as the case was fixed to the example of washing machine.
This study can contribute to the literature, as it is a novel approach that demonstrates the effect of both product categories and business models on consumer valuation for remanufactured products. The inclusion of APs is another contribution. In contrast to other studies focusing only on the WTP (maximum AP), this study highlights the existence of other APs (too cheap, cheap, reference, expensive, and APR) and empirically tests its differences with respect to product category and business model. It is expected that the current study can demonstrate the product categories that are more suitable for remanufacturing. In addition, it is expected that this study can assist in clarifying the influence of the rental model on the remanufacturing business.

3. Methods

3.1. Variables and Hypotheses

This study compares the relative values of remanufactured products across six product categories: the low-end laptops, the high-end laptops, the smartphones, the gaming consoles, the printers, and the water purifiers. The type and number of product categories were determined considering the size of the rental market, product familiarity to survey participants, and response burden. Table 3 shows the product profiles assumed in this study. The prices of new products were assumed based on real market transactions in Korea. The six products were compared under two business models, the traditional buying model and the rental model. The business models were selected considering their popularity and familiarity in Korea.
In this study, the relative value denotes the perception of a consumer on the value of a remanufactured product in comparison to the same-but-new version of the product. For a given new product (Table 3), the relative value of its remanufactured version was acquired and compared from three different perspectives: NP, PI, and APs, defined as follows.
  • Negative perception (NP): NP is a binary variable (yes or no) indicating the consumer’s opinion on whether the remanufactured product should be cheaper than the same-but-new product. Consumers are likely to think that the remanufactured products are necessarily cheaper than new ones for various reasons. They may doubt the performance and quality of remanufactured products [12], or they may dislike the fact that the products were used by someone else previously. In this study, the perspective that remanufactured products should be cheaper than same-but-new products is defined as a negative perception of consumers.
  • Purchase intention (PI): PI is a binary variable (yes or no) indicating whether the consumer is willing to buy/rent the remanufactured product if the price is attractive and appropriate. Some people may refuse to accept a remanufactured product [19,44], irrespective of the price. The percentage proportion of PI can serve as a measure of the potential market size.
  • Acceptable prices (APs): APs are the boundary prices when the consumer begins to think the remanufactured product is too cheap, cheap, expensive, or too expensive. The prices that consumers think are acceptable for a product can demonstrate their valuation of the product. The too expensive price (WTP or reservation price) is the maximum acceptable price that represents the worth a consumer places on a product. The too cheap price represents the minimum acceptable price at which a consumer does not question the quality of a product; in other words, prices below that point cause concern for the quality of remanufactured products [18,45]. The cheap and expensive prices define the region of price insensitivity around a reference price, i.e., the price that consumers consider reasonable to pay [46]. This study examined five different acceptable prices, i.e., too cheap, cheap, reference, expensive, and too expensive prices. In addition, APR was analyzed as a measure of the size of price acceptability. It should be noted that the surveyed APs were converted to the price ratios in percentage by dividing them with the new-product price to allow the comparison across different product categories and business models with various price levels.
Table 4 shows the hypotheses of this study. Hypotheses H1 and H2 focus on NP. H1 suggests that NP differs across the six product categories (the low-end laptops, the high-end laptops, the smartphones, the gaming consoles, the printers, and the water purifiers), and H2 suggests that NP differs between the two business models (the buying model and the rental model). Similarly, hypotheses H3 and H4 are concerning the effects of product category and business model on PI. They predict that PI will differ across the six product categories and the two business models. Hypotheses H5 and H6 consider the effects of product category and business model on APs. Separate hypotheses (H5a–H5f and H6a–H6f) were constructed for each AP point: too cheap, cheap, reference, expensive, and too expensive prices and APR.

3.2. Survey

The survey questionnaire of this study was prepared and tested multiple times to secure the reliability and validity. After completing several internal reviews for content appropriateness and validity, a survey was conducted with 86 university students as participants for pilot testing. Based on the feedback from the participants, the questionnaire was revised for improved clarity and reliability, and another round of internal reviews was deployed. The final questionnaire was pre-tested based on the focus group interviews (FGIs) with five university students. The FGI was conducted two times, and the words, the expressions, and the amount and order of questions were refined and fine-tuned. It was confirmed that the questionnaire is eligible for exemption from IRB review (SSU-202005-HR-205-01).
Table 5 shows the survey questionnaire. Assuming a certain combination of product category and business model (for instance, the low-end laptops under the buying model), the questionnaire first provided the image and the price of a new product (Table 3), similar to the approach in reference [20]. In addition, necessary assumptions were made such as the participant had already decided to buy/rent the product, and the decision pending was to choose between the new and the remanufactured versions. It was also noted that both the product versions have the same function, appearance, and warranty.
Next, adopting a direct method [27], the questionnaire asked the participants to write down the (1) NPs, (2) PIs, and (3) APs of the same-but-remanufactured version of the product and the reasons behind the choice in sequence. All participants were asked to answer the NPs and PIs, however, only the participants with positive PI were asked to answer their APs. The AP questions were prepared based on the Van Westendorp’s PSM questionnaire [26,27]. For a clearer understanding of the AP concepts, the image in Figure 2 was appended to the questions.
There were 12 possible combinations of product categories and business models because six product categories and two business models were considered. Therefore, the survey participants were asked to answer the same questionnaire 12× to handle all product category and business model combinations. To reduce response burden and possible bias, the survey was divided into two sessions, one under the buying model and the other under the rental model, and implemented on two separate days, two days apart. Each session took approximately 25−30 min (survey only). A survey reward (small gift) was offered to the participants who attended both sessions.
A paper survey was conducted, and a group of 95 undergraduate students majoring in industrial engineering at a Korean university participated in the survey. Convenience sampling was used to ensure an acceptable number of responses. To minimize privacy concerns, collecting personal information such as age, household type, and income level was avoided, except name to confirm participation in both sessions and give the survey reward. Although demographic information was not collected, it is presumable that the participants were a relatively homogeneous group in terms of personal profile characteristics (age in early 20s; undergraduate student having the same major and living in the same urban area; monthly stipend around ₩580,000, approximately $480 [47]). Considering that some students may not be familiar with remanufacturing or rental concepts, a brief introduction to remanufacturing and rental concepts was provided at the beginning of the survey. Next, the purpose of the survey and the overall process were described. Written consent was acquired from each participant as a part of the questionnaire.
Table 6 shows the amount of valid data obtained from the survey. As only the people with positive PIs responded to the AP questions, the amount of valid data decreased in the AP questions and displayed greater differences across the product categories. The survey data can be found in the supplementary material S1.

3.3. Statistical Testing

The collected data were analyzed using the chi-square tests of independence (NP, PI) and the one-way ANOVA and t-tests (APs). A significance level of 5% was applied (α = 0.05) for all the tests. R libraries “gmodels” and “stats” were used for the analysis.
A chi-square test is a common statistical testing method for describing the relationships between two or more categorical variables. It is useful when evaluating whether the variables are associated or independent. One issue, however, is that this test is sensitive to small joint frequencies (frequencies of the cells in the cross-table of the variables); the joint frequencies should be at least 5 [48] to be acceptable. When any of the joint frequencies is less than 5, the Fisher’s exact test of independence can be an effective and a more accurate alternative. The Fisher’s exact test is also recommended when the sample size is small. This study applied the chi-square tests for hypotheses H1 through H4. However, considering the relatively small sample size (n = 95) and the possible small joint frequencies less than 5, the Fisher’s exact test was appended to every chi-square test.
The one-way ANOVA is a technique that can be used to determine whether the means of more than two groups are statistically significantly different [49]. In this study, hypotheses H5a–H5f about differences in mean APs across six product categories were tested using the one-way ANOVA. As all the sample sizes of APs ranged from 45–83 (Table 6), they were regarded as acceptable for the one-way ANOVA; according to reference [50], the required sample size for each group is at least 15 when comparing six groups. During the one-way ANOVA, a Levene’s test was also conducted to test the equality of variances; equal variances are an essential assumption in ANOVA. One limitation of ANOVA is that it only determines the significance of mean difference and does not provide detailed information, such as the groups that caused the significant difference (if any exist). Post-hoc tests such as the Tukey’s honestly significant difference (HSD) test (for equal variances and equal sample sizes) and the Scheffe’s test (for equal variances and unequal sample sizes) can be performed for more detailed analyses [51]. In this study, a post-hoc analysis was conducted when significant differences were detected in the ANOVA. The test type was determined considering the equality of variances and sample sizes. R library “DescTools” was used for the analysis.
When comparing the mean APs of two business models, a t-test was used instead of the one-way ANOVA. As all the sample sizes exceeded 30 in this study (Table 6), they were considered as sufficient for t-tests. Thus, hypotheses H6a–H6f were tested using t-tests.

4. Result: Negative Perception (NP)

NP represents the consumer’s negative opinion towards the remanufactured product, indicating that the remanufactured product is necessarily cheaper than the new one. The survey valuated the NP using a yes/no question. In addition, the reason for this choice was evaluated by providing multiple options. Three choice alternatives (performance, breakdown, and emotional discomfort) were presented along with a blank space to write down any other reasons. Figure 3 and Table 7 show the percentage proportion of NP, namely, the proportion (in percentage) of respondents answering “yes” to the NP question. A greater number indicates stronger negative perception.

4.1. Buying Model

Under the buying model, the percentage proportion of NP was observed as high in all the categories, ranging from 92% in gaming consoles to 99% in low-end laptops. This indicates that more than 90% of the respondents answered that a remanufactured product is necessarily cheaper than a new one in all product categories. It is notable that the gaming consoles and the printers show slightly better figures for remanufacturing; 6–8% of the respondents answered that remanufactured gaming consoles and printers do not have to be cheaper than the new one. To see if NP is significantly different across the product categories, a chi-square test with cross-tabulation was conducted. However, as only a few respondents answered “no” to the NP question (Table 7), it was not possible to obtain accurate results from the chi-square test. A chi-square test may be inaccurate if more than 20% of the cells in the cross-table have a frequency of less than 5. Thus, a Fisher’s exact test was applied to all the possible category pairs to confirm if there was any pair with a statistically significant difference. Table 8 shows the results. The Fisher’s exact test revealed that 8 out of 15 pairs had statistically significant differences. The results show that hypothesis H1 is supported under the buying model.
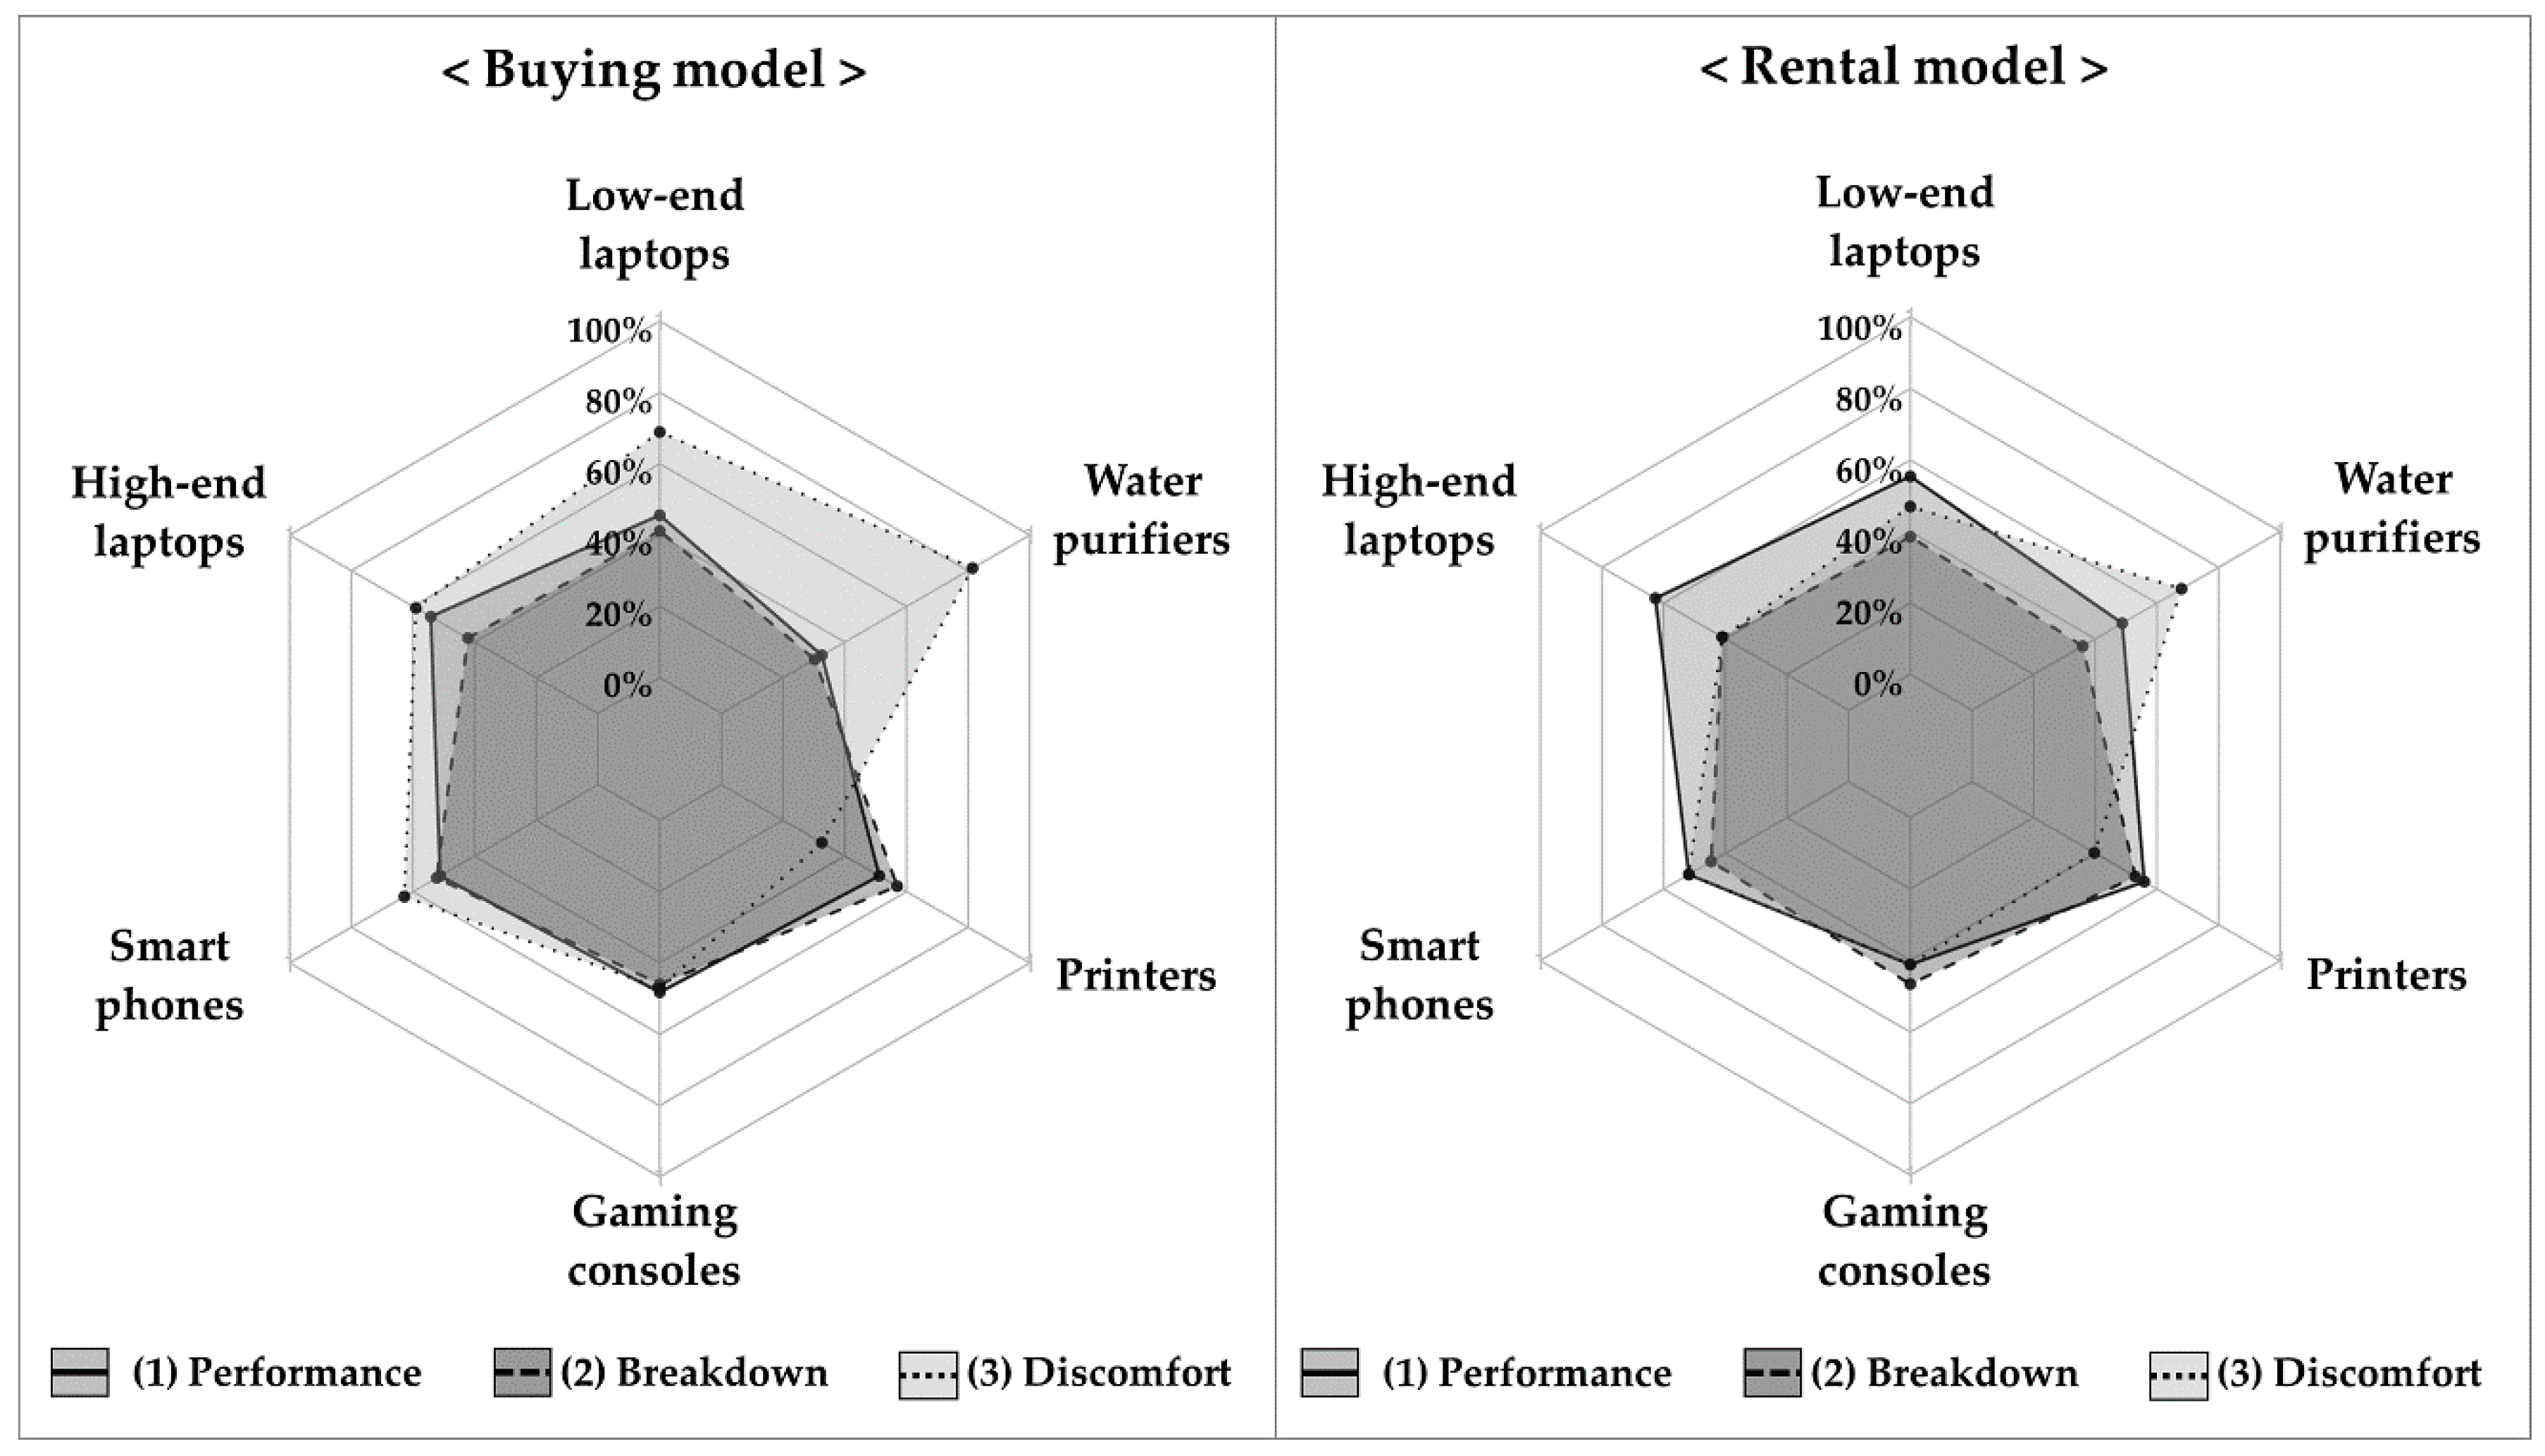
In addition, reasons for NP under the buying model show some differences across the product categories. Figure 4 and Table 9 show the percentages of NP originated from the issue of “performance”, “breakdown”, “emotional discomfort” (hereinafter discomfort), and “others”. In other words, they show the percentage of the respondents citing each factor, out of the negative respondents who answered “yes” to the NP question. Overall, “discomfort” seems to be the primary reason followed by “performance” and “breakdown”. On average, 59% of the negative respondents cited “discomfort”, while 47% and 45% negative respondents cited “performance” and “breakdown” as the reason for NP, respectively. Approximately 5% of negative respondents cited other reasons, such as “manufacturing cost of the remanufactured product is cheaper than that of the new one, so the price should be lower” and “extrusion of personal data is worrying”.
The water purifiers and the printers showed unique results. For water purifiers, 81% of the negative respondents answered that they had an unpleasant feeling towards the remanufactured product. As the product was closely related to the health of the respondents themselves and their families, the fact that someone unknown had used the product before seemed to cause uncomfortable and disgusting feelings regardless of the actual purifying performance. For printers, however, such discomfort was not the major reason for NP; only 33% cited “discomfort” indicating that most people are not sensitive to someone having used the product before. Rather, concerns about the breakdown (57%) and the performance (51%) appeared as the major reason for NP. It seems that the respondents doubted the quality of remanufactured products and thought that remanufactured products may be accompanied by frequent functional problems, such as control errors, paper jams, and ink smear, and require more consumables such as paper, ink, and toner.

4.2. Rental Model

Under the rental model, the NP percentage proportion changed significantly from the buying model, from 74% in printers to 91% in high-end laptops and smartphones (Table 7). A chi-square test among the product categories showed that the NP differed across the six product categories (chi-square = 17.9644; p-value = 0.003). Additionally, a Fisher’s exact test confirmed that there were significant differences in all 15 pairs (Table A1 in Appendix A). This implies that hypothesis H1 is supported under the rental model.
A unique observation was that the NP dropped in all the categories while changing from the buying model to the rental model (Table 7). This implied that more people thought that remanufactured products did not have to be cheaper than the new ones under the rental model. Such changes in consumers’ opinions were confirmed as statistically significant except for the low-end laptops (p-value = 0.097), and the results partially supported hypothesis H2. This implies that the consumers in the rental market appreciate the relative value of remanufactured products better.
In addition, the reasons for NP showed differences between the business models (Figure 4, Table 10). The concern for “performance” slightly increased by 6% (from 47% to 53%) in the rental model, whereas for “discomfort,” it decreased by 11% (from 59% to 48%). Although “discomfort” was the primary issue in the traditional buying model, performance was revealed as the more critical factor in the rental market.
It is interesting that the NP decreased significantly in most categories despite the increasing concerns about the performance and the breakdown. It seems that the consumers tend to be less fastidious about the product quality and become more generous about the fact that the product had been pre-owned or used by someone else. The benefits of rental (free consumables and customer care over the contract period) that can relieve quality concerns may be another reason for the decreased NP.

5. Result: Purchase Intention (PI)

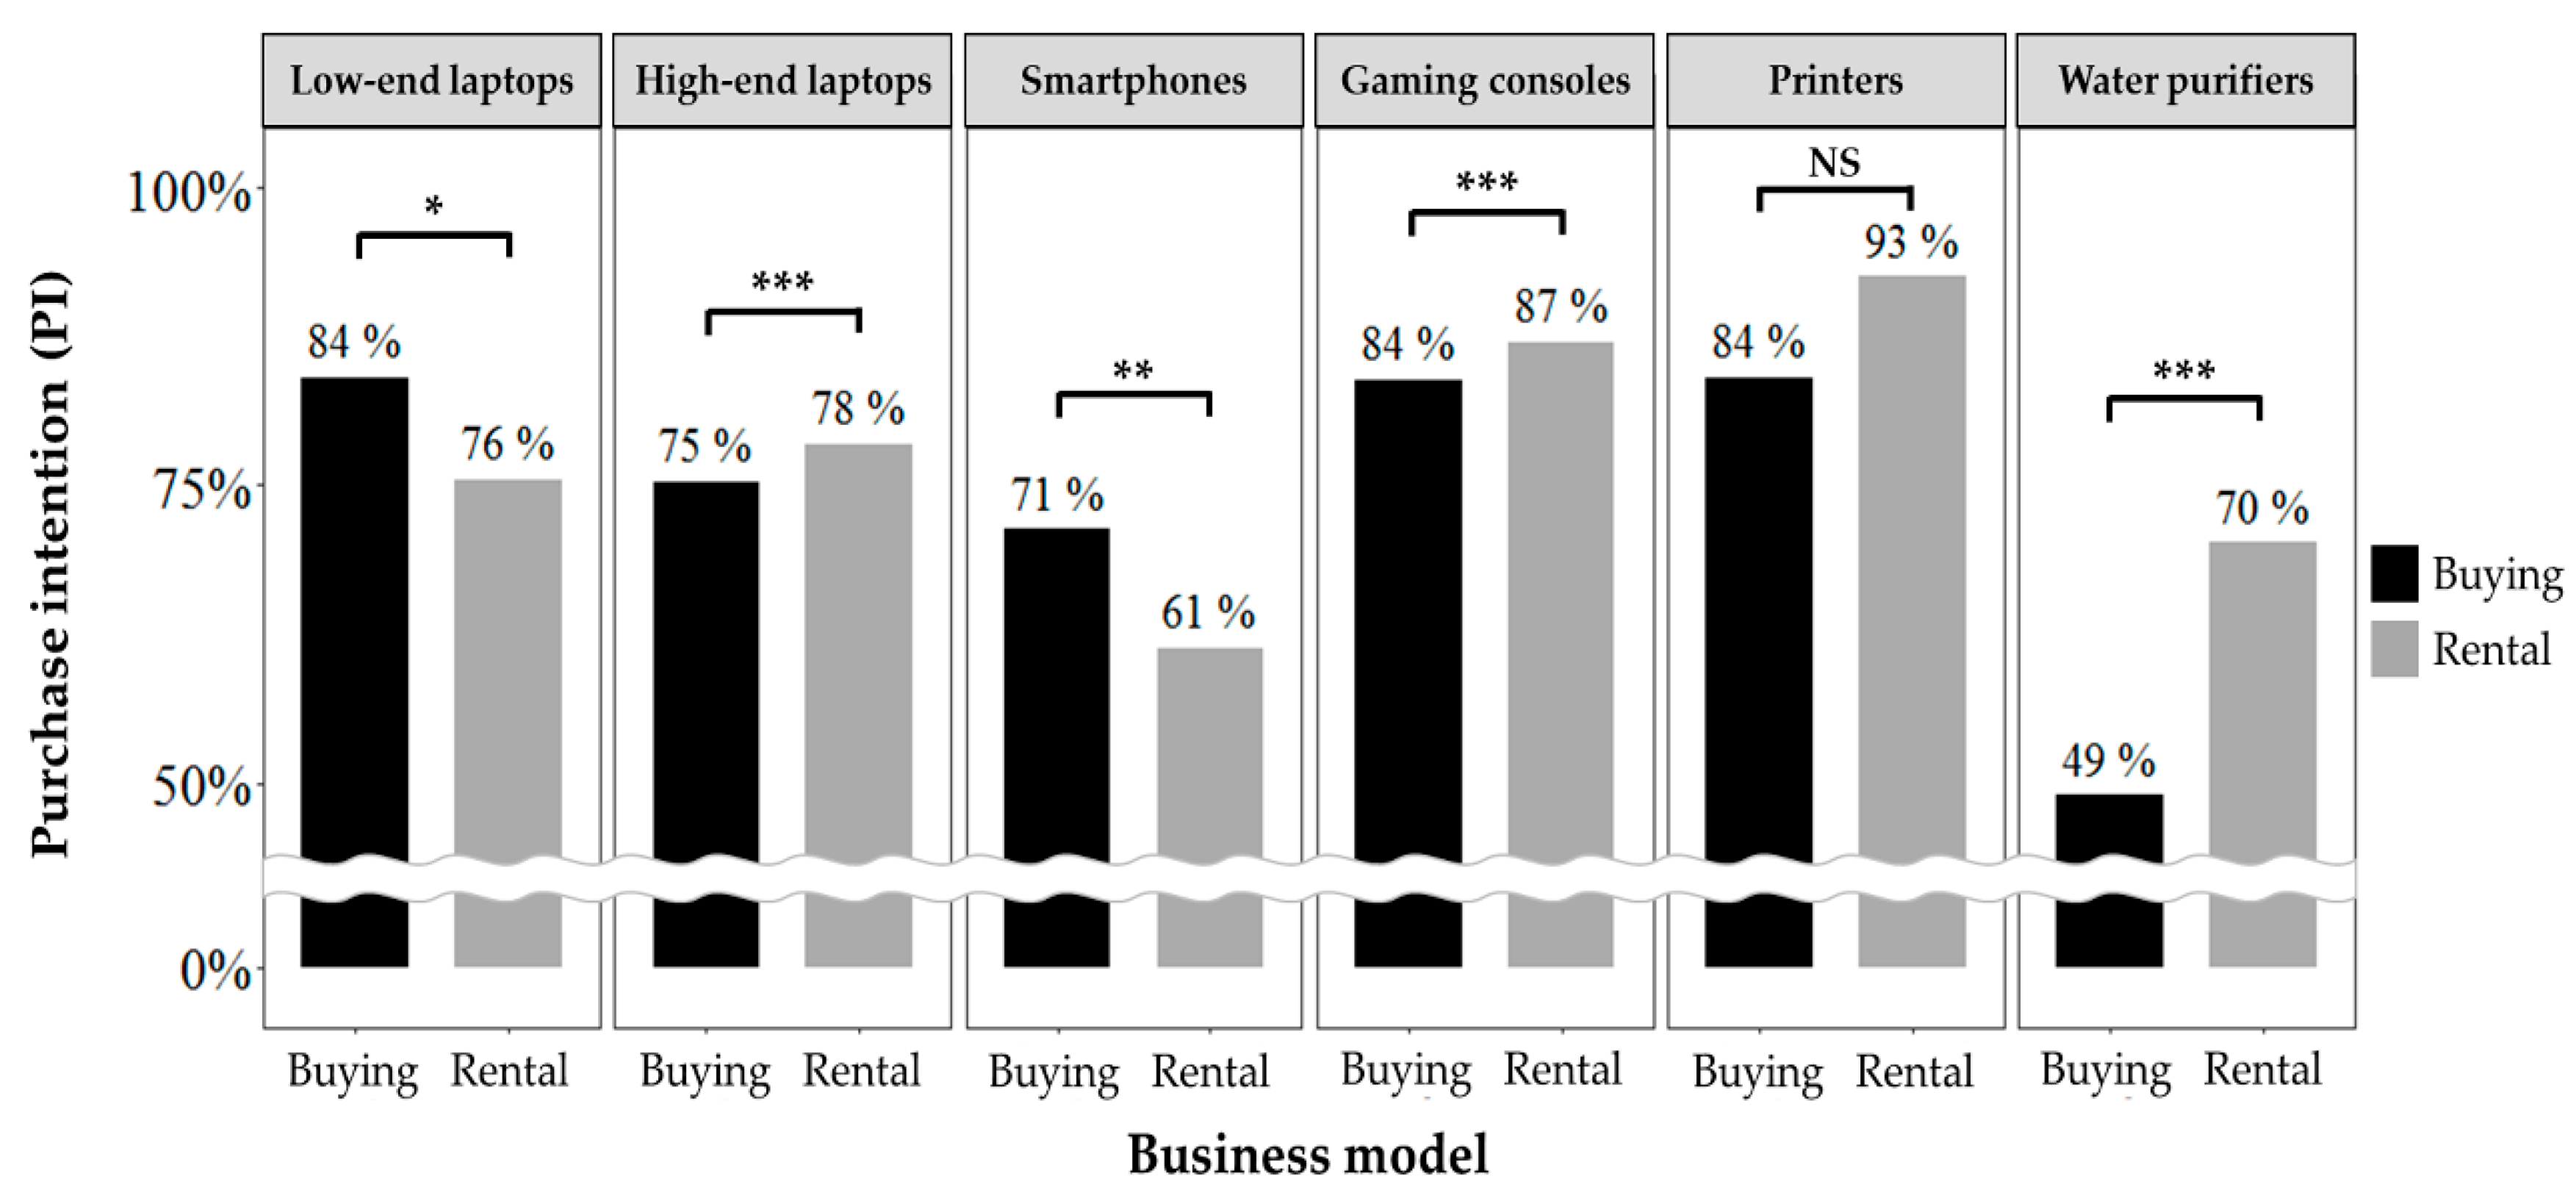
PI indicates the consumers’ willingness to accept (either buy or rent) a remanufactured product when the price is appropriate and satisfying. Similar to NP, the survey assessed PI using a yes/no question. Figure 5 and Table 11 show the results of the PI survey question. The percentage proportion of PI, namely, the proportion (in percentage) of respondents answering “yes” to the PI question, reflects the degree of consumers’ acceptance of remanufactured products. Thus, it can be used as a measure of potential market size of the remanufacturing business.

5.1. Buying Model

Under the buying model, the percentage proportion ranged from 49% to 84%, displaying a great variance across the product categories. The water purifiers showed the least acceptance at 49%, which indicates that 51% of consumers will not accept the product regardless of the price. As the product is directly related to personal hygiene, unpleasant feelings about the remanufactured mark and doubts about the product quality seem to create a strong barrier to the remanufactured product. However, the low-end laptops, the gaming consoles, and the printers showed the highest acceptance of 84%. Compared to the other categories, the top three categories have a relatively large market for used, refurbished, or remanufactured products in Korea. Such familiarity and popularity may be a reason for the higher PI.
The chi-square test of product categories showed that there was at least one category with significant differences (chi-square = 46.2541, p-value = 0.000), which implied that the consumers’ purchase intention varied with product categories. In addition, Fisher’s exact test (Table A2 in Appendix A) showed that 12 out of 15 pairs had statistically significant differences, confirming the differences across the product categories. This supports hypothesis H3 under the buying model.

5.2. Rental Model

When the business model was changed to the rental model, the PI for remanufactured products changed significantly (Table 11). It varied from 61% to 93%. Similar to the buying model, the printers (93%) and the gaming consoles (87%) showed higher figures than other categories. The smartphones and the water purifiers showed the least and the second-least PIs of 61% and 70%, respectively. Chi-square tests revealed that the differences across the six product categories were significant (chi-square = 34.3078, p-value = 0.000). Additionally, Fisher’s exact test (Table A3 in Appendix A) confirmed that 12 out of 15 pairs have statistically significant differences. This supports hypothesis H3 under the rental model.
Table 11 shows that there exist significant differences in PI between the buying and the rental models. Chi-square tests confirmed that such gaps were statistically significant in most categories, except for the printers (p-value = 0.078). This partially supports hypothesis H4.
An interesting point is that such PI differences between the business models show opposite results depending on the product categories (decreasing in the low-end laptops and smartphones, increasing in others).
The PI of low-end laptops and smartphones decreased by 8% (from 84% to 76%) and 10% (from 71% to 61%), respectively. The cross-tabulation of the PIs in Table 11 helps explain the changes. For low-end laptops and smartphones, 17% and 20% of the respondents, respectively, answered that “I would choose the remanufactured product over the new one if it has a good price, however, I would never rent it (“Yes/No”).” Meanwhile, the respondents who said, “I would never buy the remanufactured product, however, I am willing to rent it (“No/Yes”)” were only 9% (low-end laptops) and 10% (smartphones). Accordingly, the overall PI in the rental model becomes smaller than the PI in the buying model. Laptops and smartphones are personal technology products that are frequently used and observed by other people. Consumers tend to be very sensitive to the brand and the cosmetic conditions and in addition, consider the potential performance and the breakdown issues as vital [52,53]. Nevertheless, some consumers choose remanufactured products due to the expensive new-product prices. In the rental model, however, consumers pay divided monthly costs; especially, the new-product price of the low-end laptops and the smartphones are ₩50,000 and ₩45,000 per month, respectively. It seems that many respondents thought that renting new products was quite affordable and it was worthwhile to pay more to avoid any issues expected from the remanufactured products.
In contrast to the low-end laptops and smartphones, the PI for high-end laptops, gaming consoles, and water purifiers increased by 4% (from 75% to 79%), 3% (from 84% to 87%), and 21% (from 49% to 70%), respectively. Table 12 shows that 12% (high-end laptops), 9% (gaming consoles), and 27% (water purifiers) of the respondents answered that “I would never buy the remanufactured product, however, I would consider renting it.” It seems that the benefits of rental, such as free repair and free consumables, lessened their concerns for the remanufactured products.
The opposite results imply that there exists a more appropriate business model for each product category, from the PI perspective. For the low-end laptops and smartphones, the buying model seems more appropriate than the rental model. For the other categories, the rental model seems a better option. Note that, however, in all the categories, offering both buying and rental models is the best option. Suppose that a company is currently offering only the buying model and considering offering the rental model as an addition. Table 12 shows that adopting a rental model can increase the total PI in all product categories by 9–27% (indicated by the “No/Yes” proportions).

6. Result: Acceptable Prices (APs)

APs denote a range of prices that consumers think are acceptable for a remanufactured product. To identify the range of APs and to examine the reference price that the consumers consider reasonable, the survey asked four boundary prices: too cheap, cheap, expensive, and too expensive prices. The respondents who expressed positive PI were the participants. The too cheap and the too expensive prices correspond to the minimum and the maximum acceptable prices; here, the gap between the prices is defined as the APR. The cheap and the expensive prices provide the range of reasonable prices; the average of the prices is defined as the reference price.
For each product category, the survey first presented the new-product price and then directly asked for the APs using the PSM questionnaire. Detailed AP results are shown in Table A4 and Table A5 in Appendix A. The obtained APs were converted to the relative values in percentage by dividing them with the new-product prices to compare the different product categories and the business models with various price levels. In other words, the AP of x% refers to the x% of the new-product price.

6.1. Buying Model

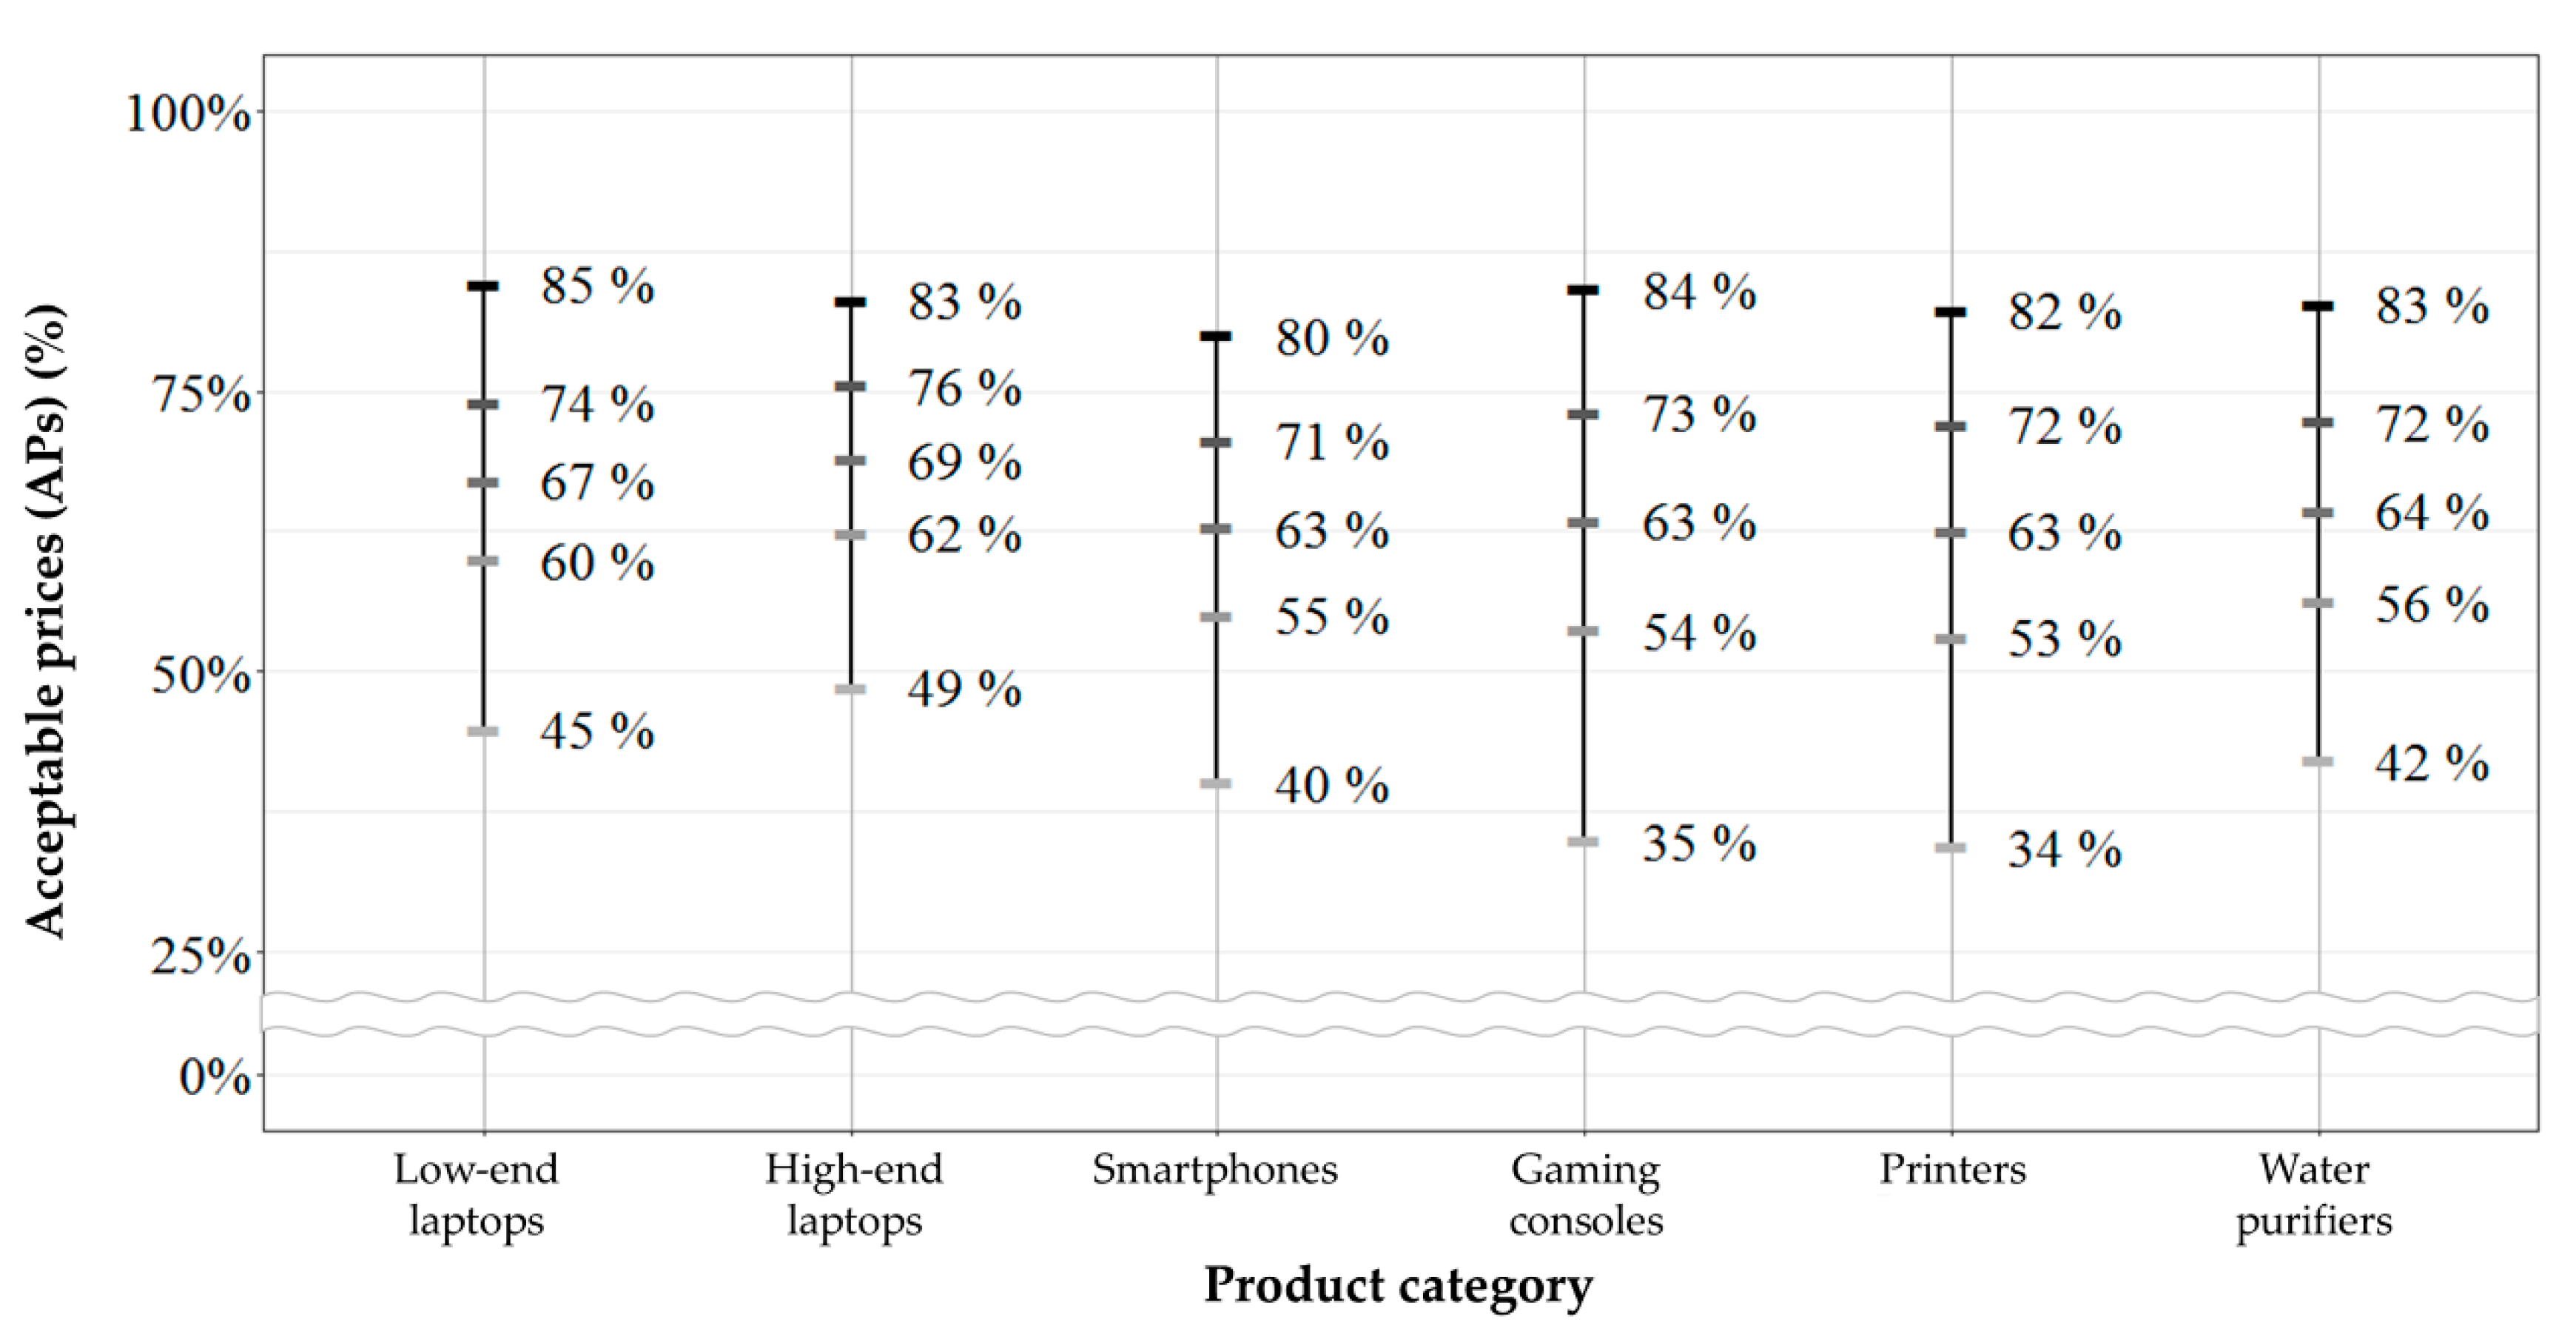
Figure 6 and Table 13 show the mean APs under the buying model. To observe the variation of the mean APs with the product categories, a one-way ANOVA was conducted for each AP. Unlike the NP and the PI, APs showed less difference among the product categories, which is distinct.
First, the too cheap (p-value = 0.000) and the cheap prices (p-value = 0.005) showed significant differences among the product categories. The too cheap prices ranged from 34% (printers) to 49% (high-end laptops) and the cheap prices ranged from 53% (printers) to 62% (high-end laptops). Such differences led to significant differences in the APR (p-value = 0.000), making it range from 35% (high-end laptops) to 49% (gaming consoles). As a post-hoc analysis, Table 14 shows the Scheffe’s test results. The mean difference in the high-end laptops and the others (smartphone, gaming consoles, printers, and water purifiers) is the most significant. The gaming consoles and the printers showed too cheap and cheap prices lower than the laptop groups. The ANOVA and the post-hoc analysis results support hypotheses H5a, H5b, and H5f under the buying model.
The difference in the too cheap price is especially interesting as it shows the boundary price at which the consumers begin questioning the product quality. In many remanufacturing studies, it has been assumed that lower prices lead to higher sales; however, the results show that this may not always be true. For instance, if a remanufactured high-end laptop is sold at 62% or below of the new-product price, consumers will doubt the quality and not buy the product. In other words, a decrease in sales is expected when the price is set too low. For the gaming consoles and the printers, however, a lower price still works. It seems that, unless the price is 34–35% or below, the consumers think the products are valid options for them.
In contrast to the too cheap and the cheap prices, the other prices showed no significant differences across the product categories. No significant differences were found in the reference (p-value = 0.587), the expensive (p-value = 0.096), and the too expensive prices (p-value = 0.725), rejecting hypotheses H5c, H5d, and H5e under the buying model. On an average, the consumers thought that 65% of the new-product price was reasonable for a remanufactured product; if the price was 73% or more of the new-product price, the consumers began to think the product was expensive, and if the price was 83% or more, they thought the product was too expensive and did not choose it. The result of the too expensive price was especially interesting. It implied that the worth the consumers placed on the remanufactured product was 83% of the new product and that it was indifferent across the six product categories.

6.2. Rental Model

Under the buying model, the too cheap prices, cheap prices, and APR were affected by the product category. Table 15 shows that the difference as per the product category disappeared under the rental model. For all types of acceptable prices, too cheap (p-value = 0.253), cheap (p-value = 0.601), reference (p-value = 0.798), expensive (p-value = 0.842), and too expensive (p-value = 0.441) prices, there exists no statistically significant difference among the six product categories. Accordingly, the APR showed no difference across the product categories (p-value = 0.271). The category average showed that, regardless of the categories, consumers thought 33% of the new-product price was too cheap, 63% was reasonable, and 91% was too expensive. The results lead to the rejection of hypotheses H5a through H5e under the rental model.
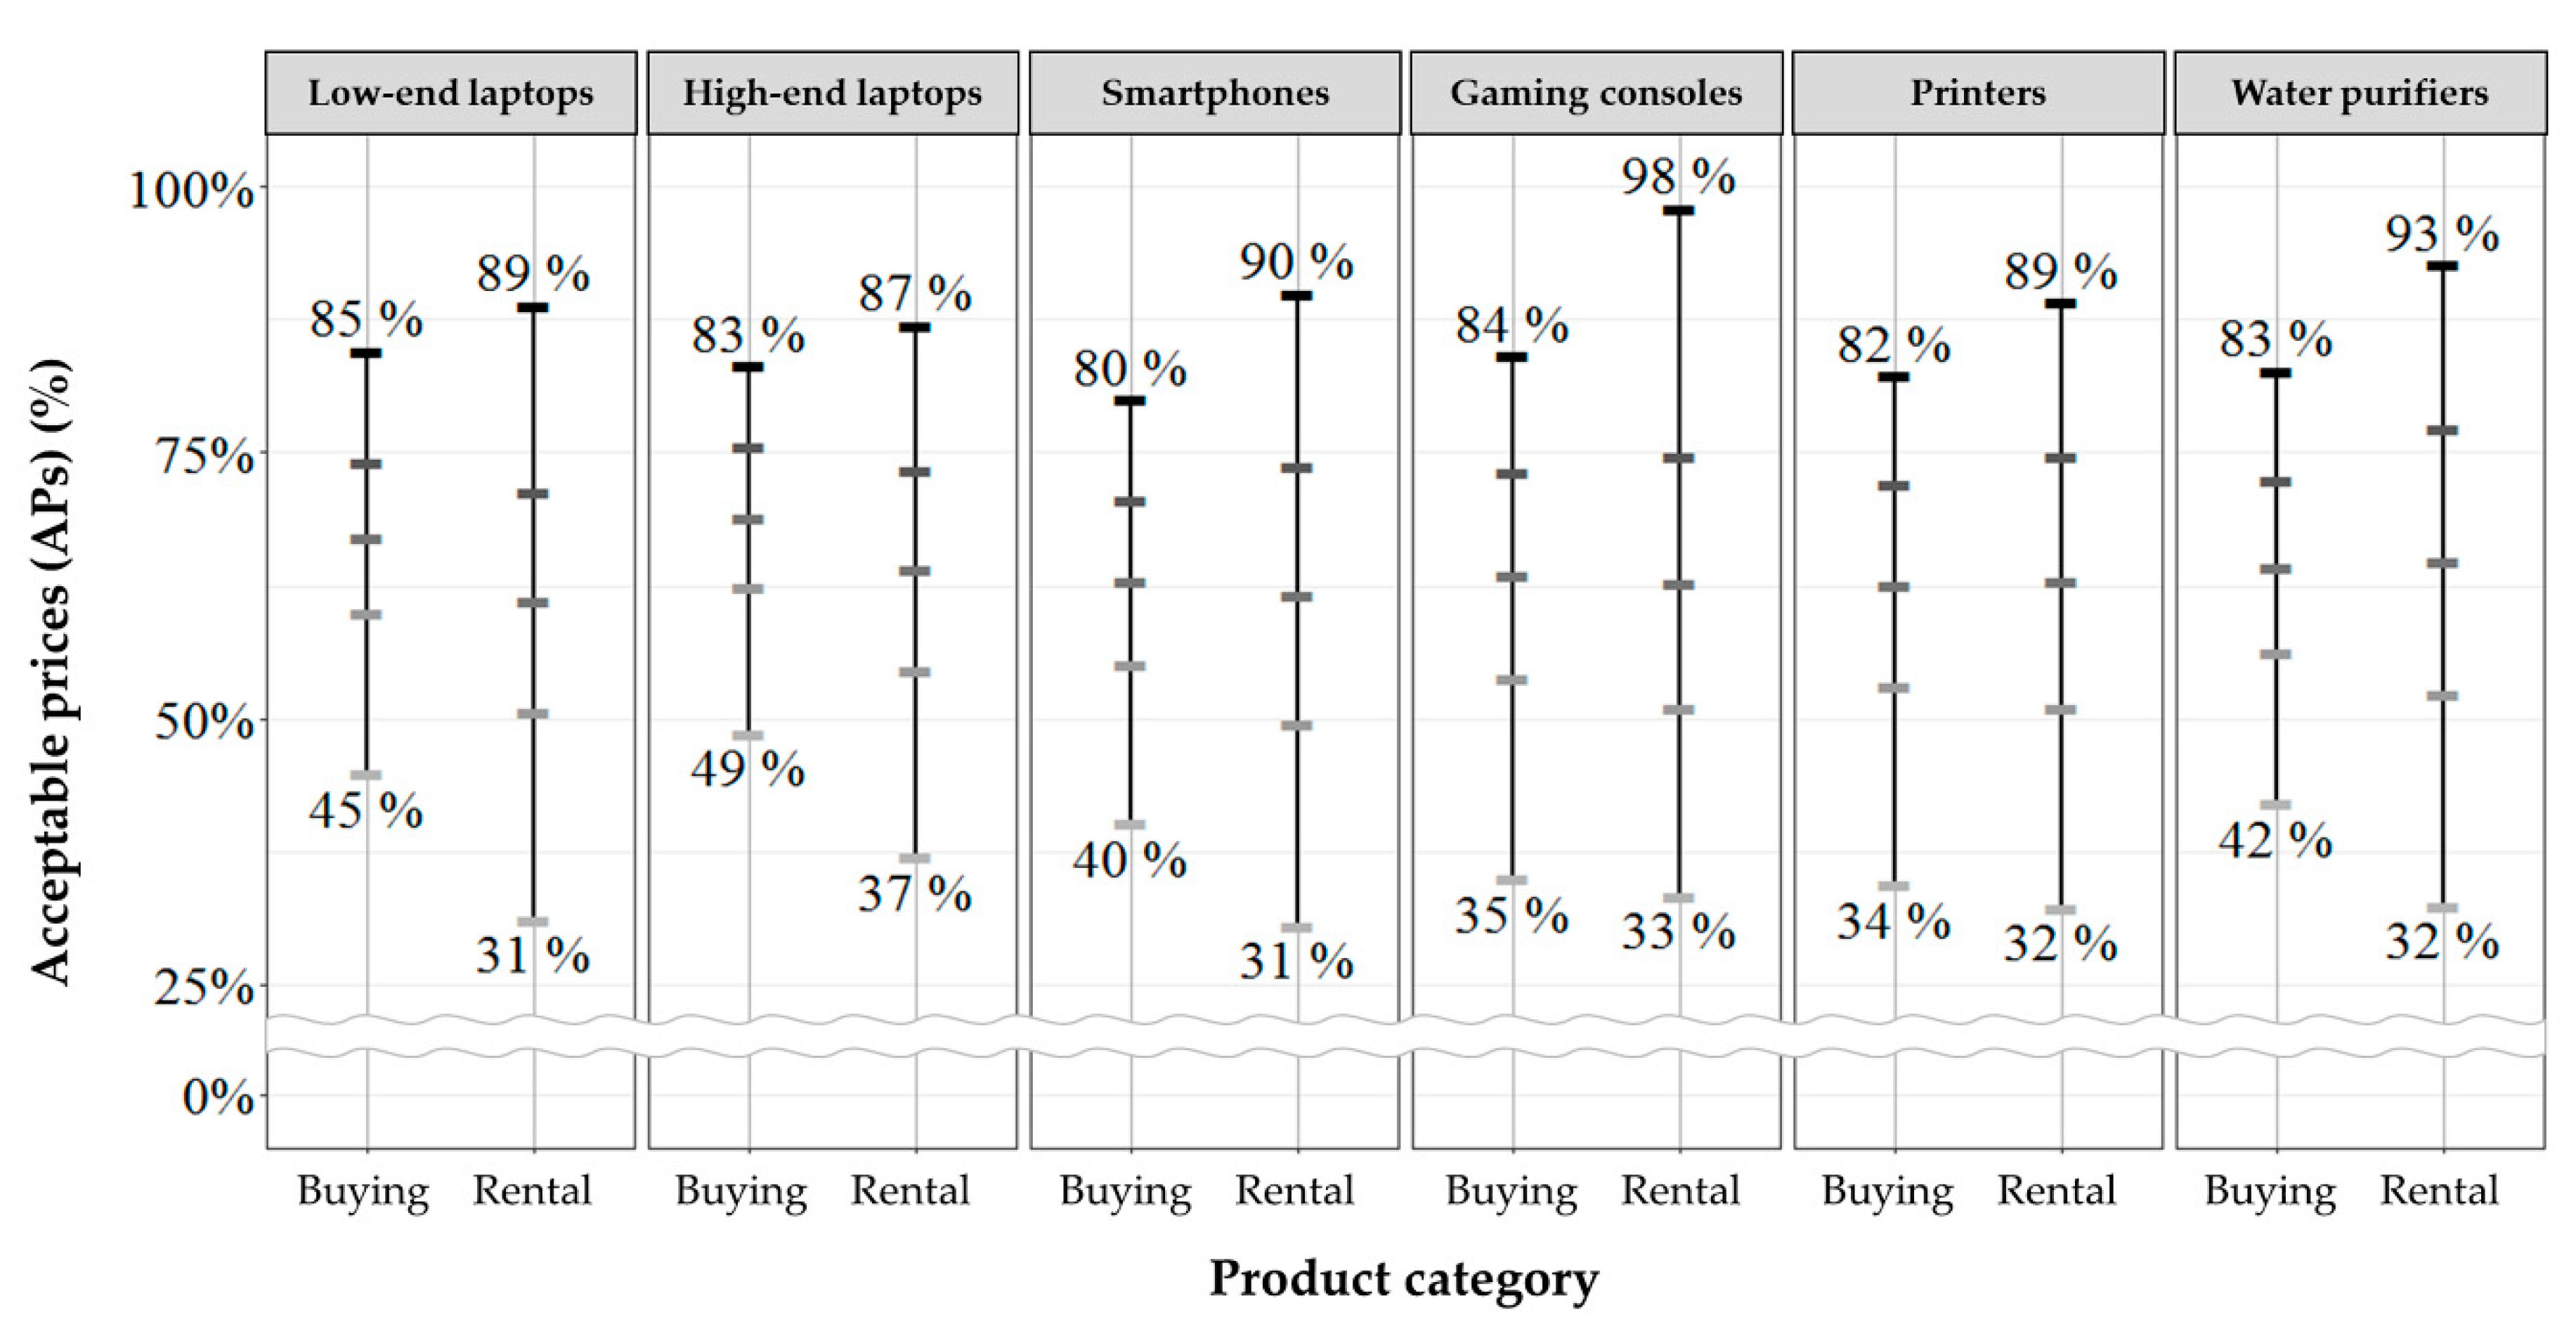
Although no difference was found among the product categories, differences in APs between the business models seem clear in all the product categories. Figure 7 and Table 16 compare the APs under the buying and the rental models. For each product category, the t-test on each AP was conducted to determine whether there was a significant difference between the two business models. The t-test results in Table 16 show that the rental model affects the APs in two different ways: by decreasing the too cheap price and/or by increasing the too expensive price.
Decreased too cheap prices were observed in the low-end laptops, high-end laptops, smartphones, and water purifiers (Hypothesis H6a was partially supported.). This implies that the consumers doubt the quality of the remanufactured products less and thus, can accept lower prices than in the buying model. It seems that the rental model has a positive effect of reducing the quality concerns and reassuring the consumers. Increased too expensive prices appeared for the smartphones, gaming consoles, and printers. (Hypothesis H6e was partially supported.) It seems that the rental model makes the consumers feel the remanufactured products are more valuable and consider them as more comparable to the new ones. The rental model offers more customer care services making it more attractive and reducing the concerns for quality. Moreover, although the buying model requires a large initial cost, the rental model allows split payments, which is less burdensome. It seems that this makes the consumers become more generous when evaluating remanufactured products.
With the changes in APs, the APR increased in all the categories. The price range of each product category became wider under the rental model in Figure 7. It can be interpreted that consumers are less sensitive and more generous to various price levels if they "rent" rather than "own" the remanufactured product. Such increased APR can be a positive sign for businesses, giving more freedom when developing a pricing strategy.

7. Discussion and Implications

Table 17 shows the hypotheses of the survey and the testing results. There are several implications of the results. First, the product categories make a difference in the relative value of remanufactured products. Specifically, NP and PI showed significant differences across the product categories under both buying and rental models. NP was 92–99% under the buying model and 74–91% under the rental model. PI was 49–84% under the buying model and 61–93% under the rental model. APs, however, showed a little difference only in the buying model; only the too cheap and the cheap prices of the buying model showed significant differences across the product categories. This indicates that consumers start doubting the product quality at different price points, specifically, at 34–49% of the new-product price. When remarketing remanufactured products, such differences of too cheap prices should be carefully considered, as lower prices do not necessarily lead to more sales. It was surprising that there was no noticeable difference in the too expensive price. The average too expensive price was 83% (buying) and 91% (rental) of the new-product price. Considering that the too expensive price represents the worth a consumer places on a product, it indicates that consumers think remanufactured products have 83% of the value (or 91% in rental) of the equivalent new products regardless of the product category.
Next, the effect of business models on the relative value of remanufactured products was supported. Switching the business model from buying to rental caused significant changes in NP, PI, and APs in almost all the product categories (H2, H4, and H6 in Table 17). Overall, changing to the rental model brought positive effects on NP and APs. NP decreased, meaning that more people considered a remanufactured product as an equivalent or a better option to the new one when they rent the product. The APs changed in two directions, either decreased at the too cheap price or increased at the too expensive price, leading to a wider APR. This implies that, under the rental model, people attributed more value to a remanufactured product and became less cautious about its quality.
Unlike NP and APs that showed common changes in all product categories, PI changed differently in each category. It increased for high-end laptops, gaming consoles, and water purifiers, however, decreased for low-end laptops and smartphones. It seems that product characteristics such as price level, reliability, and required consumables, and consumers’ personal characteristics such as income level, involvement, brand preference, and consciousness of others, affected the results. This means that changing to the rental model worked either positively or negatively depending on the category, and the suitability to the rental model varies across the product categories. The rental model can be a better option only for certain categories. Thus, if a remanufacturer should make a choice between the buying and the rental models, such difference by product category should be carefully taken into account. For instance, for the remanufactured low-end laptops and smartphones, companies should focus on the buying model rather than the rental model. For the other categories, the rental model can be a better choice. It should be noted, however, that offering both buying and rental models could be the best option for remanufacturers. It was shown that offering the rental model in addition to the buying model increased the total PI up to 27% in all the product categories (see Table 12 for detail).
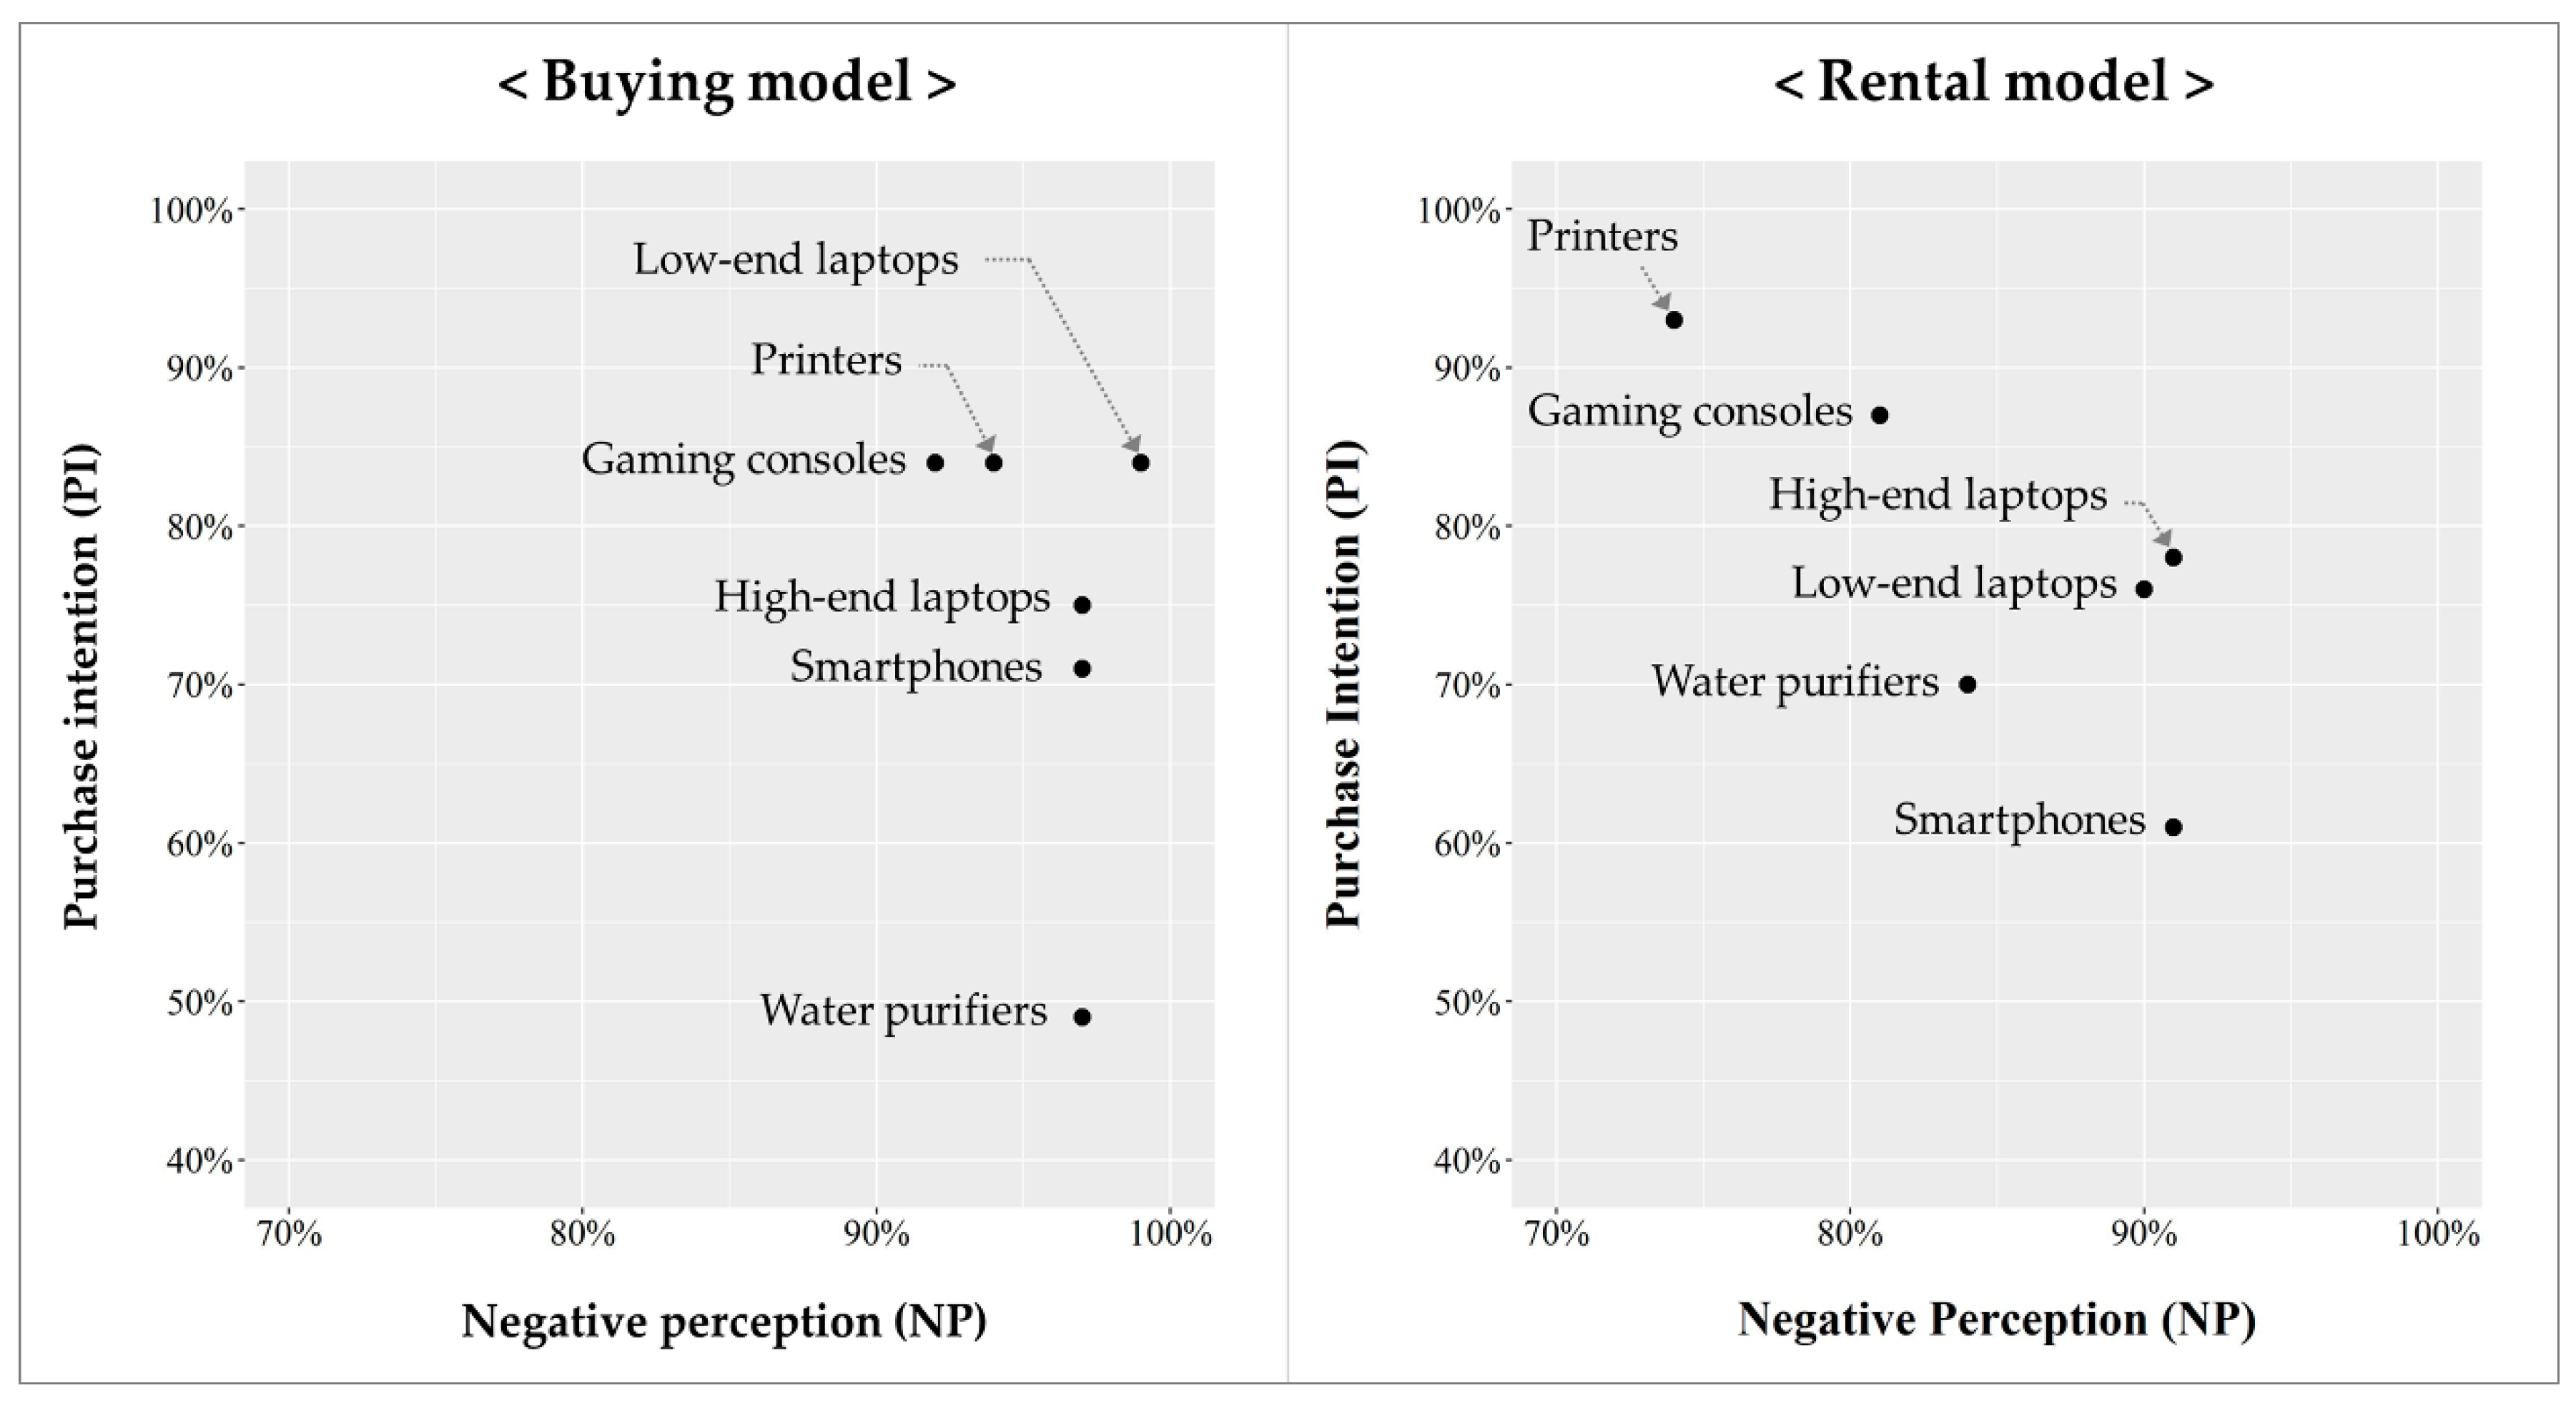
Figure 8 shows that several product categories are more suitable for the remanufacturing business from the consumer-demand perspective. Figure 8 shows the NP (x-axis: the lower, the better) and the PI (y-axis: the higher, the better) of the six categories to compare their market potentials. The gaming consoles and printers showed greater market potential (lower NP and higher PI) under both buying and rental models. Although not shown in the figure, it is also notable that the two categories showed the lowest too cheap prices of 34% (printers) and 35% (gaming consoles) under the buying model. This implies that people are less concerned about the quality of remanufactured products. Low-end laptops are another category that seems to be suitable for remanufacturing under the buying model. The PI (84%) was among the highest under the buying model, although the NP was also the highest. This suggests that many people are willing to buy remanufactured low-end laptops if the price is reasonably cheaper than the new ones. However, consumers’ perception under the rental model is not so positive. The PI dropped to 76% for the remanufactured low-end laptops, and the rental model is not as recommendable as the buying model.
The water purifiers and the smartphones showed the least market potential, regardless of the business model. They showed the lowest PI in the buying and the rental model, respectively. Water purifiers are household appliances directly related to personal hygiene. It seems that the consumers cannot tolerate emotional discomfort regardless of its working condition and cleanliness. However, considering the increased PI (from 49% to 70%) and the declined NP (from 97% to 84%) when switching from the buying to the rental model, it is expected to be relatively more successful in the rental model. Therefore, if a water purifier is remanufactured, promoting rental services based on the hygienic image marketing seems recommendable. A smartphone is a personal device for everyday use, observed by others, and containing substantial personal information. It seems that such factors make the remanufactured smartphones undervalued, especially in the rental market. For remanufacturing smartphones, the traditional buying model would be more appropriate.
In summary, the current study demonstrates that both the product categories and business models cause significant differences in the relative value of remanufactured products. The survey results extend the findings of previous studies that have dealt with either a single product category or a single business model (refer to Table 2 for detail). Especially, the results indicate that there are product categories that are naturally more advantageous for the remanufacturing businesses from a consumer-demand viewpoint. In addition, the results show that the rental model can be a lucrative option for the remanufacturing business for certain product categories. Considering the development of the sharing economy, these results can be beneficial for the remanufacturing industry. It is expected that a combination of remanufacturing and the rental model can contribute to saving more resources and for generating higher profit.
Highlighting the existence of a minimum acceptable (too cheap) price and its differences as per the product category is another important finding from this study. The results imply that a common assumption that a lower price leads to a higher quantity demanded may not hold for the remanufactured products. The results also indicate that the boundary price of the most significant differences among the categories is the minimum, and not the maximum. Such implications can be useful in establishing optimal pricing and remarketing strategies of the remanufactured products.

8. Conclusions

This study determines if and how the product category and business model affect consumer valuation and acceptance of remanufactured products. A survey was conducted to analyze the relative value of remanufactured products perceived by consumers (how valuable a remanufactured product is in comparison to the same-but-new version of the product). Six product categories (low-end laptops, high-end laptops, smartphones, gaming consoles, printers, and water purifiers) and two business models (buying and rental models) were selected as the factors. NP, PI, and APs were used as the measures of relative value.
As per the knowledge of the authors, this study took a novel approach that demonstrates the effect of product categories and business models on the value of remanufactured products. This study, however, has limitations as it surveyed a relatively small and homogeneous sample of university students and considered only six product categories. It highlights the potential impact of product categories and business models, but it may be difficult to generalize the results of this study to all consumers and all product categories. A possible gap between the stated survey answers and the actual purchase behavior is another limitation. Future research should involve a larger sample and should consider adopting data on actual purchase behavior. Different ways of data collection such as experiments, behavior observation, and web crawling can be considered.
In the future, it will be necessary to study the effect of consumers’ personal profiles on the value of remanufactured products. Personal profile characteristics, such as age, income level, education, prior knowledge/experiences, and level of involvement, are expected to have significant influences on consumer valuation. Linking characteristics of products and business models to consumer valuation is another area of research that is necessary and promising. The current study showed that consumer valuation for remanufactured products is different across the product categories and between the business models, which implies the significance and importance of product/business model characteristics. Clarifying the effect of the product/business model characteristics (such as initial cost, price gap between new and remanufactured products, reliability, design specifications, purpose and frequency purpose of use, relevance to hygiene, etc.) can provide useful implications for remanufacturing management and towards the design for remanufacturing. Ultimately, a consumer valuation model that incorporates both the consumer and the product/business model characteristics needs to be developed in the future. More advanced analysis techniques such as structural equation modeling, mathematical modeling and analysis, and data mining would provide a promising solution to this challenge.
Supplementary Materials

The following is available online at https://www.mdpi.com/2071-1050/12/18/7581/s1, Spreadsheet S1: survey response data.

Author Contributions

Conceptualization, S.L. and M.K.; methodology, S.L. and M.K.; investigation, S.L.; formal analysis, S.L.; writing—original draft preparation, S.L. and M.K.; writing—review and editing, M.K.; supervision, M.K.; project administration, M.K.; funding acquisition, M.K. All authors have read and agreed to the published version of the manuscript.

Funding

This research was supported by the National Research Foundation of Korea (NRF) grant funded by the Korea government (Ministry of Science and ICT, MSIT) (No. NRF-2019R1F1A1041099).

Conflicts of Interest

The author declares no conflict of interest. The founding sponsors had no role in the design of this study; in the collection, analyses, or interpretation of data; in the writing of the manuscript; and in the decision to publish the results.

Appendix A

Table A1, Table A2 and Table A3 provide the Fisher’s exact test results for NP and PI differences. Table A4 and Table A5 provide the APs in the relative value (i.e., price ratio).
Table A1. Fisher’s exact test results for NP difference across the product categories: rental model.
Low-End LaptopsHigh-End LaptopsSmartphonesGaming ConsolesPrintersWater Purifiers
Low-end laptops
High-end laptops0.000 ***
Smartphones0.000 ***0.000 ***
Gaming consoles0.000 ***0.000 ***0.000 ***
Printers0.000 ***0.003 **0.000 ***0.000 ***
Water purifiers0.000 ***0.000 ***0.000 ***0.000 ***0.000 ***
** p < 0.01, *** p < 0.001.
Table A2. Fisher’s exact test results for PI difference across the product categories: buying model.
Low-End LaptopsHigh-End LaptopsSmartphonesGaming ConsolesPrintersWater Purifiers
Low-end laptops
High-end laptops0.002 **
Smartphones0.000 ***0.111
Gaming consoles0.002 **0.000 ***0.124
Printers0.000 ***0.038 *0.010 *0.000 ***
Water purifiers0.000 ***0.004 **0.000 ***0.004 **0.090
* p < 0.05, ** p < 0.01, *** p < 0.001.
Table A3. Fisher’s exact test results for PI difference across the product categories: rental model.
Low-End LaptopsHigh-End LaptopsSmartphonesGaming ConsolesPrintersWater Purifiers
Low-end laptops
High-end laptops0.000 ***
Smartphones0.000 ***0.000 ***
Gaming consoles0.4690.7070.762
Printers0.000 ***0.000 ***0.013 *0.005 **
Water purifiers0.003 **0.002 **0.001 **0.035 *0.003 **
* p < 0.05, ** p < 0.01, *** p < 0.001.
Table A4. Detailed results under the buying model: APs.
Too CheapCheapReferenceExpensiveToo ExpensiveAPR
Low-end laptopsMean0.44900.60040.67070.74090.84610.3970
S.D.0.17510.14970.13540.14730.14030.1549
Min0.04170.20830.29170.10830.50000.1250
Max0.83330.91670.93751.01671.25000.8333
High-end laptopsMean0.48650.62440.68990.75550.83220.3457
S.D.0.21450.17640.16250.16030.15760.1610
Min0.08000.24000.30000.36000.48000.0080
Max0.99600.99601.00001.20001.44000.8400
SmartphonesMean0.40180.55080.62890.70700.80060.3988
S.D.0.17210.15120.14090.14260.14770.1597
Min0.04000.20000.28000.32000.40000.1600
Max0.84000.85600.94801.04001.28000.8800
Gaming consolesMean0.35030.53780.63490.73200.84160.4913
S.D.0.18100.18080.16140.16180.22620.2350
Min0.10000.20000.30000.35000.40000.1600
Max0.80000.90001.05001.20002.00001.6000
PrintersMean0.34430.53120.62600.72080.82300.4787
S.D.0.17380.17380.16760.17460.20560.2131
Min0.05000.12500.15000.17500.50000.0500
Max0.87500.90001.00001.25002.00001.7500
Water
purifiers
Mean0.42060.56310.64370.72430.82780.4072
S.D.0.20620.18700.17230.16880.16100.1671
Min0.04170.12500.18750.25000.41670.0833
Max0.83330.91671.00001.08331.33330.8333
Table A5. Detailed results under the rental model: APs.
Too CheapCheapReferenceExpensiveToo ExpensiveAPR
Low-end laptopsMean0.31160.50700.61070.71430.88870.5770
S.D.0.16450.18100.17750.19720.28950.3168
Min0.02000.20000.30000.40000.60000.2000
Max0.70000.90001.00001.40002.00001.9800
High-end laptopsMean0.36960.54560.64010.73470.87070.5011
S.D.0.18500.16860.16920.21020.26840.2972
Min0.05000.20000.25000.30000.40000.0700
Max0.88000.90001.15001.80002.50002.2000
SmartphonesMean0.30580.49480.61590.73690.90000.5942
S.D.0.14030.15260.15340.19000.27440.2886
Min0.08890.22220.27780.33330.44440.2222
Max0.66670.77781.00001.33332.22221.8889
Gaming consolesMean0.33440.50970.62850.74740.97990.6455
S.D.0.17010.14800.18880.29610.50850.5280
Min0.05000.05000.32500.25000.50000.0500
Max0.95000.75001.62502.50004.00003.6000
PrintersMean0.32320.51140.63000.74850.89250.5693
S.D.0.15900.17140.16080.17950.22630.2367
Min0.05000.12500.18750.25000.50000.2500
Max0.75000.87500.93751.25001.75001.5000
Water
purifiers
Mean0.32500.52310.64810.77310.92740.6024
S.D.0.13440.16590.20230.26550.39490.3860
Min0.06670.16670.25000.33330.50000.2667
Max0.66671.00001.33331.66673.00002.6667

References

  1. Kwak, M.; Kim, H. Green profit maximization through integrated pricing and production planning for a line of new and remanufactured products. J. Clean. Prod. 2017, 142, 3454–3470. [Google Scholar] [CrossRef] [Green Version]
  2. Ghadge, A.; Er Kara, M.; Mogale, D.G.; Choudhary, S.; Dani, S. Sustainability implementation challenges in food supply chains: A case of UK artisan cheese producers. Prod. Plan. Control. 2020, 1–16. [Google Scholar] [CrossRef]
  3. D’Adamo, I.; Rosa, P. Remanufacturing in industry: Advices from the field. Int. J. Adv. Manuf. Technol. 2016, 86, 2575–2584. [Google Scholar] [CrossRef]
  4. Ijomah, W. A Model-Based Definition of the Generic Remanufacturing Business Process. Ph.D. Thesis, University of Plymouth, Plymouth, UK, 2002. [Google Scholar]
  5. Fleischmann, M.; Bloemhof-Ruwaard, J.M.; Dekker, R.; Van Der Laan, E.; Van Nunen, J.; Van Wassenhove, L.N. Quantitative Models for Reverse Logistics: A Review. Eur. J. Oper. Res. 1997, 103, 1–17. [Google Scholar] [CrossRef] [Green Version]
  6. Kwak, M. Optimal Line Design of New and Remanufactured Products: A Model for Maximum Profit and Market Share with Environmental Consideration. Sustainability 2018, 10, 4283. [Google Scholar] [CrossRef] [Green Version]
  7. Singhal, D.; Tripathy, S.; Jena, S.K. Remanufacturing for the circular economy: Study and evaluation of critical factors. Resour. Conserv. Recycl. 2020, 156, 104681. [Google Scholar] [CrossRef]
  8. Matsumoto, M.; Yang, S.; Martinsen, K.; Kainuma, Y. Trends and Research Challenges in Remanufacturing. Int. J. Precis. Eng. Manuf. Green Technol. 2016, 3, 129–142. [Google Scholar] [CrossRef]
  9. Jiménez-Parra, B.; Rubio, S.; Vicente-Molina, M.A. Key Drivers in the Behavior of Potential Consumers of Remanufactured Products: A Study on Laptops in Spain. J. Clean. Prod. 2014, 85, 488–496. [Google Scholar] [CrossRef]
  10. Khor, K.S.; Hazen, B.T. Remanufactured products purchase intentions and behaviour: Evidence from Malaysia. Int. J. Prod. 2017, 55, 2149–2162. [Google Scholar] [CrossRef]
  11. Abbey, J.D.; Meloy, M.G.; Guide, V.D.R.; Atalay, S. Remanufactured Products in Closed-Loop Supply Chains for Consumer Goods. Prod. Oper. Manag. 2015, 24, 488–503. [Google Scholar] [CrossRef]
  12. Singhal, D.; Jena, S.K.; Tripathy, S. Factors Influencing the Purchase Intention of Consumers Towards Remanufactured Products: A Systematic Review and Meta-Analysis. Int. J. Prod. 2019, 57, 7289–7299. [Google Scholar] [CrossRef]
  13. Vazifehdoust, H.; Taleghani, M.; Esmaeilpour, F.; Nazari, K. Purchasing Green to Become Greener: Factors Influence Consumers’ Green Purchasing Behavior. Manag. Sci. Lett. 2013, 3, 2489–2500. [Google Scholar] [CrossRef]
  14. Wang, Y.; Wiegerinck, V.; Krikke, H.; Zhang, H. Understanding the purchase intention towards remanufactured product in closed-loop supply chains: An empirical study in China. Int. J. Phys. Distrib. Logist. Manag. 2013, 43, 866–888. [Google Scholar] [CrossRef]
  15. Wang, Y.; Hazen, B.T. Consumer Product Knowledge and Intention to Purchase Remanufactured Products. Int. J. Prod. Econ. 2016, 181, 460–469. [Google Scholar] [CrossRef]
  16. Wang, Y.; Huscroft, J.; Hazen, B.; Zhang, M. Green information, green certification and consumer perceptions of remanufctured automobile parts. Resour. Conserv. Recycl. 2016, 128, 187–196. [Google Scholar] [CrossRef]
  17. Wang, Y.; Hazen, B.T.; Mollenkopf, D.A. Consumer Value Considerations and Adoption of Remanufactured Products in Closed-Loop Supply Chains. Ind. Manag. Data Syst. 2018, 118, 480–498. [Google Scholar] [CrossRef]
  18. Bittar, A.D.V. Factors Influencing the Purchase of Remanufactured Products; SIMPOI: Sao Paulo, Brazil, 2017. [Google Scholar]
  19. Hamzaoui-Essoussi, L.; Linton, J.D. Offering Branded Remanufactured/Recycled Products: At What Price? J. Remanuf. 2014, 4, 9. [Google Scholar] [CrossRef] [Green Version]
  20. Subramanian, R.; Subramanyam, R. Key Factors in the Market for Remanufactured Products. Manuf. Serv. Oper. Manag. 2012, 14, 315–326. [Google Scholar] [CrossRef] [Green Version]
  21. Agrawal, V.V.; Atasu, A.; Van Ittersum, K. Remanufacturing, Third-Party Competition, and Consumers’ Perceived Value of New Products. Manag. Sci. 2015, 61, 60–72. [Google Scholar] [CrossRef] [Green Version]
  22. Cheng, M. Sharing economy: A Review and Agenda for Future Research. Int. J. Hosp. Manag. 2016, 57, 60–70. [Google Scholar] [CrossRef]
  23. Parente, R.C.; Geleilate, J.M.G.; Rong, K. The Sharing Economy Globalization Phenomenon: A Research Agenda. J. Int. Manag. 2018, 24, 52–64. [Google Scholar] [CrossRef]
  24. Amasawa, E.; Shibata, T.; Sugiyama, H.; Hirao, M. Environmental potential of reusing, renting, and sharing consumer products: Systematic analysis approach. J. Clean. Prod. 2020, 242, 118487. [Google Scholar] [CrossRef]
  25. Milios, L.; Matsumoto, M. Consumer Perception of Remanufactured Automotive Parts and Policy Implications for Transitioning to a Circular Economy in Sweden. Sustainability 2019, 11, 6264. [Google Scholar] [CrossRef] [Green Version]
  26. Van Westendorp, P.H. NSS Price Sensitivity Meter (PSM)—A New Approach to Study Consumer Perception of Prices. In Proceedings of the 29th ESOMAR Congress, Venice, Italy, 5–9 September 1976; pp. 5–9. [Google Scholar]
  27. Steiner, M.; Hendus, J. How Consumers’ Willingness to Pay is Measured in Practice: An Empirical Analysis of Common Approaches’ Relevance. J. Prod. Brand. Manag. 2012, 24, 7. [Google Scholar] [CrossRef]
  28. Shu, T.; Xu, J.; Chen, S.; Wang, S.; Lai, K.K. Remanufacturing Decisions with WTP Discrepancy and Uncertain Quality of Product Returns. Sustainability 2018, 10, 2123. [Google Scholar] [CrossRef] [Green Version]
  29. Hamzaoui, E.L.; Linton, J.D. New or Recycled Products: How Much are Consumers Willing to Pay? J. Consum. Mark. 2010, 27, 458–468. [Google Scholar] [CrossRef]
  30. Michaud, C.; Llerena, D. Green Consumer Behaviour: An Experimental Analysis of Willingness to Pay for Remanufactured Products. Bus. Strategy Environ. 2011, 20, 408–420. [Google Scholar] [CrossRef]
  31. Guide, V.D.R.; Wassenhove, L.N.V. OR FORUM—The Evolution of Closed-Loop Supply Chain Research. Oper. Res. 2009, 57, 10–18. [Google Scholar] [CrossRef]
  32. Kwak, M. Green Profit Design for Lifecycle. Ph.D. Thesis, University of Illinois Urbana-Champaign, Champaign, IL, USA, 2012. [Google Scholar]
  33. Hazen, B.T.; Mollenkopf, D.A.; Wang, Y. Remanufacturing for the Circular Economy: An Examination of Consumer Switching Behavior. Bus. Strategy Environ. 2017, 26, 451–464. [Google Scholar] [CrossRef]
  34. Wahjudi, D.; Gan, S.S.; Anggono, J.; Tanoto, Y.Y. Factors Affecting Purchase Intention of Remanufactured Short Life-Cycle Products. Int. J. Bus. Soc. 2018, 19, 415–428. [Google Scholar]
  35. Mugge, R.; Jockin, B.; Bocken, N. How to Sell Refurbished Smartphones? An Investigation of Different Customer Groups and Appropriate Incentives. J. Clean. Prod. 2017, 147, 284–296. [Google Scholar] [CrossRef]
  36. Wang, S.; Wang, J.; Yang, F.; Li, J.; Song, J. Determinants of Consumers’ Remanufactured Products Purchase Intentions: Evidence from China. Int. J. Prod. 2020, 58, 2368–2383. [Google Scholar] [CrossRef]
  37. Hazen, B.T.; Overstreet, R.E.; Jones-Farmer, L.A.; Field, H.S. The Role of Ambiguity Tolerance in Consumer Perception of Remanufactured Products. Int. J. Prod. Econ. 2012, 135, 781–790. [Google Scholar] [CrossRef]
  38. Abbey, J.D.; Kleber, R.; Souza, G.C.; Voigt, G. The Role of Perceived Quality Risk in Pricing Remanufactured Products. Prod. Oper. Manag. 2017, 26, 100–115. [Google Scholar] [CrossRef]
  39. Van Nguyen, T.; Zhou, L.; Chong, A.Y.L.; Li, B.; Pu, X. Predicting Customer Demand for Remanufactured Products: A data-mining Approach. Eur. J. Oper. Res. 2020, 281, 543–558. [Google Scholar] [CrossRef]
  40. Lieder, M.; Asif, F.M.A.; Rashid, A. A Choice Behavior Experiment with Circular Business Models Using Machine Learning and Simulation Modeling. J. Clean. Prod. 2020, 258, 120894. [Google Scholar] [CrossRef]
  41. Copani, G.; Behnam, S. Remanufacturing with Upgrade PSS for New Sustainable Business Models. CIRP J. Manuf. Sci. Technol. 2018, 47, 531–536. [Google Scholar] [CrossRef]
  42. Planing, P. Towards a Circular Economy-How Business Model Innovation will Help to Make the Shift. Int. J. Bus. Glob. 2018, 20, 71–83. [Google Scholar] [CrossRef]
  43. Nußholz, J.L.K. Circular Business Models: Defining a Concept and Framing an Emerging Research Field. Sustainability 2017, 9, 1810. [Google Scholar] [CrossRef] [Green Version]
  44. Guide, V.D.R.; Li, J. The Potential for Cannibalization of New Products Sales by Remanufactured Products. Decis. Sci. 2010, 41, 547–572. [Google Scholar] [CrossRef]
  45. Ovchinnikov, A. Revenue and Cost Management for Remanufactured Products. Prod. Oper. Manag. 2011, 20, 824–840. [Google Scholar] [CrossRef]
  46. Kalyanaram, G.; John, D.C.L. An Empirical Analysis of Latitude of Price Acceptance in Consumer Package Goods. J. Consum. Res. 1994, 21, 408–418. [Google Scholar] [CrossRef]
  47. Average Monthly Stipend and Supported Rate in Korea 2019 (Korean Statistical Information Service). Available online: http://kosis.kr/statHtml/statHtml.do?orgId=402&tblId=DT_402004N_027&conn_path=I2 (accessed on 23 February 2020).
  48. McDonald, J.H. Handbook of Biological Statistics, 3rd ed.; Sparky House Publishing: Baltimore, MS, USA, 2014. [Google Scholar]
  49. Judd, C.M.; Mcclelland, G.H.; Ryan, C.S. Data Analysis: A Model. Comparison Approach to Regression, ANOVA, and Beyond, 3rd ed.; Routledge: New York, NY, USA, 2017. [Google Scholar]
  50. Did Welch’s ANOVA Make Fisher’s Classic One-Way ANOVA Obsolete? (Minitab Blog). Available online: https://blog.minitab.com/blog/adventures-in-statistics-2/did-welchs-anova-make-fishers-classic-one-way-anova-obsolete (accessed on 23 February 2020).
  51. Scheffé, H. The Analysis of Variance; John Wiley & Sons: New York, NY, USA, 1999; Volume 72. [Google Scholar]
  52. Yeh, C.H.; Wang, Y.S.; Yieh, K. Predicting Smartphone Brand Loyalty: Consumer Value and Consumer-Brand Identification Perspectives. Int. J. Inf. Manag. 2016, 36, 245–257. [Google Scholar] [CrossRef]
  53. Puad, M.H.M.; Yusof, A.R.; Sahak, S.Z. Smartphone Product Appearance: What Drive Consumers’ Purchase Decision? In Proceedings of the 1st AAGBS International Conference on Business Management 2014 (AiCoBM 2014), Penang, Malaysia, 6–8 April 2014. [Google Scholar]
Figure 1. Conceptual framework of the survey.
Sustainability 12 07581 g001
Figure 2. APs adopted from the price sensitivity meter (PSM) method [26].
Sustainability 12 07581 g002
Figure 3. Percentage proportion of NP.
Sustainability 12 07581 g003
Figure 4. Reasons for NP: differences across product categories and business models.
Sustainability 12 07581 g004
Figure 5. Percentage proportion of PI.
Sustainability 12 07581 g005
Figure 6. Mean APs for remanufactured products: buying model.
Sustainability 12 07581 g006
Figure 7. Difference in mean APs between the business models (buying vs. rental).
Sustainability 12 07581 g007
Figure 8. Percentage proportions of PI and NP under the buying (left) and the rental (right) models.
Sustainability 12 07581 g008
Table 1. Definition of the dependent variables in this study.
TermDefinition
Negative perception (NP)Consumer’s opinion on whether the remanufactured product should be cheaper than the same-but-new product (yes or no)
Purchase intention (PI)Consumer’s willingness to purchase the remanufactured product if the price is attractive and appropriate (yes or no)
Acceptable price (AP)Boundary prices that indicate the consumer’s thoughts regarding the remanufactured product as too cheap, cheap, expensive, or too expensive
Willingness to pay (WTP)Maximum acceptable price (too expensive price) or the reservation price a consumer would spend on a remanufactured product
Table 2. Summary of the relevant literature and comparison with the current study.
AuthorsInfluencing Factors 1)VariableProduct CategoryMethod 2)N 3)Country
Vazifehdoust et al. [13]Environmental concern, quality, green advertising, green labeling, ATPI SEM 374Iran
Jiménez-Parra et al. [9]AT, SN, motivation, marketing-mix variablesPILaptopsSEM1529Spain
Wang et al. [14]AT, SN, PBC, PK, PR, PBPIAutomobile partsSEM288China
Wang and Hazen [15]PK (cost, green, quality knowledge), PV, PRPIAutomobile enginesSEM264China
Khor and Hazen [10]AT, SN, PBCPIElectrical and electronic equip.SEM157Malaysia
Hazen et al. [33]New-product price, government incentives, EB, ATPILaptopsRegression920US
Wahjudi et al. [34]PK, PB, PR, ATPIMobile phonesSEM300Indonesia
Bittar [18]Brand equity, price perception, environmental consciousnessPILaptopsSEM, ANOVA255US
Mugge et al. [35]Consumer group (clustered by individual characteristics), incentivePISmartphonesANOVA250Mixed
Wang et al. [16]Green-attribute information, green certification, perceived green value, perceived trustPIAutomobile partsSEM497China
Milios and Matsumoto [25]PK, PB, PRPIAutomobile partsRegression203Sweden
Wang et al. [36]AT, SN, PBC, and their interactionsPICellular telephonesRegression497China
Michaud and Llerena [30]Info. about environmental impacts of production processes, informed EB, proportion of remanufactured components, remanufacturer identityWTPCamerast-test48France
Hazen at al. [37]Ambiguity tolerance, PQWTP SEM340US
Hamzaoui-Essoussi and Linton [19]Product category, brand name, newness (new versus recycled/remanufactured)WTPPapers, toners, cell phones, cameras, printerst-test322Canada
Abbey et al. [38]Perceived probability of functionality defects, perceived probability of cosmetic defects, PQ, purchase likelihoodWTPiPhoneSEM130US
Subramanian and Subramanyam [20]Remanufacturer identity seller reputation, warranty, product subcategoryPrice differentialElectronics (GPS system, home audio, portable audio, vehicle electronics, others)Regression2229Mixed
Abbey et al. [11]Product type, price discounts, brand equity, quality attributes, negative attributes, green attributes, consumer greennessAttractivenessTechnology, household, personalRegression1502US
Van Nguyen et al. [39]Product descriptions, price, promotion, consumer review, brand equityDemand (sales)ElectronicsML1567Mixed
Lieder et al. [40]Consumer demographic value (age, income, gender, and education)Business model choiceWashing machineML/Simulation3384Sweden
Current studyProduct category, business modelNP, PI, APsLow-end laptops, high-end laptops, smartphones, gaming consoles, printers, water purifiersChi-square test, ANOVA, t-test95Korea
1) AT: attitude, SN: subjective norm, PK: product knowledge, EB: environmental benefit, PR: perceived risk, PB: perceived benefit, PV: perceived value, PQ: perceived quality, PBC: perceived behavioral control; 2) SEM: structural equation modeling, ANOVA: analysis of variance, ML: machine learning; 3) Sample size.
Table 3. Six product categories and the new-product price set for each category (unit: won (₩)).
Low-end LaptopsHigh-end LaptopsSmartphonesGaming ConsolesPrintersWater Purifiers
Product image Sustainability 12 07581 i001 Sustainability 12 07581 i002 Sustainability 12 07581 i003 Sustainability 12 07581 i004 Sustainability 12 07581 i005 Sustainability 12 07581 i006
Buying price1,200,0002,500,0001,250,000500,000400,0001,200,000
Rental price *50,000100,00045,00020,00040,00030,000
* Prices are the monthly rent for a new product.
Table 4. Hypotheses.
VariableFactorHypotheses
NPProduct categoryH1NP differs across product categories.
Business modelH2NP differs between business models.
PIProduct categoryH3PI differs across product categories.
Business modelH4PI differs between business models.
APsProduct categoryH5aMean too cheap price differs across product categories.
H5bMean cheap price differs across product categories.
H5cMean reference price * differs across product categories.
H5dMean expensive price differs across product categories.
H5eMean too expensive price differs across product categories.
H5fMean APR differs across product categories.
Business modelH6aMean too cheap price differs between business models.
H6bMean cheap price differs between business models.
H6cMean reference price * differs between business models.
H6dMean expensive price differs between business models.
H6eMean too expensive price differs between business models.
H6fMean APR differs between business models.
* Reference price = {(Cheap price) + (Expensive price)}/2.
Table 5. Survey questionnaire.
Survey Questions
AssumptionSuppose that you decided to buy/rent this product, either the new one or the remanufactured one. Both versions have the same function, appearance and warranty. The new product price is ____________.
NP
  • Do you think the remanufactured one is necessarily cheaper than the new one? (yes or no)
  • If so, what are the reasons? Choose from below (multiple answers are allowed):
    (1)
    Performance: The performance of the remanufactured product is likely to be worse than that of the new one. (It is hard to believe that the performance of the new and the remanufactured products are the same.)
    (2)
    Breakdown: The remanufactured product is likely to break faster. (It is hard to believe that the reliability of the new and the remanufactured products are the same.)
    (3)
    Emotional discomfort: It is unpleasant because others used the product.
    (4)
    Others: ______________________________________________
PIIf the price is attractive and appropriate, are you willing to choose the remanufactured one, rather than the new one? (yes or no)
APsOnly the respondents who answered yes to the above PI question responded to these questions below.
  • [Too cheap price] At what price are you beginning to experience the product as “too cheap”?so that you say, “at this price the quality cannot be good”?
  • [Cheap price] At what price are you beginning to experience the remanufactured product as “cheap”?
  • [Expensive price] At what price are you beginning to experience the product as “expensive”?
  • [Too expensive price] At what price are you beginning to experience the remanufactured product as “too expensive”?so that you would never consider buying it?
Table 6. Valid data from the survey.
Product CategoryTotalQuestions on APs
BuyingRentalBuyingRental
Low-end laptops94947667
High-end laptops93936770
Smartphones94936556
Gaming consoles93937677
Printers94947583
Water purifiers94944562
Table 7. Percentage proportion of NP and the chi-square test results.
Low-end LaptopsHigh-end LaptopsSmartphonesGaming ConsolesPrintersWater Purifiersp-Value 1)
Buying99%97%97%92%94%97%N/A
Rental90%91%91%81%74%84%0.003 **
p-value 2)0.0970.020 *0.007 **0.003 **0.003 **0.003 **
* p < 0.05, ** p < 0.01. 1) Chi-square test among the product categories; 2) Chi-square test between the business models.
Table 8. Fisher’s exact test results for NP difference across the product categories: the buying model.
Low-end LaptopsHigh-end LaptopsSmartphonesGaming ConsolesPrintersWater Purifiers
Low-end laptops
High-end laptops0.033 *
Smartphones0.032 *0.098
Gaming consoles0.0750.007 **0.014 *
Printers0.0650.011 *0.1830.048 *
Water purifiers0.033 *0.0670.0960.011 *0.156
* p < 0.05, ** p < 0.01.
Table 9. Reasons for NP under the buying model: percentage of NP citing each factor.
Product CategoryPerformanceBreakdownDiscomfortOthers
Low-end laptops46%41%69%8%
High-end laptops54%42%59%5%
Smartphones51%52%63%6%
Gaming consoles48%46%47%5%
Printers51%57%33%5%
Water purifiers33%30%81%3%
Category average47%45%59%5%
Table 10. Reasons for NP under the rental model: percentage of NP citing each factor.
Product CategoryPerformanceBreakdownDiscomfortOthers
Low-end laptops55%39%47%5%
High-end laptops63%41%41%4%
Smartphones52%45%52%6%
Gaming consoles41%47%41%7%
Printers56%53%40%3%
Water purifiers49%36%68%4%
Category average53%43%48%5%
Table 11. Percentage proportion of PI and chi-squared test results.
Low-end LaptopsHigh-end LaptopsSmartphonesGaming ConsolesPrintersWater Purifiersp-Value 1)
Buying84%75%71%84%84%49%0.000 ***
Rental76%78%61%87%93%70%0.000 ***
p-value 2)0.046 *0.001 ***0.002 **0.000 ***0.0780.000 ***
* p < 0.05, ** p < 0.01, *** p < 0.001. 1) Chi-square test among the product categories; 2) Chi-square test between the business models.
Table 12. PI in buying * PI in rental cross-tabulation.
Buying/Rental 1)Low-end LaptopsHigh-end LaptopsSmartphonesGaming ConsolesPrintersWater Purifiers
YesYes67%66%52%78%80%44%
YesNo17%10%20%5%4%5%
NoYes9%12%10%9%13%27%
NoNo7%12%18%8%3%25%
1) PI in buying/PI in rental: “Yes/Yes” means that the proportion has PI for both business models.
Table 13. Mean APs and the difference across the product categories: buying model.
Product CategoryToo CheapCheapReferenceExpensiveToo ExpensiveAPR
Low-end laptops45%60%67%74%85%40%
High-end laptops49%62%69%76%83%35%
Smartphones40%55%63%71%80%40%
Gaming consoles35%54%63%73%84%49%
Printers34%53%63%72%82%48%
Water purifiers42%56%64%72%83%41%
Category average41%57%65%73%83%42%
Levene’s test p-value0.3760.1880.3320.1450.6480.335
ANOVA p-value0.000 ***0.005 **0.5870.0960.7250.000 ***
** p < 0.01, *** p < 0.001.
Table 14. Scheffe’s test results: post-hoc ANOVA of APs under the buying model.
Product PairingToo CheapCheapAPR
Mean Diff.p-ValueMean Diff.p-ValueMean Diff.p-Value
High-end laptops–Low-end laptops0.0370.9190.0240.982−0.0510.747
Smartphones–Low-end laptops−0.0470.813−0.0500.6980.0021.000
Gaming consoles–Low-end laptops−0.0990.060−0.0630.3940.0940.087
Printers–Low-end laptops−0.1050.038 *−0.0690.2790.0820.208
Water purifiers–Low-end laptops−0.0280.985−0.0370.9270.0101.000
Smartphones–High-end laptops−0.0850.237−0.0740.2870.0530.751
Gaming consoles–High-end laptops−0.1360.002 **−0.0870.1000.1460.001 ***
Printers–High-end laptops−0.1420.001 ***−0.0930.0600.1330.003 **
Water purifiers–High-end laptops−0.0660.642−0.0610.6220.0620.711
Gaming consoles–Smartphones−0.0520.748−0.0130.9990.0930.128
Printers–Smartphones−0.0580.651−0.0200.9930.0800.274
Water purifiers–Smartphones0.0190.9980.0121.0000.0081.000
Printers–Gaming consoles−0.0061.000−0.0071.000−0.0130.999
Water purifiers–Gaming consoles0.0700.5460.0250.986−0.0840.335
Water purifiers–Printers0.0760.4530.0320.962−0.0710.533
* p < 0.05, ** p < 0.01, *** p < 0.001.
Table 15. Mean APs and the difference across the product categories: rental model.
Product CategoryToo CheapCheapReferenceExpensiveToo ExpensiveAPR
Low-end laptops31%51%61%71%89%58%
High-end laptops37%55%64%74%87%50%
Smartphones31%50%62%74%90%59%
Gaming consoles33%51%63%75%98%65%
Printers32%51%63%75%89%57%
Water purifiers33%52%65%77%93%60%
Category average33%52%63%74%91%58%
Levene’s test p-value0.1420.1920.4120.4160.4320.305
ANOVA p-value0.2530.6010.7980.8420.4410.271
Table 16. Differences in mean APs between the business models: t-test results (p-value).
Product CategoryToo CheapCheapReferenceExpensiveToo ExpensiveAPR
Low-end laptops0.000 ***0.001 **0.026 *0.3680.2760.000 ***
High-end laptops0.001 ***0.009 **0.0810.5150.3050.000 ***
Smartphones0.001 ***0.046 *0.6310.3350.018 *0.000 ***
Gaming consoles0.5760.2950.8240.6890.032 *0.021 *
Printers0.4280.4740.8800.3280.045 *0.012 *
Water purifiers0.008 **0.2550.9040.2480.0770.001 ***
* p < 0.05, ** p < 0.01, *** p < 0.001.
Table 17. Hypotheses test results.
HypothesesResults
H1NP differs across product categories.Supported
H2NP differs between business models.Partially supported
H3PI differs across product categories.Supported
H4PI differs between business models.Partially supported
H5aMean too cheap price differs across product categories.Supported only in buying
H5bMean cheap price differs across product categories.Supported only in buying
H5cMean reference price differs across product categories.Rejected
H5dMean expensive price differs across product categories.Rejected
H5eMean too expensive price differs across product categories.Rejected
H5fMean APR differs across product categories.Supported only in buying
H6aMean too cheap price differs between business models.Partially supported
H6bMean cheap price differs between business models.Partially supported
H6cMean reference price differs between business models.Partially supported
H6dMean expensive price differs between business models.Rejected
H6eMean too expensive price differs between business models.Partially supported
H6fMean APR differs between business models.Supported