Article

Why Does a High Humidity Level Form in Low-Income Households Despite Low Water Vapor Generation?

1
Center for Built Environment, Sungkyunkwan University, 2066 Seobu-ro, Jangan-gu, Suwon 16419, Korea
2
Samsung C&T Co., DS-Retrofit, Samsung SDS Tower, Seoul 53302, Korea
3
Department of Architectural Eng., Sungkyunkwan University, 2066 Seobu-ro, Jangan-gu, Suwon 16419, Korea
*
Author to whom correspondence should be addressed.
Sustainability 2020, 12(18), 7563; https://doi.org/10.3390/su12187563
Submission received: 23 August 2020 / Revised: 10 September 2020 / Accepted: 10 September 2020 / Published: 14 September 2020

Abstract

:
This study uses long-term field measurements to quantify the indoor humidity generation rates of low-income households vulnerable to condensation and related problems. We found that the mean internal moisture excess of low-income households in Korea was 4.69 g/m3 higher than those of prior studies. Indoor water vapor generation rates of various activities considering the life style of low-income households were also quantified. The moisture generation rates of the shower and bath were 125.3 g/event and 51.1 g/event, respectively, and showed a similar or lower value compared to the existing results. The moisture generation rate of cooking showed the largest difference due to the residential characteristics of low-income households, such as cooking less frequently due to meal delivery services from the welfare center and the lower number of residents per household. Even though the moisture generation rates of low-income households for certain activities showed lower values compared to the results of prior studies, the indoor conditions were very humid due to the lower ventilation rates and studio-type open floor plan.

1. Introduction

Humidity is an important parameter to occupants’ thermal comfort and indoor air quality (IAQ) [1]. High humidity can lead to condensation problems, and condensed water may damage the building structure and finishing materials [2,3,4,5,6,7]. Additionally, condensation in buildings may cause mold growth and dust mites, which increase the risk of health effects such as asthma, allergies, and respiratory discomfort [8,9,10,11]. Surface condensation occurs when the air humidity ratio near the surface is greater than or equal to the saturated humidity ratio of the surface temperature [12,13,14]. The surface temperature or insulation level of the building envelope and generation of indoor water vapor are related to surface condensation in buildings [15]. Many efforts have been made in building codes to prevent condensation in buildings. The concept of the Temperature Difference Ratio (TDR) is widely adapted to regulate the total thermal resistance of the building envelope [16,17,18,19,20,21,22,23,24]. Condensation problems are still reported even though building envelopes are designed to satisfy the criteria of the TDR. However, damage due to condensation and mold account for 16% of disputes in Korean multi-family residential buildings [25].
Among the various types of dwelling, condensation problems are most frequently reported in low-income households [26]. People living in low-income housing include many socially disadvantaged people, such as the elderly and the disabled. Many of these people experience fuel poverty, wherein expenditure on energy services, particularly warmth, exceeds 10% of the total income [27]. Many residents of low-income households find it fairly or very difficult to pay bills to keep their homes warm or cool [28]. Therefore, the indoor temperature of low-income dwellings rarely satisfies the minimum temperature of 21 °C needed to avoid negative health impacts during winter [29,30]. Tadj et al. studied 1082 low-income households in England to determine the heating characteristics of low-income households. The average winter temperature of the living room and bedroom were 19 °C and 18 °C, respectively, both lower than 21 °C [31]. Song et al. conducted field measurements in the winter season on 504 rooms and 330 households of low-income detached dwellings in Korea [30]. They found that about 95.2% of the main living rooms did not meet the 18 °C WHO threshold for adequate warmth. Additionally, people living in low-income residences rarely ventilate rooms to retain heat indoors. Lack of heating and ventilation leads to low indoor temperature and high indoor humidity, which causes the condensation problem [28,30,31].
Deterioration of insulation and airtightness due to the aging of buildings may cause a decrease in indoor surface temperature and an increase of condensation on indoor surfaces. According to Korea’s 2018 Population and Housing Census, Korea has 16.7 million households, of which 2.8 million older homes are more than 30 years old, accounting for 16.8% of the total. In particular, low-income people are more likely to be living in old buildings with poor envelope conditions [32]. 67.7% of the lowest income quartiles in Korea live in older homes built before 1995 [33]. Figure 1 shows the actual scene of the condensation problem, including the mold formation in aged low-income households in Korea.
Most negative health effects in residential buildings are associated with high levels of humidity, rather than low levels. This is due to the strong association between high humidity and mold and dust mites. Several studies have found an association between damp housing and respiratory disease, particularly wheezing, in children [34,35], and there is an association between asthma and sensitivity to allergens from molds [36]. Many low-income households are prone to cold and damp. Living in cold, damp houses affects people’s health. Therefore, condensation problems are a matter of life and death in low-income households.
Many researchers have measured and evaluated amounts of water generation to solve the problems associated with moisture, but research on the evaluation of moisture levels and the quantification of moisture generating activities is insufficient in low-income households. Tadj et al. quantified mold problems in low-income households in England with visual inspections, but they did not quantify the moisture generation rate or the humidity load [37]. People who live in low-income housing, such as older retired people, the long-term sick, unemployed people, and families with young children, are likely to be at home all day. This provides the possibility for more moisture generating activities indoors than in homes where the inhabitants spend more time in the workplace or educational establishments.
The absence of studies on the generation of moisture in low-income houses has hampered the study of the ill health of low-income residents who are vulnerable to exposure to dampness.
The final goal of this study is to suggest appropriate solutions to control indoor humidity levels, thus prohibiting condensation, mold growth, and, ultimately, health problems in low-income households. For this purpose, the humidity levels of low-income households were analyzed by long-term field measurement. Moreover, water vapor generation rates by activity were analyzed by controlled field measurement.
This paper is structured as follows. In Section 2, the literature review of conventional studies of indoor humidity excess and water vapor generation by activity is accomplished. In Section 3, the configurations of long-term field measurements and controlled measurements for low-income households are described. In Section 4, the field measurement results are described, and finally the discussion and conclusion are presented.

2. Literature Review

A common way of expressing the indoor air humidity load is by the internal moisture excess. The internal moisture excess dependence on outdoor temperature is defined as a daily, weekly, or monthly basis overall value, and this can be used to quantify the indoor humidity level and compare it with the classified grade in standards [24,38,39,40]. The design curve of moisture excess is suitable for steady-state calculations and detailed dynamic simulations for cases with no humidification in dwellings. However, this method cannot consider the time-dependent variation of moisture production through the day. To quantify the internal moisture level considering the variation in actual conditions, not only should the overall concept of moisture excess be investigated, the moisture generation rate by activity should be too.

2.1. Indoor Humidity Levels

The indoor humidity level can be quantified with the internal moisture excess, defined as Equation (1). The water vapor content can be calculated based on the measured temperature and relative humidity using Equation (2). The internal moisture excess is also governed by the ventilation rate and indoor/outdoor air water vapor content.
Δ v = w i w e = G n · V
w = RH · p v , sat ( θ ) R w · ( θ + 273.15 )
here, Δ w is the internal moisture excess (kg/m3), w i is the indoor air water vapor content (kg/m3), w e is the outdoor air water vapor content (kg/m3), G is the internal moisture production rate (kg/h), n is the air change rate (h−1), and V is the internal volume of the building (m3). RH is the relative humidity (%), p v , sat is the saturated vapor pressure (pa), θ is temperature (°C), and R w is the specific gas constant for water vapor, 461.5 (J/kg · K).
The internal moisture excess is often used instead of relative humidity (RH) when the RH is not controlled but allowed to undergo wide variations due to several factors such as weather conditions, building characteristics, moisture generation, and ventilation [41]. Therefore, applying the internal moisture excess is a method for comparing the indoor humidity level with conventional studies.
Previous studies of indoor humidity load are shown in Table 1. Most of the studies were conducted in Europe. These results are mainly for the general dwelling, and the results for low-income households have not been reported. The average moisture excess in cold weather is quite similar, around 2 g/m3. The moisture supply in warm outdoor conditions is somewhat lower than the winter season. During the warm period, the air change rate is higher, windows and doors are more frequently opened, and the smaller moisture production decreases the moisture supply [42]. Additionally, the variation of the results in the same country can be explained by the difference in the airtightness or infiltration rate, ventilation rate, and the ventilation method in a building.

2.2. Moisture Generation Rate by Various Activities

Research associated with moisture generation rates for various indoor activities has been listed in Table 2. In this table, the original moisture generation data and the data cited are listed together. While arranging the values, it was possible to identify the chronic problems associated with moisture generation data. Hite and Bray (1949) conducted a study of common moisture sources in houses, and the data have been cited widely ever since [48,49]. Unfortunately, over time, errors due to unit conversions crept in, and some of the data cited (e.g., in Angell and Olson (1988) and Christian (1993)) are about 10% higher than the original data reported by Hite and Bray (1949) [50,51]. Additionally, most of the conventional studies are the result of research conducted a long time ago that does reflect the lifestyle of people living in the present day.
Moisture generation rates are 113–600 g/shower, 50–174 g/bath, 535–5174 g/day for cooking and 1100–11,970 g/day for laundry drying [13,17,48,49,50,52,53,54,55,56,57,58,59,60,61,62]. Data variation on the residential moisture generation rate reported in the literature is very wide. This is because measurements were taken under different conditions and climates and in different building construction types, and the studies may or may not include the effects of seasonal moisture storage [51].
In the case of showering, moisture generation can be changed by the finishing materials on the wall, duration of the shower [63], water temperature and thickness of water stream, ventilation and length of opening door, etc. The average showering duration was reported at 15 min. Hite and Bray (1949) reported that an “average” shower contributes between 113 and 226 g of water vapor, but they report great variability depending on a number of factors. They did not report the duration of showering, although later authors (Angell and Olson 1988) claimed that this amount applies to a five-minute shower [49,51].
Table 2. Moisture generation rate found from conventional studies.
Source of Moisture Moisture Generation RateReferenceNationality
CookingAll day 3000 g/day (gas)
2000 g/day (elec)
bs5250(2011) [17]UK
600–1500 g/hBley (1983) [13,52]Germany
5174 g/dayYik (2004) [53]China
3 meals2160 g/day (gas)
920 g/day (elec)
Hansen(1984) [54]Canada
900–3000 g/dayCIBSE (2006) [55]UK
535 g/day (gas)
209 g/day (elec)
Atsushi (2019) [56]Japan
957 g/dayRousseau(1984) [57]Canada
Breakfast408 gHite and Bray (1949) [48]America
450 g (gas)
170 g (elec)
Angell and Olson (1988) [49,50,58,62]America
468 gWatanabe (1965) [59]Japan
257 gYik (2004) [53]China
Lunch530 gHite and Bray (1949) [48]USA
570 g (gas)
250 g (elec)
Angell and Olson (1988) [49,50,58,62]USA
159 gWatanabe (1965) [59]Japan
948 gYik (2004) [53]China
Dinner1220 gHite and Bray (1949) [48]USA
1330 g (gas)
580 g (elec)
Angell and Olson (1988) [49,50,58,62]USA
3859 gYik (2004) [53]China
946 gWatanabe (1965) [59]Japan
BathingShower600 g/15 min showerbs5250 (2011) [17]UK
230 g/showerHansen (1984) [54]Canada
304 g/showerRousseau (1984) [57]Canada
113–226 g/showerHite and Bray (1949) [48]USA
250 g/5 min showerAngell and Olson (1988) [49,50,58,62]USA
2600 g/hSchmittlutz (1975) [13,60]Germany
530 g/18 min showerYik (2004) [53]China
Tub50 g/bathHansen (1984) [54]Canada
174 g/bathRousseau (1984) [57]Canada
700 g/hSchmittlutz (1975) [13,60]Germany
54 g/bathHite and Bray (1949) [48]USA
60 g/bathAngell and Olson (1988) [49,50,58,62]USA
Drying clothesUnvented dryer1500 g/daybs5250 (2011) [17]UK
11,970 g/dayHansen (1984) [54]Canada
Indoor drying 50–200 g/h (spin dried),
100–500 g/h (dripping wet)
Erhorn (1986) [13,61]Germany
1,1974 g/dayHite and Bray (1949)USA
2200–2920 g/loadAngell and Olson (1988) [49,50,58,62]USA
2000–5000 g/dayCIBSE (2006) [55]UK
1740 g/dayRousseau (1984) [57]Canada
1666 g/dayYik (2004) [53]China
1100 g/person per dayAtsushi (2019) [56]Japan
Laundry is rarely dried inside anymore in Western countries, as most households now use clothes dryers that are vented to the outside, or laundry is dried outside. Therefore most of the researchers in Western countries ignore the contribution from clothes drying, and the amount of data related to laundry drying indoors is relatively small. However, in dwellings in cold Asian countries, such as Korea, indoor moisture generation associated with clothes drying could be crucial because laundry is dried in the living room.
In the case of cooking, it is not clear how previous research defines cooking. In particular, moisture generation rate by cooking may have a strong influence on the humidity level in residential buildings. The characteristics of water vapor generation between countries can be confirmed in the cooking results. In the case of China, the wok is used for boiling, frying, and steaming, and the water vapor generation rate is higher than the results of Western countries. In addition, all existing cooking and laundry drying results are based on four-family houses. Therefore, further analysis is required for single occupancy conditions in low-income households.
In the case of showering, it is difficult to compare the results directly because the showering time and the conditions are different. However, the differences between the countries do not seem to be great.
In the case of laundry drying, the results of the Orient (Japan and China) appear to be lower than those of the West. However, due to the chronic problem of not knowing under what conditions the results were tested, the reason for this cannot be determined.
The results related to the moisture generation rate were obtained 30 to 60 years ago in Western countries such as Europe and the United States. However, the indoor humidity generation characteristics may vary depending on residential characteristics or lifestyle. It is necessary to secure data on the moisture generation rate considering the residential characteristics and type of residents.

3. Field Measurements

Long-term field measurements and controlled field measurements were carried out to measure the overall indoor moisture excess and water vapor generation rate associated with activities in low-income households in Korea. The target households have a floor area of 21.78 m2, the smallest area supplied by the Korean government, and are located in Gyeonggi-do, Korea. As shown in Figure 2, the target household was composed of a 10.53 m2 bedroom and living room and a 10.73 m2 kitchen and utility space. This is the prototype design of Korean public rental housing for low-income households. Mechanical ventilation was not installed in low-income households due to construction cost issues.

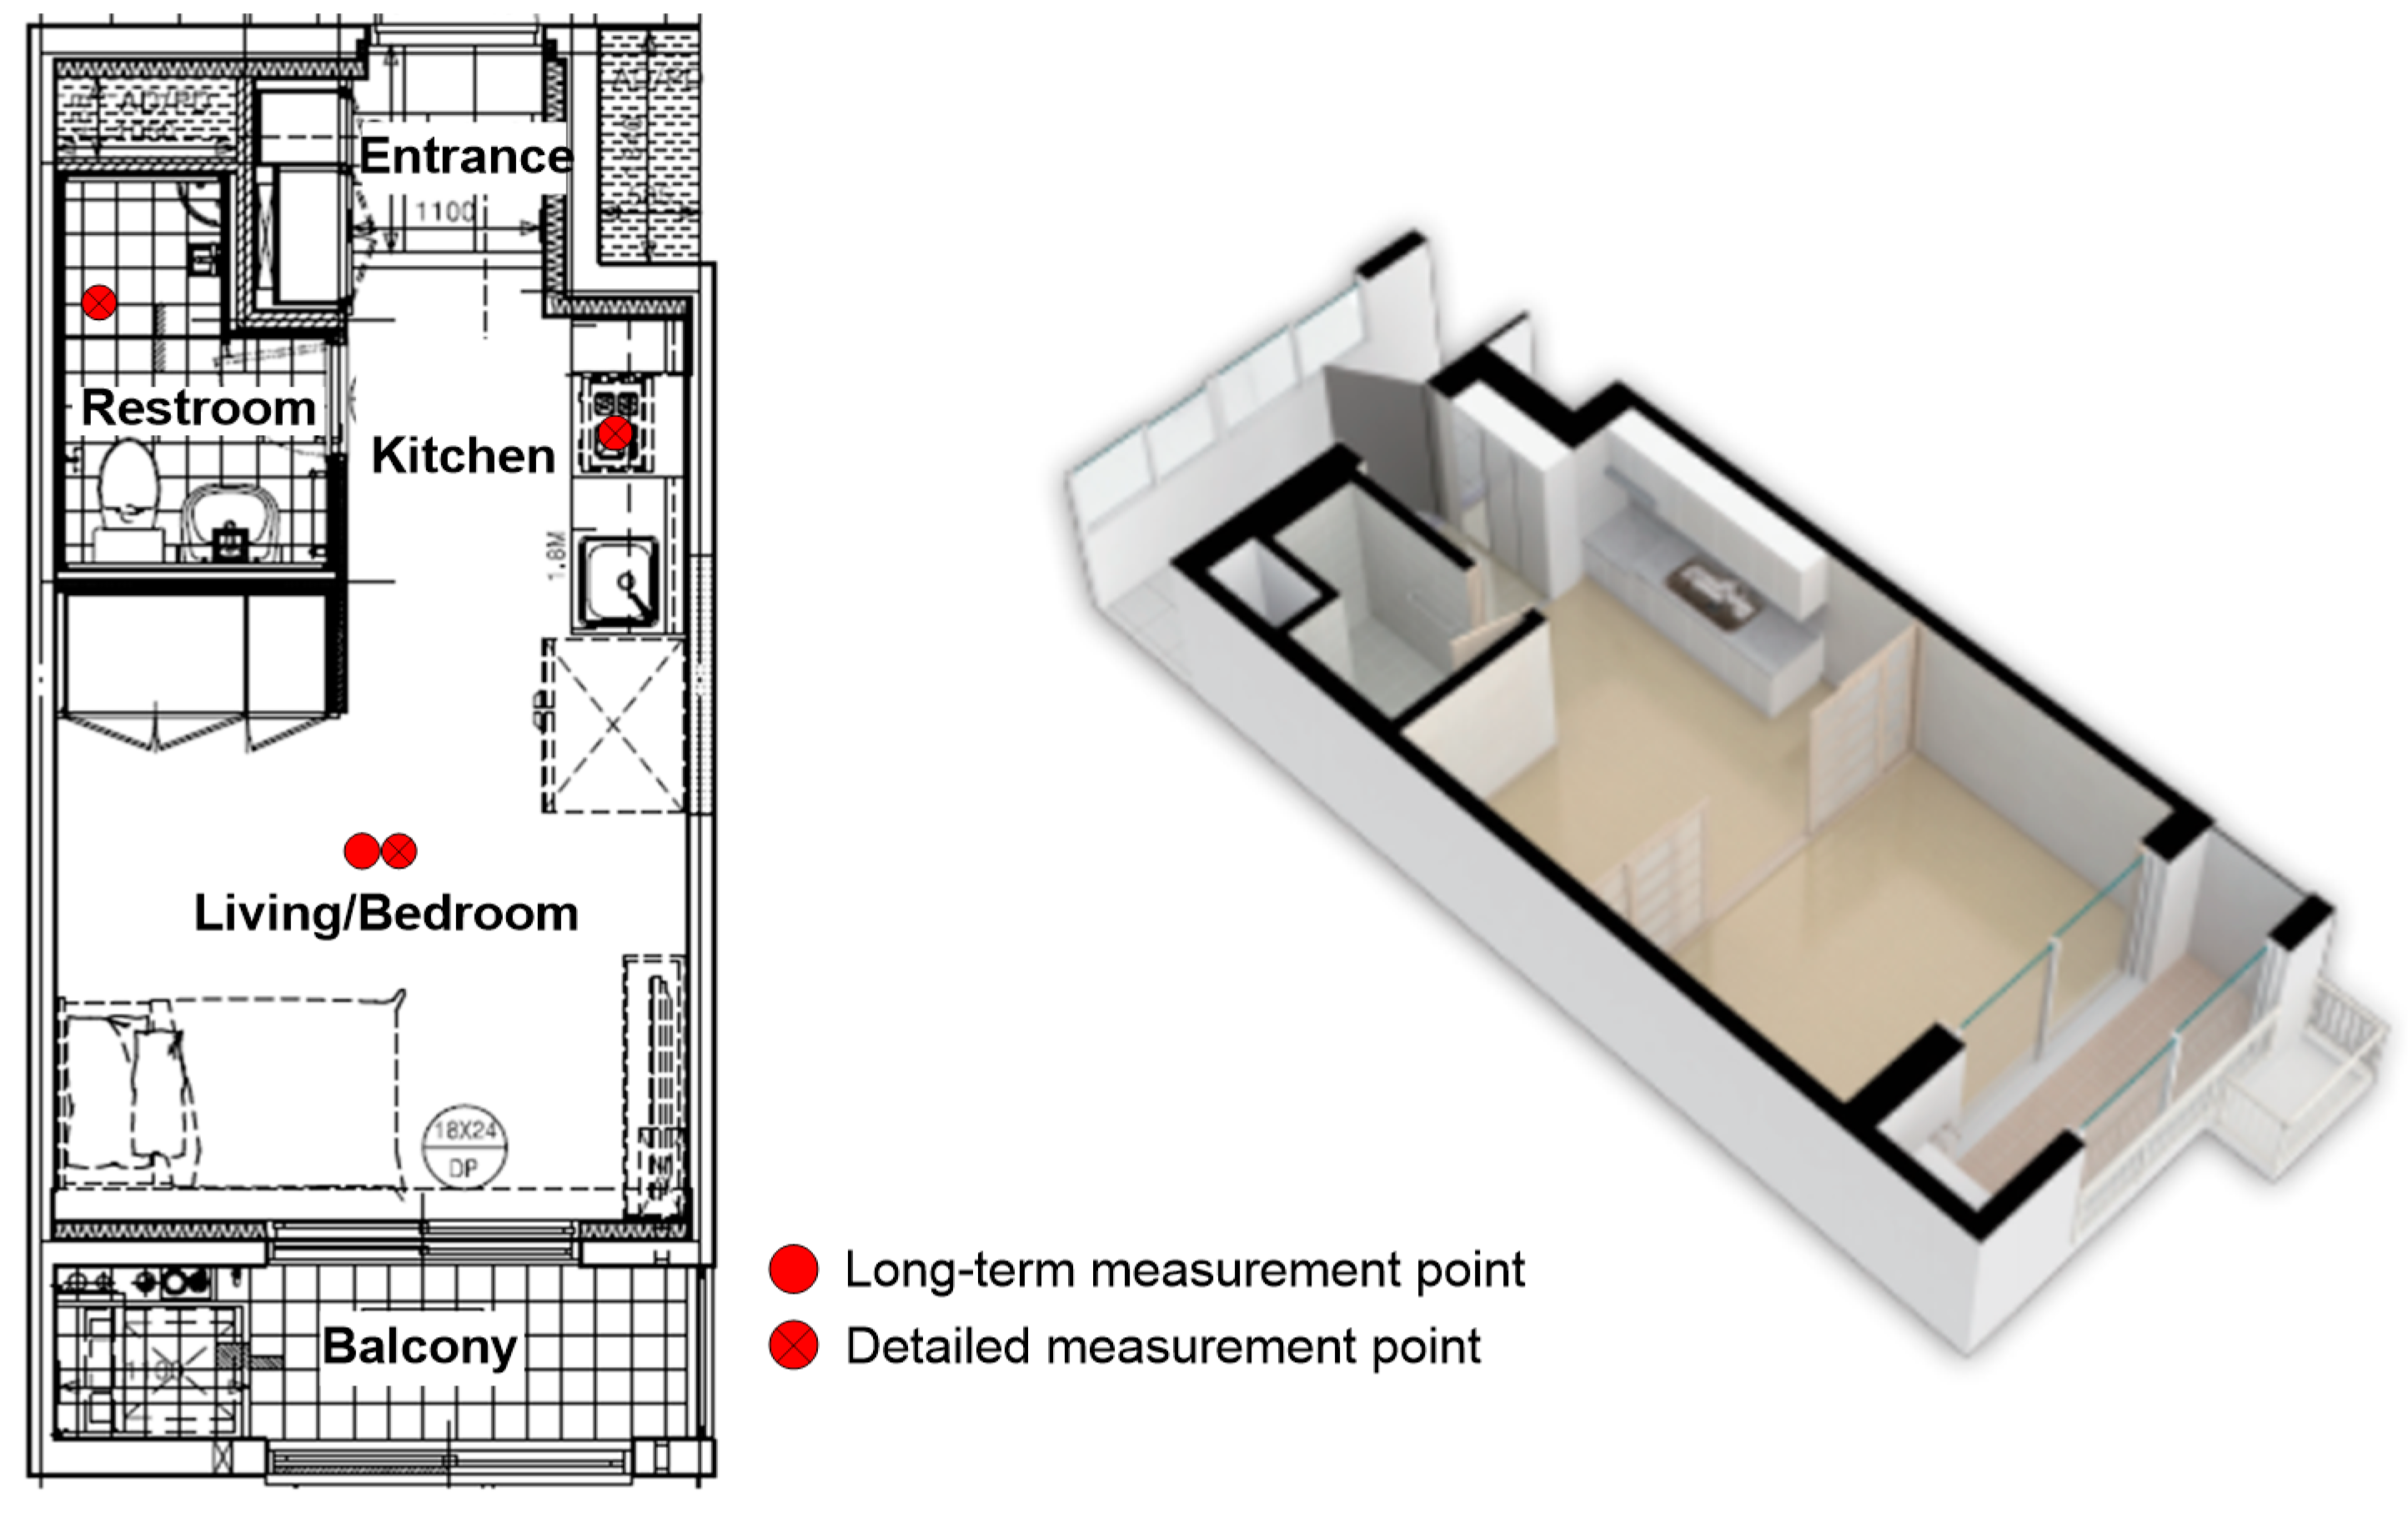
3.1. Long-Term Field Measurements

Long term field measurements to assess the internal moisture excess were conducted during a two-month period, from January to February 2019. With the consent of the residents, 17 households in a low-income public rental housing complex were selected randomly, and measurements in all units were conducted during the same period. Among the 17 households, 7 units were newly built in 2013, and the remaining 10 units were constructed 27 years ago. Indoor and outdoor temperature and relative humidity (RH) were measured at 15 min intervals. A portable data-logger (Testo175H1) capable of simultaneously recording the indoor/outdoor air temperature and relative humidity was used. The loggers were positioned away from locations subject to dramatic temperature changes, such as nearby windows, outdoor, direct sunlight, and heating units, and installed on the 1100 mm level. The accuracies of the instrument were ±0.4 °C and ±2% RH. The internal moisture excess was calculated on an hourly basis. The airtightness performance was measured through short-term measurement by selecting representative households for each construction age. The tracer gas decay method was adopted, and a portable data-logger (TandD TR-76Ui) was used to measure the indoor/outdoor CO2 concentration. The accuracy of the instrument was ±50 ppm in the range of 0–9999 ppm.

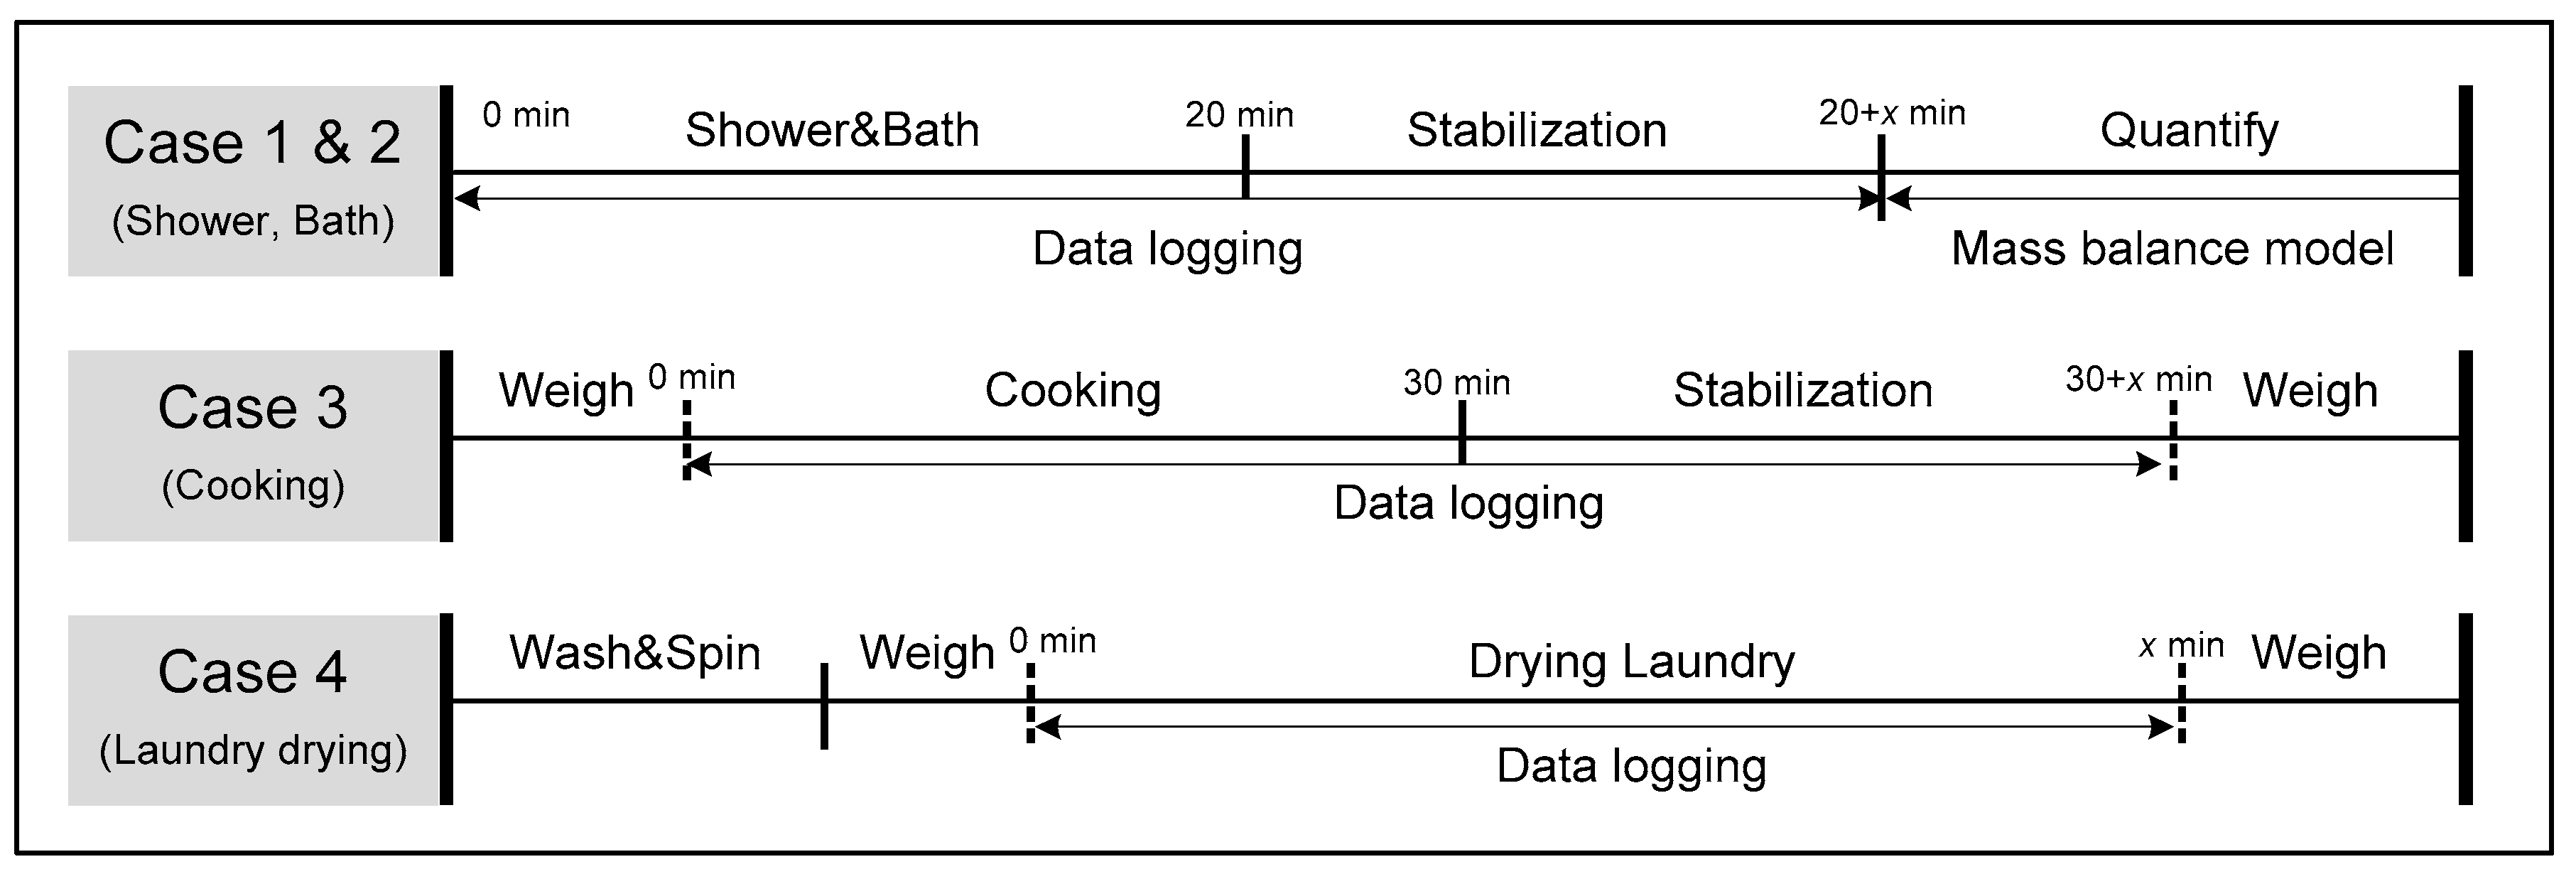
3.2. Controlled Field Measurements

The moisture generation rates associated with various activities were measured through the controlled field measurement. The four activities with the highest moisture generation in low-income housing were selected based on the results of the long-term field measurement in Section 3.1. High humidity is generated in low-income households in Korea by showering, bathing, cooking, and clothes drying. Two methods were used to quantify the amount of moisture generation by the activities. The weight loss of the sources for cooking and drying laundry was measured, and the moisture generation rates for showering and bathing were calculated based on the measured temperature and humidity. Air temperature and humidity were measured at a one-minute interval. The accuracy of the electronic scale (AND-FG-20KBM-H) was 0.25 g. All doors were closed and exhaust fans in the bathroom were not operated in order to accurately measure the water vapor generation rate for each activity. The procedures used to measure and quantify each case are illustrated briefly in Figure 3.

3.2.1. Bathing and Showering

The experiments related to showering and bathing were each conducted five times, and the measurements were continued until the humidity level in the bathroom reached a constant level. The durations of a shower and a bath were about 20 min each, based on the Lifestyle Survey Report in Korea [61,62,63].
One of the difficulties of obtaining the total vapor produced in showering is that condensation of water on cold surfaces such as windows and walls occurs. Therefore, the time of showering was fixed at 20 min, but the amount of water vapor generated was defined by measuring for a long time until the condensed water on the indoor surface disappeared, at which point the moisture generation rate is 0. Additionally, in the case of bathrooms in Korean dwellings, all walls are tiled, so the effect on moisture absorption can be neglected. It is also difficult to quantify the amount of water vapor production for showers and baths with a weight measurement method. Therefore, water vapor generation is estimated using the humidity changes in the bathroom, and water vapor generation rates are predicted using mathematical methods. Two mathematical methods used to calculate time-dependent moisture production rates were suggested by Lu and Shair [64,65]. However, several factors should be considered in the model proposed by Shair, such as the effects of mechanical ventilation, infiltration, vaporization from the shower water, and water vapor condensation onto and re-evaporation from the surface enclosing the bathroom [53,64,65]. Lu proposed a mathematical method based on a heat and moisture balance equation, and Equation (3) represents the moisture generation rate. In this study, the Lu model is applied to calculate the water vapor production rate in the bathroom.
In calculating the indoor moisture generation rate (G), moisture transfer rates between the building envelope and indoor air ( M i ) can be set to 0 as in prior studies [66]. Additionally, as it is a residential norm in Korea to have the bathroom finished with tiles, the absorption and desorption were not considered.
G V = d c i n d t n ( c o u t c i n ) M i V
here, c i n is the indoor water vapor content (kg/m3), c o u t is the outdoor water vapor content (kg/m3), G is the moisture generation rate (kg/s), M i is the sum of moisture transfer from envelope (kg/s), n is the ventilation rate (1/s), t is the duration (s), and V is the volume (m3).

3.2.2. Cooking

Generally, Korea has a unique culinary culture in which various side dishes are served with rice and soup. However, in the case of low-income households in Korea, free meal services for lunch are provided from the welfare center and cooking is usually done in the evening. A questionnaire survey of the analyzed households in this study showed that one soup is boiled when cooking. Kimchi and soybean-paste stew are popular in Korean, and about 1 L of water is used for stew cooking. In the cooking experiment, about 1 L of the cold water in the pot was boiled for 30 min to reproduce stew cooking. The weight of the pot before and after cooking was measured to determine the moisture generation while cooking. The cooking experiment was conducted twice.

3.2.3. Drying Clothes

When drying laundry, about 3 kg of laundry was dried in the living room. Laundry was considered complete when it felt fluffy. Further, the weight of the laundry was measured before and after drying, and this experiment was conducted twice.

3.3. Measurement Results

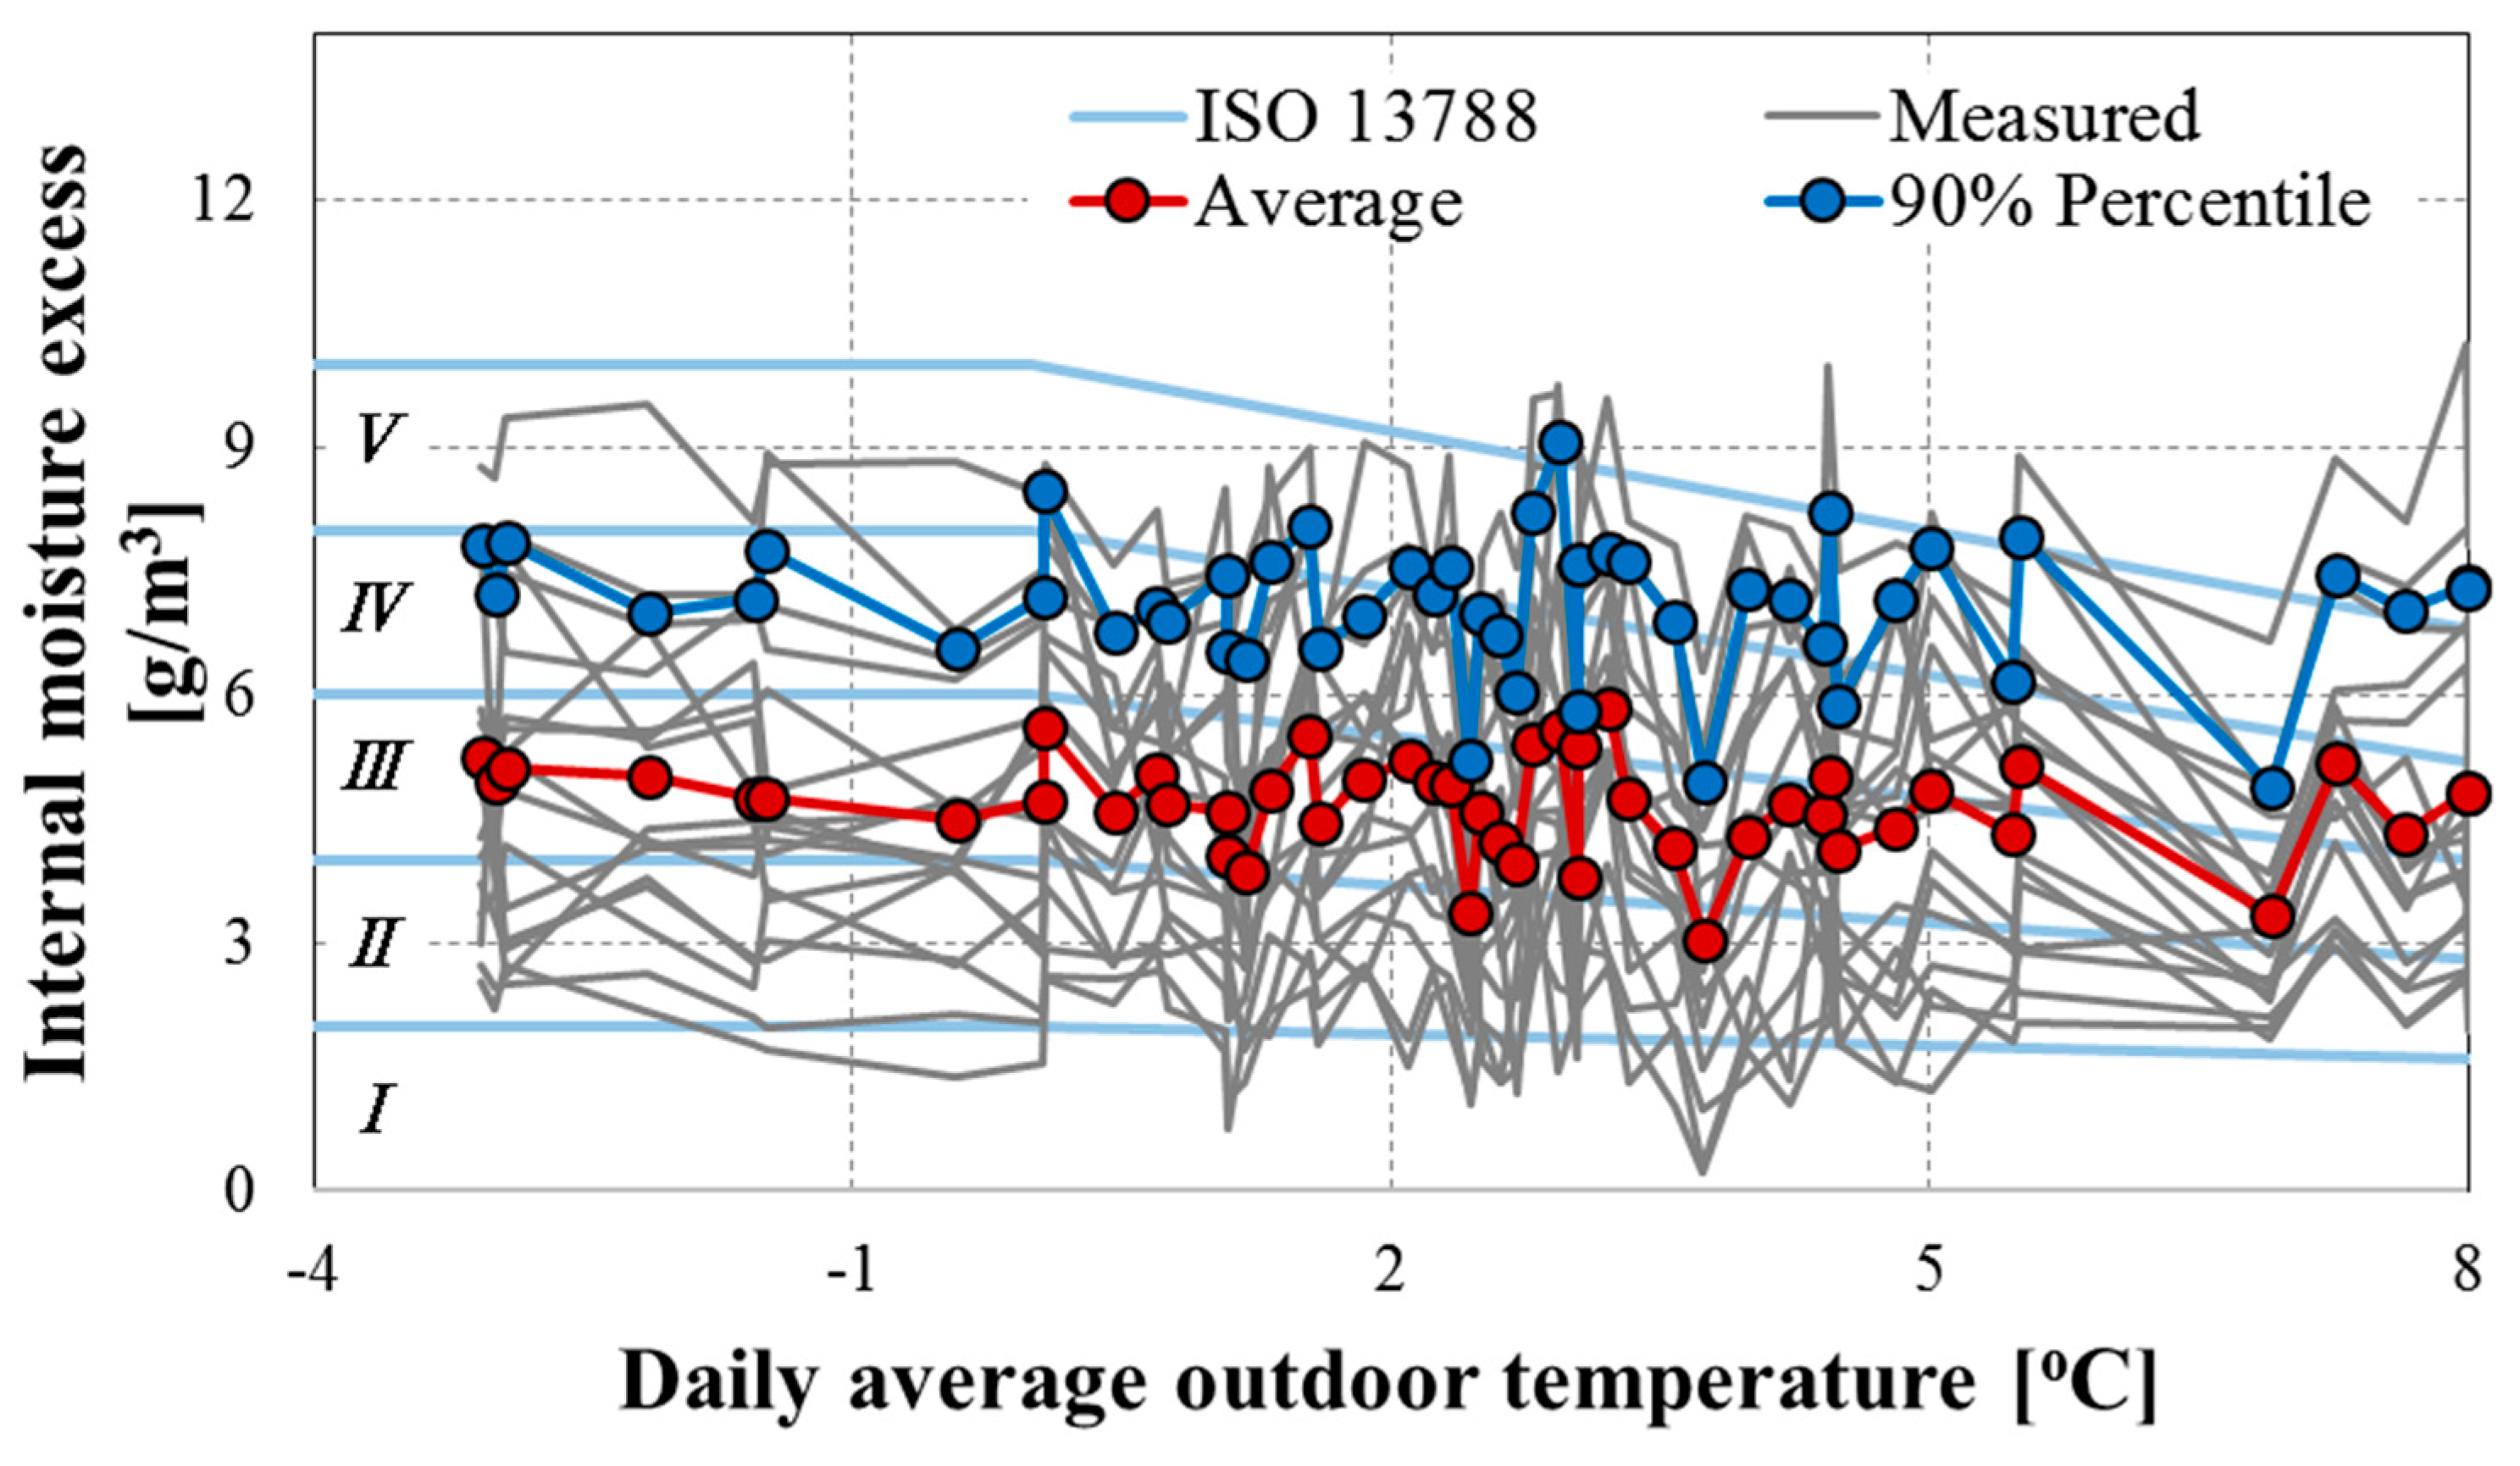
3.3.1. Assessment of Moisture Excess by Long-Term Measurement

The mean values of indoor moisture excess are given in Table 3. In Figure 4, the EN ISO 13,788 internal humidity class curves are given for comparison. In the whole measurement period, daily mean outdoor conditions were less than 8 °C. To compare with conventional studies, mean internal moisture excess was calculated when the outdoor air temperature is below 5 °C. The maximum number of occupants in the target households was three, due to the small area of low-income households. There was a slight increase in the internal moisture excess with the number of occupants. However, the moisture excess showed a strong relationship with the construction age. The infiltration rates of newly built and existing units were 0.1 ACH and 0.42 ACH, respectively. The internal moisture excesses of the newly built households were about 2.4 g/m3 greater than those of elderly households.
The average internal moisture excess of low-income households analyzed in this study was 4.69 g/m3, corresponding to class 3 in ISO 13,788, and the average value according to the outdoor temperature varied between class 2 and class 4. The average internal latent load of the low-income households of Korea showed a high level of water vapor generation, about twice that of European countries. Among the conventional studies, the moisture excess in the bathroom, which was the most humid space in buildings in Norway, was about 3.6 g/m3. This means that low-income living in Korea has the following characteristics: more indoor living activities and lower rates of ventilationThe absence of mechanical ventilation systems and the residents’ efforts to close openings to save on bills for heating were also a cause. The variation between analyzed houses was quite large, meaning that somewhat higher-than-average design values for hygrothermal calculations should be selected, assuming severe conditions for the occurrence of condensation. The International Energy Agency Annex 24 has recommended the use of the 10% critical level for climate loads when doing a hygrothermal simulation of the external envelope [41,67]. Therefore, a 90% level from the cumulative distribution function was compared with the EN ISO 13,788 standard humidity classes, following the method used in prior studies [41,67,68]. The higher 10% level from the cumulative results was 7.42 g/m3, corresponding to class 4, such as kitchens and canteens, and the 90% percentile value of internal moisture excess in Finnish dwellings was close to 4.0 g/m3.

3.3.2. Quantification of Moisture Generation Rates by Various Activities

  • Bathing and showering
Moisture generation rates for bathing and showering are summarized in Table 4 and Table 5. The amount of moisture generated by showering was about 125.3 g/event (358.1 g/h), while the moisture generation rate from bathing was about 51.1 g/event (153.2 g/h). Figure 5 illustrates the moisture generation rate during showering. During the first 5 min, the moisture generation rates increased rapidly and peaked, before decreasing for the last 15 min. Figure 6 shows the relative humidity changes in showering. The relative humidity of the bathroom increased rapidly for the first 5 min, peaked, and then kept constant for the last 15 min. This is because the water vapor inside the bathroom had already reached saturation in the 5 min after the generated water vapor was condensed to liquid water.
The water vapor generation during bathing is shown in Figure 7. The moisture generation rate associated with bathing did not show a particular trend and fluctuated differently than that from showering. Water molecules are diffused to the air from fine threads of flowing water in the case of showering, while the water evaporates and diffuses from the water surface on the tub during bathing. As a result, the water vapor slowly diffuses and the humidity does not reach saturation. However, moisture is generated steadily during bathing, and the relative humidity increases gradually (Figure 8). This result is similar to that of Hite and Bray(1948); one shower produces as much moisture as four regular baths [48].
The moisture generation rates for showering and bathing suggested by previous studies were 113–600 g/event and 48.4–174 g/event, respectively, and the ranges were very wide. The moisture generation rates deduced by this study were less than the results suggested by prior studies. Indoor moisture content could vary according to the preference and behavior of people, such as the selected water temperature and the duration of the shower or bath [69].
  • Cooking
The moisture generation rates during cooking were measured by the weight differences between the initial and final weights of the pot when the moisture production rate was zero about 1 h after cooking. The loss of the weight after cooking was 290.5 g/event, which can be converted to 871.5 g/day (for 3 meals) on average (Table 6). The moisture generation rates caused by cooking suggested by prior research are 535–5174 g/day. The generation rate deduced from this measurement is within the range of the prior studies but to a lesser degree. This is mainly because of the number of differences between the prior studies, which mostly had 4 persons per family, and this study, which had one or two persons in low-income households. Cooking methods and types of food also explain the difference.
  • Drying clothes
Moisture generation associated with laundry drying is shown in Table 7. To measure the moisture generation rates for laundry drying, the weight difference between the initial and final weights of laundries was measured. The moisture generation rate was 1643.6 g/event (173.6 g/h) on average. Among the prior studies for laundry drying, these results are similar to the results of Angell and Olson (1988), which showed vapor generation rates of 2200–2920 g/day [49]. Although showing similar results to the existing literature, the generation rate of this study shows a slightly lower amount of water vapor. This may have been influenced by technological improvements such as the spin of the washing machine [56]. Additionally, the results depend on the size of the load of laundry, mode of spin, and clothing fabric [69].

4. Discussion and Conclusions

The final goal of this study is to provide a solution to the indoor condensation problem of low-income households in Korea, where condensation occurs more frequently than in the general population. Prior to developing the solution, the reasons for condensation occurrence in low-income households were analyzed. This study quantifies the indoor humidity levels of low-income households by long-term field measurement. The water vapor generation rates by activity were analyzed by controlled field measurement. Field measurements were conducted in general public rental apartments for low-income households in Korea. Internal humidity levels were defined with the long-term field measurement. The average internal moisture excess of low-income households in Korea was 4.69 g/m3, and the internal latent load is higher than that of the Western countries. This result may be affected strongly by (1) the lack of ventilation due to the absence of mechanical ventilation systems and residents’ lifestyles; (2) the larger amount of indoor moisture-generating activities, such as drying laundry indoors; and (3) the open plan studio apartment.
The moisture generation rates of showering and bathing were 125.3 g/event and 51.1 g/event, respectively. Moreover, the moisture generation rates were about 290.5 g/event while cooking and 1643.6 g/event while drying laundry. Compared to the existing results, water vapor generation for all activities shows a lower value than the results presented in prior studies. Especially for cooking, compared with the conventional data, the generation rates deduced from this study show lower values, namely, about 244.5–4883.5 g/day. This is mainly because of the different numbers of occupants. In prior studies, the water vapor generation rates for cooking were mostly determined by four-person families; in this study, the occupants were mainly one- or two-person low-income households. Cooking methods and types of food also explain the differences. Moisture generation rates are influenced by other factors such as building construction type and the cultural differences of each country. It is necessary to prepare moisture generation rate data considering the cultural and residential environment characteristics of each country.
The solution for the condensation problem has been focused mainly on building performance, such as the thermal resistance and airtightness of the building. However, even though the moisture generation rate of low-income households by activities showed a lower value compared to the results of prior studies, the indoor conditions were very humid due to the lower ventilation rate and studio-type open plan. This also suggests that, rather than enhancing envelope performance, technology to control indoor humidity is needed to solve condensation in low-income rental apartments.
Therefore, the results of this study suggest that it is necessary to examine indoor humidity levels through long-term measurement as well as to measure the occurrence of humidity according to each activity when defining problems related to the over-humidification of low-income households. In particular, the importance of ventilation, which can be neglected in housing refurbishment projects for low-income households, is stressed.
The findings presented in this study could help experts in the simulation of hydrothermal analysis for low-income households. Further, this work could be extended for those who aim to make their own indoor moisture generation data or policy makers in low-income residential refurbishment projects.

Author Contributions

Conceptualization: D.S.; methodology: Y.C. and Y.L.; formal analysis: D.S., Y.C., and Y.L.; investigation: Y.C. and D.S.; resources and data curation: Y.C. and D.S.; writing—original draft preparation: Y.C.; writing—review and editing: Y.C., J.K., and D.S.; supervision: D.S.; funding acquisition, D.S. All authors have read and agreed to the published version of the manuscript.

Funding

This research was supported by a grant (20RERP-B082204-07) from the Residential Environment Research Program funded by the Ministry of Land, Infrastructure and Transport of the Korean government.

Conflicts of Interest

The authors declare no conflict of interest.

References

  1. Bluyssen, P.M. Towards an integrative approach of improving indoor air quality. Build. Environ. 2009, 44, 1980–1989. [Google Scholar] [CrossRef]
  2. Toftum, J.; Jørgensen, A.S.; Fanger, P. Upper limits for indoor air humidity to avoid uncomfortably humid skin. Energy Build. 1998, 28, 1–13. [Google Scholar] [CrossRef]
  3. Toftum, J.; Jørgensen, A.S.; Fanger, P. Upper limits of air humidity for preventing warm respiratory discomfort. Energy Build. 1998, 28, 15–23. [Google Scholar] [CrossRef]
  4. American Society of Heating, Refrigerating and Air-Conditioning Engineers. 2013 ASHRAE Handbook: Fundamentals; American Society of Heating, Refrigerating and Air-Conditioning Engineers Inc.: Peachtree Corners, GA, USA, 2013. [Google Scholar]
  5. Fang, L.; Clausen, G.; Fanger, P.O. Impact of temperature and humidity on chemical and sensory emissions from building materials. Indoor Air 1999, 9, 193–201. [Google Scholar] [CrossRef]
  6. Simonson, C.J.; Salonvaara, M.; Ojanen, T. The effect of structures on indoor humidity—Possibility to improve comfort and perceived air quality. Indoor Air 2002, 12, 243–251. [Google Scholar] [CrossRef]
  7. Kitagawa, K.; Komoda, N.; Hayano, H.; Tanabe, S.-I. Effect of humidity and small air movement on thermal comfort under a radiant cooling ceiling by subjective experiments. Energy Build. 1999, 30, 185–193. [Google Scholar] [CrossRef]
  8. Choi, J.; Chun, C.; Sun, Y.; Choi, Y.; Kwon, S.; Bornehag, C.-G.; Sundell, J. Associations between building characteristics and children’s allergic symptoms—A cross-sectional study on child’s health and home in Seoul, South Korea. Build. Environ. 2014, 75, 176–181. [Google Scholar] [CrossRef]
  9. Fisk, W.J.; Mendell, M.J.; Lei-Gomez, Q. Meta-analyses of the associations of respiratory health effects with dampness and mold in homes. Indoor Air 2007, 17, 284–296. [Google Scholar] [CrossRef]
  10. Kelly, K.M. Indoor moisture: Effects on structure, comfort, energy consumption, and health. In Proceedings of the ASHRAE/DOE Conference Thermal Performance of the Exterior Envelope of Buildings, Las Vegas, NV, USA, 6–9 December 1982; pp. 1007–1032. [Google Scholar]
  11. Bornehag, C.-G.; Sundell, J.; Bonini, S.; Custovic, A.; Malmberg, P.; Skerfving, S.; Sigsgaard, T.; Verhoeff, A. Dampness in buildings as a risk factor for health effects, EUROEXPO: A multidisciplinary review of the literature (1998–2000) on dampness and mite exposure in buildings and health effects. Indoor Air 2004, 14, 243–257. [Google Scholar] [CrossRef]
  12. Ma, X.; Li, X.; Shao, X.; Jiang, X. An algorithm to predict the transient moisture distribution for wall condensation under a steady flow field. Build. Environ. 2013, 67, 56–68. [Google Scholar] [CrossRef]
  13. Hens, H. IEA Annex 14: Condensation and energy. J. Therm. Insul. 1992, 15, 261–273. [Google Scholar] [CrossRef]
  14. Cho, W.; Iwamoto, S.; Kato, S. Condensation risk due to variations in airtightness and thermal insulation of an office building in warm and wet climate. Energies 2016, 9, 875. [Google Scholar] [CrossRef]
  15. Leccese, F.; Salvadori, G.; Barlit, M. Ventilated flat roofs: A simplified model to assess their hygrothermal behaviour. J. Build. Eng. 2019, 22, 12–21. [Google Scholar] [CrossRef]
  16. Ministry of Land, Infrastructure and Transportation. Korean Design Standard for Preventing Condensation in Apartment Buildings; Ministry of Land, Infrastructure and Transportation: Seoul, Korea, 2016. [Google Scholar]
  17. British Standard Institutions. Code of Practice for Control of Condensation in Buildings; BSI: London, UK, 2011. [Google Scholar]
  18. Werner, H. Wärmeschutz und Energieeinsparung in Gebäuden, Berechnung des Jahres-Heizwärmeund des Jahresheizenergiebedarfs; DIN: Berlin, Germany, 2019. [Google Scholar]
  19. Dutch Building Code Online. Available online: https://www.bouwbesluitonline.nl/ (accessed on 12 March 2020).
  20. ÖNorm, B. 8110-2, 2003: Wärmeschutz im Hochbau-Teil 2: Wasserdampfdiffusion und Kondensationsschutz; Österreichisches Normungsinstitut: Vienna, Austria, 2003. [Google Scholar]
  21. Evans, M.; Chon, H.; Shui, B.; Lee, S.E. Country Report on Building Energy Codes in Republic of Korea; Pacific Northwest National Laboratory: Richland, WA, USA, 2009. [Google Scholar]
  22. AAMA. Thermal Transmittance and Condensation Resistance of Windows, Doors and Glazed Wall Sections; AAMA: Chicago, IL, USA.
  23. Koo, S.Y.; Park, S.; Song, J.-H.; Song, S.-Y. Effect of surface thermal resistance on the simulation accuracy of the condensation risk assessment for a high-performance window. Energies 2018, 11, 382. [Google Scholar] [CrossRef] [Green Version]
  24. ISO. Hygrothermal Performance of Building Components and Building Elements-Internal Surface Temperature to Avoid Critical Surface Humidity and Interstitial Condensation-Calculation Methods; ISO: Brussels, Belgium, 2012. [Google Scholar]
  25. Lee, H.-H.; Oh, H.-R.; Lim, J.-H.; Song, S.-Y. Evaluation of the thermal environment for condensation and mold problem diagnosis around built-in furniture in Korean apartment buildings during summer and winter. Energy Procedia 2016, 96, 601–612. [Google Scholar] [CrossRef] [Green Version]
  26. Galvin, R. The Rebound Effect in Home Heating; Routledge: Abingdon, UK, 2015. [Google Scholar]
  27. Boardman, B. Fuel Poverty: From Cold Homes to Affordable Warmth; Pinter Pub Limited: London, UK, 1991. [Google Scholar]
  28. Lee, D.; Lee, K.; Bae, H. Characterization of indoor temperature and humidity in low-income residences over a year in Seoul, Korea. Asian J. Atmos. Environ. 2017, 11, 184–193. [Google Scholar] [CrossRef]
  29. Bopp, K. Housing Energy and Thermal Comfort: A Review of 10 Countries within the WHO European Region; WHO Regional Office for Europe: Copenhagen, Denmark, 2007. [Google Scholar]
  30. Park, S.; Kim, J.; Song, D. The effect of an energy refurbishment scheme on adequate warmth in low-income dwellings. Sustainability 2019, 11, 2574. [Google Scholar] [CrossRef] [Green Version]
  31. Oreszczyn, T.; Hong, S.H.; Ridley, I.; Wilkinson, P.; Warm Front Study Group. Determinants of winter indoor temperatures in low income households in England. Energy Build. 2006, 38, 245–252. [Google Scholar] [CrossRef]
  32. Statics Korea. Population and Housing Census; Statics Korea: Daejeon, Korea, 2018.
  33. Kim, J.; Myoung, J.; Lim, H.; Song, D. Efficiency gap caused by the input data in evaluating energy efficiency of low-income households’ energy retrofit program. Sustainability 2020, 12, 2774. [Google Scholar] [CrossRef] [Green Version]
  34. Burr, M.L.; Leger, A.S.S.; Yarnell, J.W.G. Wheezing, dampness, and coal fires. J. Public Health 1981, 3, 205–209. [Google Scholar] [CrossRef]
  35. Burr, M.L.; Miskelly, F.G.; Butland, B.K.; Merrett, T.G.; Vaughan-Williams, E. Environmental factors and symptoms in infants at high risk of allergy. J. Epidemiol. Commun. Health 1989, 43, 125–132. [Google Scholar] [CrossRef] [PubMed]
  36. Burr, M.; Mullins, J.; Merrett, T.; Stott, N. Indoor moulds and asthma. J. R. Soc. Health 1988, 108, 99–101. [Google Scholar] [CrossRef] [PubMed]
  37. Oreszczyn, T.; Ridley, I.; Hong, S.H.; Wilkinson, P.; Warm Front Study Group. Mould and winter indoor relative humidity in low income households in England. Indoor Built Environ. 2006, 15, 125–135. [Google Scholar] [CrossRef]
  38. European Cyclists’ Federation. Wood preservatives—Determination of the Protective Effectiveness against Wood Destroying Basidiomycetes—Application by Surface Treatment; BSI: London, UK, 2014. [Google Scholar]
  39. Säteri, J.; Hahkala, H. Classification of Indoor Climate 2000; FiSIAQ: Espoo, Finland, 2001. [Google Scholar]
  40. BSI. Hygrothermal Performance of Building Components and Building Elements-Assessment of Moisture Transfer by Numerical Simulation; DIN: Berlin, Germany, 2007. [Google Scholar]
  41. Geving, S.; Holme, J. Mean and diurnal indoor air humidity loads in residential buildings. J. Build. Phys. 2011, 35, 392–421. [Google Scholar] [CrossRef]
  42. Kalamees, T.; Sasi, L.; Õiger, K. Indoor humidity load in Estonian detached houses. IEA ECBCS Annex 2005, 41, 1–9. [Google Scholar]
  43. Janssens, A.; Vandepitte, A. Analysis of indoor climate measurements in recently built Belgian dwellings. IEA Annex 2006, 41, 1–7. [Google Scholar]
  44. Vandepitte, A. Analyse van Binnenklimaatmetingen in Woningen. Ph.D. Thesis, Ghent University, Ghent, Belgium, 31 May 2006. [Google Scholar]
  45. Kalamees, T.; Vinha, J.; Kurnitski, J. Indoor humidity loads and moisture production in lightweight Timber-frame detached houses. J. Build. Phys. 2006, 29, 219–246. [Google Scholar] [CrossRef]
  46. Korpi, M.; Kalamees, T.; Vinha, J.; Kurnitski, J. The influence of exterior walls on the level and stability of indoor humidity and temperature in detached houses. In Proceedings of the Nordic Symposium on Building Physics, Copenhagen, Denmark, 16–18 June 2008; pp. 1413–1420. [Google Scholar]
  47. Hagentoft, C.-E.; Ramos, N.M.M.; Grunewald, J. Annex 55, Reliability of Energy Efficient Building Retrofitting-Probability Assessment of Performance and Cost, (RAP-RETRO): Stochastic Data; Chalmers University of Technology: Göteborg, Sweden, 2015. [Google Scholar]
  48. Hite, S.C.; Bray, J.L. Research in Home Humidity Control; Purdue University: West Lafayette, IN, USA, 1948. [Google Scholar]
  49. Angell, W.J.; Olson, W.W. Moisture Sources Associated with Potential Damage in Cold Climate Housing; Minnesota Extension Service: St. Paul, MN, USA, 1988. [Google Scholar]
  50. Christian, J.E. Moisture sources. In Moisture Control in Buildings; ASTM International: West Conshohocken, PA, USA, 1994; Volume 8, pp. 176–182. [Google Scholar]
  51. TenWolde, A.; Pilon, C.L. The Effect of Indoor Humidity on Water Vapor Release in Homes; ASHRAE: Peachtree Corners, GA, USA, 2007. [Google Scholar]
  52. Bley, H. Innenküche: Untersuchung über Feuchte-und Temperaturverhalten von Fensterlosen Innenküchen; TU Dortmund University: Dortmund, North Rhine-Westphalia, Germany, 1983. [Google Scholar]
  53. Yik, F.W.H.; Sat, P.S.K.; Niu, J. Moisture generation through Chinese household activities. Indoor Built Environ. 2004, 13, 115–131. [Google Scholar] [CrossRef]
  54. Hansen, A.T. Moisture problems in houses. Can. Build. Digest. 1984. [Google Scholar] [CrossRef]
  55. CIBSE. Environmental Design: CIBSE Guide A; The Chartered Institution of Building Services Engineers: Norwich, UK, 2006. [Google Scholar]
  56. Moisture Generated by Cooking and Laundry Drying Study on Moisture Source in Daily Life in Japan. Available online: https://www.researchgate.net/profile/Atsushi_Iwamae2/publication/268324295_Moisture_generated_by_cooking_and_laundry_drying_Study_on_Moisture_Source_in_Daily_Life_in_Japan/links/557e793a08aeb61eae2480f3/Moisture-generated-by-cooking-and-laundry-drying-Study-on-Moisture-Source-in-Daily-Life-in-Japan.pdf (accessed on 1 August 2020).
  57. Rousseau, M.Z. Sources of moisture and its migration through the building enclosure. ASTM Stand. News 1984, 12, 35–37. [Google Scholar]
  58. Trechsel, H.R. Moisture Analysis and Condensation Control in Building Envelopes; ASTM: West Conshohocken, PA, USA, 2001. [Google Scholar]
  59. Watanabe, K. Principle of Architectural Planning Ⅲ; Maruzen: Tokyo, Japan, 1965. [Google Scholar]
  60. Schmittlutz, R. Sanitärzellen im Wohnungsbau; Technische Universität Carolo-Wilhelmina zu Braunschweig: Braunschweig, Germany, 1975. [Google Scholar]
  61. Erhorn, H.; Gertis, K. Mindestwärmeschutz oder/und Mindestluftwechsel. Gesundheits Ingenieur 1986, 107, 12. [Google Scholar]
  62. Lstiburek, J.; Carmody, J. Moisture Control Handbook: Principles and Practices for Residential and Small Commercial Buildings; John Wiley & Sons: Hoboken, NJ, USA, 1994. [Google Scholar]
  63. Friends of Khmer Culture, Inc. Survey of Cosmetic Usage Behavior; Friends of Khmer Culture, Inc.: New York, NY, USA, 2013. [Google Scholar]
  64. Lu, X. Estimation of indoor moisture generation rate from measurement in buildings. Build. Environ. 2003, 38, 665–675. [Google Scholar] [CrossRef]
  65. Shair, F.H.; Wolbrink, D.W.; Bowen, L.O.; Neelley, C.E.; Sampsel, K.E. Influence of mechanical ventilation on moisture content of bathroom air. ASHRAE J. 1979, 21, 54–60. [Google Scholar]
  66. Bennett, J.S.; Feigley, C.E.; Underhill, D.W.; Drane, W.; Payne, T.A.; Stewart, P.A.; Herrick, R.F.; Utterback, D.F.; Hayes, R.B. Estimating the contribution of individual work tasks to room concentration: Method applied to embalming. Am. Ind. Hyg. Assoc. J. 1996, 57, 599–609. [Google Scholar] [CrossRef]
  67. Sanders, C. Task 2: Environmental Conditions; IEA-Annex 24 HAMTIE, Final Report; Laboratorium Bouwfysica: KU-Leuven, Belgium, 1996; Volume 2. [Google Scholar]
  68. Kalamees, T. Hygrothermal Criteria for Design and Simulation of Buildings; TUT Press: Tallinn, Estonia, 2006. [Google Scholar]
  69. Brundrett, G.W.; Poultney, G. Saucepan lids: The key to low energy cooking. J. Consum. Stud. Home Econ. 1979, 3, 195–204. [Google Scholar] [CrossRef]
Figure 1. Traces of condensation occurrence in low-income households analyzed in this study.
Sustainability 12 07563 g001
Figure 2. Floor plan of the target low-income household.
Sustainability 12 07563 g002
Figure 3. Detailed measurement process.
Sustainability 12 07563 g003
Figure 4. Internal moisture excess in low-income households.
Sustainability 12 07563 g004
Figure 5. Water vapor generation characteristic during showering.
Sustainability 12 07563 g005
Figure 6. Relative humidity changes during showering.
Sustainability 12 07563 g006
Figure 7. Water vapor generation characteristics during bathing.
Sustainability 12 07563 g007
Figure 8. Relative humidity changes during bathing.
Sustainability 12 07563 g008
Table 1. Overview of the indoor moisture excess found from conventional studies.
ReferenceRegionDwelling TypeRoom TypenAverage Moisture Excess [G/M3]
Warm Cold
Tout > 5 °C, 15 °C Tout 15 °C
Janssens and
Vandepitte (2006) [43], Vandepitte (2006) [44]
BelgiumPrivate single familyLiving room170.5 *1.7
Bedroom1.9
Social housingOverall182.1
Private housingOverall41.5
Kalamees et al. (2006) [45]FinlandLightweight timber-frame detached housesBedroom1010.5 *1.9
Living room0.4 *1.7
Stig Geving et al. (2011) [41]NorwayDetached one-family house, semi-detached two- or four-family house, chained house, apartment building Living room1171.62.2
Bedroom1.21.8
Bathroom2.83.6
Korpi et al. (2008) [46]FinlandHeavyweight housesBedroom691.51.3
Hagentoft et.al (2015) [47]DenmarkSingle-family houseOverall4221.5-
Multi-family houseOverall581.8-
Kalamees et al. (2005) [42]EstoniaSingle-family lightweight detached houseBedroom270.3 *1.6
Living room0.2 *1.4
* Maximum outdoor temperature is not limited at upper limit (15 °C).
Table 3. Internal moisture excess.
Internal Moisture Excess [G/M3]
AverageSD10%90%Remarks
Overall4.691.972.207.42Tout 5 °C
Number of residents
=14.531.662.066.11
>14.831.802.947.01
Construction age
3 year6.101.144.118.19
27 year3.711.381.905.92
Table 4. Moisture generation rate for showering.
1st2nd3rd4th5thAvg.
g/event (20 min)132.0135.7140.0116.1102.5125.3
g/h378.1387.8399.9331.6293.0358.1
Table 5. Moisture generation rate for bathing.
1st2nd3rd4th5thAvg.
g/event (20 min)51.334.174.252.643.151.1
g/h153.8102.4222.5157.7129.4153.2
Table 6. Moisture generation rates for cooking.
BeforeAfterg/Eventg/h
1st1152885.9275.6532.2
2nd1205903.3305.4603.4
Avg.--290.5567.8
Table 7. Moisture generation rate for laundry drying.
BeforeAfterg/Eventg/h
1st56203996.51623.5162.4
2nd56043940.41663.6184.8
Avg.--1643.6173.6

