Article

Loading Capacity of Sewage Sludge for Forestry Application in Chinese Provincial Capital Cities

1
School of Soil and Water Conservation, Beijing Forestry University, Beijing 100083, China
2
The Third Construction Co., Ltd. of China Construction First Group, Beijing 100161, China
3
Beijing Forestry Carbon Administration, Beijing 100013, China
*
Author to whom correspondence should be addressed.
Sustainability 2020, 12(18), 7551; https://doi.org/10.3390/su12187551
Submission received: 6 August 2020 / Revised: 5 September 2020 / Accepted: 9 September 2020 / Published: 14 September 2020
(This article belongs to the Special Issue Wastewater Treatment and Solid Waste Management)

Abstract

:
The application of sewage sludge (SS) in forestry is considered a viable option. However, the long-term application of SS potentially leads to metal accumulation, posing an environmental risk. Understanding the loading capacity of SS for forestry application is therefore of great significance. We used data from published studies and statistical bulletins across 31 provincial capital cities (PCCs) in China to calculate the loading capacity (LC) of SS for forestry application for each PCC. The results are as follows: (1) the mean value of the priority control threshold was 33 t·ha−1·y−1 in 31 PCCs, while the variations ranged from 7 to 91 t·ha−1·y−1 among different PCCs. The priority control thresholds (Smins) of 1/2 PCCs were higher than 30 t·ha−1·y−1 (CJ-T 362-2011). The Smin values of Lanzhou, Tianjin, Hohhot, Shanghai, and Yinchuan were above 55 t·ha−1·y−1, but Smin values of Kunming and Changsha were below 10 t·ha−1·y−1. (2) Cd was the priority control metal in most of the PCCs (27/31), with the exception of Shanghai and Guangzhou (Cu), Beijing (Hg), and Tianjin (Zn). (3) The total loading capacity was 507 million t·y−1, which was 125 times higher than the total quantity of the dry SS (404 × 104 t) for the 31 PCCs. Our results have important practical significance for the use of urban sludge forest land in China and suggest that SS disposal policies need to be tailored to specific regions. We provide a scientific basis to guide the development of national and provincial forestry policies.

Graphical Abstract

1. Introduction

Sewage sludge (SS) is a residue of domestic and industrial wastewater treatment [1,2,3], and global sewage production exceeded 300 billion t·y−1 in 2010 [4,5]. Although improvements in urban sewage treatment capacity have resulted in enhanced water quality, the amount of sewage sludge has significantly increased. By the end of 2017, the capacity of sewage treatment plants in China was 157 million t·d−1, with municipal domestic sewage treatment accounting for 42.6 billion m3; the amount of dry sludge produced was 9.51 million t [6]. The disposal and treatment of SS are major challenges in sewage management [1], and sustainable sludge handling needs to meet the requirements of efficient resource recycling without the distribution of harmful substances.
Sewage sludge contains large amounts of organic carbon as well as nitrogen, phosphorus, potassium, and various trace elements necessary for plant growth, fertility, thereby potentially improving soil structure and increasing plant growth [7,8,9,10]. Municipal sewage sludge, given that it meets the quality criteria for agricultural use, stimulates crop yield [11]. In a previous study, in the underlying soil horizons after the application of 3 t ha−1·y−1 of SS, the trace metal contents remained stable [12]. The application of sludge at a rate of 3 t ha−1·y−1 did not significantly increase the bioavailability of As, Cu, Zn, Hg, Pb, Cd, and Cr, as demonstrated for mushroom cultivation [13]. In another study, dried urban sewage sludge residues were applied to a sugar maple (Acer saccharum Marsh.) and yellow birch (Betula alleghaniensis Britton) forest in Quebec at a dose of 38.6 3 t ha−1·y−1, and Zn, Cd, Cu, and Pb concentrations were below the detection limits [14]. These studies have shown that the leaching of major and trace elements into the soil is generally low at low SS quantities [11,12,13,14], most likely because a high percentage of elements may be retained in the humus layer by metal complexation to the surface of organic matter [15,16,17,18]. In a study in Sweden, long-term application of sewage sludge to farmland did not result in significant changes in the soil bacterial resistome [19]. However, such an approach can result in the accumulation of metals, potentially entering the food chain and threatening human health [20,21]. Farmers are generally not inclined to use SS because of its negative reputation and unpleasant odors [22]. However, given the fact that most wastewater treatment plants are in cities and that transportation is expensive, the application in forests (zero or minimal transportation cost) may represent a viable alternative of sludge disposal in China, which also would avoid direct contact with animals and humans [23,24]. So far, sewage sludge has been mainly applied to forest surfaces, while sludge compost has been used as a tree seedling container media [17], mainly for tree species such as poplar, paulownia, Chinese pine, black locust, Chinese pagoda tree, and Chinese arborvitae [25]. Based on a previous study, SS in Shenyang is suitable for application to forests and grasslands or nurseries, where food chain contamination with cadmium is not a concern [26]. A study on the influences of sewage sludge on the degradation of hexazinone and the formation of its major metabolites has improved our understanding of the pollution risk when applying SS to forest soil [27]. Sewage sludge-based Bacillus thuringiensis production, followed by its use in forest and agro-crops for pest control, is an acceptable disposal practice [28].
When evaluating the applicability of SS, metal concentrations are still an important index [1]. According to the Soil Pollution Survey of China in 2014, metal concentrations in forests exceeded the standard levels by 10%, with Cd and As being the main contaminants [29]. The metals Zn, Cu, and Ni are considered the main metals limiting the application of SS in England [30], and in a study on grasslands which had received sludge for more than 10 years at a dose of 39 t·ha−1·y−1, the soil concentrations of Hg and Cd were significantly increased [31]. With the development of efficient transportation and heating techniques, Cd and Hg are the elements most likely limiting the application of SS because of their inertness, migration, high biomagnification, and strong toxicity [32,33,34]. In an earlier study, the application of 6 t·ha−1·y−1 of SS with low trace element concentrations modified the transfer of Cd, Hg, and Pb to mushrooms in some sites [18].
In 2000, China started to make efforts to decrease its metal emissions by the implementation of stricter regulations [1]. In this sense, understanding the loading capacity of SS for forestry application is of great significance in terms of resource reuse [35,36]. In China, the threshold level of SS used in forests is 30 t·ha−1·y−1, and continuous application should not exceed 15 years according to the Standard CJ/T 362-2011 [37]. Nevertheless, the natural conditions and the area of urbanization in China differ largely. The lack of specific thresholds restricts the application of SS in forestry, making it necessary to establish threshold values for each city, based on the concentrations of metals in SS, as well as the soil dynamic environmental capacity [38]. In this context, the objectives of this study were to (1) screen and identify the priority control metal of SS for forestry application and to (2) determine and design its maximum loading capacities, with the overall aim to propose suggestions for each provincial capital city (PCC). This will be helpful to determine the potential of urban sludge for forestry application, eventually providing a theoretical basis for national and provincial forestry policies.

2. Methods

2.1. Data Preparation

We analyzed the metal concentrations in SS in 31 PCCs in mainland China, using the bibliometric method to screen 1082 valid data from 129 references (Figure 1) from international studies published between 2006 and 2018, including the Chinese National Knowledge Infrastructure, the Science Direct database, and some official reports (see Tables S1 and S2). The data screening principles were as follows: first, the metal testing protocols of the selected studies were associated with strict quality assurance and control, containing parallel samples, blank samples, and standard materials, and the recovery rate needed to be conformed to the determination standard. Second, in case the data were normally distributed, the average metal content was represented using the arithmetic mean; if the data conformed to a logarithmic normal distribution, the geometric average was used. Data on the baseline values of soil metals were obtained from our previous research [29]; area of forestry and quantity of dry SS treated data were obtained from the Statistical Yearbook on Urban Construction 2017 [39]. Spatial distribution maps were produced with the GIS software ArcGIS 10.

2.2. Calculating the Loading Capacity of SS for Forestry Application

The soil environmental capacity for metals is the maximum amount that the soil can load in certain regions and periods, and to know this capacity is crucial to control the amount of metals brought in via SS application. As an ecosystem, soil can decrease the concentrations of pollutants and their accumulation [40]. Thus, we adopted the soil dynamic environmental capacity (Qn) when SS is used in long-term application programs in forestry. The Qn is defined by the following equation [41,42]:
Qn = 2.25 × 10⁶ × (Si − CiKn)(1 − K)/[K(1 − Kn)] × 10−6,
where Qn is the soil dynamic environmental capacity, kg·ha−1·y−1; 2.25 × 10⁶ is the average mass of surface soil (0–20 cm)per hectare, (kg·ha−1); i represents the certain metal of the eight metal elements; Si is the risk screening value for soil contamination of metal i, (mg·kg−1), adopting the other criteria for forestry soil in GB 15618-2018 (Table 1) [43]; Ci is the baseline value of soil metal i, (mg·kg−1); K is the residual rate of the soil metal, which is associated with the absorption of plants, soil loss, and leaching and generally amounts to 0.90 [44]; n is the time (here, 15 years); and 10−6 is the unit scaling factor.
The loading capacity of SS for forestry application in PCC was calculated by the following equations:
Sn = Qn/Wsi×103
T = Smin × AF × 10−6
where Sn is the i threshold of the metal of SS for forestry application, t·ha−1·y−1; Wsi is the i concentration of SS (meeting the requirements GB/T 23486-2009 [45] in Table 1), mg·kg−1; T is the loading capacity of SS for forestry application, million t·y−1; Smin is the priority control threshold (minimum value of eight Sns); AF is the area of forestry in PCC, (ha); and 103 and 10−6 are the unit scaling factors.

3. Results

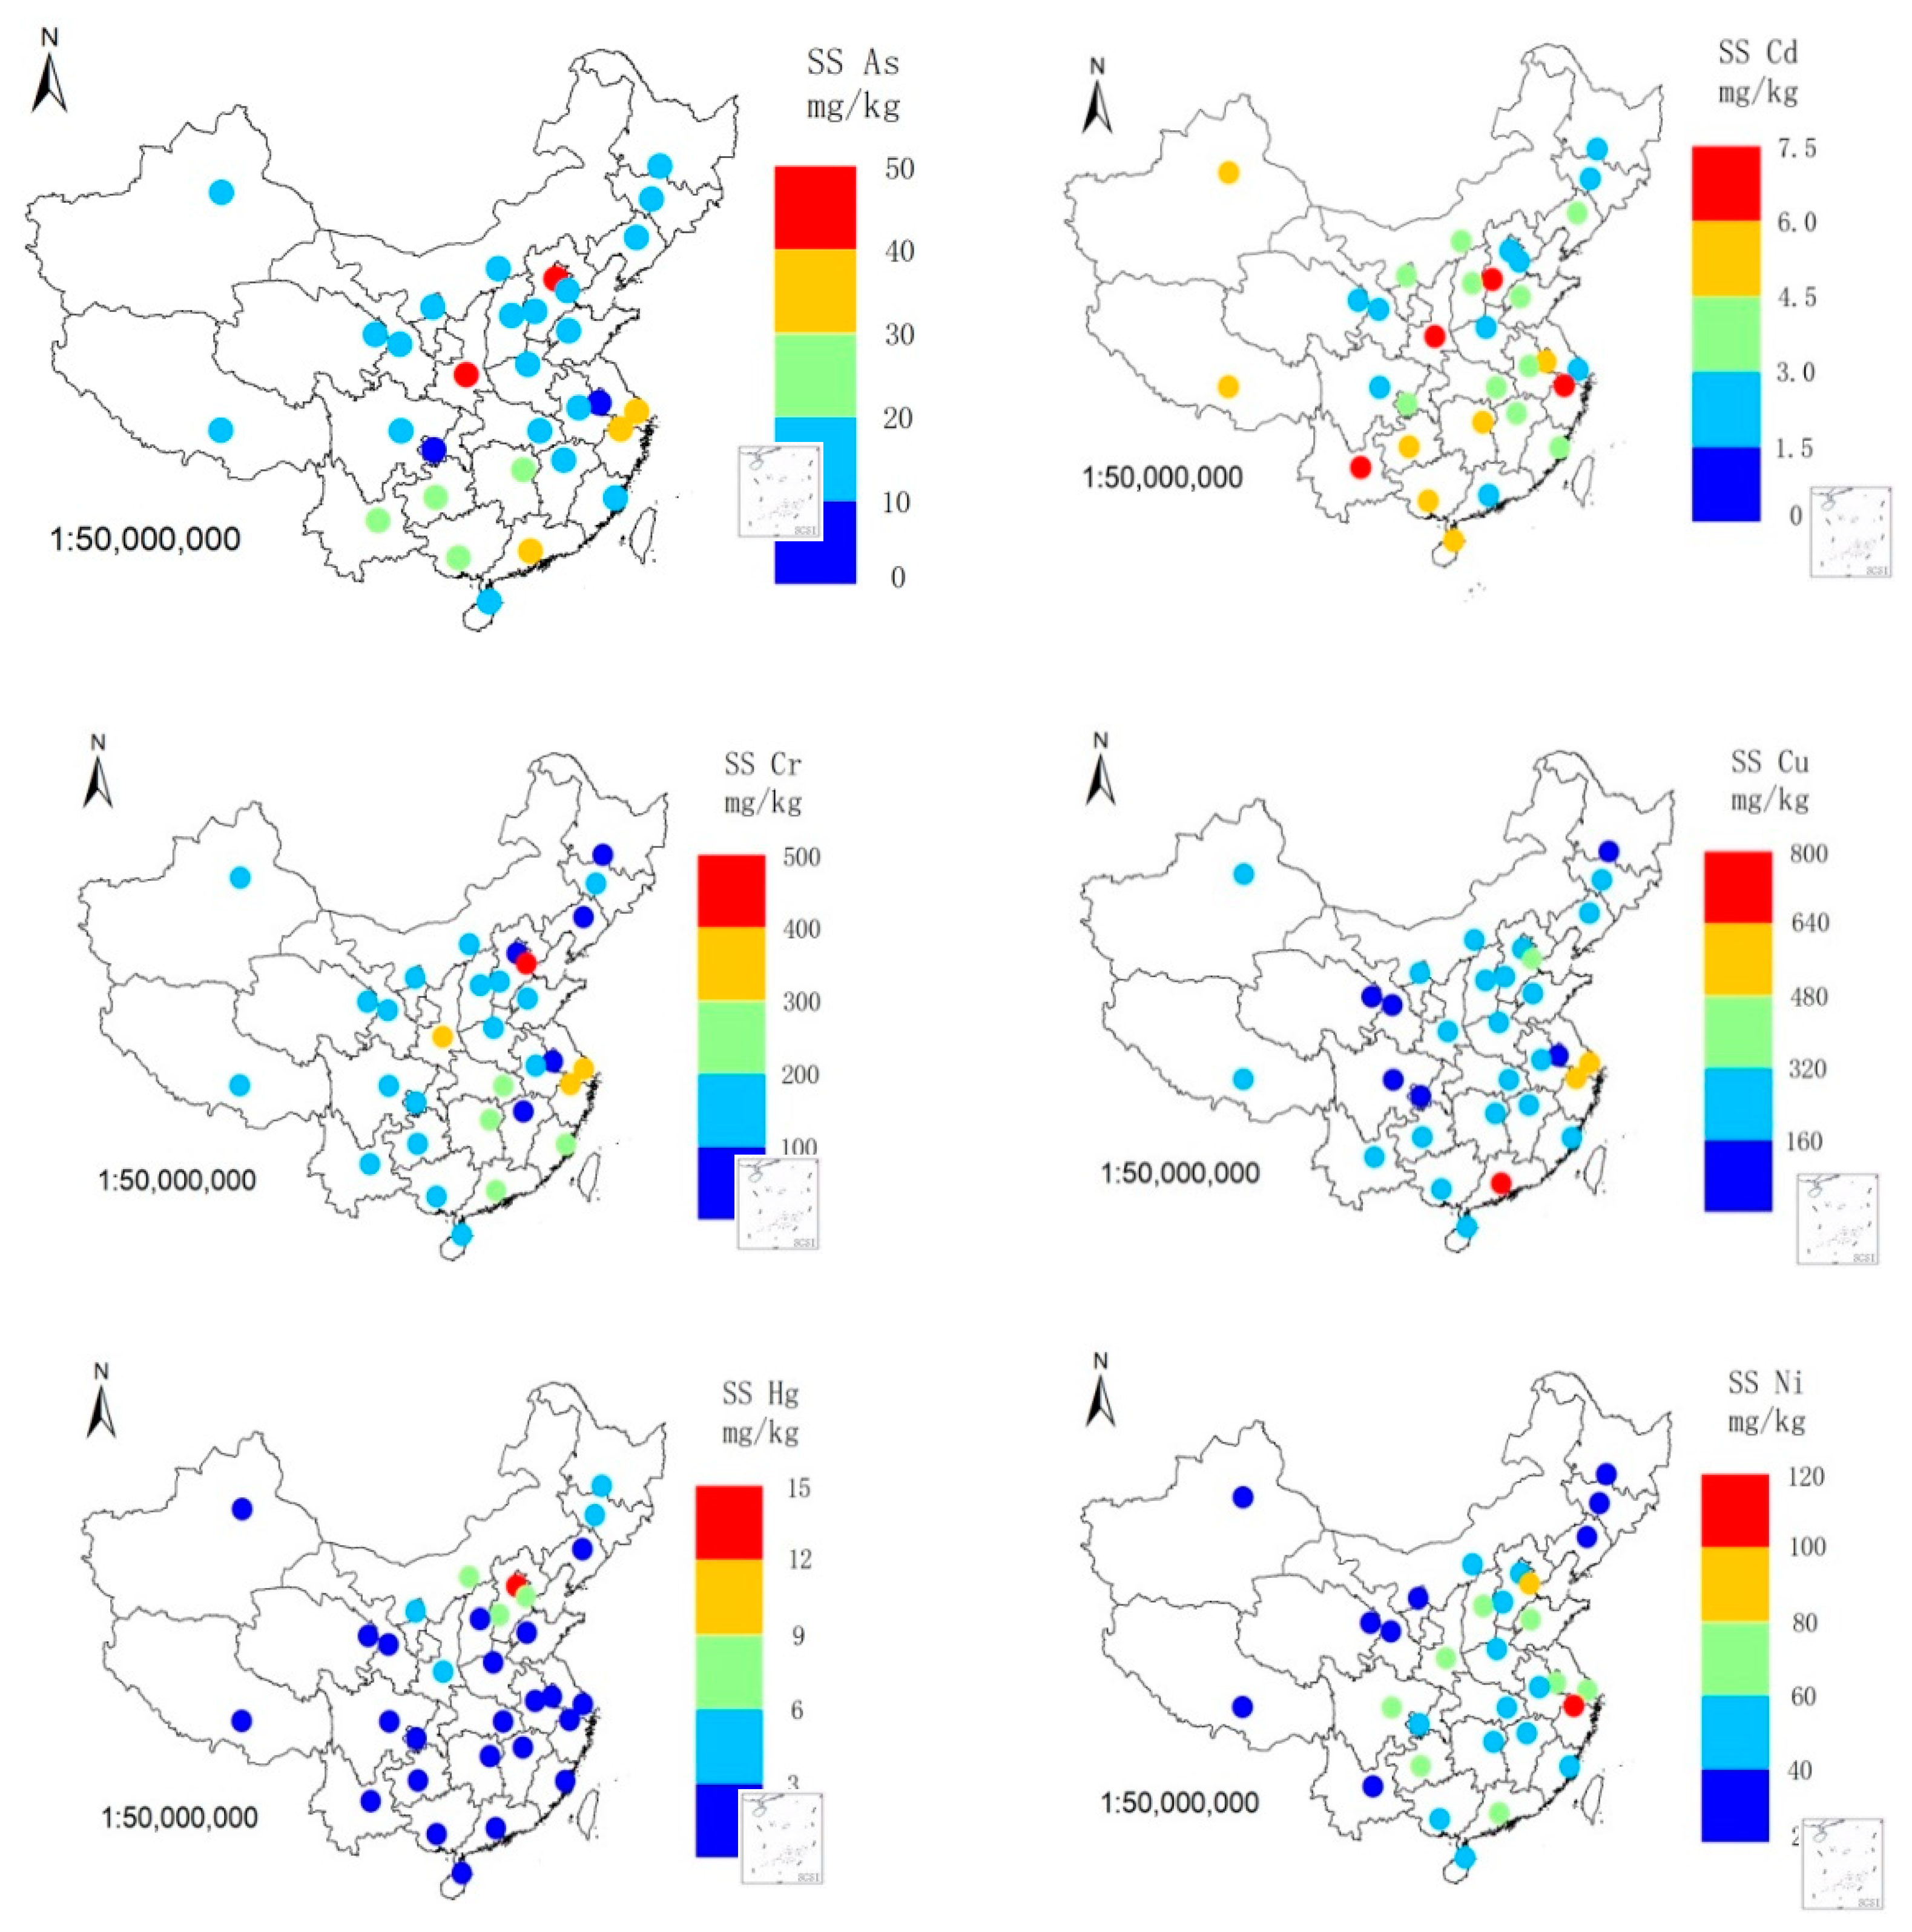
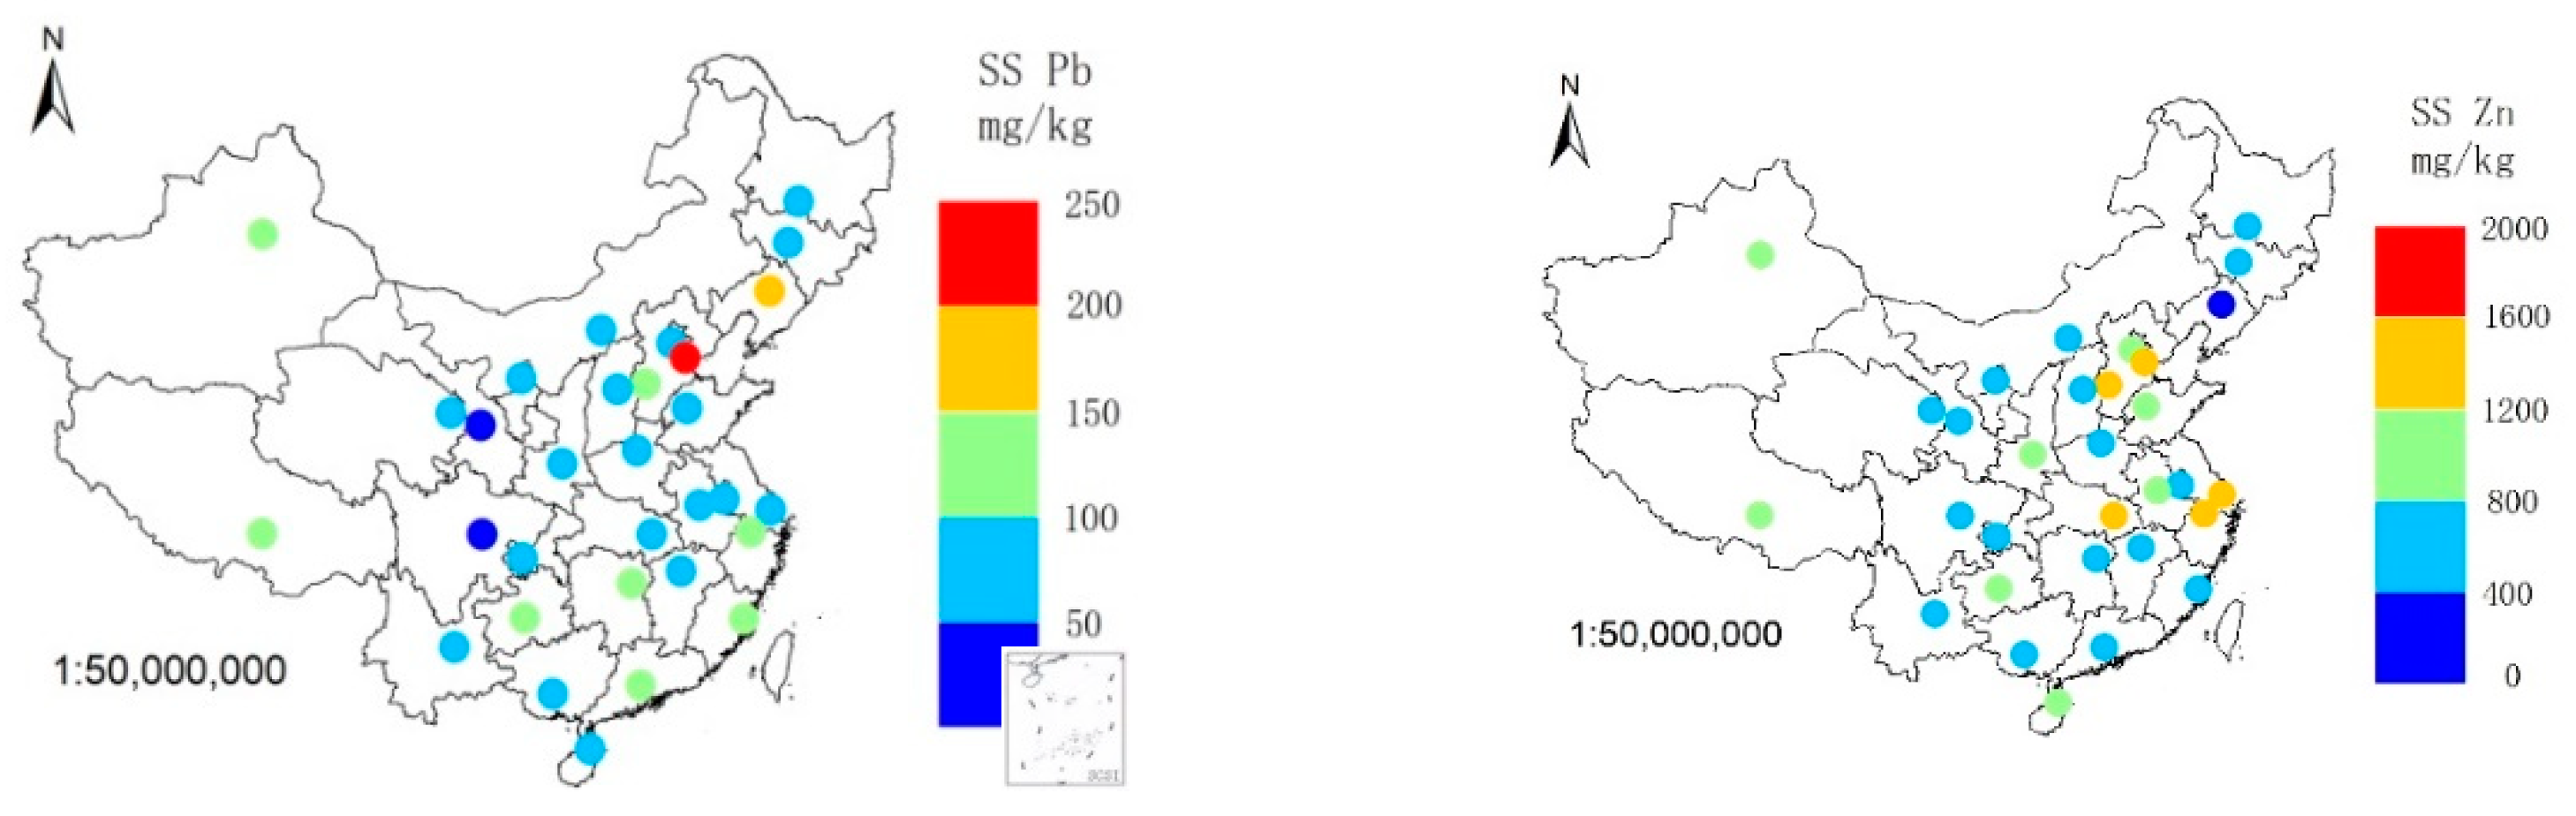
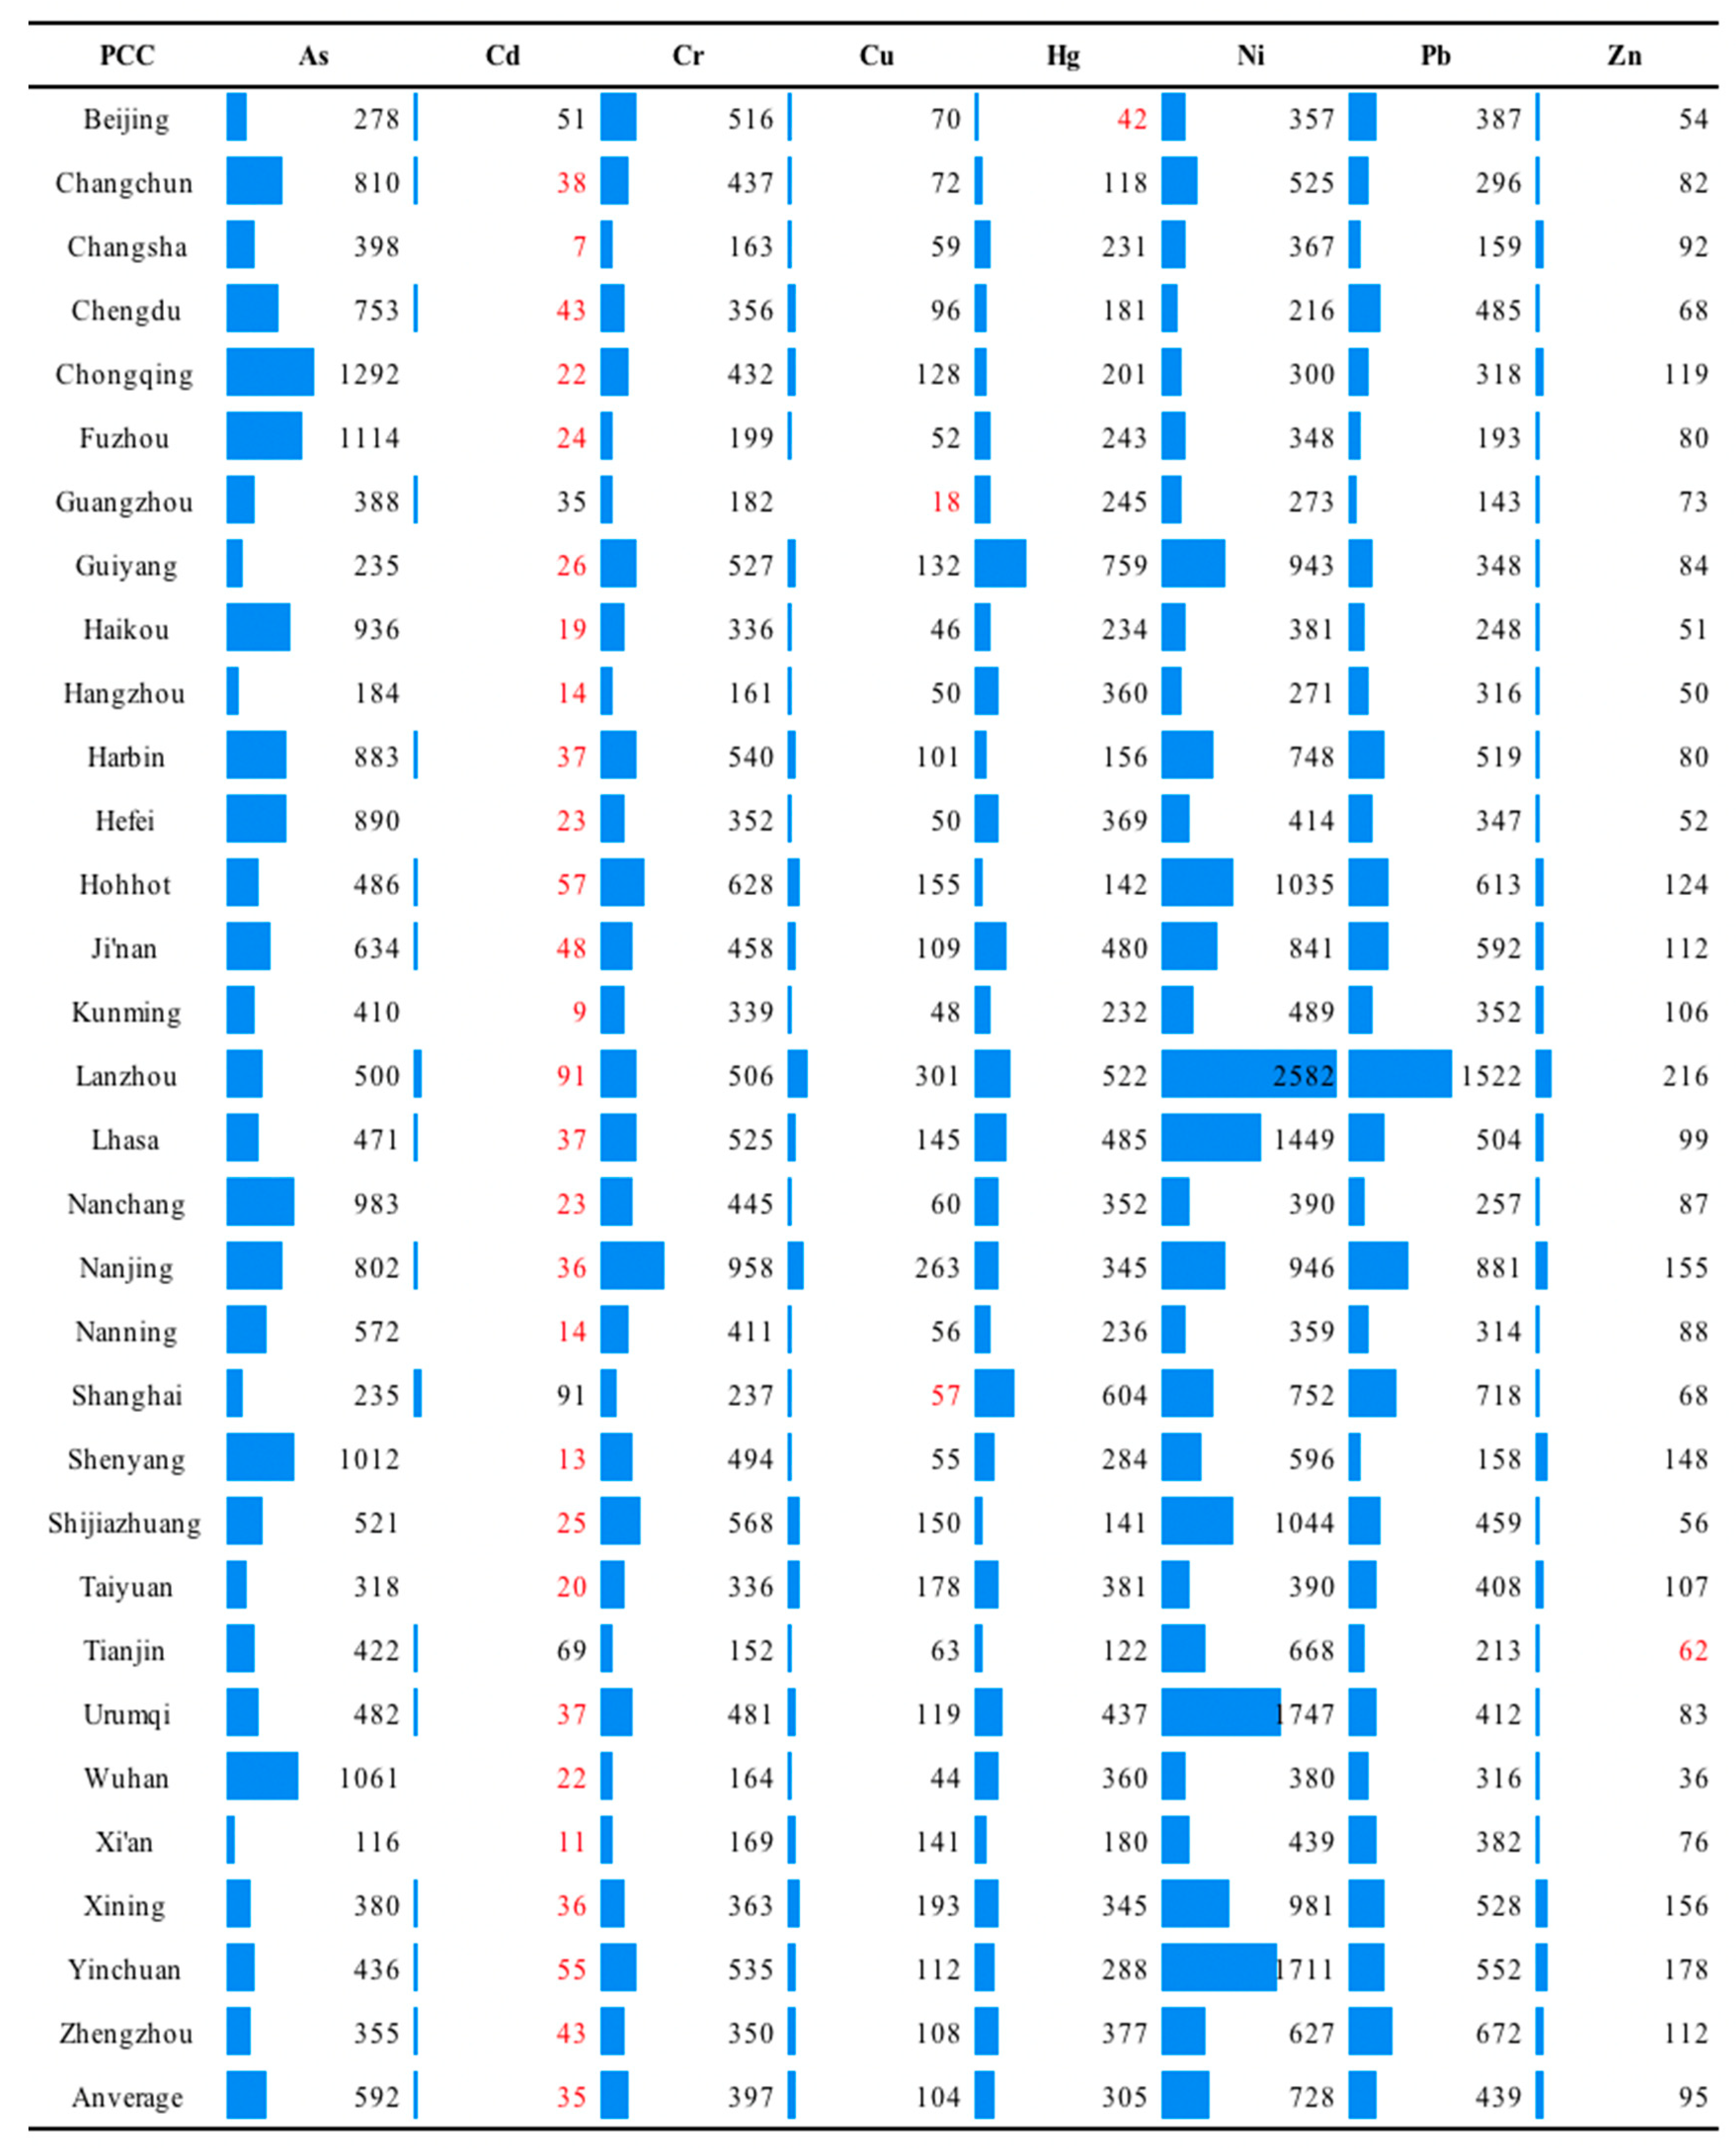
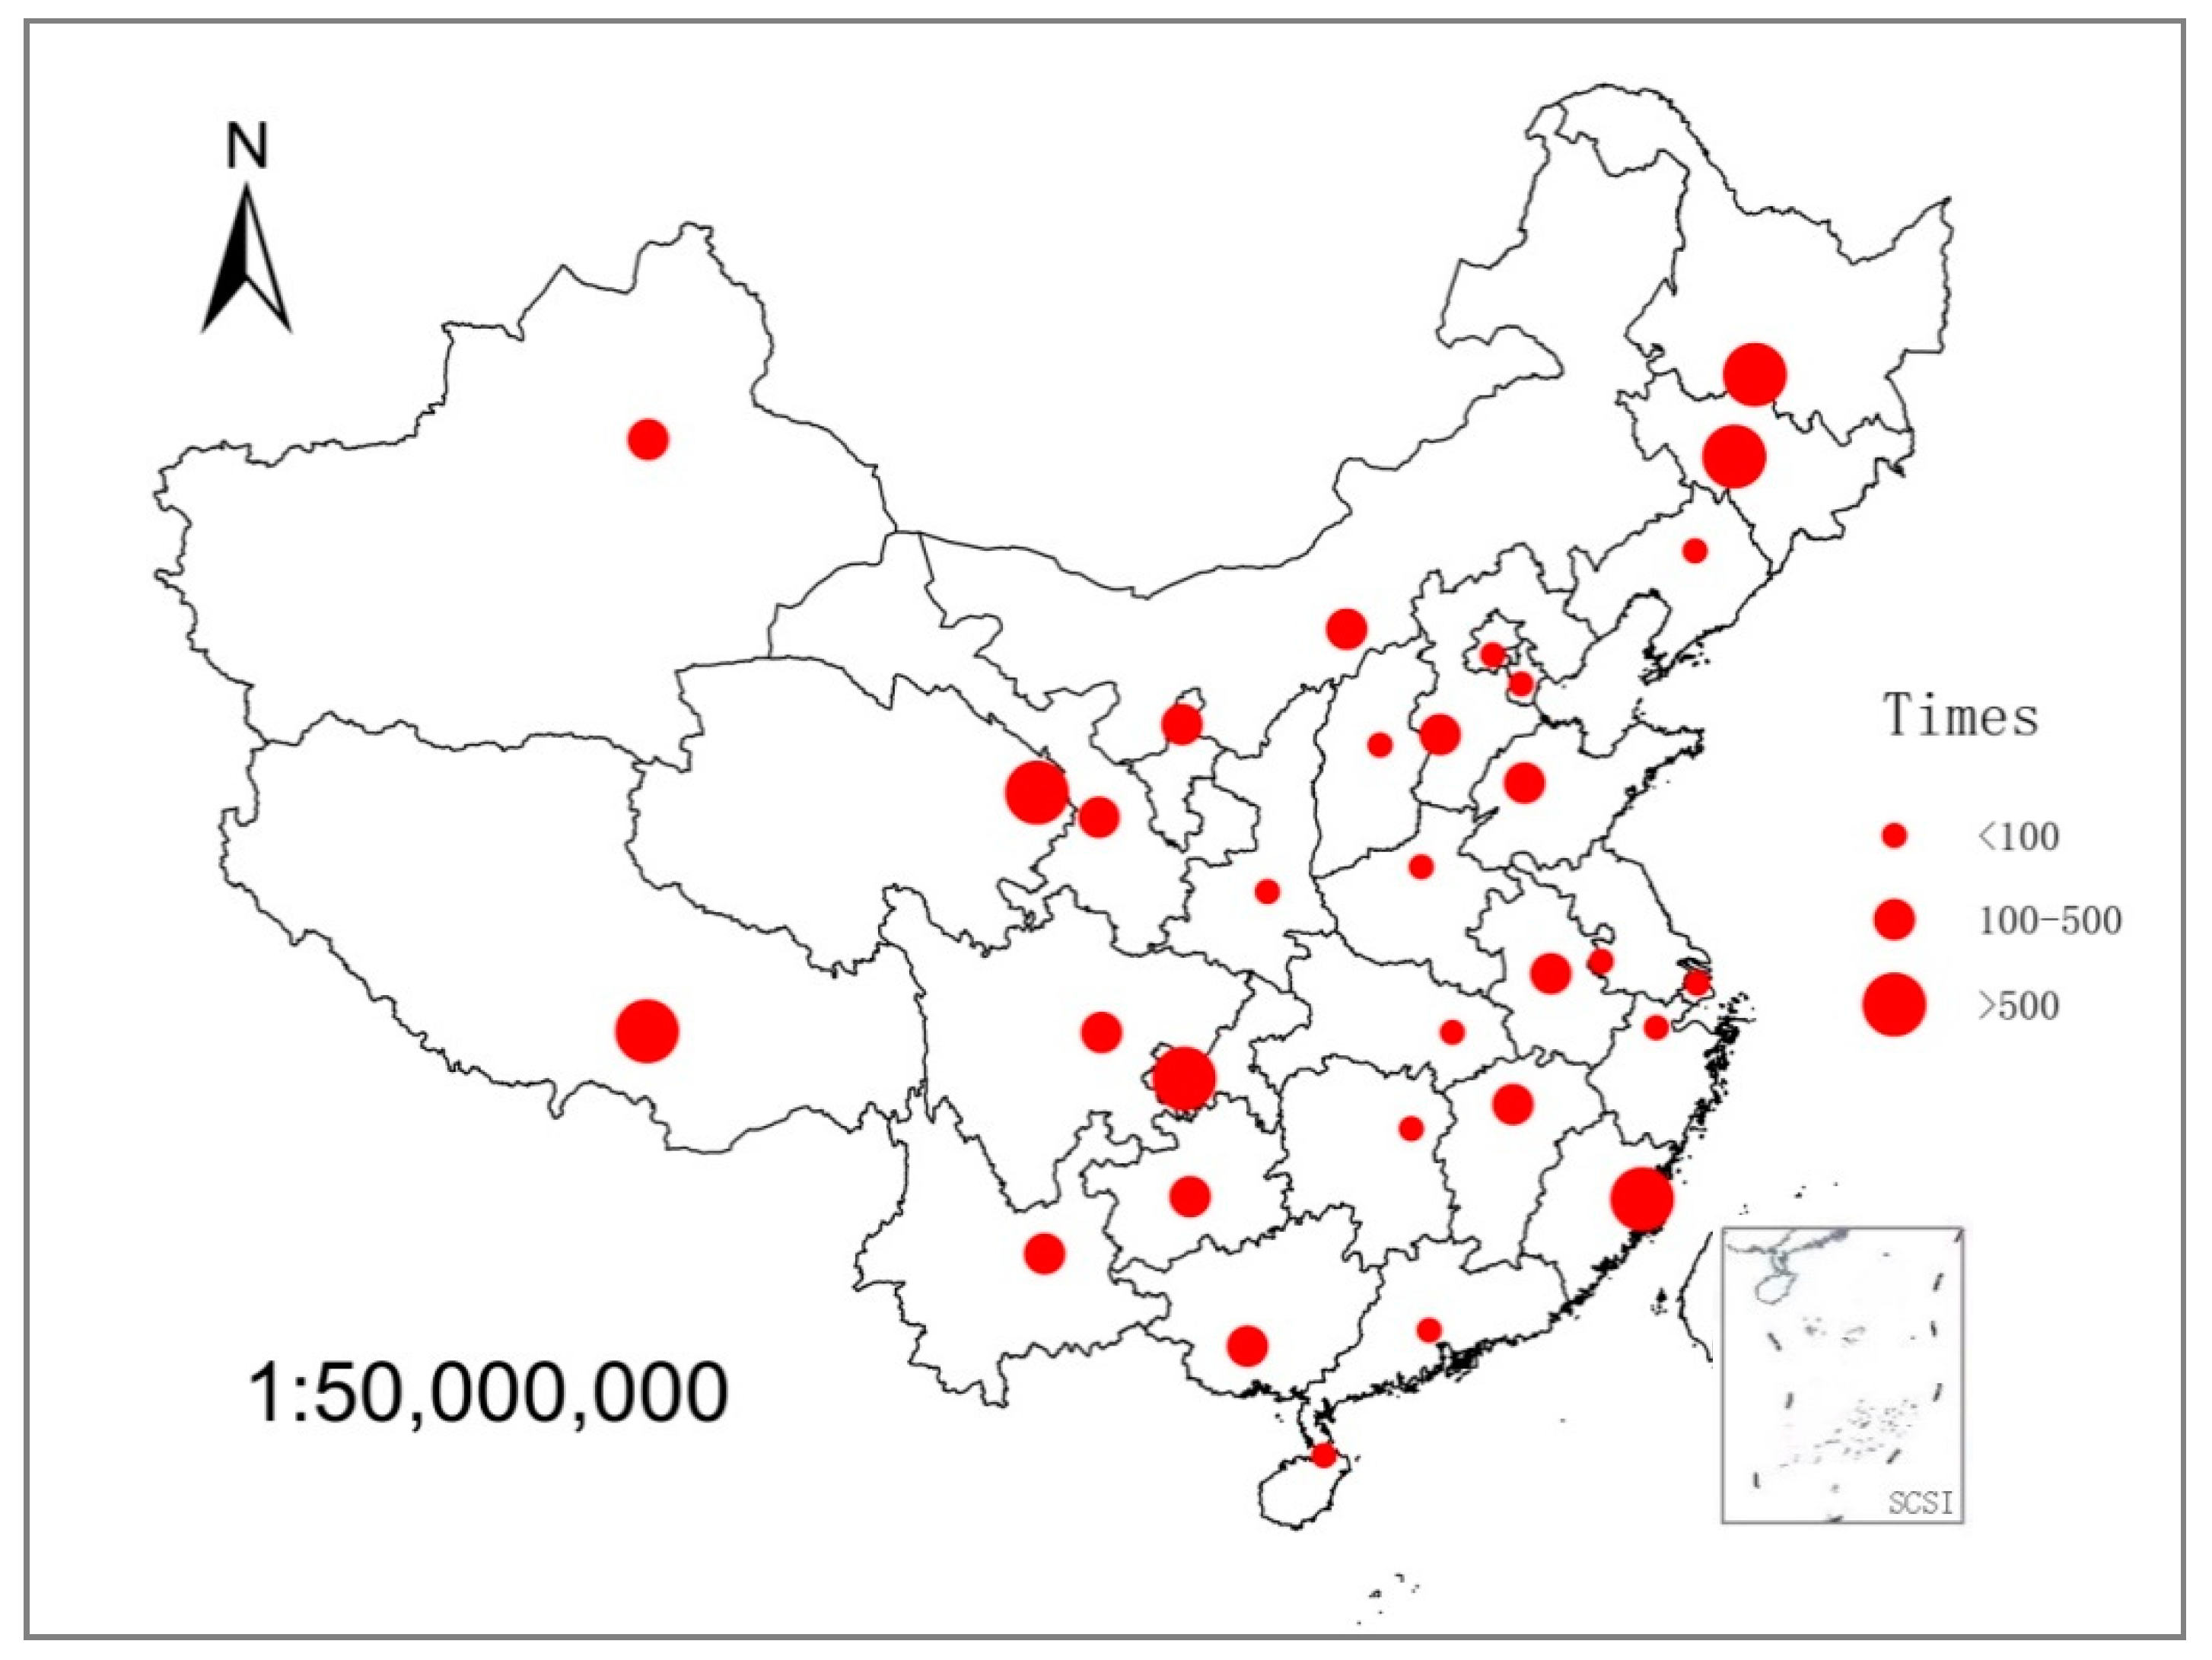
3.1. Spatial Distribution of Metals in SS

All PCCs’ SS met the requirements established in the GB/T 23486-2009 (Figure 2).
The As concentrations ranged between 9.27 and 48.33 mg·kg−1, with a mean value of 19.05 mg·kg−1. They exceeded 30 mg·kg−1 in Hangzhou, Beijing, Shanghai, Guangzhou, and Xi’an. In five southwestern PCCs, the As concentrations of SS ranged between 20 and 30 mg·kg−1, while in about one-third of the PCCs, they ranged from 10 to 20 mg·kg−1. In contrast, in Nanjing and Chongqing, the levels were below 10 mg·kg−1.
The Cd concentrations showed a range of 1.70 to 7.13 mg·kg−1, with an average value of 3.84 mg·kg−1. Most of the PCCs with lower Cd levels were located in industrial zones of such as Beijing, Shanghai, Tianjin, Guangzhou, Harbin, Changchun, Zhengzhou, and Chengdu. The Cd concentrations in Xi’an, Shijiazhuang, Kunming, and Hangzhou ranged from 6.0 to 7.5 mg·kg−1; PCCs with Cd concentrations from 4.5 to 6 mg·kg−1 and 3 to 4.5 mg·kg−1 accounted for one-third of all PCCs.
Regarding the Cr concentrations, we observed a range of 77.03 to 481.86 mg·kg−1, with an average value of 172.26 mg·kg−1; the highest level was found for Tianjin. Sewage sludge from Hangzhou, Xi’an, and Shanghai had Cr levels of 369.28, 343.62, and 307.20 mg·kg−1, respectively. In four PCCs, the levels ranged from 200 to 300 mg·kg−1, although Cr concentrations mainly varied from 100 to 200 mg·kg−1. In Nanchang, Shenyang, Beijing, Harbin, and Nanjing, the Cr levels were below 100 mg·kg−1.
The minimum and maximum Cu concentrations were 99.21 and 751.6 mg·kg−1, respectively, with a mean value of 258.47 mg·kg−1. In most PCCs, the Cu concentrations of SS were below 500 mg·kg−1. In Wuhan, Haikou, Tianjin, and Shanghai, the levels ranged from 300 to 500 mg·kg−1; the minimum value was found for Lanzhou.
The Hg concentrations ranged between 1.13 and 12.42 mg·kg−1, with a mean value of 3.06 mg·kg−1. In contrast to the Cd distribution, the PCCs with the highest concentrations were located in highly industrialized areas such as Beijing, Tianjin, Shijiazhuang, Harbin, and Changchun. In 23 PCCs, the Hg concentrations of SS were below 3 mg·kg−1.
For the Ni concentrations, we observed a range from 22.54 to 111.01 mg·kg−1, with an average value of 53.43 mg·kg−1. In most PCCs, the Ni concentrations of SS were below 100 mg·kg−1, with the exception of Hangzhou. In Tianjin, the Ni level of SS was 87.17 mg·kg−1. The PCCs with concentrations ranging from 60 to 80 mg·kg−1 and from 40 to 60 mg·kg−1 accounted for one-third of all PCCs. In the northwestern and northeastern areas, Ni concentrations in SS were more than 20 and less than 40 mg·kg−1.
The Pb concentrations varied between 34.27 and 241.80 mg·kg−1; the mean value was 92.35 mg·kg−1. The highest level was observed for Tianjin, followed by Shenyang. In seven PCCs, the Pb levels of SS ranged from 100 to 200 mg·kg−1, while in two-thirds of the PCCs, the levels were between 50 and 100 mg·kg−1. For Chengdu and Lanzhou, we observed levels below 50 mg·kg−1.
The minimum and maximum Zn concentrations were 376.80 and 2024.53 mg·kg−1, respectively, with a mean value of 870.15 mg·kg−1. Similar to the Hg distribution, the PCCs with the highest concentrations were located in industrial areas such as Tianjin, Hangzhou, Shijiazhuang, Wuhan, and Shanghai. In eight PCCs, the Zn levels of SS ranged from 800 to 1200 mg·kg−1, while in 17 PCCs, the range was 400 to 800 mg·kg−1. For Shenyang, the lowest Zn concentration of about 400 mg·kg−1 was observed.

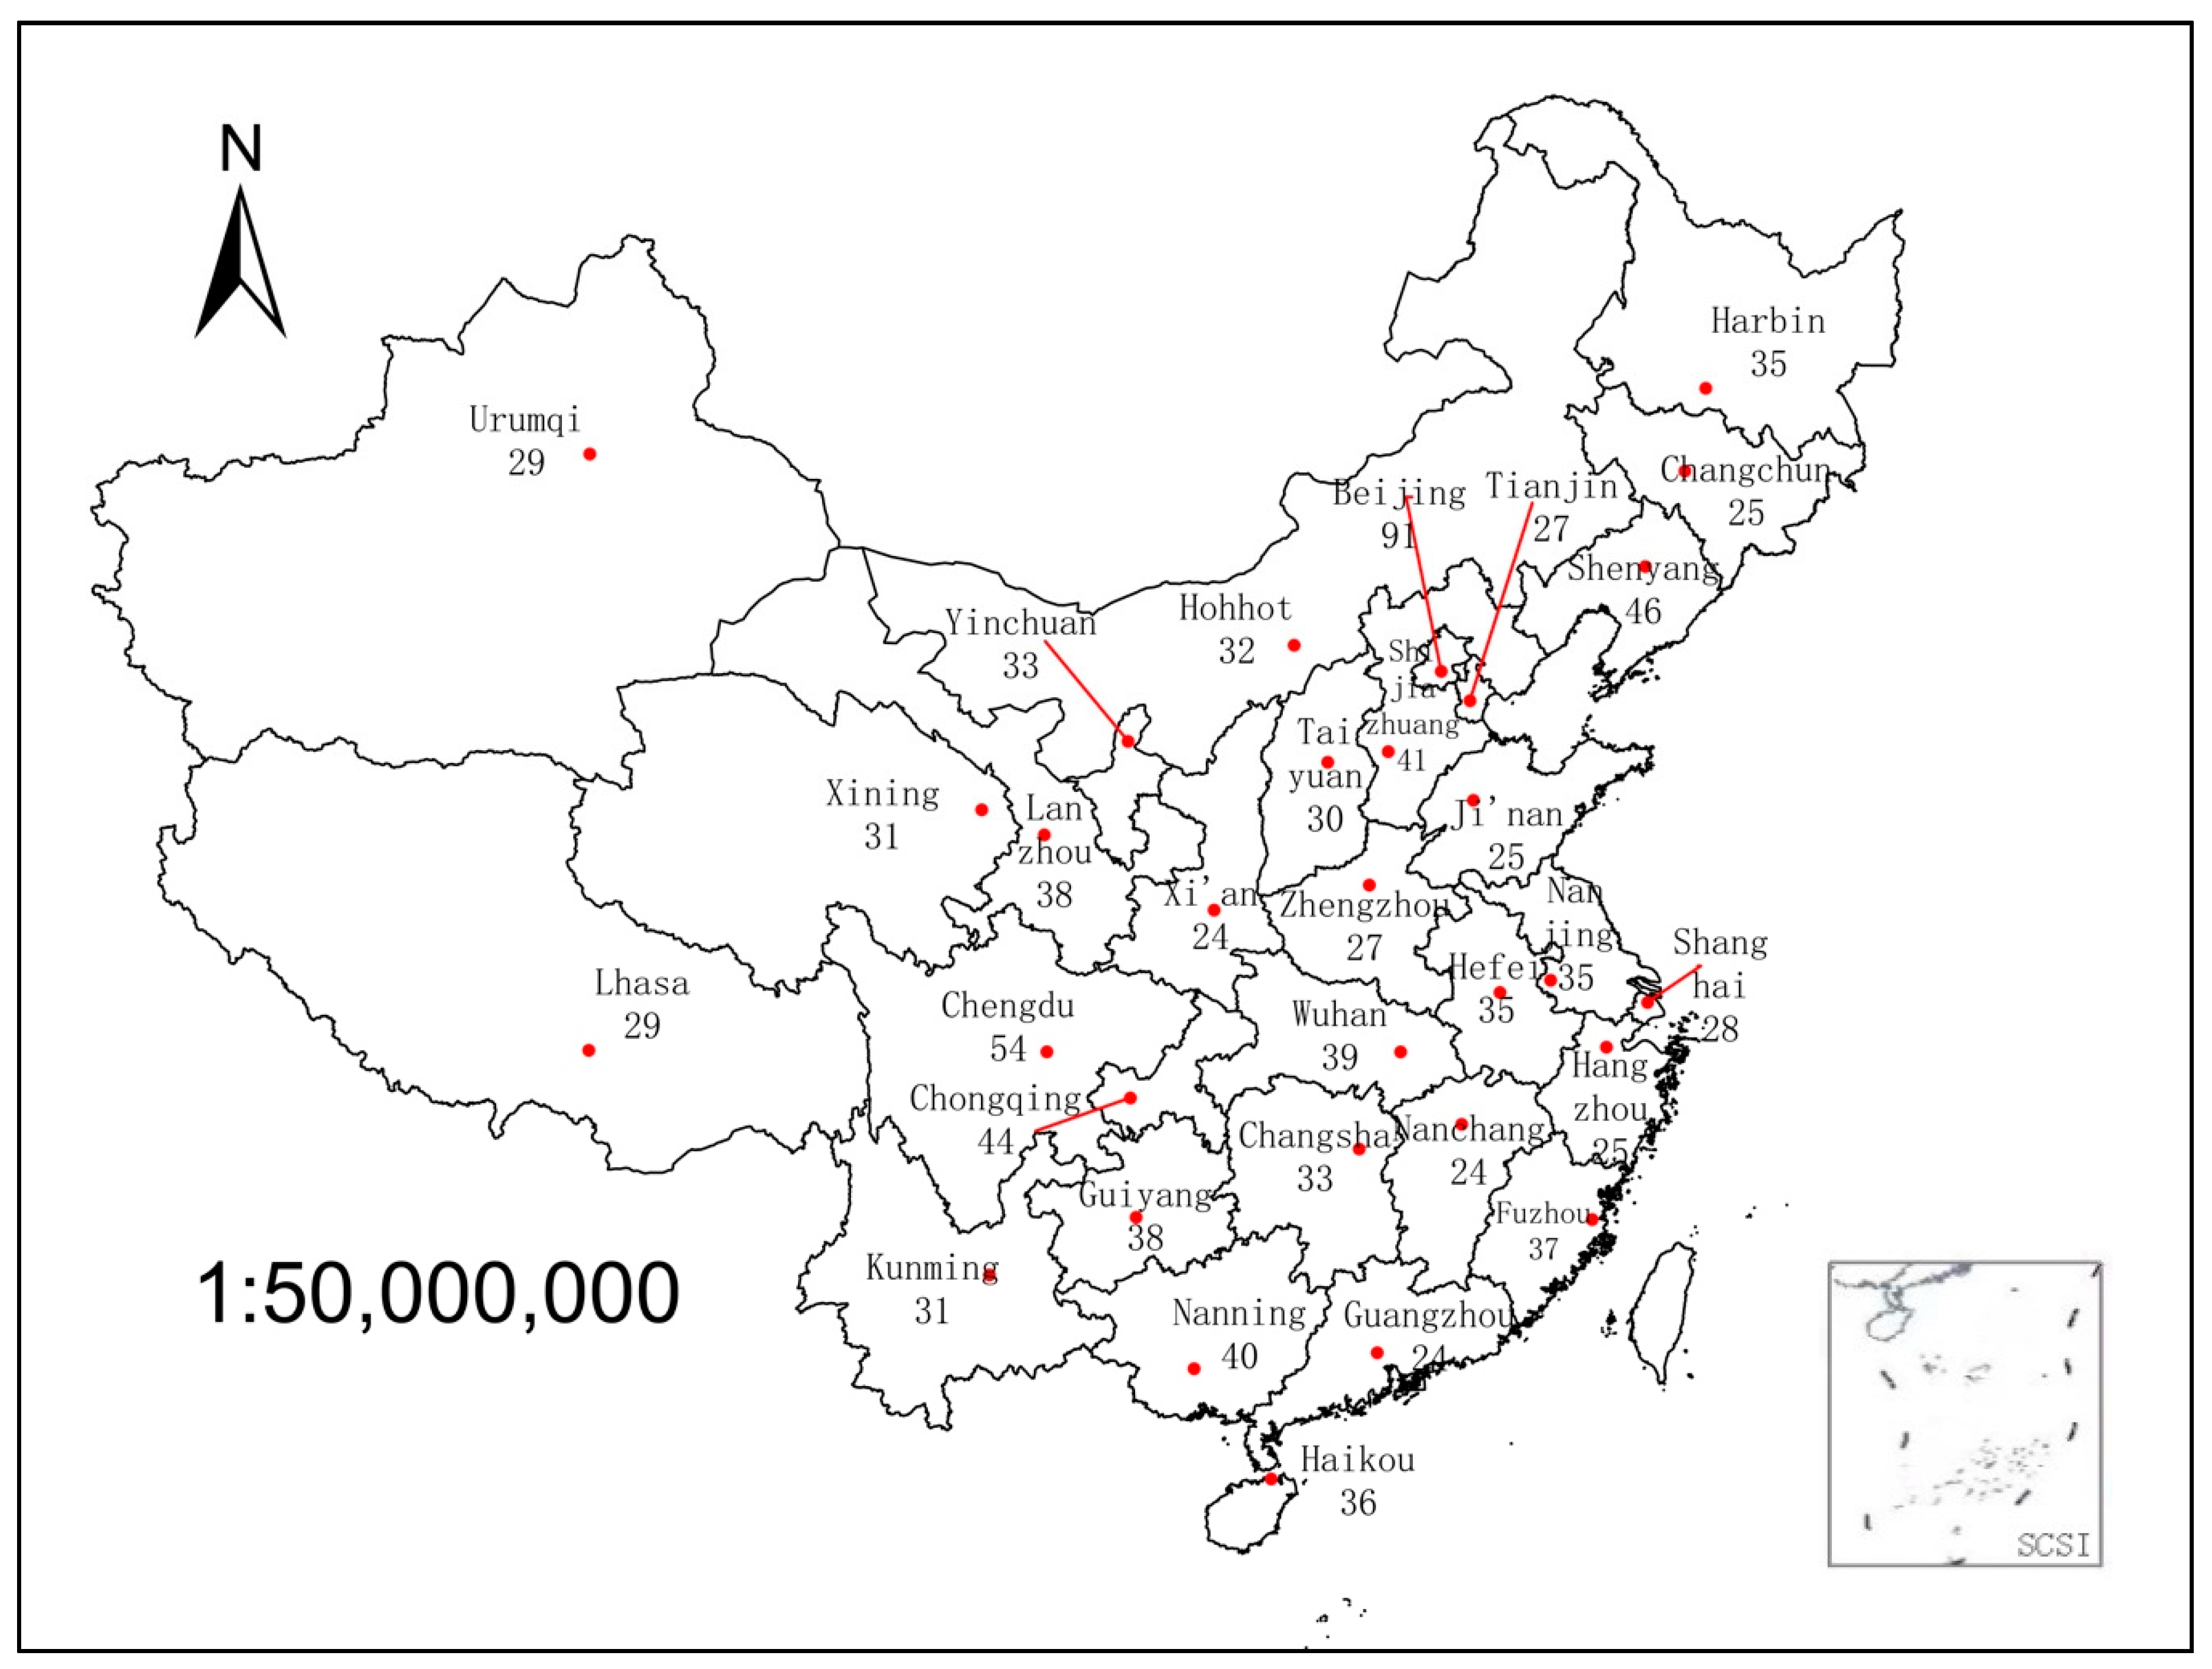
3.2. Threshold of SS for Forestry Application, Sn

As shown in Figure 3, the Sns values of eight metals differed within the same PCC, while those of certain metals differed among 31 PCCs. By screening the smallest three Sns values for each PCC, we found that two of them appeared for Cd and Zn, while the other ones appeared for Cu, except for As in Xi’an and Hg in Beijing, Shijiazhuang, and Hohhot. Based on the Sns values, the priority control metals were Cd (27 cities), Cu (Shanghai and Guangzhou), Hg (Beijing), and Zn (Tianjin).
The Sns values of As varied from 116 t·ha−1·y−1 in Xi’an to 1292 t·ha−1·y−1 in Chongqing. In 11 PCCs, the values exceeded 592 t·ha−1·y−1, while in Shenyang, Wuhan, and Fuzhou, the values exceeded 1000 t·ha−1·y−1. In Hangzhou, the Sn value was below 200 t·ha−1·y−1.
The Sns of Cd ranged between 7 and 91 t·ha−1·y−1, with 50% of the Sns values being above the average of 35 t·ha−1·y−1. In Lanzhou and Shanghai, the Sns values were above 70 t·ha−1·y−1, while in Changsha and Kunming, they were below 10 t·ha−1·y−1.
The Sns of Cr ranged from 152 to 958 t·ha−1·y−1, and 50% of the Sns values were above the average of 397 t·ha−1·y−1. In Hohhot (628 t·ha−1·y−1) and Nanjing (958 t·ha−1·y−1), the values were above 600 t·ha−1·y−1, while they were below 200 t·ha−1·y−1 in Tianjin, Hangzhou, Changsha, Wuhan, Xi’an, Guangzhou, and Fuzhou.
The minimum Sn of Cu was 18 t·ha−1·y−1 in Guangzhou, while the maximum level was 301 t·ha−1·y−1 in Lanzhou; one-third of the Sns values were above the average of 104 t·ha−1·y−1. Nanjing’s Sn value was 263 t·ha−1·y−1, while those of the other cities were above 40 t·ha−1·y−1 and below 200 t·ha−1·y−1.
For Hg, the Sns values varied from 42 t·ha−1·y−1 in Beijing to 759 t·ha−1·y−1 in Guiyang, with one-third of the values being higher than the average 305 t·ha−1·y−1. The Sns values in Shanghai and Lanzhou had Hg levels of 604 and 5221 t·ha−1·y−1, respectively, while the levels were above 400 t·ha−1·y−1 in Urumqi, Ji’nan, and Lhasa. Only Beijing’s Sn value was below 100 t·ha−1·y−1.
The Sns values of Ni ranged between 216 and 2582 t·ha−1·y−1, with an average of 728 t·ha−1·y−1. The values were above 1000 t·ha−1·y−1 in Hohhot (1035 t·ha−1·y−1), Shijiazhuang (1044 t·ha−1·y−1), Lhasa (1449 t·ha−1·y−1), Yinchuan (1711 t·ha−1·y−1), Urumqi (1747 t·ha−1·y−1), and Lanzhou (2582 t·ha−1·y−1) and below 300 t·ha−1·y−1 in Chengdu, Hangzhou, and Guangzhou.
The Sns levels of Pb ranged from 143 to 1522 t·ha−1·y−1 (average 439 t·ha−1·y−1) and were above 600 t·ha−1·y−1 in Hohhot (613 t·ha−1·y−1), Zhengzhou (672 t·ha−1·y−1), Shanghai (718 t·ha−1·y−1), Nanjing (881 t·ha−1·y−1), and Lanzhou (1522 t·ha−1·y−1). In Guangzhou, Changsha, Shenyang, and Fuzhou, the Sns values were between 140 and 200 t·ha−1·y−1.
The minimum and maximum Sns levels of Zn were 36 t·ha−1·y−1 in Wuhan and 216 t·ha−1·y−1 in Lanzhou, respectively, with an average of 95 t·ha−1·y−1. The remaining Sns levels ranged between 50 and 100 t·ha−1·y−1.

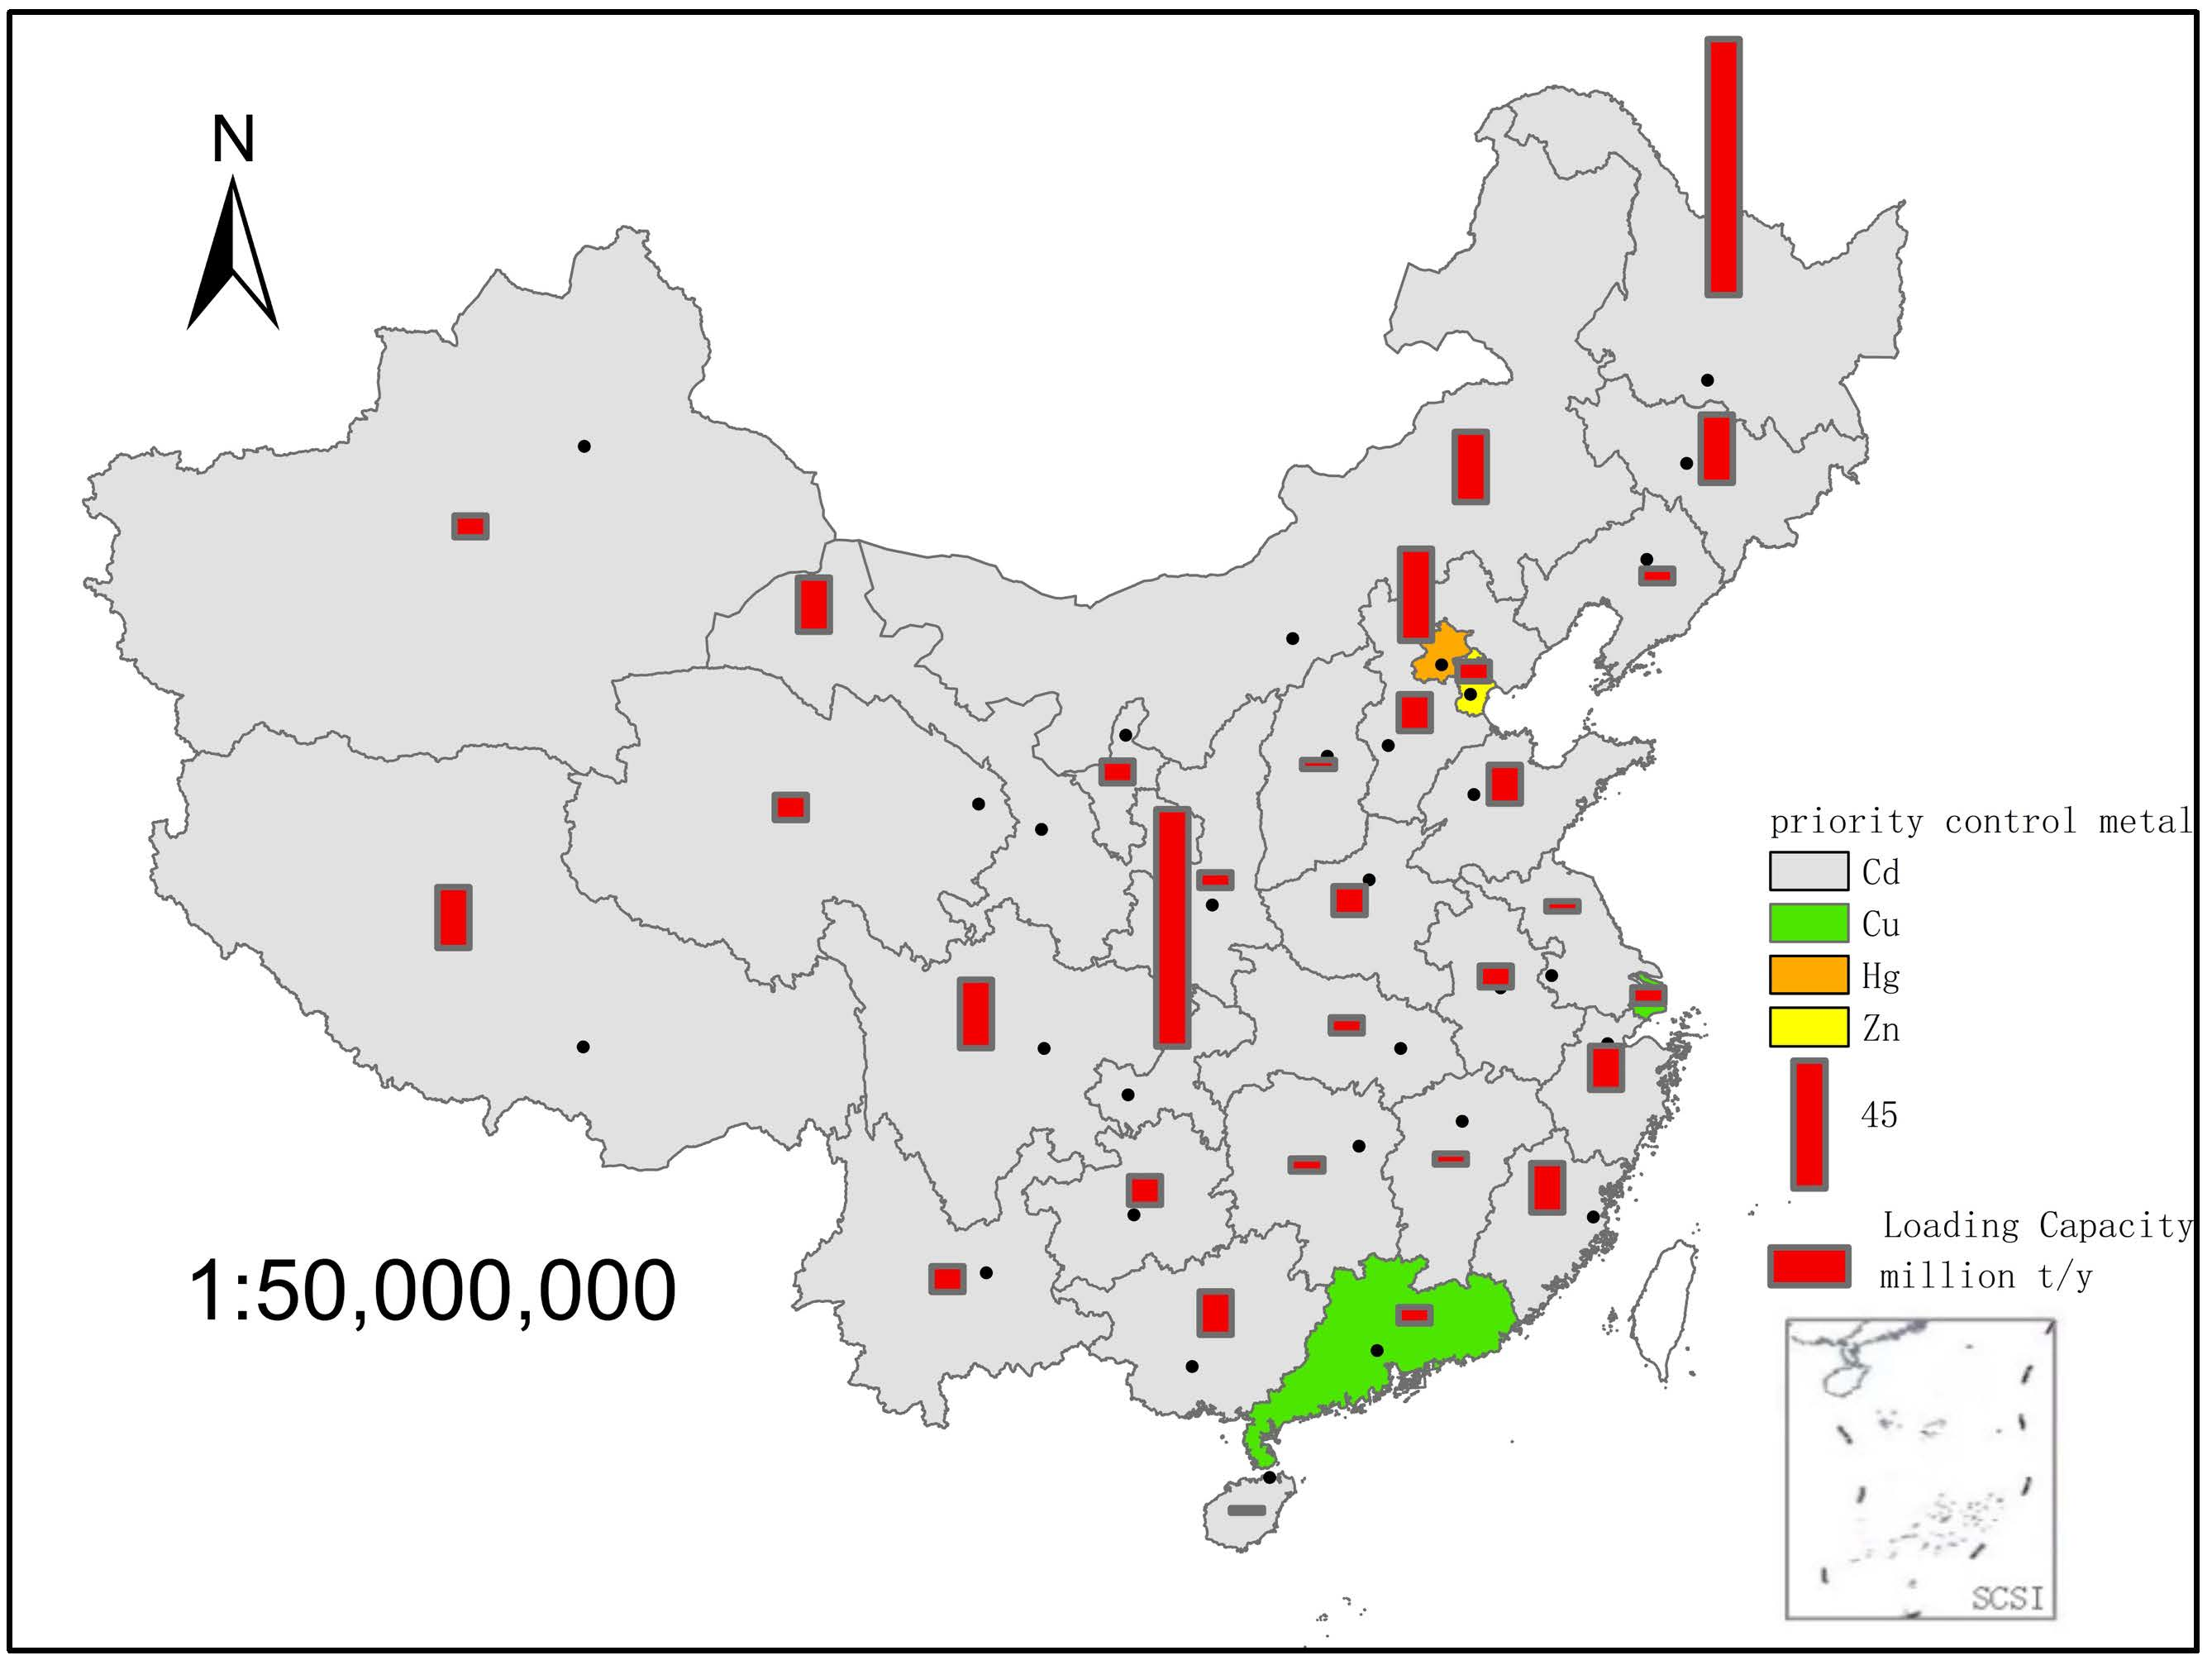
3.3. Loading Capacity of SS for Forestry Application

The Smins varied from 7 to 91 t·ha−1·y−1, with an average of 33 t·ha−1·y−1 in 31 PCCs, distributed between 10 and 50 t·ha−1·y−1 and accounting for 80% (Table 2). Among them, the Smins of 50% of the PCCs were higher than 30 t·ha−1·y−1 (CJ-T 362-2011). The Smin of Lanzhou was 91 t·ha−1·y−1, followed by those of Tianjin (62 t·ha−1·y−1) and Hohhot, Shanghai, and Yinchuan, with values of 57, 57, and 55 t·ha−1·y−1, respectively. There were five and six PCCs with Smin values from 40 to 50 t·ha−1·y−1 and 30 to 40 t·ha−1·y−1, respectively. In seven PCCs, the values ranged from 20 to 30 t·ha−1·y−1, including Shijiazhuang, Chongqing, and Wuhan. In Taiyuan, Haikou, Guangzhou, Nanning, Hangzhou, Shenyang, and Xi’an, the Smin values were below 20 t·ha−1·y−1, while those of Kunming and Changsha were 9 and 7 t·ha−1·y−1, respectively.
The forest areas in the 31 PCCs varied from 8.76 × 10⁴ (Haikou) to 374 × 104 ha (Chongqing), with an average of 59.6 × 10⁴ ha. Most AFs in the PCCs were between 10 × 104 and 80 × 104 ha. Harbin had the second largest forest area of 244 × 104 ha. In three PCCs, namely Kunming, Nanning, and Hangzhou, the forest area was above 100 × 104 ha. In Beijing, Fuzhou, Changsha, Changchun, Lhasa, Chengdu, and Shijiazhuang, the forest area ranged from 50 × 104 to 80 × 104 ha. Half of the forest areas were between 20 × 104 and 50 × 104 ha, while in Haikou, this area accounted for less than 10 × 104 ha.
The loading capacities varied from 1.6 million t·y−1 (Haikou) to 90.2 million t·y−1 (Harbin), with an average of 16.4 million t·y−1 in 31 PCCs; the total loading capacity reached 507 million t·y−1. Chongqing had the second largest loading capacity, equaling 83.4 million t·y−1. Beijing’s loading capacity was slightly above 30 million t·y−1. In Hohhot, Changchun, Chengdu, and Lhasa, loading capacities were between 20 and 30 million t·y−1, while in the following eight PCCs, the loading capacities were over 10 million t·y−1: Lanzhou, Fuzhou, Hangzhou, Nanning, Jinan, Shijiazhuang, Zhengzhou, and Guiyang. The PCCs with loading capacities below 10 million t·y−1 accounted for 50%. Tianjin’s, Shanghai’s, and Guangzhou’s loading capacities were 6.9, 5.9, and 5.8 million t·y−1, respectively. Loading capacities were also lower than 5 million t·y−1 in Changsha, Nanchang, Nanjing, and Taiyuan.

4. Discussion

The application of sewage sludge in forestry is common in several countries around the world [46]. In so-called “sludge landscaping”, treated sludge is applied to cultivated soil, as a soil amendment, and to urban or suburban woodland as organic fertilizer (including municipal green belts, woodlands, grasslands, parks, seedling bases, highway isolation zones, stadiums, etc.), promoting tree growth and improving the ornamental quality of flowers. In the US, municipal sludge is widely used in gardening and applied to parks, grasslands, and ornamental woodlands. China has also started to apply sewage sludge in landscaping, and sewage sludge treatment and disposal in Beijing, Shanghai, and Guangzhou have received increased attention [47]. So far, several studies have dealt with the responses of the soil–forestry systems to the application of sewage sludge. For example, in a greenhouse pot experiment, a mix of sewage sludge and garden waste compost changed the form of metals in the soil [48]. Wang et al. [49] analyzed the effects of applying excess sludge of the Shenyang North Sewage Treatment Plant to grassland and showed that the organic matter content in the soil increased by 12.79–80.80%, the biomass of the grassland increased, and the color of the grass became more intense. Field experiments along the Haitun Expressway have shown that sludge and garbage compost can be used as additives for slope greening [50].
There are, however, only a few reports on the threshold values of metals in SS for forestry application. According to previously established guidelines, the amount of sewage sludge should not exceed 30 t·ha−1·y−1, and continuous application should be limited to 15 years (CJ/T 362-2011) [38]. In our study, the average Smin of SS for forestry application was 32.14 t·ha−1·y−1. However, we observed considerable regional differences among different PCCs. Generally, the Smin values in the southern PCCs were lower than those in the northern ones, mainly because the risk screening values for soil contamination of Cd are lowest (0.3 mg·kg−1) in acidic soil. They also have higher Cd contents in soil and SS, in addition to the smallest risk screening values, resulting in levels for Changsha and Kunming below 10 t·ha−1·y−1. In Guiyang, the Cd levels in soil and SS were closer to those for Changsha; however, the Smin value was 25.76 kg·ha−1·y−1 due to the risk screening values of alkaline soil. The Cd contents in soil and SS were low and the risk screening value was high; all three factors lead to the highest Smin level in Lanzhou. Risk screening values for soil contamination are determined by acid-base properties. To increase the Smin, we can start by improving the contents of metals in the soil and reducing the metals in SS.
To evaluate the loading capacity, we sorted out the quantity of treated dry SS (Q) of each PCC in 2017 (Figure 4). The larger the multiple between loading capacity and Q, the greater the potential of SS for forestry application in this city. The Qs varied from 0.20 × 10⁴ to 31.43 × 10⁴ t, except for Beijing (137.25 × 10⁴ t), and the total Q was up to 404.40 × 10⁴ t. The total loading capacity reached 505.71 million t·y−1, being 125 times as high as the total Q, suggesting a great potential of SS for forestry application. Lhasa’ loading capacity was 21.50 × 10⁴ million t·y−1, and Q was 0.20 × 10⁴ t, suggesting that the former was far superior to the latter. The loading capacity in Harbin was up to 1000 times higher than its Q. There were four PCCs with a loading capacity more than 500 times higher as their Qs, namely Xining (933.67 times), Fuzhou (792.71 times), Changchun (621.86 times), and Chongqing (575.41 times). The times varied from 100 to 500 in 12 PCCs, including Hohhot, Urumqi, Jinan, Chengdu, and Shijiazhuang. Loading capacities were between 80 to 100 times higher than Qs in Zhengzhou, Xi’an, and Wuhan, while the loading capacities of Tianjin and Hangzhou were about 60 times higher than their corresponding Qs. In Guangzhou, Haikou, Beijing, Changsha, and Shanghai, the times were 28.75, 24.01, 23.68, 20.40, and 14.54, respectively.
The loading capacity depended on two factors, Smin and AF. Determining these factors enables us to put forward more precise suggestions for each PCC. In Chongqing and Harbin, the high loading capacities were attributed to their largest forest areas. Beijing’ loading capacity was the third largest because of its higher Smin and AF values. Loading capacities were similar in Hohhot, Changchun, and Chengdu (about 24 million t·y−1), but Hohhot’s and Chengdu’s capacities were a factor of their Smin, while Changchun’s capacity was accounted for by its AF. Lhasa’s loading capacity was above 20 million t·y−1, mainly because of its high Smin and AF values. The loading capacity in Lanzhou was 19.1 million t·y−1, although its Smin was the highest. Loading capacities over 15 million t·y−1 were attributed to high AFs in Fuzhou, Hangzhou, and Nanning. Tianjin and Yinchuan had the second and the fourth largest Smin, respectively, but their AFs were slightly over 10 × 104 ha, which resulted in loading capacities of 6.9 and 7.7 million t·y−1, respectively. By comparison, Shanghai’s and Changsha’s loading capacities were about 4 million t·y−1, caused by the Smin and AF values, respectively. Haikou had the smallest AF, resulting in the lowest loading capacity.

5. Conclusions

Sewage sludge contains large amounts of organic matter that can improve forest soil structure and increase soil fertility, promoting plant growth. However, excessive use of SS will cause pollution to forest land. In this sense, we calculated the thresholds for the application of sewage sludge in forestry in China for the first time, considering an adequate application dose for 31 provincial capital cities. The loading capacities differed significantly among the PCCs, making it necessary to formulate specific standards for each area. The Smin values varied from 7 to 91 t·ha1·y1, with an average of 33 t·ha1·y1 in 31 PCCs; in 50% of the PCCs, the values were higher than 30 t·ha1·y1 (CJ-T 362-2011). The priority control metals were Cu in Shanghai and Guangzhou, Hg in Beijing, Zn in Tianjin, and Cd in other cities; such information facilitates the development of management strategies for the safe application of sewage sludge in forestry. Sewage sludge shows considerable potential in forestry, based on the relatively high loading capacities, albeit with differences among the different PCCs. Based on this, it is inevitable that for each region, specific sludge disposal policies are formulated. The presented results provide basic data and technical guidance for forestry application.

Supplementary Materials

The following are available online at https://www.mdpi.com/2071-1050/12/18/7551/s1, Table S1: The data resource of metal in Provincial capital city. Table S2: The descriptive statistics of baseline and background value in provincial capital city.

Author Contributions

The study was conceived and designed by X.Z. Experiments were conducted by J.Z. and Y.L. X.Z. analyzed the data with the support of X.G. All authors reviewed and revised the manuscript to its final form. The entire study was conducted under the supervision of T.Z. All authors have read and agreed to the published version of the manuscript.

Funding

This research was funded by [Science and Technology Committee of Beijing, grant number [Z151100002115006] for providing funding for this study.

Acknowledgments

We would also like to thank the anonymous reviewers for their helpful comments and suggestions.

Conflicts of Interest

The authors declare no conflict of interest.

References

  1. Yang, J.; Lei, M.; Chen, T.; Gao, D.; Zheng, G.; Guo, G.; Lee, D. Current status and developing trends of the contents of heavy metals in sewage sludges in China. Front. Environ. Sci. Eng. 2014, 5, 719–728. [Google Scholar] [CrossRef]
  2. Wang, M. Land application of sewage sludge in China. Sci. Total Environ. 1997, 197, 149–160. [Google Scholar] [CrossRef]
  3. Fytili, D.; Zabaniotou, A. Utilization of sewage sludge in EU application of old and new methods a review. Renew. Sustain. Energy Rev. 2008, 1, 116–140. [Google Scholar] [CrossRef]
  4. Larsen, T.A.; Hoffmann, S.; Luthi, C.; Truffer, B.; Maurer, M. Emerging solutions to the water challenges of an urbanizing world. Science 2016, 352, 928–933. [Google Scholar] [CrossRef]
  5. Wang, X.; Daigger, G.; Vries, M.; Ckroeze, C.; Yang, M.; Ren, N.; Liu, J.; Butler, D. Impact hotspots of reduced nutrient discharge shift across the globe with population and dietary changes. Nat. Commun. 2019, 10, 2627. [Google Scholar] [CrossRef] [PubMed] [Green Version]
  6. Ministry of Ecology and Environment of the People’s Republic of China. National Eco-Environment Bulletin; Ministry of Ecology and Environment of the People’s Republic of China: Beijing, China, 2017.
  7. Zhu, R.; Wu, M.; Yang, J. Mobilities and leachabilities of heavy metals in sludge with humus soil. J. Environ. Sci. 2011, 23, 247–254. [Google Scholar] [CrossRef]
  8. Ashraf, M.A.; Mahmood, K.; Yusoff, I.; Qureshi, A.K. Chemical constituents of cenchrus ciliaris L. from the cholistan desert, pakistan. Arch. Biol. Sci. 2013, 4, 1473–1478. [Google Scholar] [CrossRef]
  9. Kominko, H.; Gorazda, K.; Wzorek, Z. Potentiality of sewage sludge-based organo-mineral fertilizer production in poland considering nutrient value, heavy metal content and phytotoxicity for rapeseed crops. Environ. Res. 2019, 248, 109283. [Google Scholar] [CrossRef]
  10. Czyżyk, F.; Rajmund, A. Influence of agricultural utilization of sludge and compost from rural wastewater treatment plant on nitrogen passes in light soil. Pol. J. Chem. Technol. 2014, 1, 1–6. [Google Scholar] [CrossRef] [Green Version]
  11. Siebielec, G.; Siebielec, S.; Lipski, D. Long-term impact of sewage sludge, digestate and mineral fertilizers on plant yield and soil biological activity. J. Clean. Prod. 2018, 187, 372–379. [Google Scholar] [CrossRef]
  12. Mohamed, B.; Olivier, G.; François, G.; Laurence, A.H.; Bourgeade, P.; Badr, A.-S.; Lotfi, A. Sewage sludge as a soil amendment in a Larix decidua plantation: Effects on tree growth and floristic diversity. Sci. Total Environ. 2018, 621, 291–301. [Google Scholar] [CrossRef] [PubMed]
  13. Denaix, L.; Thomas-Chéry, A.L.; Balet, J.; Benbrahim, M.; Carnus, J.M. Effects of municipal sewage sludge application on soil and purple moor-grass (molinia caerulea) contamination by metals in a maritime pine forest. Water Air Soil Poll. 2011, 219, 239–249. [Google Scholar] [CrossRef]
  14. Roy, M.; Couillard, D. Metal leaching following sludge application to a deciduous forest soil. Water Res. 1998, 5, 1642–1652. [Google Scholar] [CrossRef]
  15. Khadhar, S.; Sdiri, A.; Chekirben, A.; Azouzi, R.; Charef, A. Integration of sequential extraction, chemical analysis and statistical tools for the availability risk assessment of heavy metals in sludge amended soils. Environ. Pollut. 2020, 263, 114543. [Google Scholar] [CrossRef]
  16. Moffat, A.J.; Matthews, R.W.; Hall, J.E. The effects of sewage sludge on growth and foliar and soil chemistry in pole-stage corsican pine at ringwood forest, dorset UK. Can. J. For. Res. 1991, 21, 902–909. [Google Scholar] [CrossRef]
  17. Sauvé, S.; Manna, S.; Turmel, M.C.; Roy, A.G.; Courchesne, F. Solid-solution partitioning of Cd, Cu, Ni, Pb, and Zn in the organic horizons of a forest soil. Environ. Sci. Technol. 2003, 22, 5191–5196. [Google Scholar] [CrossRef] [PubMed]
  18. Benbrahim, M.; Denaix, L.; Thomas, A.L.; Balet, J.; Carnus, J.M. Metal concentrations in edible mushrooms following municipal sludge application on forest land. Environ. Poll. 2006, 3, 847–854. [Google Scholar] [CrossRef] [PubMed]
  19. Rutgersson, C.; Ebmeyer, S.; Lassen, S.B.; Karkman, A.; Fick, J.; Kristiansson, K.; Brandt, K.K.; Flach, C.-F.; Larsson, D.G.J. Long-term application of swedish sewage sludge on farmland does not cause clear changes in the soil bacterial resistome. Environ. Int. 2020, 137, 105399. [Google Scholar] [CrossRef] [PubMed]
  20. Khadhar, S.; Higshi, T.; Hamdi, H.; Matsuyama, S.; Charef, A. Distribution of 16 EPA-priority polycyclic aromatic hydrocarbons (PAHs) in sludges collected from nine Tunisian wastewater treatment plants. J. Hazard. Mater. 2010, 183, 98–102. [Google Scholar] [CrossRef]
  21. Nogueira, T.A.R.; Melo, W.J.; Fonseca, I.M.; Marcussi, S.A.; Melo, G.M.P.; Marques, M.O. Fractionation of Zn, Cd and Pb in a tropical soil after nine-year sewage sludge applications. Pedosphere 2010, 20, 545–556. [Google Scholar] [CrossRef]
  22. Riaz, U.; Murtaza, G.; Saifullah, U.; Farooq, M. Influence of different sewage sludges and composts on growth, yield, and trace elements accumulation in rice and wheat. Land Degrad. Dev. 2018, 5, 1343–1352. [Google Scholar] [CrossRef]
  23. Bourioug, M.; Gimbert, F.; Alaoui-Sehmer, L.; Benbrahim, M.; Badot, P.M.; Alaoui-Sosse, B.; Aleva, L. Effects of sewage sludge amendment on snail growth and trace metal transfer in the soil-plant-snail food chain. Environ. Sci. Poll. Res. 2015, 22, 17925–17936. [Google Scholar] [CrossRef]
  24. Müller da Silva, P.H.; Poggiani, F.; Laclau, J.P. Applying sewage sludge to eucalyptus grandis plantations: Effects on biomass pro-duction and nutrient cycling through litterfall. Appl. Environ. Soil Sci. 2011, 1, 101–108. [Google Scholar]
  25. Zhang, T. Studies on the Sludge Application to Forest Land. Master’s Thesis, Northwestern Agricultural University, Shaanxi, China, 1992. [Google Scholar]
  26. Wang, X.; Chen, T.; Ge, Y.; Jia, Y. Studies on land application of sewage sludge and its limiting factors. J. Hazard Mater. 2008, 160, 554–558. [Google Scholar] [CrossRef]
  27. Wang, H.L.; Wang, C.J.; Fan, C.; Ma, M.P.; Lin, Z.K.; Wang, W.W.; Xu, Z.T.; Wang, X.D. Modification to degradation of hexazinone in forest soils amended with sewage sludge. J. Hazard. Mater. 2012, 199–200, 96–104. [Google Scholar] [CrossRef]
  28. Kacprzaka, M.; Neczaja, E.; Fijałkowskia, K.; Grobelaka, A.; Grossera, A.; Worwaga, M.; Rorata, A.; Brattebob, H.; Almåsc, A.; Singhc, B.R. Sewage sludge disposal strategies for sustainable development. Environ. Res. 2017, 156, 36–42. [Google Scholar] [CrossRef]
  29. Ministry of Environmental Protection. A National Survey of Soil Pollution Bulletin; Ministry of Environmental Protection: Beijing, China, 2014.
  30. Sterritt, R.M.; Lester, J.N. Concentrations of heavy metals in forty sewage sludges in England. Water Air. Soil. Poll. 1980, 1, 125–131. [Google Scholar] [CrossRef]
  31. Ou Yang, X.H.; Cui, J.; Tong, Q. Effects of long-term application of sewage sludge on soils and crops in agriculture. Agro-Environ. Prot. 1994, 13, 271–274. [Google Scholar]
  32. Li, Y.X.; Wang, M.J.; Wang, J.S. Heavy metals in contemporary Chinese sewage sludges. Toxicol. Environ. Chem. 1999, 1–2, 229–240. [Google Scholar] [CrossRef]
  33. Li, J.J. The Effect of Weathered Coal Activated by Ultrasonic on the Forms of Mercury in Soil and Soil Enzyme Activity; Shandong Agriculture University: Shandong, China, 2014. [Google Scholar]
  34. Zhang, X.X.; Zha, T.G.; Guo, X.P.; Meng, G.X.; Zhou, J.X. Spatial distribution of metal pollution of soils of Chinese provincial capital cities. Sci. Total Environ. 2018, 643, 1502–1513. [Google Scholar] [CrossRef]
  35. Steyn, C.E.; Herselman, J.E. Trace element concentrations in soils under different land uses in Mpumalanga province, South Africa, South African. J. Plant Soil. 2006, 4, 230–236. [Google Scholar]
  36. Contina, M.; Goib, D.; Nobility, M. Land application of aerobic sewage sludge does not impair methane oxidation rates of soils. Sci. Total Environ. 2012, 20, 10–18. [Google Scholar] [CrossRef] [PubMed]
  37. Ministry of Housing and Urban and Rural Construction in People’s Republic of China. Disposal of Sludge from Municipal Wastewater Treatment Plants-Quality of Sludge Used in Forestland (CJ/T 362-2011); Ministry of Housing and Urban and Rural Construction in People’s Republic of China: Beijing, China, 2011.
  38. Mcgrath, S.P.; Chang, A.C.; Pang, A.L.; Witter, E. Land application of sewage sludge: Scientific perspectives of heavy metal loading limits in Europe and the United States. Environ. Rev. 1994, 2, 108–118. [Google Scholar] [CrossRef]
  39. Ministry of Housing and Urban and Rural Construction in People’s Republic of China. Statistical Yearbook on Urban Construction; Ministry of Housing and Urban-Rural Construction of the People’s Republic of China: Beijing, China, 2017.
  40. Cheng, J.M. Study on Soil-Environmental Capacity in Main Soil-Types of Shandong Province; Shandong Normal University: Shandong, China, 2009. [Google Scholar]
  41. Yi, S.Z. Application of soil environment background values in calculation of soil capacity. Shanghai Environ. Sci. 1992, 4, 34–36. [Google Scholar]
  42. Yu, G.J.; Cheng, J.M.; Wang, Z.X.; Mu, J.B.; Jing, L.X. Soil-Environmental capacity in different vegetative types in Shandong province. Chin. J. Soil Sci. 2009, 2, 367–368. [Google Scholar]
  43. Ministry of Ecological Environment Protection of People’s Republic of China. Environmental Quality Standard for Soils Environmental Quality Standard for Soils (GB 15618–2018); Ministry of Housing and Urban-Rural Construction of the People’s Republic of China: Beijing, China, 2018.
  44. Environmental Engineering Assessment Center of State Environmental Protection Administration. Technical Methods of Environmental Impact Assessment; Environmental Science Press: Beijing, China, 2007. [Google Scholar]
  45. Ministry of Housing and Urban and Rural Construction in People’s Republic of China. Disposal of Sludge from Municipal Wastewater Treatment Plant-Quality of Sludge used in Garden or Park (GB23486-2009); Ministry of Housing and Urban-Rural Construction of the People’s Republic of China: Beijing, China, 2009.
  46. Oberg, G.; Mason-Renton, S.A. On the limitation of evidence-based policy: Regulatory narratives and land application of biosolids/sewage sludge in BC, Canada and Sweden. Environ. Sci. Policy 2018, 84, 88–96. [Google Scholar] [CrossRef]
  47. Kang, J.; Zheng, Z.Q. Status and prosper of sludge composting for urban greening. Energ. Conserve. Environ. Prot. 2007, 7, 33–34. [Google Scholar]
  48. Si, L.Q.; Chen, L.M.; Zheng, J.M.; Zhou, J.X.; Peng, X.W. Effects of mixed sewage sludge and garden waste composts on potting soil amendment. Pratacultural Sci. 2018, 1, 1–9. [Google Scholar]
  49. Wang, X.; Chen, T.; Jia, Y.F.; Ge, Y.H. Studies on land application of sewage sludge and its limiting factors. J. Hazard. Mater. 2008, 2, 554–558. [Google Scholar] [CrossRef]
  50. Duan, H.P.; Huang, J.M.; Cheng, W.Y. Application of sludge and garbage compost in highway slope greening. Highway 2008, 6, 204–207. [Google Scholar]
Figure 1. Amounts and distribution of data for each provincial capital city in China from 2006 to 2018.
Sustainability 12 07551 g001
Figure 2. Spatial distribution of metal concentrations of sewage sludge for 31 provincial capital cities.
Sustainability 12 07551 g002aSustainability 12 07551 g002b
Figure 3. Threshold levels of the different metals for sewage sludge application to forests in 31 provincial capital cities. Unit: t·ha−1·y−1, Note: Values in red represent thresholds for priority control metal, Smin.
Sustainability 12 07551 g003
Figure 4. Differences between loading capacity and quantity of treated dry sewage sludge.
Sustainability 12 07551 g004
Table 1. Risk screening values for soil and limits for sewage sludge (SS).
Unit: mg·kg−1
MetalRisk Screening Values for SoilLimits for SS
pH ≤ 5.55.5 < pH ≤ 6.56.5 < pH ≤ 7.5pH > 7.5<6.5≥6.5
As404030257575
Cd0.30.30.30.6520
Cr1501502002506001000
Cu50501001008001,00
Hg1.31.82.43.4515
Ni6070100190100200
Pb70901201703001000
Zn20020025030020004000
Note: Risk screening values for soil and limits for SS data were derived from GB 15618-2018 and GB/T 23486-2009, respectively.
Table 2. Loading capacities of sewage sludge in 31 provincial capital cities.
PCCSmin (t·ha−1·y−1)Forest Area (104 ha)Loading Capacity (Million t·y−1)
Harbin3724490.2
Chongqing2237483.4
Beijing4276.832.5
Hohhot5743.224.8
Changchun3863.124.0
Chengdu4355.023.8
Lasa3757.621.5
Lanzhou9120.919.1
Fuzhou2472.417.5
Hangzhou1411315.6
Nanning1410615.3
Ji’nan4828.213.6
Shijiazhuang2551.613.0
Zhengzhou4323.710.2
Guiyang2639.310.1
Kunming91039.1
Xining3624.58.9
Yinchuan5514.48.0
Hefei2333.17.7
Urumqi3720.97.7
Tianjin6211.16.9
Guangzhou1831.55.8
Xi’an1148.55.5
Wuhan2224.05.3
Shenyang1339.95.1
Changsha764.84.6
Shanghai4110.34.2
Nanchang2316.93.9
Nanjing3610.33.7
Taiyuan2016.13.2
Haikou198.81.6
Note: Forest area data were derived from publicly available information.

