Transport Models of Ammonium Nitrogen in Wastewater from Rare Earth Smelteries by Reverse Osmosis Membranes


Abstract
1. Introduction
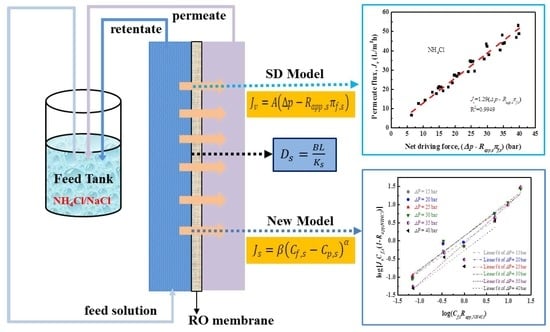
2. Theory
3. Materials and Methods
3.1. Wastewater Characteristics
3.2. Materials
3.3. Experimental Setup
3.4. Experimental RO Process
3.4.1. Synthetic Salt Solutions
3.4.2. Real Wastewater Treatment
3.4.3. Determination of Water and Salt Permeabilities
4. Results and Discussion
4.1. NH4Cl Removal Performance of RO Membrane
4.2. NaCl Removal Performance of RO Membrane
4.3. Transport Models for Water and Salt Flux
5. Conclusions
Author Contributions
Funding
Acknowledgments
Conflicts of Interest
References
- Hatje, V.; Bruland, K.W.; Flegal, A.R. Increases in Anthropogenic Gadolinium Anomalies and Rare Earth Element Concentrations in San Francisco Bay over a 20 Year Record. Environ. Sci. Technol. 2016, 50, 4159–4168. [Google Scholar] [CrossRef] [PubMed]
- Chen, J.Y.; Zhu, X.H.; Liu, G.; Chen, W.Q.; Yang, D.H. China’s rare earth dominance: The myths and the truths from an industrial ecology perspective. Resour. Conserv. Recycl. 2018, 132, 139–140. [Google Scholar] [CrossRef]
- Wang, L.S.; Huang, X.W.; Yu, Y.; Xiao, Y.F.; Long, Z.Q.; Cui, D.L. Eliminating ammonia emissions during rare earth separation through control of equilibrium acidity in a HEH(EHP)-Cl system. Green Chem. 2013, 15, 1889–1894. [Google Scholar] [CrossRef]
- Yin, S.H.; Chen, K.H.; Srinivasakannan, C.; Guo, S.H.; Li, S.W.; Peng, J.H.; Zhang, L.B. Enhancing recovery of ammonia from rare earth wastewater by air stripping combination of microwave heating and high gravity technology. Chem. Eng. J. 2018, 337, 515–521. [Google Scholar] [CrossRef]
- China Ministry of Environmental Protection, Emission Standards of Pollutants from Rare Earths Industry GB 26451-2011 (in Chinese), Beijing, China. Available online: http://www.mee.gov.cn/ywgz/fgbz/bz/bzwb/shjbh/swrwpfbz/201102/t20110210_200521.shtml (accessed on 1 October 2011).
- Huang, H.M.; Xiao, X.M.; Yan, B. Complex treatment of the ammonium nitrogen wastewater from rare-earth separation plant. Desalin. Water Treat. 2009, 8, 109–117. [Google Scholar] [CrossRef]
- Huang, H.M.; Xiao, X.M.; Yang, L.P.; Yan, B. Removal of ammonia nitrogen from washing wastewater resulting from the process of rare-earth elements precipitation by the formation of struvite. Desalin. Water Treat. 2010, 24, 85–92. [Google Scholar] [CrossRef]
- Li, Y.; Shi, S.Y.; Cao, H.B.; Wu, X.M.; Zhao, Z.J.; Wang, L.Y. Bipolar membrane electrodialysis for generation of hydrochloric acid and ammonia from simulated ammonium chloride wastewater. Water Res. 2016, 89, 201–209. [Google Scholar] [CrossRef]
- Malaeb, L.; Ayoub, G.M. Reverse osmosis technology for water treatment: State of the art review. Desalination 2011, 267, 1–8. [Google Scholar] [CrossRef]
- Pontié, M.; Charcosset, C. Seawater. Brackish Waters, and Natural Waters Treatment with Hybrid Membrane Processes. In Integrated Membrane Systems and Processes, 7th ed.; Basile, A., Charcosset, C., Eds.; John Wiley & Sons Ltd.: Hoboken, NJ, USA, 2016; pp. 165–192. [Google Scholar] [CrossRef]
- Zhang, L.N.; Xu, B.H.; Gong, J.D.; Bu, T.D. Membrane combination technic on treatment and reuse of high ammonia and salts wastewater in rare earth manufacture process. J. Rare Earths 2010, 28, 501–503. [Google Scholar] [CrossRef]
- Huang, H.M.; Fu, Z.; Xiao, X.M.; Yan, B. Study on treatment of rare-earth ammonium nitrogen wastewater by reverse osmosis(in Chinese). Chin. J. Environ. Eng. 2009, 3, 1443–1446. [Google Scholar]
- Chang, I.S.; Chung, C.M. Pollution prevention for manufacturing of ammonium chloride-an experimental study of wastewater recycling. Desalination 2000, 127, 145–153. [Google Scholar] [CrossRef]
- Bódalo, A.; Gómez, J.L.; Gómez, E.; León, G.; Tejera, M. Ammonium removal from aqueous solutions by reverse osmosis using cellulose acetate membranes. Desalination 2005, 184, 149–155. [Google Scholar] [CrossRef]
- Häyrynen, K.; Pongrácz, E.; Väisänen, V.; Pap, N.; Mänttäri, M.; Langwaldt, J.; Keiski, R.L. Concentration of ammonium and nitrate from mine water by reverse osmosis and nanofiltration. Desalination 2009, 240, 280–289. [Google Scholar] [CrossRef]
- Park, H.B.; Kamcev, J.; Robeson, L.M.; Elimelech, M.; Freeman, B.D. Maximizing the right stuff: The trade-off between membrane permeability and selectivity. Science 2017, 356, eaab0530. [Google Scholar] [CrossRef] [PubMed]
- Merten, U. Flow Relationships in Reverse Osmosis. Ind. Eng. Chem. Fundam. 1963, 2, 229–232. [Google Scholar] [CrossRef]
- Lonsdale, H.K.; Merten, U.; Riley, R.L. Transport properties of cellulose acetate osmotic membranes. J. Appl. Polym. Sci. 1965, 9, 1341–1362. [Google Scholar] [CrossRef]
- Wijmans, J.G.; Baker, R.W. The solution-diffusion model: A review. J. Membr. Sci. 1995, 107, 1–21. [Google Scholar] [CrossRef]
- Paul, D.R. Reformulation of the solution-diffusion theory of reverse osmosis. J. Membr. Sci. 2004, 241, 371–386. [Google Scholar] [CrossRef]
- Geise, G.M.; Paul, D.R.; Freeman, B.D. Fundamental water and salt transport properties of polymeric materials. Prog. Polym. Sci. 2014, 39, 1–42. [Google Scholar] [CrossRef]
- Hung, L.Y.; Lue, S.J.; You, J.H. Mass-transfer modeling of reverse-osmosis performance on 0.5–2% salty water. Desalination 2011, 265, 67–73. [Google Scholar] [CrossRef]
- Zaidi, S.M.J.; Fadhillah, F.; Khan, Z.; Ismail, A.F. Salt and water transport in reverse osmosis thin film composite seawater desalination membranes. Desalination 2015, 368, 202–213. [Google Scholar] [CrossRef]
- Zhou, W.; Somh, L. Experimental study of water and salt fluxes through reverse osmosis membranes. Environ. Sci. Technol. 2005, 39, 3382–3387. [Google Scholar] [CrossRef] [PubMed]
- Akin, O.; Temelli, F. Probing the hydrophobicity of commercial reverse osmosis membranes produced by interfacial polymerization using contact angle, XPS, FTIR, FE-SEM and AFM. Desalination 2011, 278, 387–396. [Google Scholar] [CrossRef]
- Mai, Z.H.; Butin, V.; Rakib, M.; Zhu, H.C.; Rabiller-Baudry, M.; Couallier, E. Influence of bulk concentration on the organization of molecules at a membrane surface and flux decline during reverse osmosis of an anionic surfactant. J. Membr. Sci. 2016, 499, 257–268. [Google Scholar] [CrossRef]
- Mai, Z.H.; Gui, S.L.; Fu, J.Q.; Jiang, C.; Ortega, E.; Zhao, Y.; Tu, W.Q.; Mickols, W.; Bruggen, B.V. Activity-derived model for water and salt transport in reverse osmosis membranes: A combination of film theory and electrolyte theory. Desalination 2019, 469, 114094. [Google Scholar] [CrossRef]
- Stevens, D.M.; Shu, J.Y.; Reichert, M.; Roy, A. Next-Generation Nanoporous Materials: Progress and Prospects for Reverse Osmosis and Nanofiltration. Ind. Eng. Chem. Res. 2017, 56, 10526–10551. [Google Scholar] [CrossRef]
- Yan, Z.Q.; Zeng, L.M.; Li, Q.; Liu, T.Y.; Matsuyama, H.; Wang, X.L. Selective separation of chloride and sulfate by nanofiltration for high saline wastewater recycling. Sep. Purif. Technol. 2016, 166, 135–141. [Google Scholar] [CrossRef]
- Kim, S.H.; Kwak, S.Y.; Suzuki, T. Positron annihilation spectroscopic evidence to demonstrate the flux-enhancement mechanism in morphology-controlled thin-film-composite (TFC) membrane. Environ. Sci. Technol. 2005, 39, 1764–1770. [Google Scholar] [CrossRef]
- Somrani, A.; Hamzaoui, A.H.; Pontie, M. Study on lithium separation from salt lake brines by nanofiltration (NF) and low pressure reverse osmosis (LPRO). Desalination 2013, 317, 184–192. [Google Scholar] [CrossRef]
- Houriez, C.; Real, F.; Vallet, V.; Mautner, M.; Masella, M. Ion hydration free energies and water surface potential in water nano drops: The cluster pair approximation and the proton hydration Gibbs free energy in solution. J. Chem. Phys. 2019, 151, 174504. [Google Scholar] [CrossRef]
- Mohamedou, E.O.; Suarez, D.B.P.; Vince, F.; Jaouen, P.; Pontie, M. New lives for old reverse osmosis (RO) membranes. Desalination 2010, 253, 62–70. [Google Scholar] [CrossRef]
- Pontie, M.; Diawara, C.K.; Rumeau, M. Streaming effect of single electrolyte mass transfer in nanofiltration: Potential application for the selective defluorination of brackish drinking waters. Desalination 2002, 151, 267–274. [Google Scholar] [CrossRef]
- Mickols, W. Substantial Changes in the Transport Model of Reverse Osmosis and Nanofiltration by Incorporating Accurate Activity Data of Electrolytes. Ind. Eng. Chem. Res. 2016, 55, 11139–11149. [Google Scholar] [CrossRef]
- Jang, E.S.; Mickols, W.; Sujanani, R.; Helenic, A.; Dilenschneider, T.J.; Kamcev, J.; Paul, D.R.; Freeman, B.D. Influence of Concentration Polarization and Thermodynamic Non-ideality on Salt Transport in Reverse Osmosis Membranes. J. Membr. Sci. 2019, 572, 668–675. [Google Scholar] [CrossRef]


| Concentration (mg/L) | pH | NH4+-N | COD | As3+ | Pb2+/4+ | Cl− |
|---|---|---|---|---|---|---|
| Real wastewater | 6.4 ± 0.1 | 1.14 × 10³ ± 39 | 46 ± 1.8 | 0.27 ± 0.008 | 0.15 ± 0.006 | 2.95 × 10³ ± 58 |
| Synthetic wastewater | 6.5 ± 0.1 | (0.1–40) × 103 | / | / | / | (0.1–40) × 103 |
| Indirect discharge standards | 6–9 | 50 | 100 | 0.1 | 0.2 | / |
| NH4Cl | NaCl | ||||
|---|---|---|---|---|---|
| Cf (g/L) | B (L/m2h) | R2 Value | Cf (g/L) | B (L/m2h) | R2 Value |
| 0.1 | 1.29 | 0.7886 | 0.1 | - | - |
| 0.5 | 2.02 | 0.4879 | 0.5 | 0.57 | 0.8650 |
| 1 | 0.86 | 0.7269 | 1 | 0.78 | 0.8855 |
| 5 | 0.93 | 0.5400 | 5 | 0.53 | 0.9666 |
| 10 | 1.05 | 0.8776 | 10 | 0.63 | 0.2095 |
| 20 | 1.62 | 0.9011 | 20 | 0.55 | 0.342 |
| 40 | 1.8707 | 0.8671 | 40 | 0.78 | 0.9876 |
| Operating Pressure (bar) | NH4Cl | NaCl | ||||
|---|---|---|---|---|---|---|
| α | β | R2 Value | α | β | R2 Value | |
| 15 | 0.84 | 1.00 | 0.9846 | 0.92 | 0.59 | 0.9882 |
| 20 | 0.91 | 1.36 | 0.9491 | 0.96 | 0.72 | 0.9862 |
| 25 | 0.92 | 1.36 | 0.9494 | 1.07 | 0.64 | 0.9919 |
| 30 | 0.96 | 1.37 | 0.9634 | 1.12 | 0.58 | 0.9906 |
| 35 | 1.09 | 0.85 | 0.9465 | 1.11 | 0.63 | 0.9840 |
| 40 | 0.92 | 0.54 | 0.8458 | - | - | - |
| Experimental Data | Predicted Value from Models | |
|---|---|---|
| Permeate flux (L/m2h) | 31.67 | 34.77 |
| Apparent rejection to NH4+-N (%) | 97.53 | 97.00 |
© 2020 by the authors. Licensee MDPI, Basel, Switzerland. This article is an open access article distributed under the terms and conditions of the Creative Commons Attribution (CC BY) license (http://creativecommons.org/licenses/by/4.0/).
Share and Cite
Gui, S.; Mai, Z.; Fu, J.; Wei, Y.; Wan, J. Transport Models of Ammonium Nitrogen in Wastewater from Rare Earth Smelteries by Reverse Osmosis Membranes. Sustainability 2020, 12, 6230. https://doi.org/10.3390/su12156230
Gui S, Mai Z, Fu J, Wei Y, Wan J. Transport Models of Ammonium Nitrogen in Wastewater from Rare Earth Smelteries by Reverse Osmosis Membranes. Sustainability. 2020; 12(15):6230. https://doi.org/10.3390/su12156230
Chicago/Turabian StyleGui, Shuanglin, Zhaohuan Mai, Jiaqi Fu, Yuansong Wei, and Jinbao Wan. 2020. "Transport Models of Ammonium Nitrogen in Wastewater from Rare Earth Smelteries by Reverse Osmosis Membranes" Sustainability 12, no. 15: 6230. https://doi.org/10.3390/su12156230
APA StyleGui, S., Mai, Z., Fu, J., Wei, Y., & Wan, J. (2020). Transport Models of Ammonium Nitrogen in Wastewater from Rare Earth Smelteries by Reverse Osmosis Membranes. Sustainability, 12(15), 6230. https://doi.org/10.3390/su12156230