Article

An Improved System Dynamics Model to Evaluate Regional Water Scarcity from a Virtual Water Perspective: A Case Study of Henan Province, China

1
Business School, Hohai University, Changzhou 213022, China
2
Jiangsu Provincial Collaborative Innovation Center of World Water Valley and Water Ecological Civilization, Nanjing 211154, China
3
Faculty of Engineering Technology, University of Twente, 7500AE Enschede, The Netherlands
4
School of Statistics, Beijing Normal University, Beijing 100875, China
*
Author to whom correspondence should be addressed.
Sustainability 2020, 12(18), 7517; https://doi.org/10.3390/su12187517
Submission received: 26 July 2020 / Revised: 6 September 2020 / Accepted: 7 September 2020 / Published: 11 September 2020
(This article belongs to the Section Resources and Sustainable Utilization)

Abstract

:
An accurate and practically useful evaluation of regional water scarcity is a necessary procedure in scarcity monitoring and threat mitigation. From the perspective of virtual water, this study proposed an improved system dynamics model to evaluate regional water scarcity (WS), including a case study of Henan province, China. We enhanced the existing system dynamics model of WS evaluation from a virtual water perspective by (1) defining WS as the ratio of the consumption-based blue water footprint to water availability, in order to compare the water requirements that need to be met to satisfy the local demand of goods and services with water supply; (2) integrating the economic growth, trade, and water use efficiency in the tertiary industry (e.g., accommodation, food and beverage services) into the model, in order to improve the accuracy of WS assessment and help find more specific measures to reduce WS by factor adjustment; (3) distinguishing the product use structure matrix, as well as the sectoral direct water use coefficient, in local regions from that in other domestic regions and foreign countries, and identifying the regional use structure matrices of products from these three kinds of regions, in order to increase the calculating veracity; and (4) displaying performances of the society, economy, and environment in WS reduction, in order to offer a more comprehensive reference for practical policy decisions. The case study results show that Henan has been suffering from, and in the near future could continue to face, water scarcity, with an average of 2.19 and an annual rise of 1.37% during 2008–2030. In the scenario comparison of current development, production structure adjustment, technology upgrade, and trade structure adjustment in supply-side structural reform of Henan from 2019 to 2030, WS could be reduced by updating production structures into less production of agricultural products or other sectors with a high production-based water footprint (with the smallest average WS of 2.02 and the second smallest total population and GDP, i.e., gross domestic production), technology enhancement in water saving, purification and pollution control (with the second smallest average WS of 2.04 and the largest total population, GDP and total available water resources). Furthermore, for the agricultural products or other sectors with high domestic/international virtual water outflow (inflow), if we reduce (increase) their percentage of outflow (inflow) in the industry involved, WS will increase only more slightly than that when we keep the current development trend, with the smallest total population. Potential measures for alleviating WS should be taken comprehensively, with priorities being identified according to the socioeconomic and environmental performance. Our model can be useful for practical policymaking and valuable for relevant research worldwide.

1. Introduction

China’s unprecedented socioeconomic development in past decades has been accompanied by significant resource and environmental consequences [1,2,3], particularly for the aquatic ecosystem threatened by the stress of both quantity and quality [4,5]. Water resources underpin China’s food security, economic development, and the subsistence and prosperity of human beings. Unfortunately, two-thirds of China’s cities have water shortages, more than 40% of its rivers are severely polluted, and 80% of its lakes suffer from eutrophication [6]. As a result, over half of the Chinese population are affected by water scarcity (0.9 billion) for at least one month per year [5,7]. This highlights an urgent need to monitor the situation of water scarcity and improve national water resource management in order to cope with this scarcity in China. To achieve this, developing an accurate and comprehensive evaluation model of water scarcity (hereafter WS) is one of the most critical procedures [8,9].
Prior studies have provided several models for assessing regional WS, which is classically evaluated by the ratio of real water withdrawal to total water availability in the region [5,10]. However, firstly, data on real water withdrawal in the primary industry usually comes from official statistics. Only the water volume from waterworks is calculated, and the self-extracting water is excluded, which is always a large amount and cannot be neglected in many regions. Secondly, in the secondary and tertiary industry, the sectoral water use impacting regional WS includes not only direct water use, but also the indirect water use of production in the supply chain upstream, which is sometimes not represented in data on sectoral real water withdrawal. Thirdly, the production of goods or service outflow enlarges the local water requirement and exaggerates the local water scarcity, while the goods or service inflow helps reduce the local water demand and alleviate that scarcity. However, these cannot be shown in the ratio of real water withdrawal to the water availability. Water used in the production process of a product is called the virtual water contained in the product [11]. The virtual blue water (surface and underground water) contained in agricultural products, namely the blue water footprint of agricultural products, includes both the water volume from waterworks and the farmers’ self-extracting water use; virtual water in the sectoral production of the secondary or tertiary industry, known as the water footprint of the secondary or tertiary industry, contains both direct and indirect water use. The virtual water flow, which is the water embodied in goods and service trade, can help present the water used for goods and service outflow, and the water saved in the goods and service inflow. Therefore, for the purpose of comprehensively reflecting the effect of agricultural water use, the sectoral water consumption in the supply chain, and the water embedded in trade, on the regional WS, it is necessary to adopt a virtual water perspective in regional WS evaluation.
Much research has taken a virtual water perspective in regional WS assessment, which is mainly defined as the ratio of the water footprint in one region (i.e., the sum of the volume of freshwater used to produce the product in that area) to its water availability [7,12,13,14,15]. To the best of our knowledge, here, the water footprint includes two kinds, i.e., production-based and consumption-based. The production-based water footprint refers to the amount of local water resources used in the local production of all products and services, which aims to satisfy the ultimate demand in local and other regions. In contrast, the consumption-based water footprint refers to the amount of (local or external) water consumed to produce the finished goods and services for the ultimate local demand [16,17]. Based on this, all of the indicators evaluating WS from a virtual water perspective can be sorted into three types: 1) The ratio of the production-based (blue) water footprint to water availability [18,19,20,21,22]; 2) the ratio of the consumption-based (blue) water footprint to water availability [7,23,24,25]; and 3) the ratio of the production-based blue water footprint to the sum of water availability and water resource inflow due to commodity import (i.e., virtual water inflow) [26]. However, it is quite important to note the following: for Type 1, part of the local production-based water footprint is required by other regions where the finished products are consumed, and in this context, the consumption-based water footprint can completely show the water requirements that need to be met to satisfy the ultimate local demand of goods and services, which can present the actual local demand of water more precisely. Additionally, for Type 3, similar to what has been mentioned above, the production-based blue water footprint also contains the blue water required by other regions, and the virtual water inflow adopted as part of the denominator does not actually come from the local water supply. So, the result in Type 3 can be understood as the practical pressure of actual water use in production for the consumption of local and other regions, on both the local water resources and the virtual water import. It is influenced by the commodity requirements and virtual water inflow from other regions. Here we hold that regional WS should be a potential and intrinsic attribute of a region, showing the comparison results of potential local water requirements that possibly have not been satisfied and supply of the region, without any relationship with activities of other regions. The local water requirement can be denoted as the consumption-based water footprint, which embodies the water for the ultimate local demand of goods and services. The water supply of the region can be understood as the water availability. So, in our opinion, the definition in Type 2 is more reasonable, i.e., the ratio of the consumption-based water footprint to water availability. Moreover, what we always manage is blue water resources, and the water availability is also related to blue water. Therefore, in order to present the ratio of the water requirement in terms of local goods and services demand to water supply more accurately, and provide more appropriate evidence for water management, we apply the ratio of the consumption-based blue water footprint to water availability as WS in this study.
Approaches of blue water footprint assessment are primarily bottom-up accounting [27,28,29] and top-down approaches [30,31,32]. On one hand, the blue water footprint of the primary industry in bottom-up accounting includes not only the water volume from waterworks, but also the self-extracting water amount used in agricultural production, which is dismissed in the top-down approach due to the limitation of relevant statistical calibers of the country. On the other hand, the aggregation of all agricultural commodities in one sector in the input–output table will cause bias when calculating footprints based on that input–output table, which is the core of the top-down method [33]. Therefore, in this study, to ensure a higher-precision estimation, the water footprint of the primary industry is estimated by bottom-up accounting through using raw data on the production/consumption of each product multiplied by one unit of the product’s water requirement during the production processes (i.e., the virtual water content of the product) [34]. In addition, the water footprint of the secondary and tertiary industries here is assessed with the top-down approach, due to the diversity of products and the complex process of calculating the virtual water content per unit of product in the bottom-up approach [35].
A system dynamics model can be used to assess regional WS considering the dynamics and interactions of socioeconomic driving forces; predict WS in the future; and provide comprehensive potential impacts of policies on both the WS, and the social, economic, and other subsystems. To the best of our knowledge, this model has only been used in [26,36] to assess WS from the perspective of virtual water. In [26,36], the type 3 indicator presented above was chosen to evaluate WS, which is the ratio of the production-based blue water footprint to the sum of the water availability and virtual water inflow. As discussed above, in order to more precisely present the comparison results of the water requirement to satisfy the ultimate local demand of goods and services, with a local water supply, we should adopt the ratio of the consumption-based blue water footprint to water availability as WS.
Secondly, for the tertiary industry, its economic growth, trade, and water use efficiency are not involved in the system dynamics model in [26,36]. However, what should be noticed is that, with the global social and economic transition, the increasing inter-regional communication in services, such as the rapid development of domestic and international tourism, and the enhanced awareness of water saving worldwide, the economic growth, trade, and water use efficiency in the tertiary industry have been developing remarkably and promoting changes in service water use, especially the sectoral water consumption of accommodation, food, and beverage services, in many countries, such as the US, Canada, China, etc. [37,38]. Therefore, in order to more accurately predict water consumption of the tertiary industry on the basis of its factors in WS evaluation and help find more specific measures to reduce WS based on factor adjustment, it is necessary to integrate indicators of economic growth, trade, and water use efficiency of the tertiary industry into system dynamics models of WS evaluation.
Thirdly, the authors of [26,36] did not distinguish either the product use structure matrices or the sectoral direct water use coefficients in local and other regions of the country and foreign countries, or the regional use structure matrices of products from these three kinds of regions. For the product use structure matrices in other regions, domestically or internationally, products are produced in other regions of a domestic or foreign country, and then enter local regions, and the corresponding matrices are used to assess virtual water inflow and the consumption-based water footprint. For the regional use structure matrices of products from other regions of the country or imported, products are produced in local regions with materials flowing in from other regions, and these matrices are the basis of production-based water footprint estimation. However, on one hand, because of the different contents of one sector in various regions, as well as the diverse levels of technology, there are always great disparities of product use structure matrices or sectoral water use coefficients in different regions. On the other hand, due to the different features and costs of products from various sources, regions always use them in different structures, especially for domestic and foreign materials. Therefore, the identification of these product use structure matrices and direct water use coefficients is necessary in the improvement of research precision.
Last but not least, only the WS is compared in different development scenarios in [26,36], and the diverse corresponding performance of society, the economy, and the environment is excluded. In fact, it is necessary to consider all of the socioeconomic and environmental situations comprehensively in scientific policymaking. Therefore, in order to provide a more practical reference for decision making, the social, economic, and environmental performance should also be displayed in scenarios of WS reduction.
The objective of this paper is to improve the system dynamics model, to more accurately evaluate WS from a virtual water perspective, and to comprehensively present the socioeconomic and environmental performance in WS reduction. We take Henan province in central China as a case study for our analysis. The main contributions of this work to the system dynamics model of WS evaluation from a virtual water perspective include the following:
(a)
the ratio of the consumption-based blue water footprint to the water availability is taken as WS, in order to compare the water requirement that needs to be met to satisfy the local demand of goods and services to water supply;
(b)
the economic growth, international and domestic trade, and water use efficiency in the tertiary industry are integrated into the system dynamics model, in order to improve the accuracy of WS assessment and help find more specific measures of WS reduction based on factor adjustment;
(c)
the product use structure matrix, together with the sectoral direct water use coefficient, is differentiated in local regions from that in other provinces or foreign countries, and the use structure matrices of products from these three kinds of regions are also distinguished, in order to enhance the precision of evaluation;
(d)
the performance of society, the economy, and the environment is displayed in WS reduction, in order to offer a more comprehensive reference for policymaking.
Based on our improvement of the model, we try to remedy the deficiencies discussed above and provide more precise and comprehensive accordance for policymaking of WS reduction.
The remainder of this paper is organized as follows: Section 2 presents the study area, methodology, data source, and framework of scenario analysis; Section 3 shows the model test results, results of WS evaluation, scenario analysis, and socioeconomic and environmental performance in WS reduction; Section 4 discusses the policy implications, compares the proposed and existing models, and presents a discussion on the model; and finally, conclusions are proposed in Section 5.

2. Materials and Methods

2.1. Overview of the Study Area

Henan province, located in central China, is a commodity grain base in China (Figure 1). At the same time, it is in both the Central Plains Urban Agglomeration and Central Plains Economic Region. The water shortage in this area is prominent in terms of food production and economic development, and has a great impact on Chinese water safety and food security. In the past decade, the annual per capita freshwater resources occupancy has only been 350 m3 in Henan, which is an extreme WS level according to the Falkenmark Water Stress Indicator [39]. The per capita water resources value in Henan was 8th from the bottom in terms of the 31 provinces of China in 2018. It is only 0.3% of the largest value in Tibet. Meanwhile, Henan is the second largest grain producing area in China, and the agricultural water consumption accounted for 54.30% of the total water consumption during 2014–2018. The annual average growth rate of the value added of secondary and tertiary industries in the most recent five years has exceeded 8% and 9% in Henan, respectively, resulting in a rapid increase of the water demand. Based on the increasingly prominent contradiction between the supply and demand of water resources in Henan, it is critical to evaluate its WS and seek out appropriate approaches to reduce it, with a comprehensive consideration of both water savings and socioeconomic development.
Henan is also a big trading province in China. The total exports and imports of goods in Henan reached 82.8 billion US dollars in 2018 [40], ranking first in terms of the provinces of central China, and second in terms of central and western China. Meanwhile, Henan always supplies abundant grains to other parts of the country. According to the data of Henan’s input–output table for 2012, its total inter-provincial trade value was nearly 14 times that of the total exports and imports that year [41]. The mass virtual water flows embodied in these trades drive the local water requirement, affecting the WS. Therefore, for the purpose of improving the research accuracy, it is essential to adopt a virtual water perspective in WS evaluation in Henan.
All of the information listed above makes Henan representative and practically substantial for the purposes of this study.

2.2. Water Footprint and Virtual Water Flow Accounting

2.2.1. The Primary Industry

(a)
Blue virtual water content per unit of product in the primary industry
As mentioned above, data on real water withdrawal in the primary industry always only focus on the water volume from waterworks, with the self-extracting water being excluded, which is always large. Therefore, in this study, we calculated the water footprint in the primary industry to indicate the corresponding water consumption.
The blue virtual water content per unit of crop product (m3/tons) was calculated with the methods adopted in [42]. The daily data on the (blue) water requirement of each category of crop in the growth and development period per unit area in any year (m3/hm2), and the daily effective precipitation per unit area in any year (m3), were calculated in the CROPWAT software considering crop attributes and meteorological data. The crop coefficient of crop i on day z was determined based on the standard crop coefficient and amended by the modified formula from FAO-56 as follows [43]:
K c , a m e [ i , z ] = K c [ i , z ] + 0.04 U 2 [ z ] 2 0.004 R H m i n [ z ] 45 h 3 0.3
where Kc[i,z] is the standard crop coefficient of crop i on day z, U2[z] is the wind speed at a 2 m height on day z (m/s), RHmin[z] denotes the minimum relative humidity on day z (%), and h is the average height of crops (m). Combined with the result of the blue virtual water content per unit of product, the crops with either a large planting area, high production output, or high water intensity in Henan are mainly wheat, rice, maize, soybean, peanut, and cotton. Therefore, these six crops were chosen in this study to estimate the regional production-based blue water footprint and blue virtual water flow of crop products in Henan.
Due to the complexity of estimation, the blue virtual water content per unit of animal products is quoted from [44]. According to the statistical results in the Henan Statistical Yearbook and Zhengzhou Customs Statistical Data, in the past decade, the annual production of pork and beef in Henan has accounted for more than 95% of the total annual production of meat, and nearly 75% of them are outflows. Therefore, in the estimation of the production-based blue water footprint and blue virtual water flow of animal products in Henan, we focused on pork and beef to simplify the calculation.
  • (b) Production-based blue water footprint of the primary industry
For the primary industry, the production-based blue water footprint of each kind of product in year t (m3) was assessed through multiplying the blue virtual water content per unit of the product in year t (m3/tons) by the corresponding production of the product (tons). The production-based blue water footprint in the primary industry in t year was calculated as the sum of the water footprint of all of the crops and animal products.
  • (c) Blue virtual water flow of the primary industry
Since there are no statistical data on either regional net outflow or consumption of any kind of agricultural products chosen above, the net outflow of agricultural products is calculated as follows based on the model used in [45]. In this model, any kind of agricultural product is assumed to be equally distributed to the residents, and domestic regions with a higher agricultural product occupancy per capita than the national average will embody agricultural product outflow to realize a consumption per capita equal in all domestic regions. Here the hypothesis that the per capita consumption of agricultural products chosen in this paper is equal in all regions of China is consistent with the fact that diets are converging across China, due to the great population mobility, commodity flow, and cultural fusion. It can also be supported from the China Statistical Yearbook that in 31 provinces of China in 2018, the per capita consumption variation coefficient of grain was much smaller than that coefficient of any other kind of crop product, and the per capita consumption variation coefficient of pork or beef is also the smallest in all kinds of meat [40]. Although some agricultural products are actually used for not only residents’ diets but also livestock feed, it is always hard to distinguish how much is consumed by humans and how much is consumed by livestock in a region. Therefore, in this study, we estimated the products flow according to the population, as done in [45]. In year t, the regional net outflow values of crop i (G’t[i]) and that of j animal products (G’t[j]) (tons) were estimated by:
G t [ i ] = G t [ i ] P t G N , t [ i ] / 0.95 P N , t
G t [ j ] = G t [ j ] P t G N , t [ j ] / 0.95 P N , t
where 0.95 is the self-supply ratio of agricultural products in China, which has remained at about 95% in the past 60 years according to the statistical data [45]; Gt[i] and Gt[j] stand for the total production of crop i and animal products j in year t in Henan, respectively (tons); GN,t[i] and GN,t[j] are the national total production of crop i and animal products j in year t, respectively (tons); and PN,t and Pt denote the population of the nation and that of Henan in year t, respectively.
For the primary industry, the net outflow in the domestic trade of any kind of product in year t in Henan (tons) was estimated by subtracting the net export from the net outflow of the product. The three kinds of net blue virtual water outflow, which are the net blue virtual water outflow and that outflow in the foreign and domestic trade of every kind of agricultural product (m3) from Henan can be calculated by multiplying the blue virtual water content per unit of that product (m3/tons) by its corresponding net outflow (tons). The three kinds of net blue virtual water outflow of the primary industry (m3) were measured through adding that outflow of all the crop and animal products together.

2.2.2. The Secondary and Tertiary Industries

(a)
Construction of non-competitive input–output tables in Henan province and China
Both the input–output table of China and the provincial one issued by the National Statistical Bureau of China are competitive tables, which assume that the inflow products are competitive with locally produced ones, the two kinds of products can be substituted by each other with the same performance, and the inflow products are used in intermediate and final demand with the same structure as that of the local ones [41,46]. However, in practice, these two kinds of products are always used in different structures, especially for the imports and domestic products, due to the diverse performance and costs. So, in order to enhance the estimation accuracy of water footprint and virtual water flow of the secondary and tertiary industries, we should distinguish both the intermediate input and final demand of the products from various sources, which can be displayed in the non-competitive input–output tables, admitting that these kinds of products are non-competitive [47,48]. So, here we build the non-competitive input–output tables in Henan province and China, based on the estimation of the use structure matrix of products from import and other provinces in Henan, and that matrix of import products in China.
Firstly, estimation of the use structure matrix of import products in Henan was conducted. Studies show that the technical level of Henan is close to the national average [49,50,51,52], and the use structure matrix of import products in Henan has sometimes been assumed as the corresponding average matrix in China [16,53]. So, this study estimates that matrix in Henan as the corresponding average matrix in China. The line elements of the use structure coefficient matrix of import products in China were multiplied by the line elements of the import column vector in the competitive input–output (IO) table for Henan in the form of Table 1 [41], and the results constitute the use structure matrix of import products in Henan.
Secondly, estimation of the use structure matrix of products from other provinces in Henan was conducted. This matrix was estimated based on the matrix of the products use structure coefficient in the IO table of Henan, considering that the performance of products from other provinces is always similar to that of the local products.
Thirdly, the construction of an import and inter-provincial inflow non-competitive IO table for Henan was conducted. This table was constructed by deducting the use structure matrix of import products, as well as that of the products from other provinces, from the competitive IO table of Henan.
Lastly, the construction of a non-competitive IO table for China was conducted. Here, the use structure matrix of import products in China was subtracted from the competitive IO table.
By aggregating as few sectors as possible to unify sector divisions in the official competitive IO tables for 2002, 2007, and 2012, this study divided the economic industries of Henan into 38 sectors (listed in Table A1). Among them, sector 1 is the primary industry, sectors 2–25 are subordinated to the secondary industry, and sectors 26–38 belong to the tertiary industry.
  • (b) Water use coefficient of the secondary and tertiary industries
The sectoral direct water use coefficient is the amount of direct water use per unit output value of the sector. The sectoral total water use coefficient is the sum of the direct and indirect water use per unit output value of the sector:
H u , t = Q u , t ( I A u , t ) 1
H u , t = H 1 , u , t , H 2 , u , t , , H s , u , t , , H 38 , u , t
in which Hu,t and Qu,t are the total and direct water use coefficient matrix in year t of Henan, respectively (1 × 38); I is the unit matrix (38 × 38); Au,t denotes the direct use coefficient matrix in the import and inter-provincial inflow non-competitive IO table for Henan in year t (38 × 38); and s = 1, 2,... 38.
  • (c) Blue water footprint and blue virtual water flow accounting of the secondary and tertiary industries
In the calculation of the production-based blue water footprint, consumption-based water footprint, and blue virtual water flow of the secondary and tertiary industries in Henan, the different regional use structure matrices of products from local and other provinces of the country and foreign countries were distinguished, and the sectoral direct water use coefficients and product use structure matrix in these three types of regions were also identified. On the one hand, the use of the production-based blue water footprint of the secondary and tertiary industries in Henan can be divided into three categories: local final consumption expenditure and capital formation, export, and inter-provincial outflow. The corresponding production-based blue water footprint was calculated based on the import and inter-provincial inflow non-competitive IO table of Henan, where the regional use structure matrices of products from local and other domestic provinces and imports were distinguished. On the other hand, the sources of the consumption-based blue water footprint in the secondary and tertiary industries in Henan include the local provinces, other provinces, and foreign countries. The consumption-based blue water footprint from local provinces was measured based on the import and inter-provincial inflow non-competitive IO table for Henan. The sectoral consumption-based blue water footprint from other provinces (other foreign countries) in the secondary and tertiary industries of Henan was estimated, based on the average direct consumption coefficient and average direct water use coefficient by sector in all trading provinces (trading countries), together with the inter-provincial trade column (import column) of Henan. Among them, these two kinds of coefficients in all trading provinces were approximately estimated as the corresponding national averages, which were derived from the non-competitive IO table of China; and the coefficients of all trading countries were also substituted by the corresponding values of China, which can reflect the amount of water saved through importing rather than self-production. Moreover, the net outflow of blue virtual water in the secondary and tertiary industries of Henan is the difference between the production-based and consumption-based blue water footprint of the industries.
Then, for s sector of the secondary and tertiary industries in year t in Henan, the production-based blue water footprint ( WF s , b , t pro ) and the consumption-based blue water footprint ( WF s , b , t con ) were calculated as follows:
H u , t N = Q u , t N ( I A u , t N ) 1
H u , t N = H 1 , u , t N , H 2 , u , t N , , H s , u , t N , , H 38 , u , t N
C A u , t = C A 1 , u , t , C A 2 , u , t , , C A s , u , t , , C A 38 , u , t
I O F u , t = I O F 1 , u , t , I O F 2 , u , t , , I O F s , u , t , , I O F 38 , u , t
D O F u , t = D O F 1 , u , t , D O F 2 , u , t , , D O F s , u , t , , D O F 38 , u , t
I I F u , t = I I F 1 , u , t , I I F 2 , u , t , , I I F s , u , t , , I I F 38 , u , t
D I F u , t = D I F 1 , u , t , D I F 2 , u , t , , D I F s , u , t , , D I F 38 , u , t
W F s , b , t p r o = H s , u , t × ( C A s , u , t + I O F s , u , t + D O F s , u , t )
W F s , b , t c o n = H s , u , t × C A s , u , t + H s , u , t N × ( I I F s , u , t + D I F s , u , t )
in which Hu,tN and Qu,tN represent the total and direct water use coefficient matrix in year t of China, respectively (1 × 38); Au,tN stands for the direct consumption coefficient matrix in the non-competitive IO table of China in year t (38 × 38); CAu,t, IIFu.t, and DIFu.t are the sum of the total final consumption expenditure matrix and the gross fixed capital formation matrix in year t in the import inter-provincial inflow non-competitive IO table of Henan, in the import product use structure matrix of Henan, and in the use structure matrix of products from other provinces in year t of Henan, respectively (1 × 38); and IOFu,t and DOFu,t individually represent the export matrix and the inter-provincial outflow matrix in the import inter-provincial inflow non-competitive IO table of Henan in year t (1 × 38).
The following estimates the net blue virtual water outflow of s sector in the secondary and tertiary industries in year t of Henan (NVWFs,b,t):
N V W F s , b , t = W F s , b , t p r o W F s , b , t c o n
For s sector of the secondary and tertiary industries in year t of Henan, the blue virtual water outflow, the blue water inflow, the net blue water outflow in foreign trade (IVWOFs,b,t, IVWIFs,b,t, and NIVWFs,b,t, respectively), and these three flows in domestic trade (DVWOFs,b,t, DVWIFs,b,t, and NDVWFs,b,t, respectively), are as follows:
I V W O F s , b , t = H s , u , t × I O F s , u , t
I V W I F s , b , t = H s , u , t N × I I F s , u , t
N I V W F s , b , t = I V W O F s , b , t I V W I F s , b , t
D V W O F s , b , t = H s , u , t × D O F s , u , t
D V W I F s , b , t = H s , u , t N × D I F s , u , t
N D V W F s , b , t = D V W O F s , b , t D V W I F s , b , t .
The blue virtual water outflow and the blue virtual water inflow of s sector of the secondary and tertiary industries in year t of Henan (VWOFs,b,t and VWIFs,b,t, respectively) were calculated as follows:
V W O F s , b , t = I V W O F s , b , t + D V W O F s , b , t
V W I F s , b , t = I V W I F s , b , t + D V W I F s , b , t
Finally, in the secondary and tertiary industries, the production-based blue water footprint, the net blue virtual water outflow, and the net blue virtual water outflow in foreign or domestic trade are correspondingly the flow sum of all related sectors.

2.3. System Dynamics Model of Water Scarcity Evaluation from the Perspective of Virtual Water

2.3.1. Determination of the System Boundary and Model

The geospatial boundary was considered as the system boundary of WS evaluation for Henan. Due to data availability, the historical base year of the system dynamics model is 2008, and the forecast base year is 2019. The test period of historical data is 2008–2018, while the simulation forecast period is 2019–2030, with simulation steps of one year. The research system is divided into five subsystems, i.e., the social water use subsystem, economic water use subsystem, water environment subsystem, water supply subsystem, and virtual water flow subsystem.

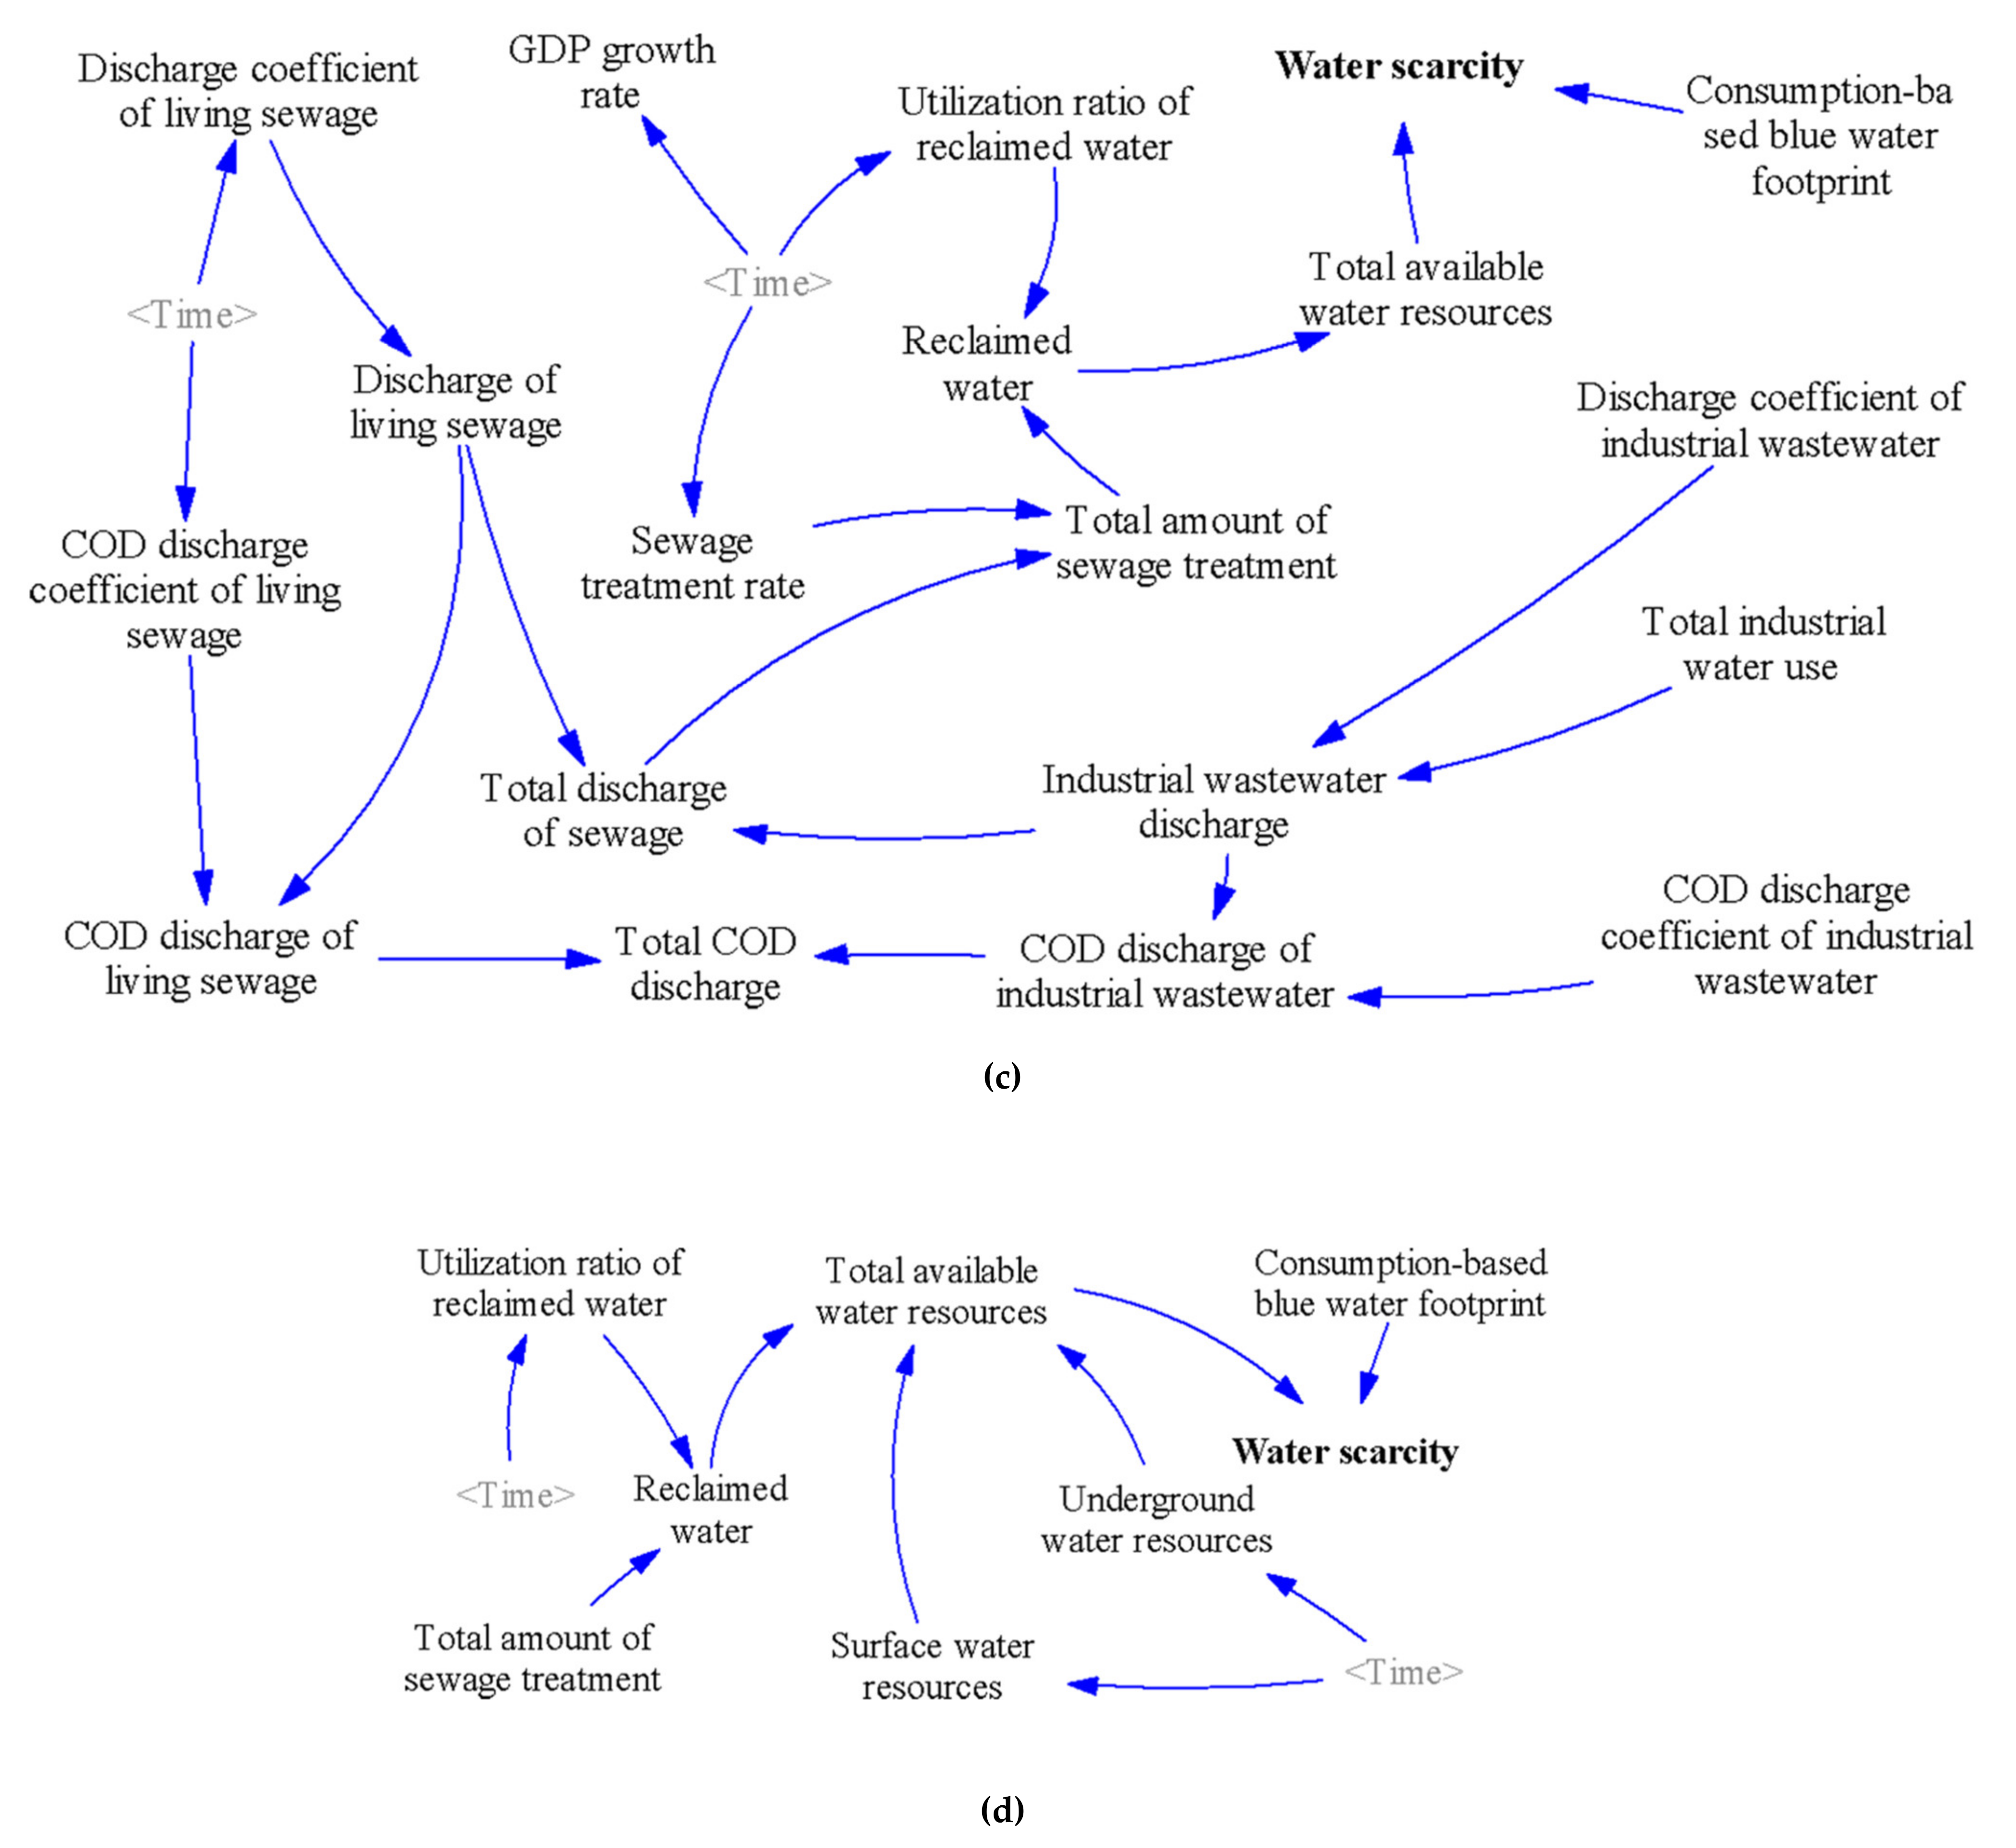
2.3.2. Flow Diagram of the System Model

In the system dynamics model, flow diagrams of the five subsystems were drawn by Vensim (Figure 2). We selected five horizontal variables (total population, production-based water footprint of crop products, industrial value added, value added in the tertiary industry, and GDP (gross domestic product)), five rate variables (population growth, production-based water footprint change of crop products, increment of industrial value added, increment of the value added in the tertiary industry, and GDP increment), and 58 other auxiliary variables, as well as 36 system equations.
In Figure 2, firstly, the domestic (foreign) trade adjustment coefficient in the virtual water strategy indicates the ratio of net blue virtual water outflow in domestic (foreign) trade after strategic domestic (foreign) trade adjustment to outflow without adjustment in Henan. For instance, when the net blue water outflow of domestic (foreign) trade decreases by 10%, the domestic (foreign) trade adjustment coefficient in the virtual water strategy will be 0.9. Secondly, the production structure adjustment coefficient of the primary industry indicates the ratio of the production-based blue water footprint of the primary industry after production structure adjustment to the water footprint without adjustment in Henan. Lastly, the blue water footprint multiplier of the secondary (tertiary) industry is the ratio of the production-based blue water footprint to the direct water use in the secondary (tertiary) industry. All of the data of the production-based blue water footprint and blue virtual water flow of the three industries come from the calculation above.

2.3.3. Main System Equations and Water Scarcity Evaluation

The equations in the flow diagram of the system dynamics model are shown in Appendix B, and some of them are listed as follows:
(1)
Field water consumption = production-based water footprint of crop products - production-based green water footprint of crop products;
(2)
Theoretical production-based blue water footprint of crop products = field water consumption/utilization coefficient of irrigation water;
(3)
Production-based blue water footprint of the secondary industry = water use of the secondary industry × blue water footprint multiplier of the secondary industry;
(4)
Production-based blue water footprint of the tertiary industry = water use of the tertiary industry × blue water footprint multiplier of the tertiary industry;
(5)
Production-based blue water footprint of three industries = (theoretical production-based blue water footprint of crop products+ production-based blue water footprint of animal products) × production structure adjustment coefficient of the primary industry + production-based blue water footprint of the secondary industry + production-based blue water footprint of the tertiary industry;
(6)
Consumption-based blue water footprint = production-based blue water footprint of three industries + living water footprint + eco-environmental water footprint - (net blue virtual water outflow of the primary industry in the domestic trade + net blue virtual water outflow of the secondary and tertiary industry in the domestic trade) × (1 - domestic trade adjustment coefficient in the virtual water strategy) - (net blue virtual water outflow of the primary industry in the foreign trade + net blue virtual water outflow of the secondary and tertiary industry in the foreign trade) × (1 - foreign trade adjustment coefficient in the virtual water strategy);
(7)
Water scarcity = consumption-based blue water footprint/total available water resources.

2.4. Data Sources

The initial data on crop attributes were derived from FAO-56 [43] and revised according to the actual cultivation in Henan. The standard crop coefficient was also obtained from FAO-56 [43]. The meteorological data on the temperature, wind speed, sunshine, relative humidity, and rainfall during 2008–2018 in Henan were taken from the China Meteorological Data Sharing Service Network, including the data collected at 17 meteorological stations. Because the input–output tables (IO tables) of Henan published in recent years are those for 2002, 2007, and 2012, and that in 2017 will be issued according to governmental arrangement, we estimated the annual IO tables of Henan during 2008–2011 and 2013–2018 based on these three tables, according to the basic principles of IO tables, the total amount of economy each year for Henan, and the changing trend of the consumption coefficients. The use structure matrix of imports in China was obtained from the National Information Center. Import and export data on crop and animal products in 2008–2018 were derived from Zhengzhou Customs Statistical Data, Henan.
Data on water use in the primary industry, per capita water use, urban and rural comprehensive living water use, and underground and surface water supply, were obtained from the Henan Water Resources Bulletin. Data on the population, urbanization rate, industrial added value, ecological water, sewage discharge, crop and animal products output, etc., originated from the Henan Statistical Yearbook. Sectoral water use in the secondary industry was also obtained from the Henan Statistical Yearbook and revised according to the water use of the secondary industry presented in the Henan Water Resources Bulletin. By combining the direct water use of the tertiary industry presented in the Henan Provincial Water Conservancy Census Bulletin (2012) and the annual data of urban and rural comprehensive living water use of Henan, direct water use of the tertiary industry in 2008–2010 and 2012–2018 was estimated, according to the proportion of urban and rural comprehensive living water use in the tertiary industry in 2011. Based on that, the sectoral direct water use of the tertiary industry was estimated through multiplying the direct water use of the tertiary industry by the corresponding sectoral proportion of the input from the sector of production and distribution of water in the IO table of Henan.
For 2019–2030, the GDP growth rate, growth rate of the value added in the tertiary industry, and the growth rate of industrial value were set in accordance with the “13th Five-Year Plan for National Economic and Social Development of Henan Province”; the sewage treatment rate, as well as the utilization ratio of reclaimed water, came from the “13th Five-Year Plan for Ecological Environment Protection in Henan Province”; the utilization coefficient of irrigation water, water use valued at 10,000 yuan added in the tertiary industry, and water use with an industrial value added of 10,000 yuan were sourced from the “13th Five-Year Plan of Water-saving Society Construction in Henan Province”; and both the population growth rate and urbanization rate were taken from the “Population Development Plan of Henan Province (2016–2030)”. The discharge coefficient of living sewage and discharge coefficient of industrial wastewater, which we could not find any direct reference for, together with the parameters involving the water footprint and virtual water flow, were set in accordance with the accounting results above and the development trend. The value setting basis of all the parameters in the WS evaluation system of Henan during 2019–2030 is listed in Appendix C Table A2.

2.5. Framework of Scenario Analysis

In China, supply-side structural reform is currently in progress as the main line of work for solving contradictions and problems in development, including regional water scarcity. Both production and trade are involved in the supply required to satisfy the regional demand of real and virtual water. The structure and technology in production and the trade structure are key points in supply-side structural reform for saving water and alleviating water scarcity. From the analysis above, since there are great disparities in either the virtual water content per unit of product among products in the primary industry, or the water use coefficient of sectors in the secondary and tertiary industries, we can observe that different local production structures have various water requirements; the technology level, which can be presented by the sewage treatment rate, utilization ratio of reclaimed water, water use for 10,000 yuan industrial value added, and so on, affects both the water requirements and water availability, and the kinds of trade structures also impact regional water requirements. All the three influence regional WS.
Therefore, in order to provide a reference for policymaking in supply-side structural reform to relieve water scarcity, this study set four development scenarios to measure the corresponding change of WS in Henan during 2019–2030, which are the scenarios of current development, production structure adjustment, technology upgrade, and trade structure adjustment. The system parameters in the current development scenario maintain the existing trends. In the production structure adjustment scenario, for the primary products and sectors with a high production-based blue water footprint, especially those with a high water use coefficient, the proportion of their production or output value in the regional total is reasonably reduced. In the scenario of technology upgrade, with technology improvement in water savings, water purification, and pollution control, the relevant parameters in the system will change, including the increase of the utilization rate of irrigation water, sewage treatment rate, and utilization rate of regeneration water, as well as the decrease of water use for 10,000 yuan GDP and living water use per capita. In the scenario of trade structural adjustment, for the primary products and sectors with high blue virtual water outflow in the domestic (foreign) trade, their percentage of outflow in the total outflow of the industry to which the sector is subordinated will decrease in domestic (foreign) trade, and for the sectors with high blue virtual water inflow in domestic (foreign) trade, their share of the sectoral inflow in the total inflow of the corresponding industry will increase in domestic (foreign) trade, which means a decline of the domestic (foreign) trade adjustment coefficient in the virtual water strategy. Based on the scenario features above, the historical trend of the indicator value, the basis of the parameter value setting given in the system in Table A2, and the possibility of change, the values of the main parameters set in the scenarios are shown in Table 2.
For the purpose of showing the comprehensive effects of different policy orientations in terms of society, the economy, and the environment, we also compared the main indicators in the five subsystems mentioned above in the four scenarios. The indicators include the total population, living water footprint in the social water use subsystem, GDP, theoretical production-based blue water footprint of crop products, production-based blue water footprint of the secondary industry, production-based blue water footprint of the tertiary industry in the economic water use subsystem, total amount of sewage treatment in the water environment subsystem, total available water resources in the water supply subsystem, net blue virtual water outflow of the primary industry in the foreign (domestic) trade, and net blue virtual water outflow of the secondary and tertiary industries in foreign (domestic) trade in the virtual water flow subsystem.

3. Results

3.1. Model Test

A historic test was carried out in the model test of the WS evaluation system in Henan. As mentioned before, due to the lack of data after 2018, in this paper, 2008 is taken as the historical base year and 2019 as the forecast base year. The actual historical value and model simulation value between 2008 and 2018 were compared. If the error was less than 10%, the model was considered effective and could be used to predict WS in 2019–2030. The results show that most of the indicators passed the test. Table 3 presents the historic test results of some of the main indicators.

3.2. Results of Water Scarcity Evaluation

The values of all the variables in the WS evaluation system of Henan during 2008–2030 are listed in the Supplementary Information. The trend of WS is presented in Figure 3. For 2008–2030, the annual average WS is 2.19. The WS increases annually at the rate of 1.37% and achieves 2.34 in 2030. The annual average WS for 2008–2030 is larger than 1, where the numerator total water requirements contain the relevant virtual water of those materials invested in the supply chain of the product, as well as virtual water inflow from other regions. This does not mean that the consumption of real water is greater than the water supply, which sounds impossible. However, we can observe that the total available water resources cannot meet the actual requirements of local social and economic development in Henan from the perspective of virtual water. Therefore, it is necessary for Henan to strive to enhance sustainable development. This result is consistent with that in other relevant research presented in [47], both showing that Henan is experiencing blue water scarcity.

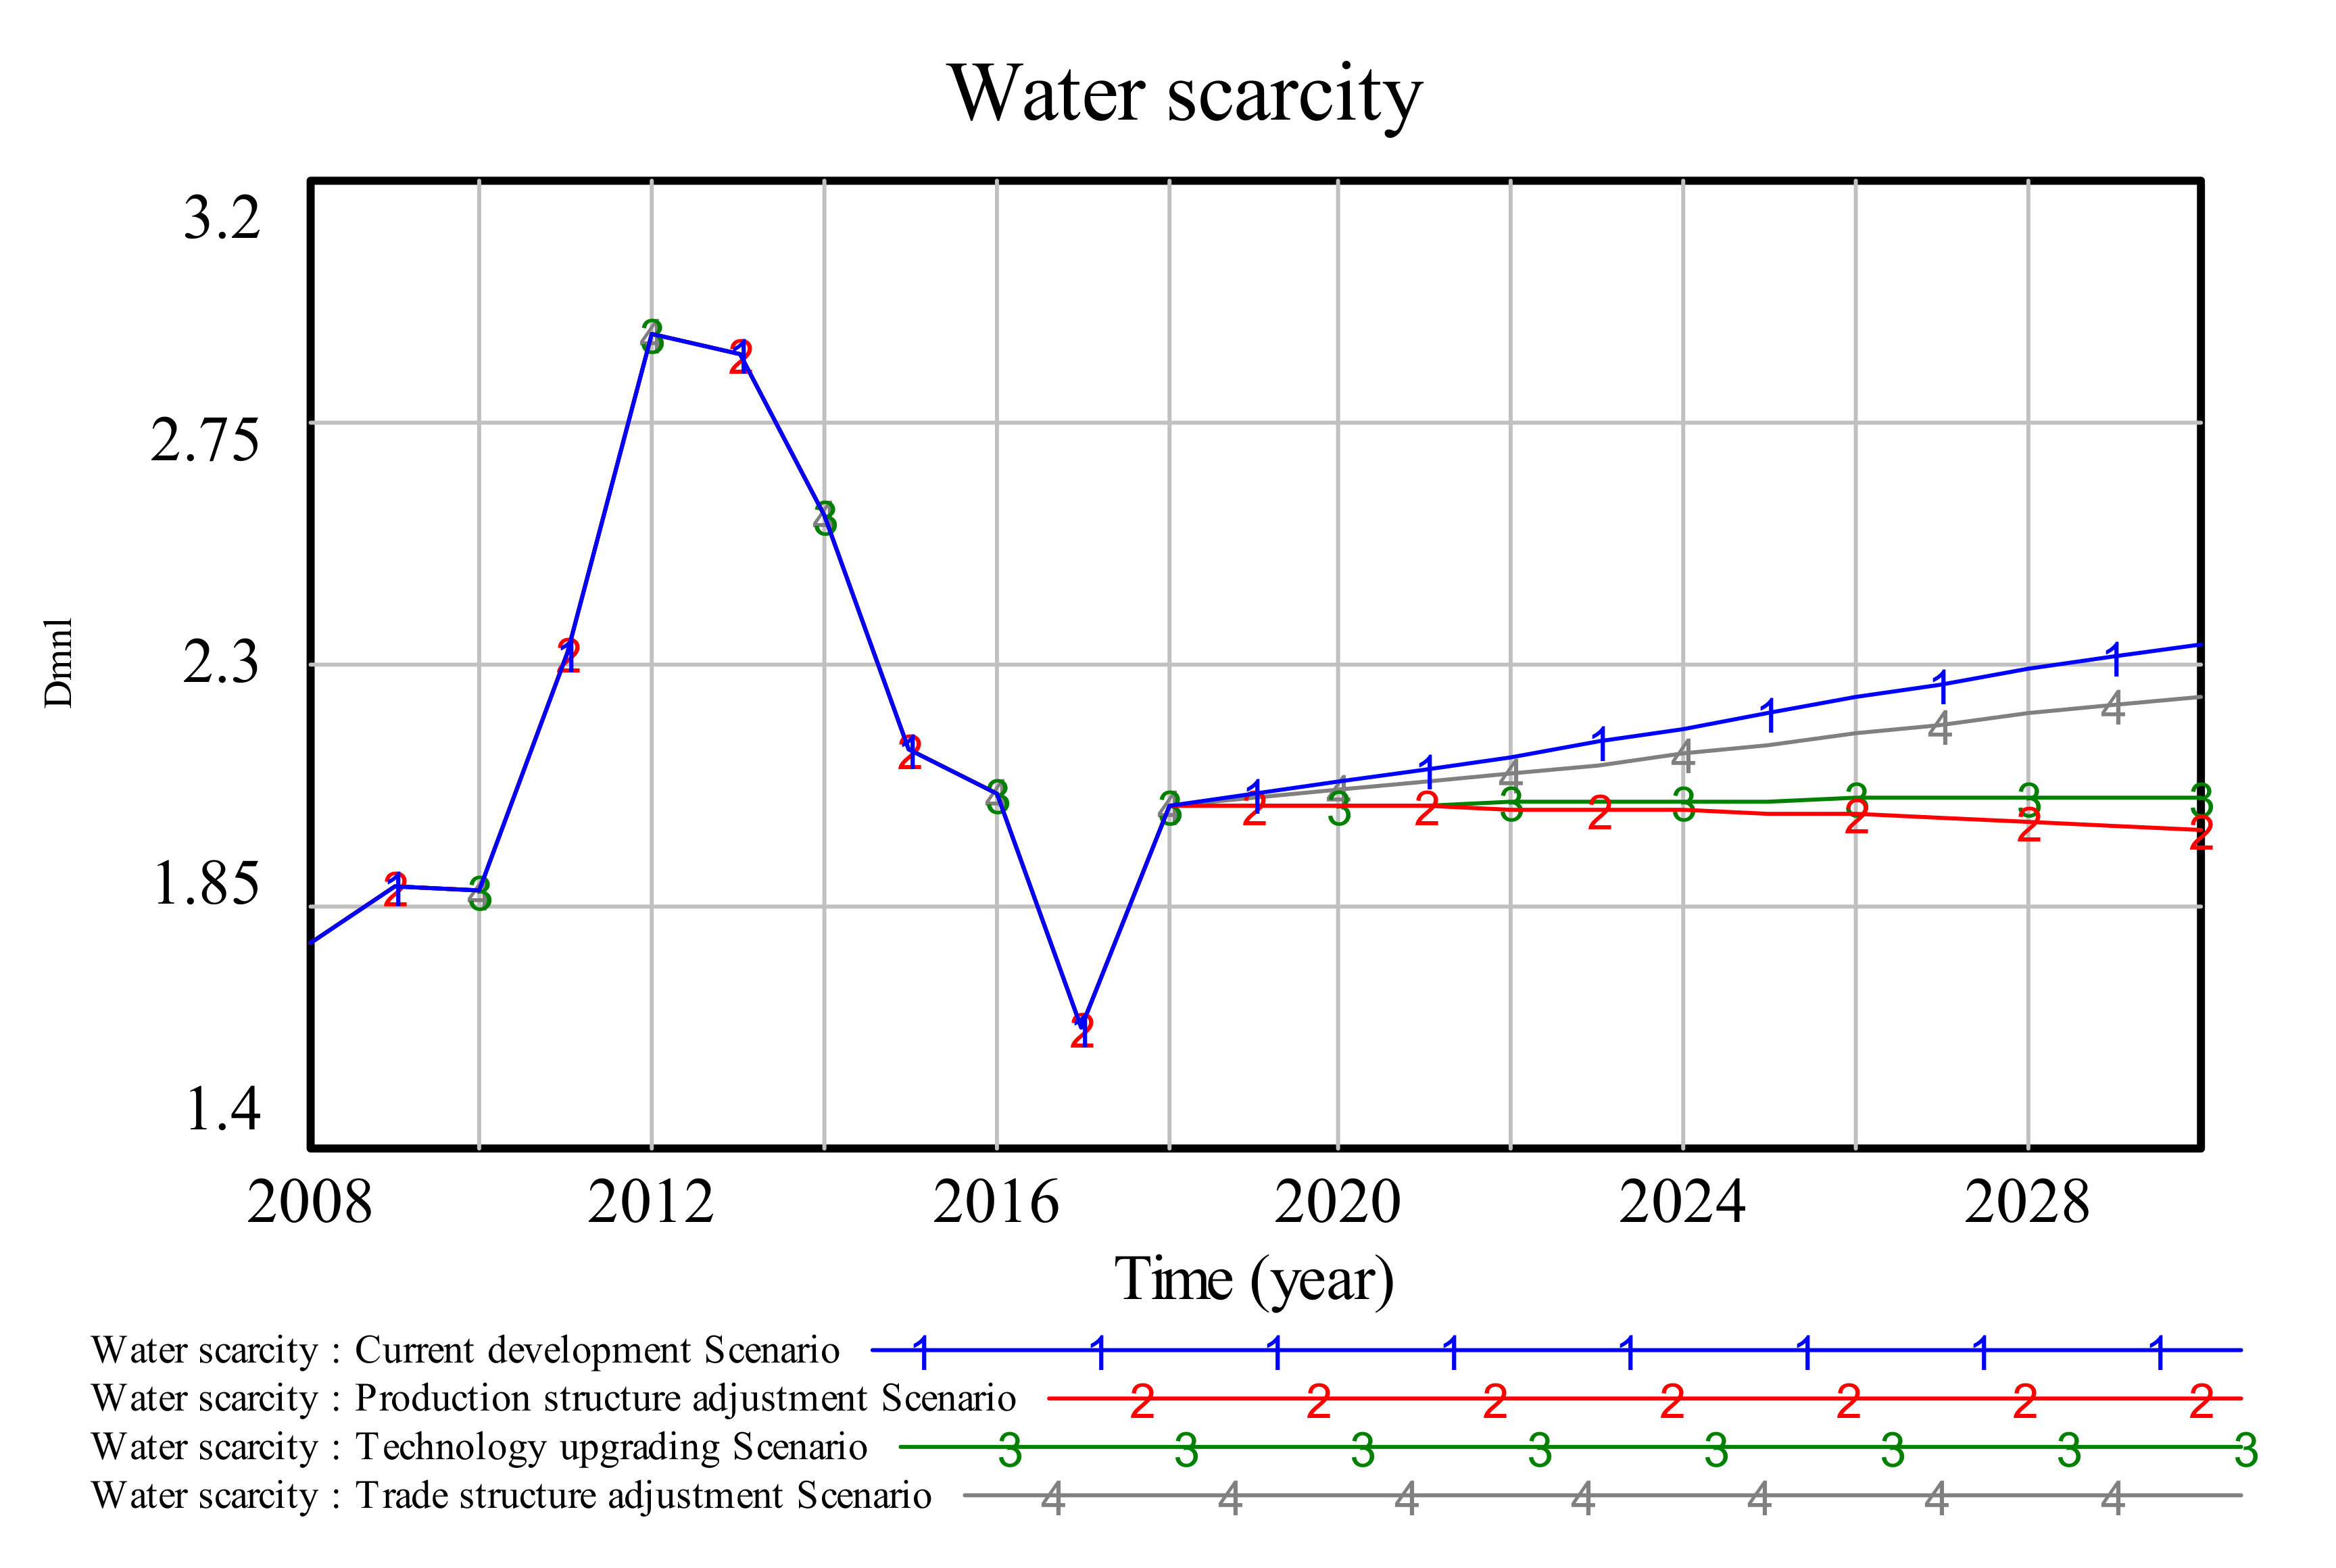
3.3. Results of Scenarios Analysis

According to the scenario setting above, WS in the four scenarios of supply-side structural reform in Henan during 2008–2030 was evaluated, and the trends of the main indicators in the five subsystems of the WS evaluation system in the four scenarios are displayed in Appendix D.

3.3.1. Water Scarcity

The results of WS in the four scenarios are presented in Figure 4. For 2019–2030, the WS will ascend in both the current development scenario and the trade structure adjustment scenario, with an annual average of 2.19 and 2.14, respectively, while it will slide downward in the other two scenarios, with an average of 2.02 in the production structure adjustment scenario and 2.04 in the last one. We can see that the scenario of production structure adjustment will have the best effect on reducing WS. In the technology upgrade scenario, although population expansion and economic development seem to increase water consumption, the improvement of water-saving and water-purification technology will have a strong water-saving effect and result in the decoupling of water use from economic development. Additionally, the trade restructuring will slow the rise of WS in the current development scenario.

3.3.2. Total Population and Living Water Footprint

Among the four scenarios, the technology upgrade one will involve the largest total population of Henan during 2019–2030, which will reach 110.29 million in 2030, 6.28 million more than that in 2018. However, in this scenario, the living water footprint will be smaller than that in any other scenario, because the technology upgrade will bring about an improvement of the water use efficiency and decrease of the water use per capita in both urban and rural areas, as shown in Appendix D Figure A1.

3.3.3. GDP and Production-Based Water Footprint

  • GDP
Based on Appendix D Figure A2a, we compared the GDP changes of Henan in the four scenarios. In the scenario of technology upgrade during 2019–2030, with the largest economic growth rate, the total amount of economy carried will be the largest, and its average will be 13.25% larger than that in the current development scenario. GDP in the trade structure adjustment scenario will be the second largest, and that in the scenario of production structure adjustment will be slightly larger than the GDP in the current development scenario.
  • Theoretical production-based blue water footprint of crop products
From 2019 to 2030, due to a larger utilization coefficient of irrigation water and smaller adjustment coefficient of the production structure, the theoretical production-based blue water footprint of crop products in either the technology upgrade scenario or production structure adjustment scenario will be 41.20 and 41.11 billion m3, respectively; these values are smaller than in any other scenario (Appendix D Figure A2b).
  • Production-based blue water footprint of the secondary industry
The change of the production-based blue water footprint of the secondary industry is represented in Appendix D Figure A2c, with a continuous rise being seen after 2019 in every scenario. This indicator in the trade structure adjustment scenario will be a little larger than that in the current development scenario and exceed that in any other scenario. It will be the lowest in the scenario of technology upgrade, at 76.47% of that in the trade structure adjustment scenario in 2030.
  • Production-based blue water footprint of the tertiary industry
The production-based blue water footprint of the tertiary industry will generally rise in all four scenarios during 2017–2025. Moreover, because of water-saving technology development, the value of the production-based blue water footprint of the tertiary industry will be the smallest in the technology upgrading scenario, with the largest value being found in the trade structure adjustment scenario (Appendix D Figure A2d).

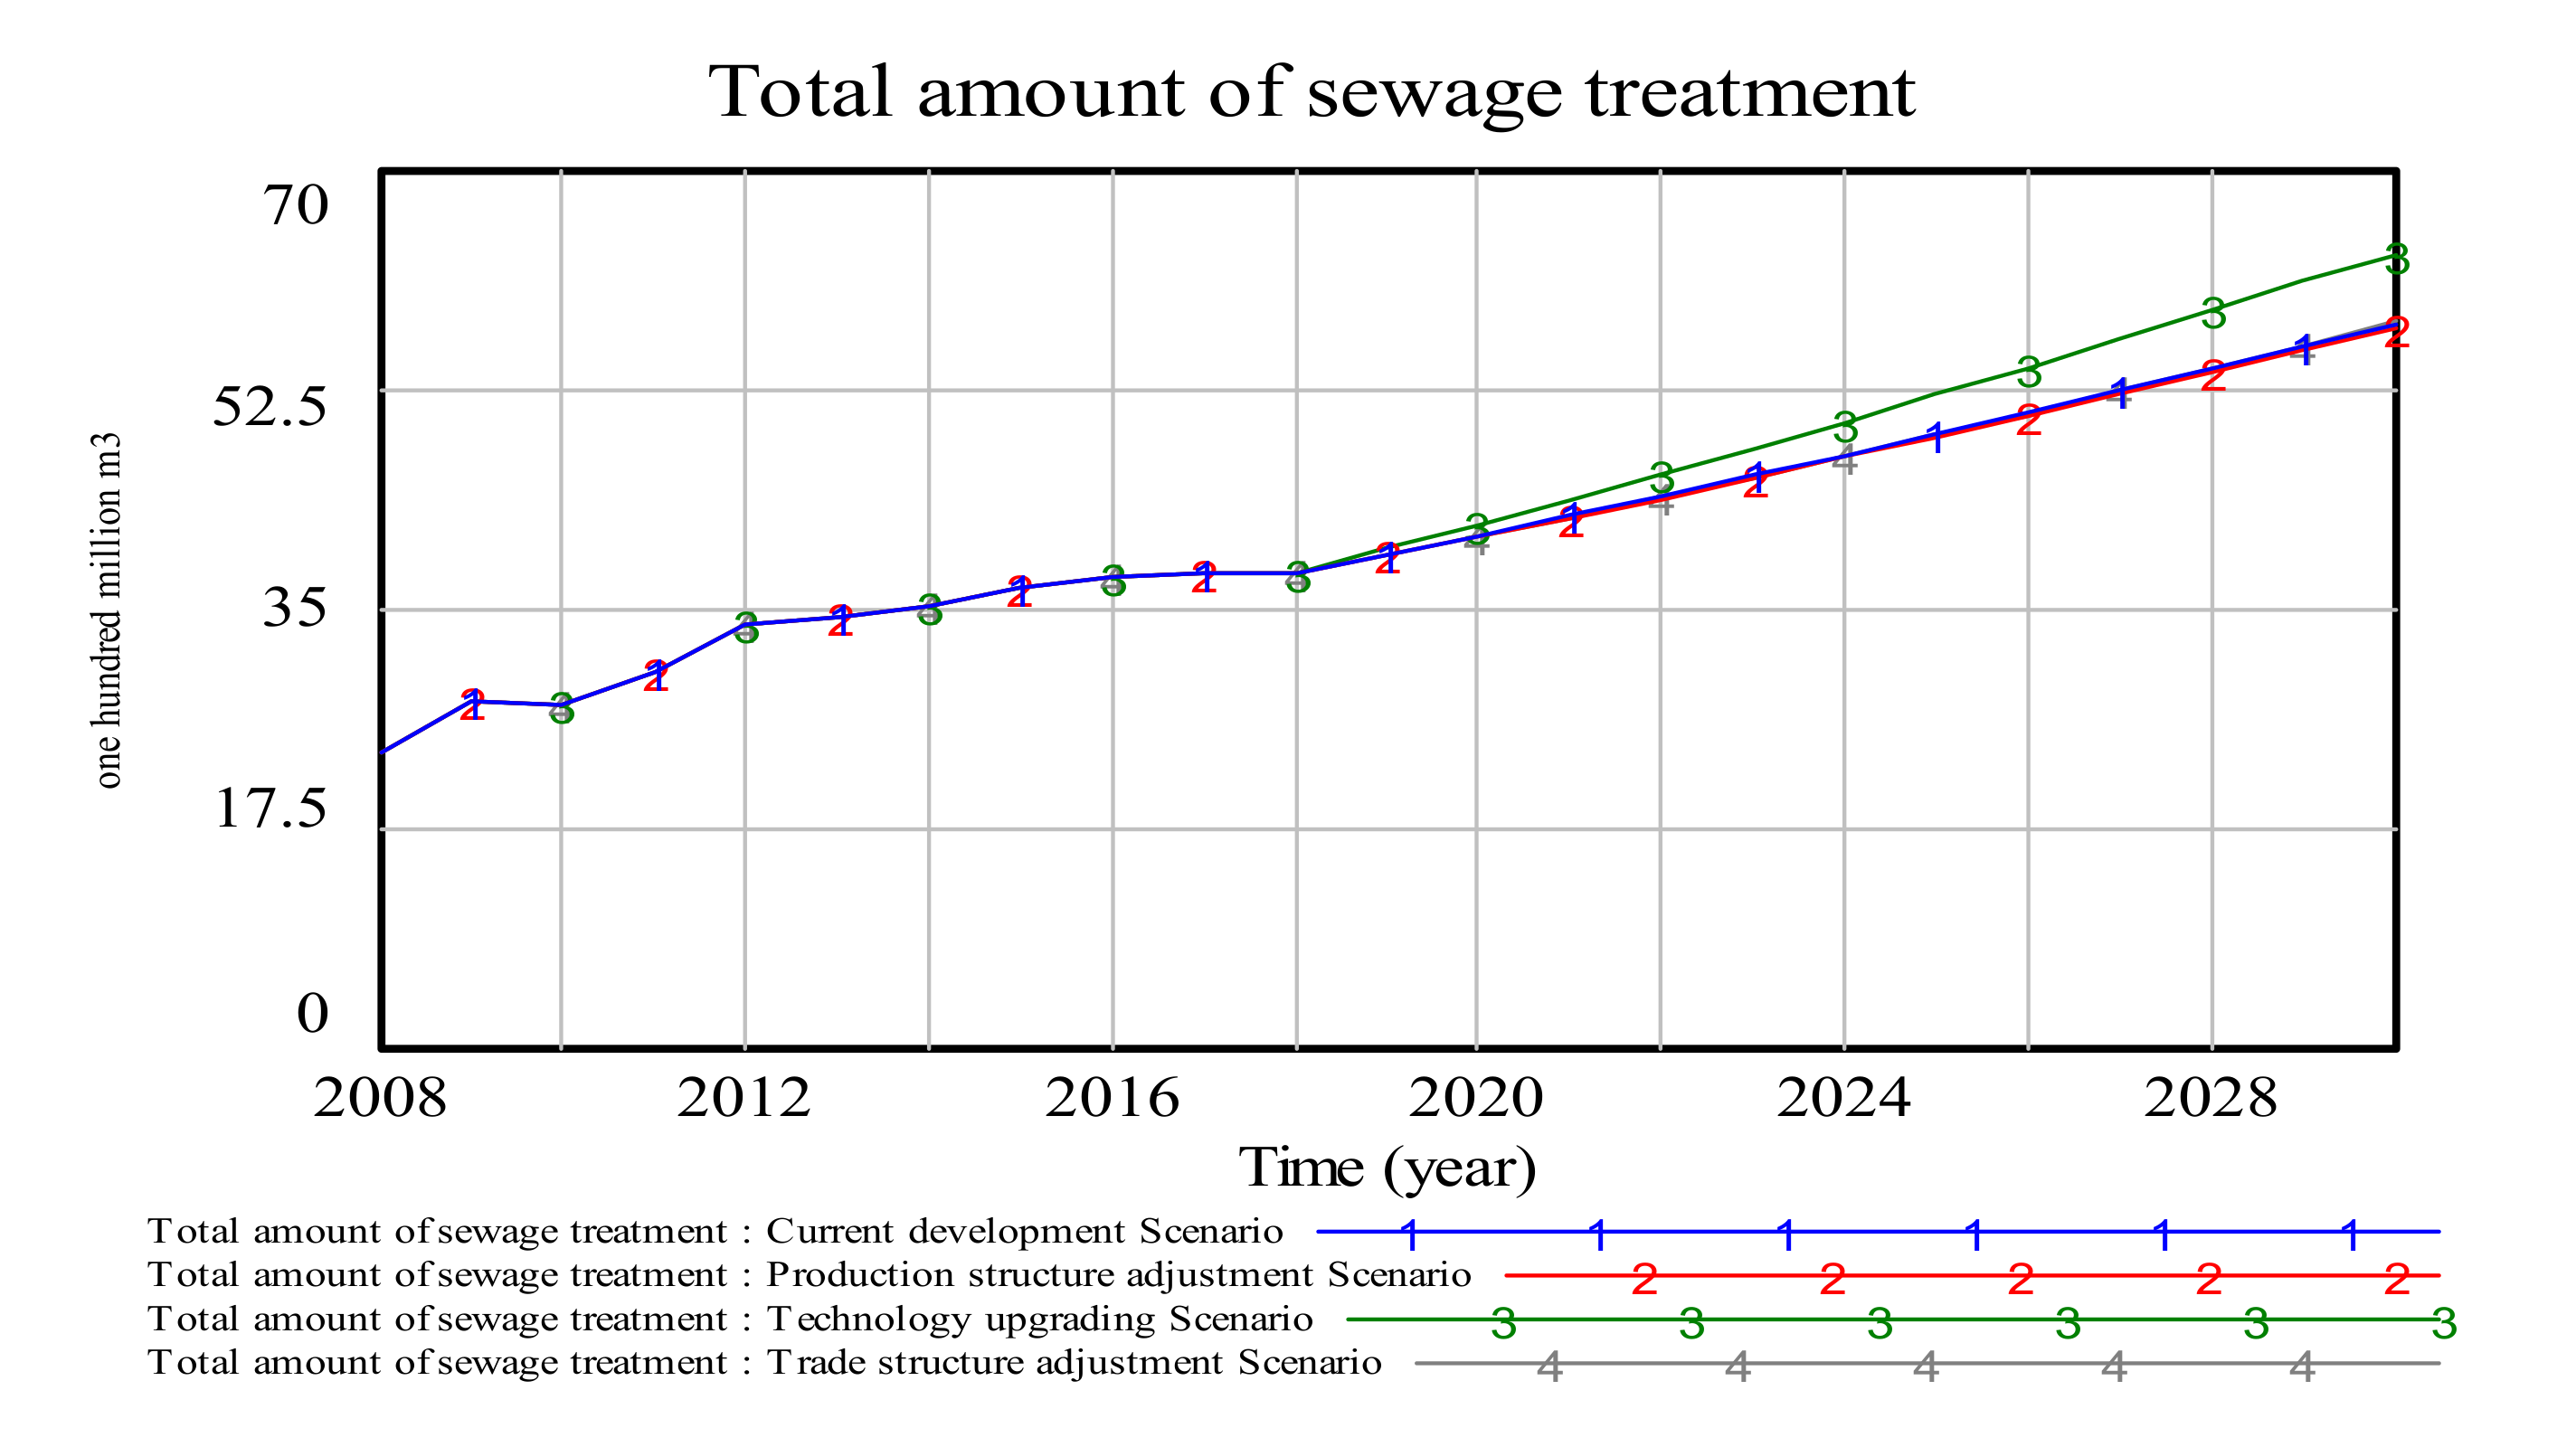
3.3.4. Total Amount of Sewage Treatment

The total amount of sewage treatment will exhibit an upward trend in the four scenarios from 2019 to 2030. Due to the increase of the sewage treatment rate with technology improvement, the total amount of sewage treatment in the technology upgrading scenario will be the highest. However, the production structure adjustment scenario will exhibit the lowest total amount of sewage treatment during this period (Appendix D Figure A3).

3.3.5. Total Available Water Resources

The total available water resources are expected to rise in all four scenarios from 2019 to 2030. In the scenario of technology upgrade, the sewage treatment rate is higher than that in other scenarios, leading to higher reclaimed water and total available water resources. (Appendix D Figure A4).

3.3.6. Virtual Water Flow

Both the domestic and foreign trade adjustment coefficients in the virtual water strategy will be slashed in the scenario of trade structure adjustment, leading to a lower net blue virtual water outflow of either the primary industry or the secondary and tertiary industries than in any other scenario during 2019–2030 (Appendix D Figure A5). The net blue virtual water outflow of the primary industry in foreign trade will be negative in any scenario every year, and we can observe that the scenario of trade structure adjustment will show us the largest net blue virtual water inflow of the primary industry in foreign trade. For the net blue virtual water outflow of the primary industry in domestic trade, the value in the scenario of trade structure adjustment will be much smaller than that in any other scenario. Meanwhile, in the scenario of trade structure adjustment, the net blue virtual water outflow of the secondary and tertiary industry in either foreign trade or domestic trade will be smaller than that in any other scenario.

3.4. Results of the Socioeconomic and Environmental Performance in Water Scarcity Reduction

From the results of the comparison, during 2019–2030, in the current development scenario, the total population will be lower than that in the technology upgrade scenario, and the living water footprint will be the largest in the four scenarios. If we maintain the current development trend, except the living water footprint, all of the indicators involving the water footprint above will be the second largest in the four scenarios, and only a little smaller than those in the trade structure adjustment scenario.
Amongst the four scenarios from 2019 to 2030, the scenario of production structure adjustment will result in the lowest production-based blue water footprint of the three industries, the smallest theoretical production-based blue water footprint of crop products, and the lowest total amount of sewage treatment. It will have the second smallest total population, GDP, and living water footprint.
In the technology upgrade scenario, during 2019–2030, the total population and GDP will be much larger than those in any other scenario; the living water footprint and the production-based blue water footprint of either the secondary industry or the tertiary industry will be the smallest; and the production-based blue water footprint of the three industries and the theoretical production-based blue water footprint of crop products will be the second smallest. With the improvement of the sewage treatment rate and utilization rate of reclaimed water, the total amount of sewage treatment, as well as the total available water resources, will become higher than those in any other scenario.
In the condition of trade structure adjustment, during 2019–2030, due to the change of domestic and foreign trade adjustment coefficients in the virtual water strategy, the net blue virtual water outflow of the primary industry or the second or tertiary industry, in either foreign or domestic trade, will be the smallest in the four scenarios. What is more, the total population it carries will also be the smallest.

4. Discussion

4.1. Policy Implications

Based on the results of WS evaluation, and the socioeconomic and environmental performance in WS reduction presented above, it is proposed that in order to achieve sustainable development of society, the economy, and the environment, Henan should comprehensively adopt production structure adjustment, technology upgrade, and trade restructuring with specific priorities, depending on the actual management target and the pros and cons of the scenarios.
For instance, if the decline of WS is the most urgent need, while the social and economic growth can be slowed, the production structure adjustment should be the main focus. Regarding food security in China, Henan can reasonably reduce the production or output value proportion of the primary products and sectors with a high production-based blue water footprint, including products like maize, corn, rice, pork, as well as sectors like “Manufacture of food and tobacco”, “Construction”, “Accommodation, food and beverage services”, especially those with a high water use coefficient, like maize, “Manufacture of food and tobacco”, “Accommodation, food and beverage services”. Specific measures to implement the adjustment consist of pricing water by considering its cost more reasonably, making the land use plan considering the industry adjustment, eliminating the favorable policies or imposing more tax appropriately on the production of these products or sectors, undertaking a more strict standard of water use in production, to a degree that the relevant enterprises can accept.
When the socio-economic development is the most important factor, and the WS also needs reducing, technology upgrade can be implemented as a priority. The technology to be improved includes that of water savings in the irrigation, production and residents’ living, water purification in sewage treatment, pollution control in the production, and the like. These kinds of technology enhancement can be realized through improving talent introduction policies, optimizing the talent training mechanism, offering technological investment and subsidies to enterprises who devote time to research and development, setting up funds to encourage the introduction and application of these technologies, strengthening the supervision of sewage discharge of enterprises, implementing the regulation of environmental tax and emission trading, etc.
If the social and economic elements are expected to develop at the current rate, and the growth speed of the WS is expected to be whittled down, Henan should choose to pay more attention to trade restructuring. On one hand, for the primary products or sectors with high blue virtual water outflow in the domestic (foreign) trade, especially those with high water intensity, the government is advised to focus on reducing their share of domestic (foreign) outflow in the total outflow of the industry to which the sector is subordinated. According to the results above, those products or sectors whose inter-provincial outflow percentage in the involved industry should be reduced include wheat, “Manufacture of food and tobacco”, “Manufacture and processing of metals”, accommodation, food and beverage services. In the total export of the secondary industry, the export percentage of sectors such as “Manufacture of communication equipment, computer and other electronic equipment”, “Manufacture of textile wearing apparel, footwear, leather, fur, feather and its products” and “Manufacture of chemicals and chemical products” should be cut down. On the other hand, for the primary products or sectors with high blue virtual water inflow in domestic (foreign) trade, also especially those with high water intensity, their inflow percentage in the total inflow of the industry to which the sector is subordinated should be increased. Those whose inter-provincial inflow share should be increased include rice, “Manufacture of general-purpose and special-purpose machinery”, “Manufacture of transport equipment”, “Health care and social work activities”, etc. Meanwhile, for sectors “Manufacture of communication equipment, computer and other electronic equipment”, “Manufacture of food and tobacco”, and “Education”, their import proportion in the corresponding industry should also be increased. The outflow restriction and inflow promotion in the domestic trade of Henan always focus more on the local rectification of production planning, trade subsidiary, sales tax, as well as the overall regulation and control of the country. The export restrictions above can be implemented by export limitation, export tariff increase, export licensing control, export subsidiary reduction or elimination, adoption of resource and environment accounting system in the price of export commodities, etc. Import tariff reduction or elimination, import quotas raising, custom procedure simplification, and the like, can be effective in import promotion.
Overall, the comprehensive results in this study will offer a relatively complete reference for decision making.

4.2. Model Comparison

The WS evaluation model in existing research involving Henan from the virtual water perspective [54,55], was compared with the improved model in this study. On the one hand, the former defines water scarcity as the ratio of the production-based blue water footprint to water availability, while the improved model in this study shows the ratio of the consumption-based blue water footprint to water availability. As mentioned in the introduction, the production-based blue water footprint represents the water use in local production for the goods and services demand of local and other regions, part of which is an external demand rather than a local one. Meanwhile, the consumption-based blue water footprint is the water use in local or external production for the local goods and services demand [16,17], which can show the actual local demand of real and virtual water more accurately. Therefore, the improved model in this study can reflect the comparison result of the local water demand with the local water supply more realistically. On the other hand, in the existing research, the relationship between WS and relevant socioeconomic and environmental factors is not involved. Therefore, the estimation of the water demand in the prediction of WS is relatively rough, and only the water demand reduction and supply increase are focused on in the suggestions of WS reduction, whilst the performance of the society, economy, and environment in WS reduction is not considered. However, the improved model in this study is based on an integrated system composed of the dynamics and interactions of WS and its socioeconomic and environmental factors. The WS prediction is more reliable based on the trend and plan of social, economic, and environmental development, and the performance of the socioeconomic and environmental subsystems is presented in WS reduction, which is necessary for practical policymaking.
As mentioned above in the introduction, only the authors of [26,36] adopt a system dynamics model to evaluate WS from a virtual water perspective in the existing research. Comparing the improved model of this study with that work, firstly, the WS in the existing model is the ratio of the production-based blue water footprint to the sum of the water availability and virtual water inflow, where part of the production-based blue water footprint is always based on the demand of other regions rather than local ones, and the virtual water inflow is not from the local water supply. Comparatively, the improved model defines the WS as the ratio of the consumption-based blue water footprint to the water availability, where the consumption-based blue water footprint can evaluate the local demand of real and virtual water more accurately, and the water availability reflects the local water supply more precisely. Therefore, the WS in this study can more realistically show a comparison of the local water demand and local water supply.
Secondly, the model in the existing research does not involve the factors of service water use, and only predicts the service water use from the changing trend. The driving mechanism of factors, such as the economic growth, trade, and water use efficiency in the tertiary industry, is displayed in this study. By combining this driving mechanism with the trend of relevant socioeconomic development, water use in the tertiary industry can be predicted with more evidence-based data, resulting in a more accurate WS value. Besides, the driving mechanism can help find the measures that can be taken to reduce WS more specifically based on factor adjustment, such as production structure adjustment, technology upgrading, and trade restructuring, in this study.
Thirdly, the product use structure matrices and the sectoral direct water use coefficients in the local and other regions of the country and foreign countries, as well as the regional use structure matrices of products from these three kinds of regions, are distinguished in the improved model of this study in comparison to existing research. Due to various sectoral contents and diverse levels of technology in different regions, both the product use structure matrices and the sectoral direct water use coefficients should be identified in these kinds of regions. Additionally, the regional use structure matrices of products from local regions and other regions, both domestic and international, are always different due to various features and costs of products from different regions. Consequently, the identification of these matrices and coefficients in this improved model can help enhance the assessment precision of the consumption-based blue water footprint and WS.
Last but not least, the existing models only show the value change of WS in diverse scenarios, while the improved model in this study also presents the performance of socioeconomic and environmental subsystems in WS reduction. In the four scenarios of Henan supply-side structural reform in this paper, the current development scenario presents the highest WS and living water footprint, as well as the second largest total population; the production structures upgrading results in not only the lowest average WS, but also the second smallest total population and GDP; the technology enhancement scenario shows the second lowest average WS and the largest total population, GDP and total available water resources; and in the trade restructuring scenario, the WS only increases more slightly than in the current development scenario, with the smallest total population. For this reason, the improved model in this study is helpful for the government when they make scientific policies considering not only WS reduction, but also the development of society, the economy, and the environment.

4.3. Discussion of the Model

We can also use multi-regional input–output (MRIO) analysis to distinguish the product use structure matrix and sectoral direct water use coefficient in different regions, together with the use structure matrix of the product from various regions, in the evaluation of the water footprint and virtual water flow. However, due to a lack of statistical data, sectoral trade data between any two regions in a country and the sectoral direct water use coefficient in some regions are always dependent on estimations in MRIO analysis, which makes the results sensitive, with great differences being reported in various research [56,57]. What is more, the data collection and calculation in MRIO are complex, as it contains many kinds of data, mass estimates, and balance adjustment of the MRIO table, etc. The model in this paper requires less estimation, data collection, and complicated calculations when identifying the product use structure matrices and the sectoral direct water use coefficients in local and other domestic regions, and foreign countries, as well as the regional use structure matrices of products from these three kinds of regions, which is much simpler than MRIO and more accurate than regional IO analysis.
Moreover, in the water footprint and virtual water flow accounting of the primary industry, as it is hard to distinguish how many agricultural products are directly consumed by humans and how many are consumed by livestock in a region, we estimated the net outflow of these products by assuming that any agricultural products are consumed equally per capita, as done in [45]. However, in fact, as mentioned above, some agricultural products, such as maize, are used for not only residents’ diets, but also livestock feed, and the flow of these products is influenced by both the population and the number of livestock. Therefore, in further research, we can try to distinguish the amount of products used for residents’ food and livestock feed by region through statistical data collection, field investigations, and model estimation. Based on that, the flow of agricultural products for residents’ diets and for livestock feed can be respectively estimated, which will help increase the estimation accuracy of the water footprint and virtual water flow in the primary industry, and thus that of the regional WS.

5. Conclusions

An accurate and practically useful assessment of regional water scarcity is necessary in monitoring the scarcity and relieving the corresponding threat. In order to estimate water scarcity more accurately and provide an integrated presentation of the socioeconomic and environmental performance in water scarcity reduction for practical policymaking, we proposed an improved system dynamics model to evaluate water scarcity from a virtual water perspective, and conducted a case study of Henan province, China, in this study.
To overcome the limitations in existing system dynamics models of water scarcity evaluation from a virtual water perspective, in the model of this study, the water scarcity is taken as the ratio of the consumption-based blue water footprint to the water availability, in order to compare the water requirements that need to be met to satisfy the local demand with water supply; the economic growth, international and domestic trade, and water use efficiency in the tertiary industry are integrated into the system dynamics model, in order to improve the accuracy of water scarcity assessment and help find more specific measures to reduce water scarcity based on factor adjustment; the regional use structure matrices of the product from local and other regions of the country, and foreign countries, as well as the sectoral direct water use coefficients and product use structure matrices in these three kinds of regions, are identified to enhance the veracity of calculation; and the socioeconomic and environmental performance is presented in the water scarcity reduction, in order to provide more comprehensive reference for water management and sustainable development policymaking.
From the results of the case study, it can be seen that Henan has been suffering from, and in the near future could continue to face, water scarcity, with an average of 2.19 and annual rise of 1.37% during 2008–2030. Measures of production structure adjustment, technology upgrade, and trade structure adjustment in Henan supply-side structural reform, which is the main line of work in China, have various effects on water scarcity reduction and socioeconomic and environmental changes. The case study indicates that the proposed model can effectively evaluate regional water scarcity, and comprehensive measures to relieve water scarcity should be taken, with priorities being identified according to the socioeconomic and environmental performance.
The proposed model presented in this study can also be applied to water scarcity evaluation and reduction measures exploration in other regions of China, as well as regions in other countries. Comprehensive measures with priorities in accordance with the socioeconomic and environmental performance in water scarcity reduction should be taken in regional and inter-regional water management and policy making in China and far beyond.

Supplementary Materials

The following are available online at https://www.mdpi.com/2071-1050/12/18/7517/s1, Table S1: Value of all the variables in the water scarcity evaluation system of Henan during 2008–2030.

Author Contributions

Z.W. conceptualization, methodology, software, formal analysis, resources, data curation, writing—original draft preparation, project administration, funding acquisition; Y.Z. software, validation, resources, formal analysis, data curation, writing—original draft preparation; Y.H. data curation, writing—original draft preparation; Q.Y.: formal analysis, writing—original draft preparation; L.X. resources, data curation; S.W. writing—original draft preparation. All authors have read and agreed to the published version of the manuscript.

Funding

This research was funded by the Foundation for Humanities and Social Sciences Research of the Ministry of Education of China, 20YJC630161; the Fundamental Research Funds for the Central Universities of China, 2017B19014.

Conflicts of Interest

The authors declare no conflict of interest. The sponsors had no role in the design, execution, interpretation, or writing of the study.

Appendix A

Table A1. Classification of economic sectors in the non-competitive input–output tables in Henan.
No.Sector No.Sector
1Farming, forestry, animal production and fishery20Other manufacture
2Mining and washing of coal21Scrap and waste
3Extraction of crude petroleum and natural gas22Production and supply of electricity and steam
4Mining of metal ores23Production and distribution of gas
5Mining and quarrying of nonmetallic minerals and other minerals24Production and distribution of water
6Manufacture of food and tobacco25Construction
7Manufacture of textiles26Wholesale and retail trade
8Manufacture of textile wearing apparel, footwear, leather, fur, feather and its products27Transport, storage, and post
9Processing of timbers and manufacture of furniture28Accommodation, food and beverage services
10Papermaking, printing and manufacture of articles for culture, education and sports activities29Information transmission, software, and information technology services
11Manufacture of refined petroleum, coke products, processing of nuclear fuel30Finance
12Manufacture of chemicals and chemical products31Real estate
13Manufacture of nonmetallic mineral products32Renting and leasing, business services
14Manufacture and processing of metals33Scientific research and development, technical services
15Manufacture of fabricated metal products, except machinery and equipment34Other services
16Manufacture of general-purpose and special-purpose machinery35Education
17Manufacture of transport equipment36Health care and social work activities
18Manufacture of electrical machinery and apparatus37Culture, sports and entertainment
19Manufacture of communication equipment, computer and other electronic equipment38Public management, social security and social organization
Note: In this table, sector 1 is the primary industry, sectors 2–25 are subordinated to the secondary industry, and sectors 26–38 belong to the tertiary industry.

Appendix B

Equations in the flow diagram of the system dynamics model.
Actual water use for 10,000 yuan GDP = Total blue water footprint * 10,000/GDP
COD discharge of industrial wastewater = Industrial wastewater discharge * COD discharge coefficient of industrial wastewater
COD discharge of living sewage = COD discharge coefficient of living sewage * Discharge of living sewage
Discharge of living sewage = Discharge coefficient of living sewage * Living water footprint
Domestic blue water footprint of the secondary industry = Water use of the secondary industry × Blue water footprint multiplier of the secondary industry
Domestic blue water footprint of the tertiary industry = Water use of the tertiary industry × Blue water footprint multiplier of the tertiary industry
Domestic blue water footprint = (Theoretical domestic blue water footprint of crop products+ Domestic blue water footprint of animal products) × Production structure adjustment coefficient of the primary industry + Domestic blue water footprint of the secondary industry + Domestic blue water footprint of the tertiary industry
Domestic water footprint change of crop products = Domestic water footprint of crop products * Growth rate of domestic water footprint of crop products*(if then else(Water scarcity > = 2,2-Water scarcity/2,1))
Domestic water footprint of crop products (t) = Domestic water footprint of crop products (t-1) + Domestic water footprint change of crop products
Field water consumption = Domestic water footprint of crop products - Domestic green water footprint of crop products
GDP (t) = GDP (t-1) + GDP increment
GDP increment = GDP* GDP growth rate*(if then else(Water scarcity > = 2,2-Water scarcity/2,1))
GDP per capita = GDP * 10000/Total population
Industrial value added (t) = Industrial value added (t-1) + Increment of industrial value added
Increment of industrial value added = Industrial value added * Growth rate of industrial value added*(if then else(Water scarcity > = 2,2-Water scarcity/2,1))
Increment of the value added in the tertiary industry = Value added in the tertiary industry * Growth rate of the value added in the tertiary industry*(if then else(Water scarcity > = 2,2-Water scarcity/2,1))
Industrial wastewater discharge = Discharge coefficient of industrial wastewater * Total industrial water use
Living water footprint = Rural living water use + Urban living water use
Population Increment = Total population * Population growth rate*(if then else(Water scarcity > = 2,2-Water scarcity/2,1))
Reclaimed water = Total amount of sewage treatment * Utilization ratio of reclaimed water
Rural living water use = Rural population * Rural living water use per capita/10000
Rural population = Total population - Urban population
Theoretical domestic blue water footprint of crop products = Field water consumption/Utilization coefficient of irrigation water
Total population (t) = Total population (t-1) + Population increment
Total amount of sewage treatment = Total discharge of sewage * Sewage treatment rate
Total available water resources = Reclaimed water + Underground available water resources + Surface available water resources
Total water requirement = Domestic blue water footprint + Living water footprint + Eco-environmental water footprint - (Net blue virtual water outflow of the primary industry in the domestic trade + Net blue virtual water outflow of the secondary and tertiary industry in the domestic trade) × (1- Domestic trade adjustment coefficient in the virtual water strategy) - (Net blue virtual water outflow of the primary industry in the foreign trade + Net blue virtual water outflow of the secondary and tertiary industry in the foreign trade) × (1 Foreign trade adjustment coefficient in the virtual water strategy)
Total COD discharge = COD discharge of industrial wastewater + COD discharge of living sewage
Total discharge of sewage = Industrial wastewater discharge + Discharge of living sewage
Total industrial water use = Industrial value added * Water use for 10,000 yuan industrial value added/10000
Urban living water use = Urban population * Urban living water use per capita/10000
Urban population = Total population * Urbanization rate
Value added in the tertiary industry (t) = Value added in the tertiary industry (t-1) + Increment of the value added in the tertiary industry
Water scarcity = Total blue water footprint/Total available water resources
Water use of the secondary industry = Total industrial water use/Proportion of industrial water use
Water use of the tertiary industry = Water use for 10,000 yuan value added in the tertiary industry * Value added in the tertiary industry/10,000.

Appendix C

Table A2. Basis of parameter value setting in the water scarcity evaluation system of Henan during 2019–2030.
ParametersBasis
GDP growth rate13th Five-Year Plan for National Economic and Social Development of Henan Province
Population growth ratePopulation Development Plan of Henan Province (2016–2030)
Urbanization ratePopulation Development Plan of Henan Province (2016–2030)
Sewage treatment rate13th Five-Year Plan of Ecological Environment Protection in Henan Province
Discharge coefficient of living sewageThe development trend in linear prediction
Utilization ratio of reclaimed water13th Five-Year Plan of Ecological Environment Protection in Henan Province
Discharge coefficient of industrial wastewaterThe development trend in linear prediction
Utilization coefficient of irrigation water13th Five-Year Plan of Water Saving Society Construction in Henan Province
Domestic trade adjustment coefficient in the virtual water strategySet as 1
Production structure adjustment coefficient of the primary industrySet as 1
Eco-environmental water footprintThe development trend in linear prediction
Domestic blue water footprint of animal productsThe accounting results in this paper, and the development trend in linear prediction
Net blue virtual water outflow of the primary industry in the domestic tradeThe accounting results in this paper and the development trend in linear prediction
Net blue virtual water outflow of the secondary and tertiary industry in the foreign tradeThe accounting results in this paper and the development trend in linear prediction
Urban living water use per capitaThe development trend in linear prediction
Rural living water use per capitaThe development trend in linear prediction
Domestic green water footprint of crop productsThe accounting results in this paper and the development trend in linear prediction
Growth rate of the value added in the tertiary industry13th Five-Year Plan for National Economic and Social Development of Henan Province
Growth rate of industrial value13th Five-Year Plan for National Economic and Social Development of Henan Province
Growth rate of domestic water footprint of crop productsThe accounting results in this paper and the development trend in linear prediction
Water use for 10,000 yuan value added in the tertiary industry13th Five-Year Plan of Water Saving Society Construction in Henan Province
Water use for 10,000 yuan industrial value added13th Five-Year Plan of Water Saving Society Construction in Henan Province
Foreign trade adjustment coefficient in the virtual water strategyThe development trend in linear prediction
Blue water footprint multiplier of the secondary industryThe accounting results in this paper and the development trend in linear prediction
Blue water footprint multiplier of the tertiary industryThe accounting results in this paper and the development trend in linear prediction
Net blue virtual water outflow of the primary industry in the foreign tradeThe accounting results in this paper and the development trend in linear prediction
Net blue virtual water outflow of the secondary and tertiary industry in the domestic tradeThe accounting results in this paper and the development trend in linear prediction

Appendix D

Figure A1. Diagram (a) Trend of total population in Henan during 2008–2030 in the scenarios; Diagram (b) Trend of living water footprint in Henan during 2008–2030 in the scenarios.
Sustainability 12 07517 g0a1
Figure A2. Diagram (a) Trend of GDP in Henan during 2008–2030 in the scenarios; Diagram (b) Trend of theoretical production-based blue water footprint of crop products in Henan during 2008–2030 in the scenarios; Diagram (c) Trend of production-based blue water footprint of the secondary industry in Henan during 2008–2030 in the scenarios; Diagram (d) Trend of production-based blue water footprint of the tertiary industry in Henan during 2008–2030 in the scenarios.
Sustainability 12 07517 g0a2aSustainability 12 07517 g0a2b
Figure A3. Trend of total amount of sewage treatment in Henan during 2008–2030 in the scenarios.
Sustainability 12 07517 g0a3
Figure A4. Trend of total available water resources in Henan during 2008–2030 in the scenarios.
Sustainability 12 07517 g0a4
Figure A5. Diagram (a) Trend of net blue virtual water outflow of the primary industry in the foreign trade in Henan during 2008–2030 in the scenarios; Diagram (b) Trend of net blue virtual water outflow of the primary industry in the domestic trade in Henan during 2008–2030 in the scenarios; Diagram (c) Trend of net blue virtual water outflow of the secondary and tertiary industries in the foreign trade in Henan during 2008–2030 in the scenarios; Diagram (d) Trend of net blue virtual water outflow of the secondary and tertiary industries in the domestic trade in Henan during 2008–2030 in the scenarios.
Sustainability 12 07517 g0a5aSustainability 12 07517 g0a5b

References

  1. Zhang, C.; Zhong, L.; Wang, J. Decoupling between water use and thermoelectric power generation growth in China. Nat. Energy 2018, 3, 792–799. [Google Scholar] [CrossRef]
  2. Zhou, Y.; Ma, J.; Zhang, Y.; Qin, B.; Jeppesen, E.; Shi, K.; Brookes, J.D.; Spencer, R.G.M.; Zhu, G.; Gao, G. Improving water quality in China: Environmental investment pays dividends. Water Res. 2017, 118, 152–159. [Google Scholar] [CrossRef] [PubMed]
  3. Jiang, M.; Behrens, P.; Wang, T.; Tang, Z.; Yu, Y.; Chen, D.; Liu, L.; Ren, Z.; Zhou, W.; Zhu, S.; et al. Provincial and sector-level material footprints in China. Proc. Natl. Acad. Sci. USA 2019, 116, 26484–26490. [Google Scholar] [CrossRef] [PubMed] [Green Version]
  4. Zhao, X.; Liu, J.; Yang, H.; Duarte, R.; Tillotson, M.R.; Hubacek, K. Burden shifting of water quantity and quality stress from megacity Shanghai. Water Resour. Res. 2016, 52, 6916–6927. [Google Scholar] [CrossRef]
  5. Ma, T.; Sun, S.; Fu, G.; Hall, J.W.; Ni, Y.; He, L.; Yi, J.; Zhao, N.; Du, Y.; Pei, T.; et al. Pollution exacerbates China’s water scarcity and its regional inequality. Nat. Commun. 2020, 11, 650. [Google Scholar] [CrossRef] [Green Version]
  6. Jiang, Y. China’s water scarcity. J. Environ. Manag. 2009, 90, 3185–3196. [Google Scholar] [CrossRef]
  7. Mekonnen, M.M.; Hoekstra, A.Y. Four billion people facing severe water scarcity. Sci. Adv. 2016, 2, e1500323. [Google Scholar] [CrossRef] [Green Version]
  8. Jafari Shalamzari, M.; Zhang, W. Assessing water scarcity using the water poverty index (WPI) in Golestan Province of Iran. Water 2018, 10, 1079. [Google Scholar] [CrossRef] [Green Version]
  9. Wang, H.; Fan, L.; Liang, Y.; Wang, C. An integrated approach for water scarcity evaluation—A case study of Yunnan, China. Environ. Dev. Sustain. 2018, 20, 109–127. [Google Scholar] [CrossRef]
  10. Vorosmarty, C.J. Global water resources: Vulnerability from climate change and population growth. Science 2000, 289, 284–288. [Google Scholar] [CrossRef] [Green Version]
  11. Allan, J.A. Fortunately There Are Substitutes for Water Otherwise our Hydro Political Future Would Be Impossible; ODA: London, UK, 1993; pp. 13–26. [Google Scholar]
  12. Hoekstra, A.Y.; Chapagain, A.K.; Aldaya, M.M.; Mekonnen, M.M. The Water Footprint Assessment Manual: Setting the Global Standard; World Bank Group: Washington, DC, USA, 2011. [Google Scholar]
  13. Sun, S.; Wang, Y.; Engel, B.A.; Wu, P. Effects of virtual water flow on regional water resources stress: A case study of grain in China. Sci. Total Environ. 2016, 550, 871–879. [Google Scholar] [CrossRef] [PubMed]
  14. Kalvani, R.S.; Sharaai, A.; Manaf, L.; Hamidian, A. Assessing ground and surface water scarcity indices using ground and surface water footprints in the Tehran Province of Iran. Appl. Ecol. Environ. Res. 2019, 17, 4985–4997. [Google Scholar] [CrossRef]
  15. Nouri, H.; Stokvis, B.; Galindo, A.; Blatchford, M.; Hoekstra, A.Y. Water scarcity alleviation through water footprint reduction in agriculture: The effect of soil mulching and drip irrigation. Sci. Total Environ. 2019, 653, 241–252. [Google Scholar] [CrossRef] [PubMed]
  16. Wu, Z.D. Inter-Regional Comparison of Water Footprint in China: Based on the “Production-Consumption” Perspective; Tsinghua University Press: Beijng, China, 2015. [Google Scholar]
  17. Feng, K.S.; Siu, Y.L.; Guan, D.B.; Hubacek, K. Assessing regional virtual water flows and water footprints in the Yellow River Basin, China: A consumption based approach. Appl. Geogr. 2012, 32, 691–701. [Google Scholar] [CrossRef]
  18. Schyns, J.F.; Hoekstra, A.Y. The added value of water footprint assessment for national water policy: A case study for Morocco. PLoS ONE 2014, 9, e99705. [Google Scholar] [CrossRef]
  19. Boulay, A.-M.; Bare, J.; Benini, L.; Berger, M.; Lathuilliere, M.J.; Manzardo, A.; Margni, M.; Motoshita, M.; Nunez, M.; Pastor, A.V.; et al. The WULCA consensus characterization model for water scarcity footprints: Assessing impacts of water consumption based on available water remaining (AWARE). Int. J. Life Cycle Assess. 2018, 23, 368–378. [Google Scholar] [CrossRef] [Green Version]
  20. Fu, M.; Guo, B.; Wang, W.; Wang, J.; Zhao, L.; Wang, J. Comprehensive Assessment of Water Footprints and Water Scarcity Pressure for Main Crops in Shandong Province, China. Sustainability 2019, 11, 1856. [Google Scholar] [CrossRef] [Green Version]
  21. Zhao, Y.; He, G.H.; Wang, J.H.; Gao, X.R.; Li, H.H.; Zhu, Y.N.; Jiang, S. Water stress assessment integrated with virtual water trade and physical transfer water: A case study of Beijing, China. Sci. Total Environ. 2020, 708, 134578. [Google Scholar] [CrossRef]
  22. Mikosch, N.; Becker, R.; Schelter, L.; Berger, M.; Usman, M.; Finkbeiner, M. High resolution water scarcity analysis for cotton cultivation areas in Punjab, Pakistan. Ecol. Indic. 2020, 109, 105852. [Google Scholar] [CrossRef]
  23. Liu, J.; Wang, Y.; Yu, Z.; Cao, X.; Tian, L.; Sun, S.; Wu, P. A comprehensive analysis of blue water scarcity from the production, consumption, and water transfer perspectives. Ecol. Indic. 2017, 72, 870–880. [Google Scholar] [CrossRef]
  24. Vanham, D.; Hoekstra, A.Y.; Wada, Y.; Bouraoui, F.; Roo, A.D.; Mekonnen, M.M. Physical water scarcity metrics for monitoring progress towards SDG target 6.4: An evaluation of indicator 6.4.2 “level of water stress”. Sci. Total Environ. 2018, 613, 218–232. [Google Scholar] [PubMed]
  25. Djehdian, L.A.; Chini, C.M.; Marston, L.; Konar, M.; Stillwell, A.S. Exposure of urban food-energy-water (FEW) systems to water scarcity. Sust. Cities Soc. 2019, 50, 101621. [Google Scholar] [CrossRef]
  26. Huang, H.P.; Wang, J.F.; Han, Y.P.; Wang, L.; Li, X.S. Assessing impacts of water regulations on alleviating regional water stress with a system dynamics model. Water Sci. Technol. Water Supply 2019, 19, 635–643. [Google Scholar] [CrossRef]
  27. Onat, N.C.; Kucukvar, M.; Tatari, O. Well-to-wheel water footprints of conventional versus electric vehicles in the United States: A state-based comparative analysis. J. Clean. Prod. 2018, 204, 788–802. [Google Scholar] [CrossRef]
  28. Vaca-Jiménez, S.; Gerbens-Leenes, P.W.; Nonhebel, S. Water-electricity nexus in Ecuador: The dynamics of the electricity’s blue water footprint. Sci. Total Environ. 2019, 696, 133959. [Google Scholar] [CrossRef]
  29. Sala, S.; Castellani, V. The consumer footprint: Monitoring sustainable development goal 12 with process-based life cycle assessment. J. Clean. Prod. 2019, 240, 118050. [Google Scholar] [CrossRef]
  30. Arto, I.; Andreoni, V. Global use of water resources: A multiregional analysis of water use, water footprint and water trade balance. Water Resour. Econ. 2016, 15, 1–14. [Google Scholar] [CrossRef] [Green Version]
  31. Reutter, B.; Lant, P.A.; Lane, J.L. Direct and indirect water use within the Australian economy. Water Policy 2018, 20, 1227–1239. [Google Scholar] [CrossRef]
  32. Palm, V.; Wood, R.; Berglund, M.; Dawkins, E.; Finnveden, G.; Schmidt, S.; Steinbach, N. Environmental pressures from Swedish consumption—A hybrid multi-regional input-output approach. J. Clean. Prod. 2019, 228, 634–644. [Google Scholar] [CrossRef]
  33. Lenzen, M. Aggregation Versus Disaggregation in Input-Output Analysis of the Environment. Econ. Syst. Res. 2011, 23, 73–89. [Google Scholar] [CrossRef]
  34. Allan, J.A. Virtual water: A strategic resource global solutions to regional deficits. Ground Water 1998, 36, 545–546. [Google Scholar] [CrossRef]
  35. Wu, Z.D.; Zhao, M.; Lall, U. A review of researches on Chinese water footprint. China Popul. Resour. Environ. 2013, 23, 73–80. [Google Scholar]
  36. Huang, H.P. Research on Mechanism of Virtual Water Transformation and Virtual Water Regulation. Ph.D. Thesis, Northwest University, Xi’an, China, 2016. [Google Scholar]
  37. Hong, S.Y.; Wang, H.R.; Cheng, T.; Lai, W.L. Water features and development strategy of tertiary industry in Beijing. China Popul. Resour. Environ. 2016, 26, 108–116. [Google Scholar]
  38. UNdata. Record View. Table 2.4 Value Added by Industries at Current Prices (ISIC Rev. 4). Available online: http://data.un.org/Data.aspx?q=accommodation+services&d=SNA&f=group_code%3a204%3bitem_code%3a34 (accessed on 6 June 2020).
  39. Falkenmark, M.; Lundqvist, J.; Widstrand, C. Macro-scale water scarcity requires micro-scale approaches. Aspects of vulnerability in semi-arid development. Nat. Resour. Forum 1989, 13, 258–267. [Google Scholar] [CrossRef]
  40. National Statistical Bureau of China. Statistic Yearbook of the People’s Republic of China 2019; China Statistics Press: Beijing, China, 2019. [Google Scholar]
  41. Department of National Accounts in National Statistical Bureau of China. Regional Input-Output Table of China 2012; China Statistics Press: Beijing, China, 2016. [Google Scholar]
  42. Novo, P.; Garrido, A.; Varela-Ortega, C. Are virtual water “flows” in Spanish grain trade consistent with relative water scarcity? Ecol. Econ. 2009, 68, 1454–1464. [Google Scholar] [CrossRef] [Green Version]
  43. FAO-56 Dual Crop Coefficient Method for Estimating Evaporation from Soil and Application Extensions | Journal of Irrigation and Drainage Engineering. Vol 131, No 1. Available online: https://ascelibrary.org/doi/pdf/10.1061/%28ASCE%290733-9437%282005%29131%3A1%282%29 (accessed on 27 June 2020).
  44. The Water Footprint of Poultry, Pork and Beef: A Comparative Study in Different Countries and Production Systems—ScienceDirect. Available online: https://www.sciencedirect.com/science/article/pii/S2212371713000024 (accessed on 6 June 2020).
  45. Wu, P.T. Report of Water Footprint and Regional Virtual Water Flow of Grain Production in China in 2014; China Agriculture Press: Beijing, China, 2016. [Google Scholar]
  46. Department of National Accounts in National Bureau of Statistics. Input-Output Tables of China in 2017; China Statistics Press: Beijing, China, 2019; ISBN 978-7-5037-9096-6. [Google Scholar]
  47. Mi, Z.; Meng, J.; Zheng, H.; Shan, Y.; Wei, Y.-M.; Guan, D. A multi-regional input-output table mapping China’s economic outputs and interdependencies in 2012. Sci. Data 2018, 5, 180155. [Google Scholar] [CrossRef] [Green Version]
  48. Shi, M.; Wang, Y.; Zhang, Z.; Zhou, X. Regional carbon footprint and interregional transfer of carbon emissions in China. Acta Geogr. Sin. 2012, 67, 1327–1338. [Google Scholar]
  49. Shen, X.; Lin, B.; Wu, W. R&D Efforts, Total Factor Productivity, and the Energy Intensity in China. Emerg. Mark. Financ. Trade 2019, 55, 2566–2588. [Google Scholar] [CrossRef]
  50. Laurenceson, J.; O’Donnell, C. New estimates and a decomposition of provincial productivity change in China. China Econ. Rev. 2014, 30, 86–97. [Google Scholar] [CrossRef] [Green Version]
  51. Li, J. Environmnetal regulation and improvement of total factor productivity: Technological progress or technological efficiency? Ecol. Econ. 2020, 36, 157–163. [Google Scholar]
  52. Wang, Y. The relationship between total factor productivity and inclusive financial development: Empirical analysis based on provincial panel data in China. Hebei Financ. 2020, 1, 33–38. [Google Scholar]
  53. Wu, Z.; Lall, U.; Wang, Z.; Tian, Z. Regional disparity of water footprint in China in the production perspective: The analytical framework of “amount-structure-efficiency”. China Popul. Resour. Environ. 2015, 25, 85–94. [Google Scholar]
  54. Xu, Z.; Chen, X.; Wu, S.R.; Gong, M.; Du, Y.; Wang, J.; Li, Y.; Liu, J. Spatial-temporal assessment of water footprint, water scarcity and crop water productivity in a major crop production region. J. Clean. Prod. 2019, 224, 375–383. [Google Scholar] [CrossRef]
  55. Zhuo, L.; Mekonnen, M.M.; Hoekstra, A.Y.; Wada, Y. Inter- and intra-annual variation of water footprint of crops and blue water scarcity in the Yellow River basin (1961–2009). Adv. Water Resour. 2016, 87, 29–41. [Google Scholar] [CrossRef]
  56. Tian, G.; Han, X.; Zhang, C.; Li, J.; Liu, J. Virtual Water Flows Embodied in International and Interprovincial Trade of Yellow River Basin: A Multiregional Input-Output Analysis. Sustainability 2020, 12, 1251. [Google Scholar] [CrossRef] [Green Version]
  57. Xu, X.; Zhang, Y.; Chen, Y. Projecting China’s future water footprint under the shared socio-economic pathways. J. Environ. Manag. 2020, 260, 110102. [Google Scholar] [CrossRef]
Figure 1. Study area.
Sustainability 12 07517 g001
Figure 2. Diagram (a) Flow diagram of the social water use subsystem in the system dynamics model evaluating the water scarcity in Henan; Diagram (b) Flow diagram of the economic water use subsystem in the system dynamics model evaluating the water scarcity in Henan; Diagram (c) Flow diagram of the water environment subsystem in the system dynamics model evaluating the water scarcity in Henan; Diagram (d) Flow diagram of the water supply subsystem in the system dynamics model evaluating the water scarcity in Henan; Diagram (e) Flow diagram of the virtual water flow subsystem in the system dynamics model evaluating the water scarcity in Henan. Notes: the indicators containing “industrial” indicate those of the secondary industry except construction; GDP is the gross domestic product; and COD is the chemical oxygen demand.
Sustainability 12 07517 g002aSustainability 12 07517 g002bSustainability 12 07517 g002c
Figure 3. Trend of water scarcity in Henan during 2008–2030.
Sustainability 12 07517 g003
Figure 4. Trend of water scarcity in Henan during 2008–2030 in the scenarios.
Sustainability 12 07517 g004
Table 1. Form of the competitive input–output table for Henan.
InputOutput
Intermediate UseFinal UseImportsInter-Provincial InflowTotal Output
Sector 1Sector 2Sector nTotal Final Consumption ExpenditureGross Capital FormationExportsInter-Provincial Outflow
Intermediate useSector 1x11x11x1nc1cp1e1po1i1pi1X1
Sector 2x21x22x2nc2cp2e2po2i2pi2X1
Sector nxn1xn2xnncncpnenponinpinXn
Value addedV1V2Vn
Total inputsX1X2Xn
Water useW1W2Wn
Table 2. Value setting of main parameters in the scenario analysis of Henan in 2030.
.Parameters Value Setting
Current Development
Scenario
Production Structure Adjustment ScenarioTechnology Upgrading ScenarioTrade Structure Adjustment Scenario
GDP growth rate7%6%9%7%
Population growth rate3‰3‰5‰3‰
Urbanization rate60%60%65%60%
Sewage treatment rate90%90%95%90%
Utilization ratio of reclaimed water35%35%40%35%
Discharge coefficient of industrial wastewater35%35%40%35%
Discharge coefficient of living sewage70%70%80%70%
Growth rate of production-based water footprint of crop products5‰0‰0‰5‰
Utilization coefficient of irrigation water68%68%72%68%
Domestic trade adjustment coefficient in the virtual water strategy100%100%100%80%
Foreign trade adjustment coefficient in the virtual water strategy100%100%100%80%
Production structure adjustment coefficient of the primary industry10.8511
Water use for 10,000-yuan value added in the tertiary industry775.57
Water use for 10,000-yuan industrial value added20201520
Blue water footprint multiplier of the secondary industry3.433.23.4
Blue water footprint multiplier of the tertiary industry2.322.12.3
Growth rate of industrial value added6%5%7%6%
Growth rate of the value added in the tertiary industry7.5%6%9%7.5%
Urban living water use per capita52524952
Rural living water use per capita40403840
Table 3. Model test of some of the main indicators in the water scarcity evaluation system of Henan.
YearTotal Population(10 Thousands)Total Industrial Water Use
(100 million m3)
ActualSimulatedErrorActualSimulatedError
2008991899180.000 51.5551.550.000
200999679967.30.000 51.4855.24−0.070
201010,43710,016.3−0.040 54.9755.250.010
201110,48910,066.5−0.040 60.1754.82−0.090
201210,54310,116.4−0.040 58.5763.170.080
201310,60110,168.2−0.041 51.8754.50.050
201410,66210,223.9−0.041 47.4352.230.100
201510,72210,282.3−0.041 47.3152.50.110
201610,78810,339.9−0.042 49.4251.010.030
201710,85310,401.5−0.04251.0350.05−0.017
201810,90610,459.4−0.04150.4049.57−0.016
YearProduction-Based Water Footprint of Crop Products(100 million m3)Water Use of the Tertiary Industry (100 million m3)
ActualSimulatedErrorActualSimulatedError
2008563.06563−0.00016.446.4−0.0058
2009541.11540−0.00207.347.90.0757
2010540.37540−0.00078.128.1−0.0027
2011569.87567−0.00509.038.7−0.0365
2012554.825560.002110.2310.40.0161
2013596.28595−0.002211.2811.50.0199
2014579.26577−0.003912.3911.66−0.0588
2015552.97551−0.003613.5813.80.0164
2016576.16573−0.005515.0615.40.0227
2017639.20607−0.050016.416.2−0.0120
2018652.07637−0.023017.917.8−0.0056
Note: “Actual” in the table indicates the actual value of indicators; “Simulated” denotes the simulated value after we input the value of all the indicators in the software Vensim; “Error” is the change rate of the simulated value relative to actual value.

