Article

Quick Wins Workshop and Companies Profiling to Analyze Industrial Symbiosis Potential. Valenciaport’s Cluster as Case Study

by
Miguel A. Artacho-Ramírez
1,
Bélgica Pacheco-Blanco
1,*,
Víctor A. Cloquell-Ballester
1,
Mónica Vicent
2 and
Irina Celades
2
1
Department of Engineering Projects, Universitat Politècnica de València, Camino de Vera s/n, 46022 València, Spain
2
Instituto de Tecnología Cerámica (ITC) Asociación de Investigación de las Industrias Cerámicas (AICE), Universitat Jaume I (UJI) Av. Vicent Sos Baynat s/n, 12006 Castellón, Spain
*
Author to whom correspondence should be addressed.
Sustainability 2020, 12(18), 7495; https://doi.org/10.3390/su12187495
Submission received: 9 July 2020 / Revised: 27 August 2020 / Accepted: 7 September 2020 / Published: 11 September 2020
(This article belongs to the Section Sustainable Management)

Abstract

:
Industrial symbiosis (IS) improves resource efficiency and creates sustainable opportunities by encouraging synergies between industries. However, managers still have difficulties in promoting IS, given the lack of appropriate managerial tools to efficiently obtain an overview of IS potential. In this paper, a procedure merging the Quick Wins Workshop format with clustering techniques is proposed, in order to both identify IS opportunities and support IS creation in the industrial cluster of Valenciaport. A total of 18 stakeholders took part in the study. As a result, 79 different resources classified into eight categories—materials (16), goods (14), space (11), expertise (11), energy (9), services (8), hydrocarbons (7), and water (3)—were derived and a total of 78 possible matchings were found. The creation of IS was supported by the clustering methods, which allow for the definition of common symbiotic features among stakeholders, classifying them into groups with similar IS potential. Three IS profiles were identified (high, medium, and low IS potential) and two strategic projects were devised, accordingly. It can be concluded that the proposed procedure provides useful managerial tools to identify resource flows, uncover patterns of exchange, identify possible matchings, and devise projects in communities interested in fostering IS from scratch.

1. Introduction

Industrial symbiosis (IS) has been widely recognized as a subfield of industrial ecology (IE), which allows businesses to put it into practice [1,2,3,4,5,6]. IE seeks to optimize resources and waste management by promoting interactions between different organizations occupying a common geographical area. IS implements the IE concept by closing the loop of industrial processes, transforming the waste of different industries into inputs for other industries, therefore enabling the transition from wasteful to closed-loop systems [7,8]. Since Frosch and Gallopoulos introduced this theoretical intercompany exchange of resources in 1989 [7], IS has gained popularity among scholars and practitioners, who have attempted to operationalize it in the form of eco-industrial parks (EIPs) [9]. However, despite the IS concept being simple and intuitively easy to understand, intercompany resource sharing remains a complex process, which seldom succeeds in practice. As IS became popular, many works devoted to understanding its nature and essence in practice have appeared in the literature [10,11,12,13,14]. The work of Chertow [9] examined international IS implementations in the early 1990s, assessing planned versus spontaneous cases. The author concluded that planned projects devised and funded by governments to develop “eco-industrial parks” tended to fail, especially those promoted from scratch, whereas projects promoted by private agents based on the exploitation of win–win situations and the motivation to exchange resources for reasons of economic efficiency succeeded. Thus, at the beginning of successful IS cases, companies typically engaged in exchanges to meet goals of cost reduction, revenue enhancement, or business expansion without the expressed recognition of the associated environmental benefits [15,16]. Once synergies reached a market fit and were consolidated over the long-term, a symbiotic pattern was recognized, normally by third parties such as academic institutions or business associations; environmental benefits were calculated; and symbiotic exchanges were developed further with some new entrants. The first exchanges in the Kalundborg EIP, the most paradigmatic example of IS implementation [9,17,18], followed this pattern. It began in 1970 and the number of exchanges significantly increased in the 1980s, but its symbiotic attributes remained unknown until 1989, when a high school project uncovered them. Then, academics described the existing networks from an environmental perspective in 1993 and, finally, the Symbiosis Institute was launched in 1996 to foster new exchanges [9].
Apart from the basic desire of improving profitability and business competitiveness, important environmental, social, and regulatory drivers also exist in initial IS applications. These drivers play a role, with relevance that has been growing significantly over time, as the linear model of production and consumption has been proven unsustainable. In recent decades, sustainability has increasingly received attention from scholars, practitioners, and policymakers, being seen as the best way to deal with the emerging conflicts between economy and ecology. Thus, if IE can be considered as the first theoretical pillar of IS, sustainability became the second theoretical pillar of IS [3]. From the sustainability point of view, IS has been redefined as a system approach to more sustainable and integrated industrial development, and as a solution to enhance environmental sustainability while simultaneously achieving economic benefits [17,19]. Under the sustainability umbrella, a new research and business interest regarding IS has reappeared, significantly increasing its number of scientific contributions, rising from two papers in 2006 to 38 in 2017 [3,20]. In this line, as part of its strategy to make the European economy more sustainable, the European Union drew up a Circular Economy Action Plan in 2015 [21]. This action plan included IS at the core of its strategies to help in “closing the loop” of product life cycles by promoting resource recycling and the reuse of co-products [22,23]. Since then, the European Commission and the Spanish government have increasingly put focus on IS as a way to foster Europe’s development towards CO2 neutrality and a circular economy [24,25].
Viewing IS as a tool to improve sustainability and contributing to the transition to a circular economy (CE), its applications have gradually flourished in many sectors around the world [22]. The transport sector is not an exception, as one of the main strategic objectives of sustainable growth is to ensure sustainable transport [26]. Thus, environmental issues in the seaport and shipping industry have received special attention [27,28,29,30,31]. Seaports are major intermodal transport hubs, which play an important role in global production and logistics systems, contributing to global economic growth. Indeed, seaports are places that improve the local economy due to the industrial, distribution, and tourist activities that take place around them. Obviously, seaport activities entail significant environmental impacts, turning them into places where conflicts between economy and ecology emerge in a very evident way. Thus, seaports are seen as the gateway of global trade (with more than four-fifths of global product trade by volume being carried by sea [32]) and, given the role they play as “crossing points” for waste and material, are ideal places to foster IS [27,28,29,30]. Many studies have shown the convenience of seaports as drivers to implement IS within both local and regional scopes [27,29,30]. Actually, the proximity of the Kalundborg seaport has been considered as one of the key factors contributing to the IS success of the Kalundborg EIP [9]. Moreover, port authorities (PAs), apart from acting as the principal regulatory player within seaports and providing services to improve their commercial and competitive positions within global logistics chains, have to meet environmental supranational regulations and the demands of local associations and NGOs, thus making them prone to moving toward sustainable and green port developments [33,34,35,36]. However, most PAs have difficulties in promoting IS initiatives on their own [28]. Apart from the typical IS barriers related to technical, logistic, regulatory, and organizational issues [22], there is a lack of managerial instruments, training, and useful tools for PAs to efficiently understand the big picture of IS potential between the different stakeholders operating in their seaports [5,28]. Literature reviews on IS tools and methods have described different alternatives focused on the identification of IS opportunities [37,38]. However, less attention has been paid to the development and analysis of tools that support subsequent developments leading to IS creation once those opportunities have been uncovered [5]. According to Yeo et al. [5], among existing tools that support IS creation there are three main groups. Online waste management platforms are the first group of tools that applies free-market mechanism-based matching among companies willing to exchange resources (e.g., the U.S. Materials Market Place [39], WasteIsNotWaste [40], Zero Waste Scotland [41], eSymbiosis [42]). The second group of tools are based on the process input–output stream-based mechanism for finding IS matchings. These tools do not only help to identify current synergies, but also help to find potential synergies through technical information about industry processes and their associated inputs/outputs [43]. The MacthMaker tool [44], the Core Resource of IS Practitioners (CRISP) tool, and its continuous evolutions from SYNERGie® to SYNERGie®4.0 [45] are good examples of support tools that rely on technical knowledge and capabilities to find appropriate matchings and recommendations. Finally, there is the group of tools based on opportunity identification through searching for an optimal solution among feasible solutions of source to sink matchings using mathematical optimization, including both linear and nonlinear programming [46]. Despite the fact that the aforementioned tools are good approaches toward achieving IS, they have some shortcomings that hinder their generalized use in practice: (1) waste exchange platforms require massive and active user participation to ensure continued use [47], and decentralized pure market mechanism by itself is unlikely to warrant the best use of resources [48]; (2) lack of usability and sociability, in regards to the human-to-human relationships connections, make the use of software tools using process input–output stream-based matching difficult [37]; and (3) data requirements to describe physical systems for optimization tools is too demanding for many companies. These limitations inhibit industry engagement and make it difficult for new entrants to foster IS initiatives from scratch. Moreover, as has been stated, many case studies of IS applications to seaports and city ports can be found in the literature [49,50,51,52,53], but, excluding few recent works analyzing the industrial context of seaports such as Marseille-Fos, Ningbo, Ulsan [54], and Aalborg [55,56], little attention has been paid to the specific features of IS applications in port-based industrial complexes [27], and even less in seaport clusters.
In the present study, a procedure was developed to fill these gaps by means of Quick Wins Workshops [57] plus a statistical analysis based on clustering techniques, which allows for identifying and classifying seaport stakeholders to better understand the existing and potential IS opportunities in a seaport cluster. Our objective was to develop a procedure to easily map resource flows, define common symbiotic features among stakeholders by classifying them into groups with similar IS potential, uncover kernels and patterns of exchange, and identify possible precursors to the symbiosis, which deserves technical, financial, or legal assistance and further research to facilitate green and profitable intercompany exchanges, as well as spotting new opportunities.
This procedure was applied in the seaport cluster managed by the Port Authority of Valencia (PAV), involving 42 stakeholders (industrial, public, scientific, and institutional). The PAV, which trades under the name of Valenciaport, is the public body responsible for running and managing three state-owned ports along an 80 km stretch of the Mediterranean coast in Eastern Spain: Valencia, Sagunto, and Gandía. Valenciaport is Spain’s leading Mediterranean port, in terms of commercial traffic (mostly containerized cargo), due to its dynamic area of influence and an extensive network connecting it to major world ports. Valenciaport boasts a tightly linked port community, comprised of both public and private economic agents providing services through the ports of Valencia, Sagunto, and Gandía.
In this scenario, an IS team was formed by PAV personnel and experts coming from the Universitat Politècnica de València (UPV) and the Instituto de Tecnología Cerámica (ITC). The IS team worked mainly as an IS facilitator, combining bottom-up and top-down strategic patterns (as described later in the paper).

2. Materials and Methods

The work presented in this paper consisted of the following steps:
  • Information gathering about resource exchange possibilities among Valenciaport companies.
  • Resource analysis and classification into categories.
  • Identification of IS possibilities of Valenciaport with other industrial ecosystems.
  • Identification of IS possibilities within the Valenciaport community.
  • Classification of companies into groups, according to their IS potential.
  • Definition of IS projects to be nurtured and developed further.

2.1. Information Gathering about Resource Exchange Possibilities among Valenciaport Companies

To find IS opportunities in Valenciaport, a workshop was organized in the Valencia Port Authority building in June 2019. The workshop followed the “Quick Wins Workshops” format developed by International Synergies Limited (Birmingham, UK) and carried out by NISP® [57], which is a tried and tested interactive business opportunity model. All companies belonging to the Valenciaport community were invited to take part in the workshop. A total of 24 delegates of environmental departments from 15 port-specific companies of Valenciaport, the PAV, the Port Research Centre, and the Environmental Knowledge and Innovation Community voluntarily attended the workshop. The delegates were aged between 29 and 62, 42% were women, and all of them had more than eight years of experience at their positions. Companies were identified in this study according to their activity, and an ID was given to them to preserve anonymity and confidentiality. In addition, a member from the Climate Change and Environmental Quality department, on behalf of the regional government of the Valencian community, attended the workshop and was informed throughout the study.
First, delegates were briefly informed about the basis of IS and basic workshop guidelines. In this sense, they were told to consider how their waste might be recovered, reprocessed, and reused by others as a raw material, as well as what raw materials and resources could be available from other industries, and how they might be used within their organization. Special emphasis was put on defining what should be considered as a resource in the workshop. Modern IS practice expands the traditional classification of resources [2], considering materials, energy, water, logistics (transport, warehouse facilities, and land), spare capacity (underutilized equipment, laboratory or testing facilities), services, expertise (ISO 9000, ISO 14000, OSHAS 18001, best practices…), information, and technologies [58,59].
The workshop allowed all delegates to share information regarding their resource haves and wants. Should another delegate wish to connect regarding a particular resource, they could sign up for that resource.
A summary of the number of resources and the number of potential synergies identified was presented at the end.
Following the workshop, each delegate received a bespoke report, indicating all their resources, together with the company names that matched with their resources, and all the resources they matched to that belonged to other companies.

2.2. Resources Analysis and Classification into Categories

The amounts of different resources (both requested and offered by companies) were classified in order to allow for easier analysis. Four waste management experts grouped the collected resources in a focus group session lasting two and a half hours. Affinity diagrams were used to draw connections and organize resources into groups, based on their relationships. The frequencies of resource appearance and their quantities (both offered and requested) were also considered criteria to define the groups. Finally, the experts labelled the resulting groups as categories by consensus.
A descriptive analysis was carried out to compare the amounts of resources (both offered and requested) by categories. The difference between the offered and requested resources in each category was calculated in order to determine the needs and surpluses of the Valenciaport community. Finally, the number of different resource “haves” and “wants” of companies were calculated by category.

2.3. Identification of IS Possibilities of Valenciaport with Other Industrial Ecosystems

Before evaluating the IS potential within the Valenciaport community, it seemed interesting to evaluate the possibilities Valenciaport had in terms of exchanging resources with other industries. This information could be valuable in understanding the IS potential of the Valenciaport community when it comes to exchanging resources with other ecosystems from which it could feed and to which it could provide resources. In this sense, the resources that the Valenciaport companies requested and which no one within the community offered, as well as those that were offered but no one within the community requested, were identified.

2.4. Description of Identified Matchings between Valenciaport Companies

When one or more companies requested a resource provided by another one, a matching occurred. A report grid showing all the reached matchings was drawn. The report grid listed all the resources in rows, with the available quantity, units, and supply type (continuous or batch) in its columns, along with the IDs of all the companies taking part in the study. Information about which companies had a certain resource and which requested it was shown using a colored code (green for haves and yellow for wants) in the table cells. Descriptive analyses of matchings were done by calculating the number of matchings by resource category, as well as calculating the number of matchings by company.

2.5. Classification of Valenciaport Companies into Groups According to their IS Potential

The goal of this analysis was to classify companies into groups with different patterns, in order to allow for mapping of the IS potential in the Valenciaport community. To identify the different IS profiles among companies, a two-stage clustering approach was carried out [60] using the following grouping variables:
  • Number of “haves”: sum of the total resources offered by each company.
  • Number of “wants”: sum of the total resources requested by each company.
  • Number of different categories of resources offered by each company.
  • Number of different categories of resources requested by each company.
  • Number of matchings as supplier: number of synergies in which the company acts as a supplier.
  • Number of matchings as seeker: number of synergies in which the company acts as a seeker.
Thus, first, hierarchical cluster analysis (HCA) was used to determine the right number of groups. HCA calculates the distances between all companies using a defined metric [61]. In this case, the ‘furthest neighbor’ was used as a linkage method and the squared Euclidean distance was chosen as a distance measurement. The plotting of fusion stage against fusion coefficients and the search for significant slope changes, along with observation of the dendrogram, allowed us to determine the right number of IS profiles. Then, k-means cluster analysis was carried out, using cluster centroids given by HCA preliminary analysis as starting points to identify a final cluster solution with homogenous groups [62]. The criteria employed to find the solution were: maximum number of iterations until reaching convergence was set to 10, minimum cases in each group in the final solution were at least 10% of total cases, and, finally, centers were coherent and easy to interpret.
Each resulting cluster was considered as an IS profile resulting from different values achieved for each grouping variable. Each IS profile was described according to the mean values of the grouping variables in the centers of the cluster.

2.6. Definition of IS Projects to Be Nurtured and Developed Further

Once the IS team had drawn up the big picture describing the IS possibilities, some ambitious projects involving more than two companies and needing the PAV to play a crucial role—given its institutional and regulatory capacity—were outlined. The objective was to stimulate the Valenciaport ecosystem and develop industrial symbiosis networks (ISNs), understood as relationships involving at least three companies that exchange at least two different types of waste [63,64].
Projects were discussed with all involved companies in order to obtain feedback and measure their initial interest. The main criteria considered to initially evaluate the proposed projects were: technical viability, economic viability, reduction of environmental impact, and possible barriers to implementation, both legal and organizational. Only projects approved by consensus were developed further, up to drawing up a technical project brief assessing key infrastructure specifications and considering expected impacts before looking for funding sources.

3. Results

Table 1 shows the main activities developed by the companies taking part in the workshop. As can be seen, the companies developed 14 different activities, representing a varied sample of typical activities developed in seaports. Given the characteristics of Valenciaport, a stronger representation of port terminals appeared. Likewise, the workshop topic attracted the interest of companies performing port-related activities, research centers, environmental associations, and waste management companies.

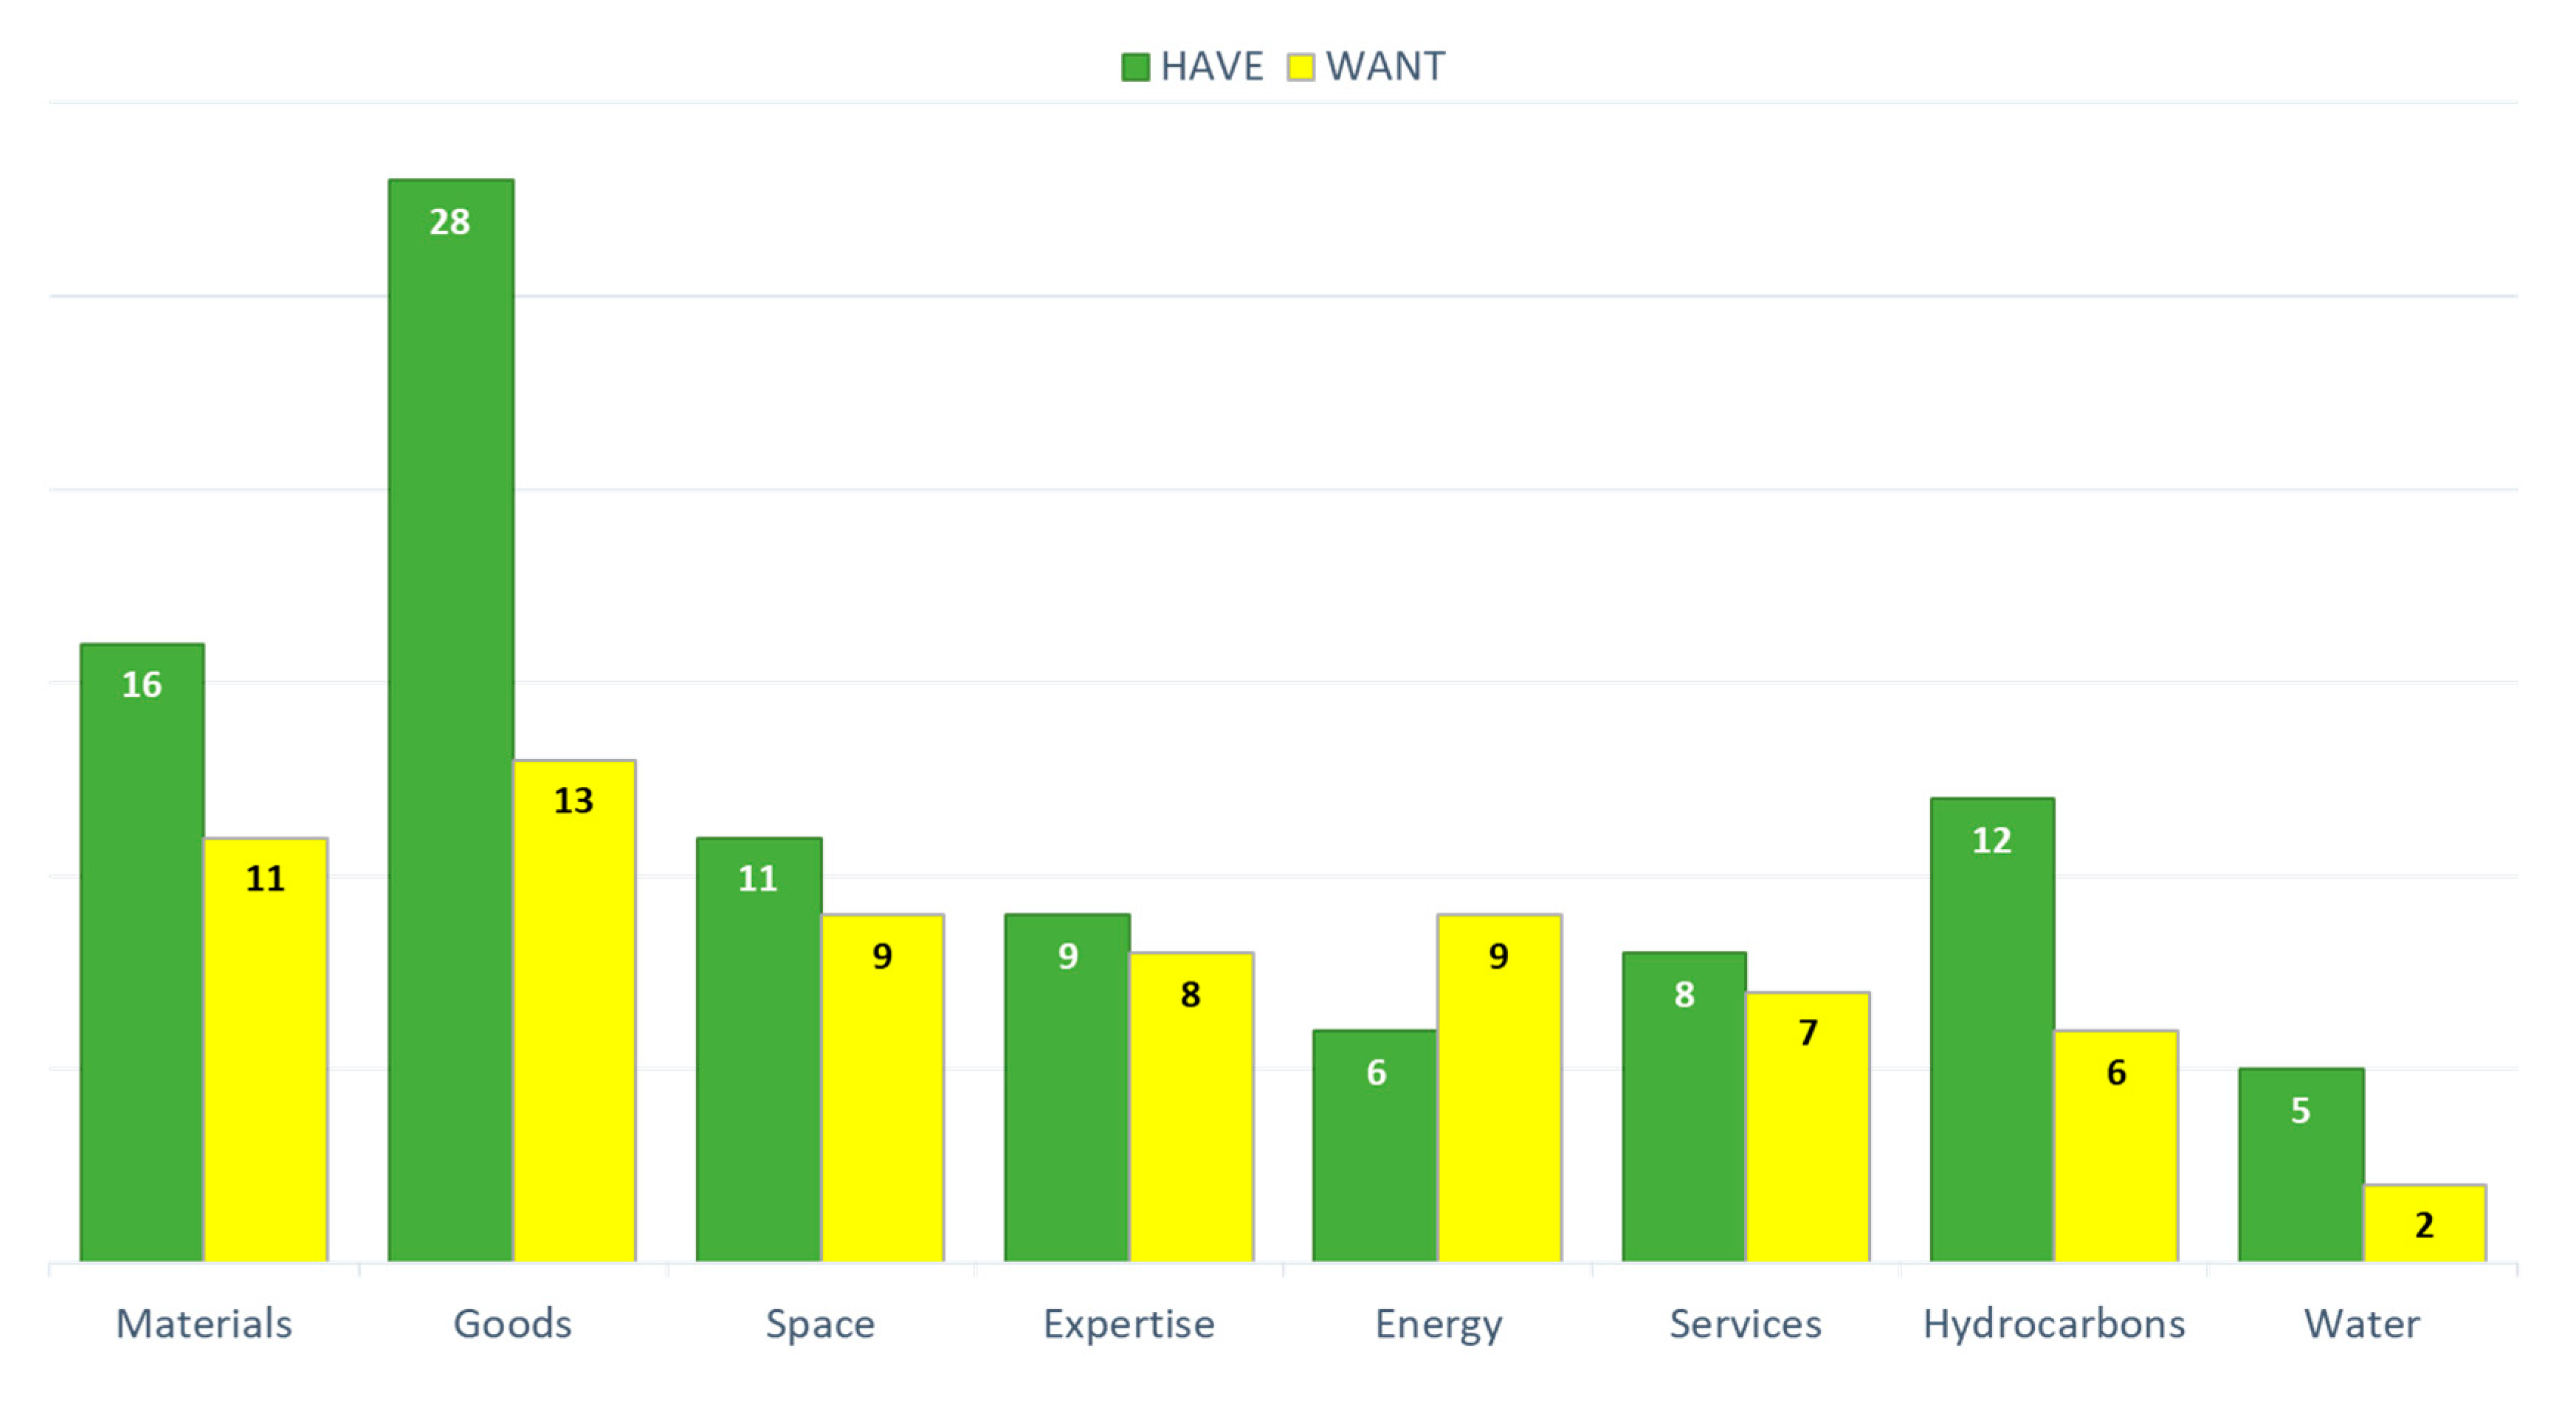
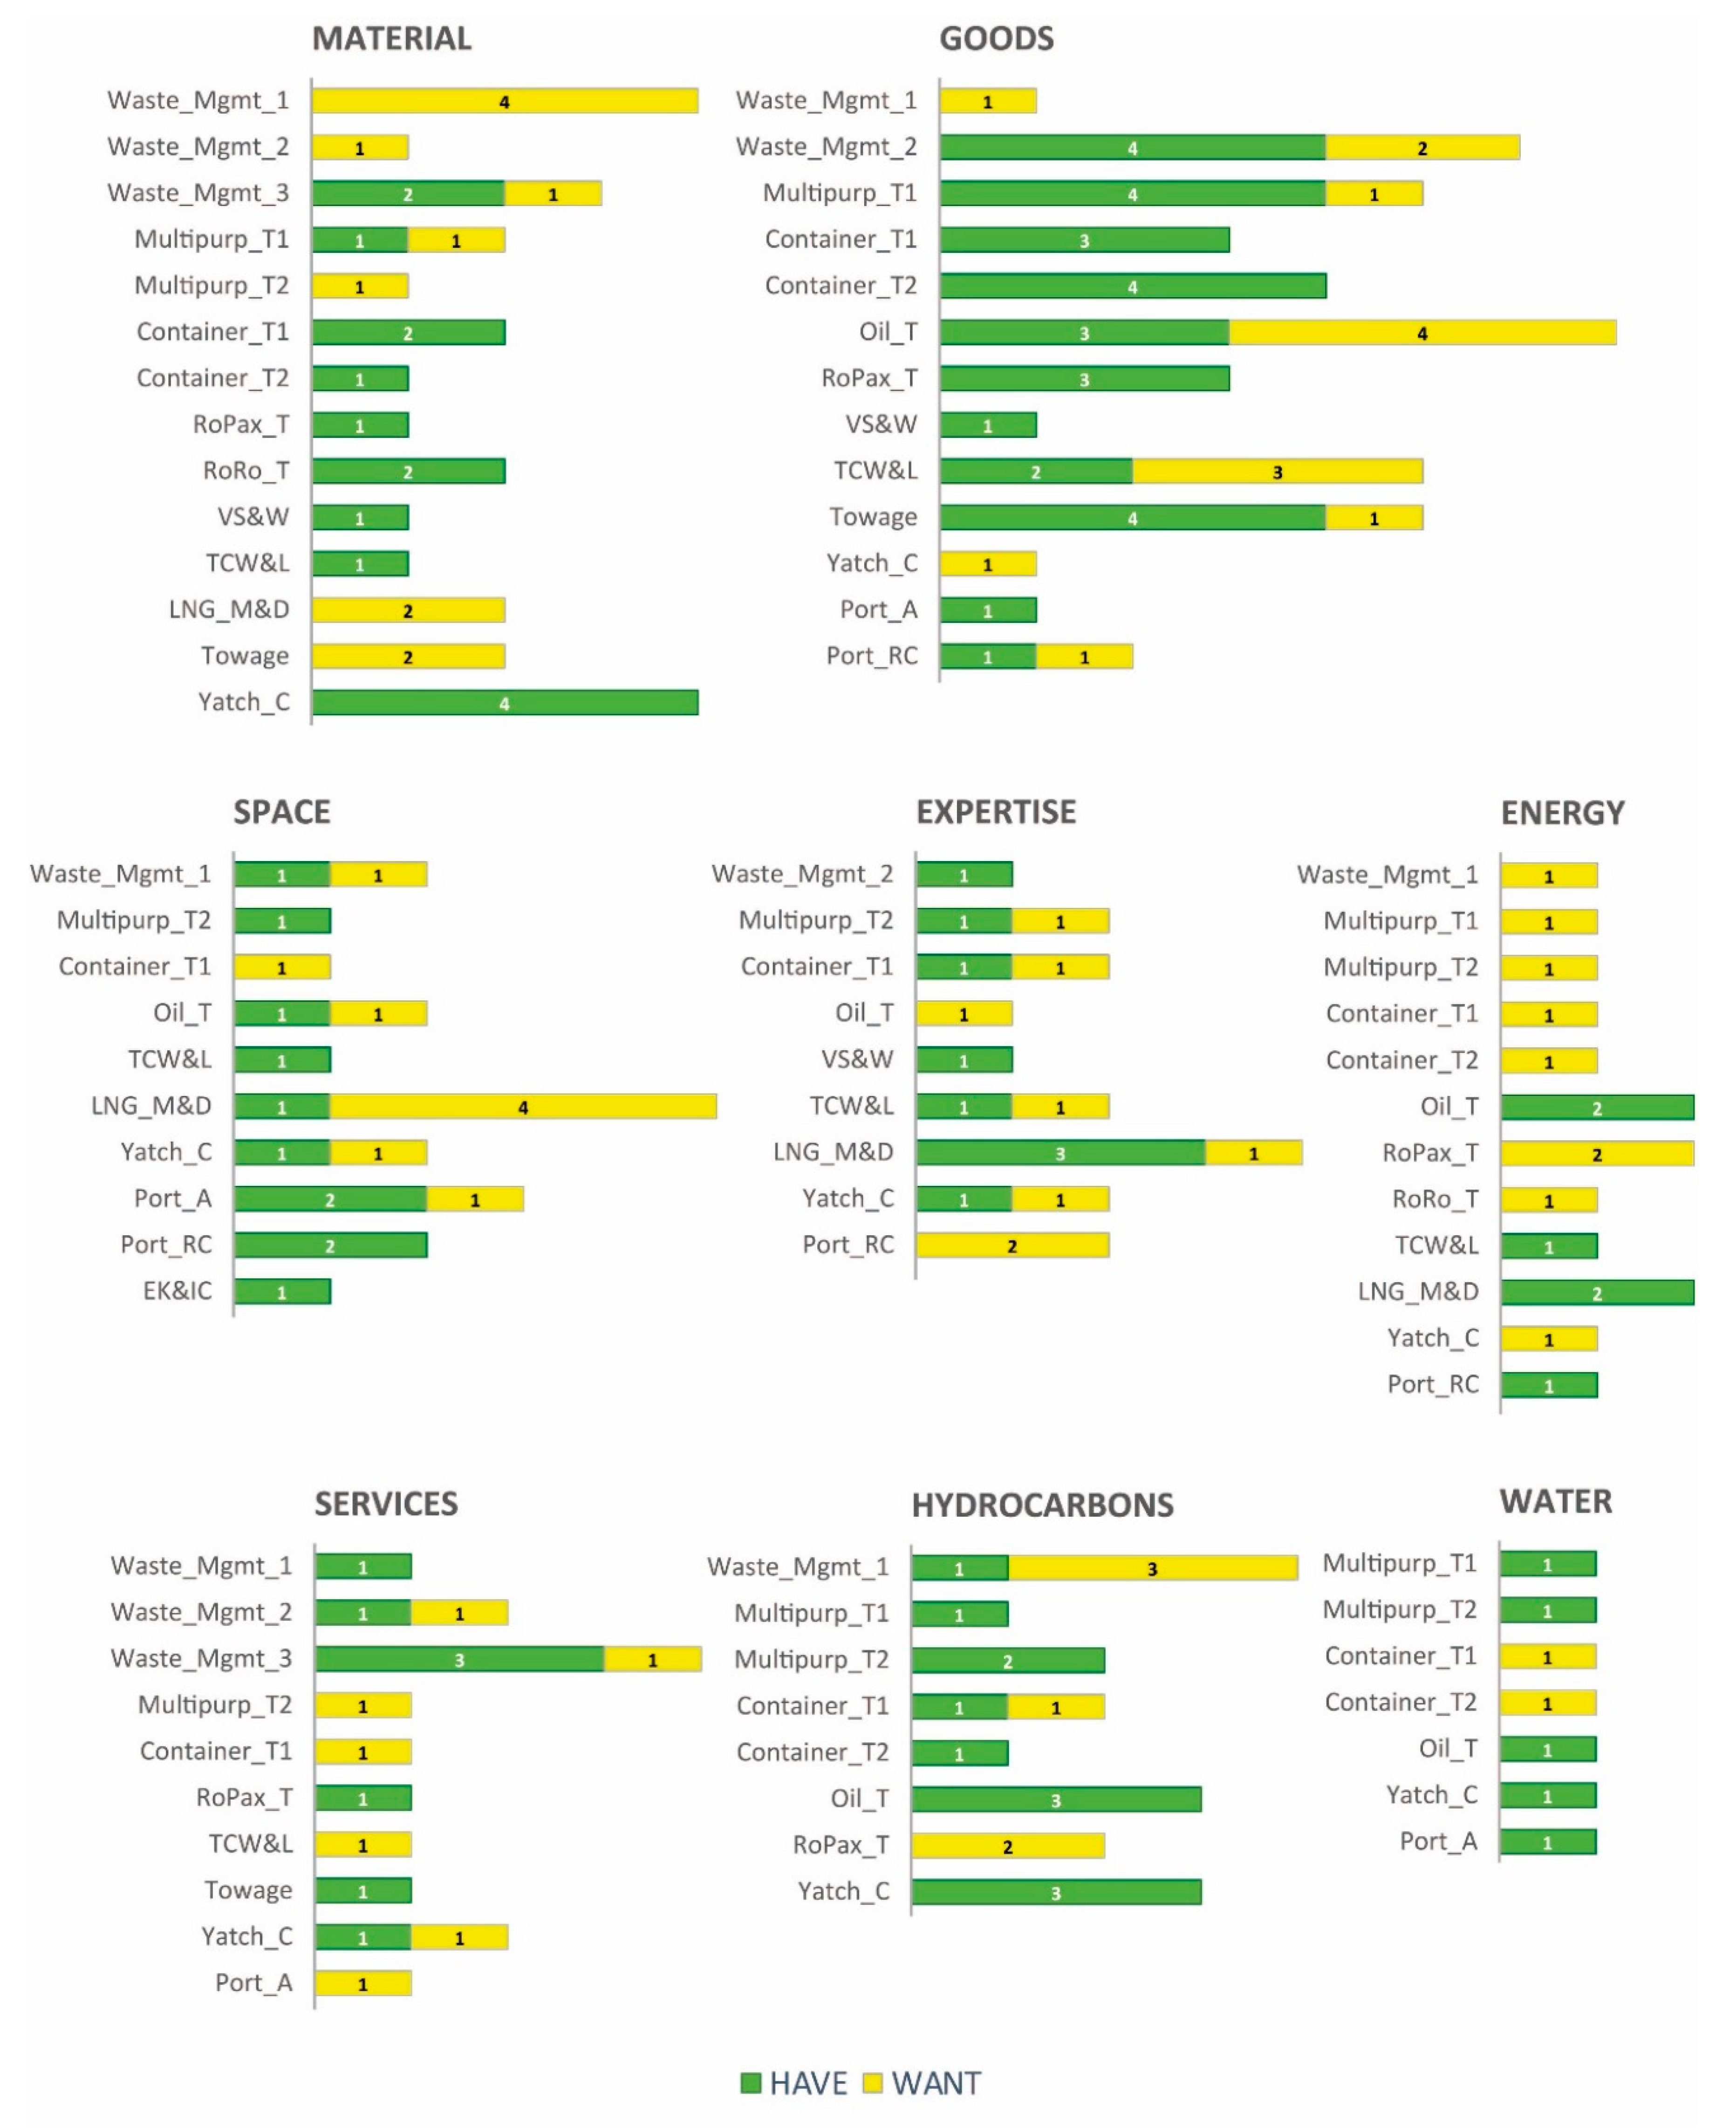
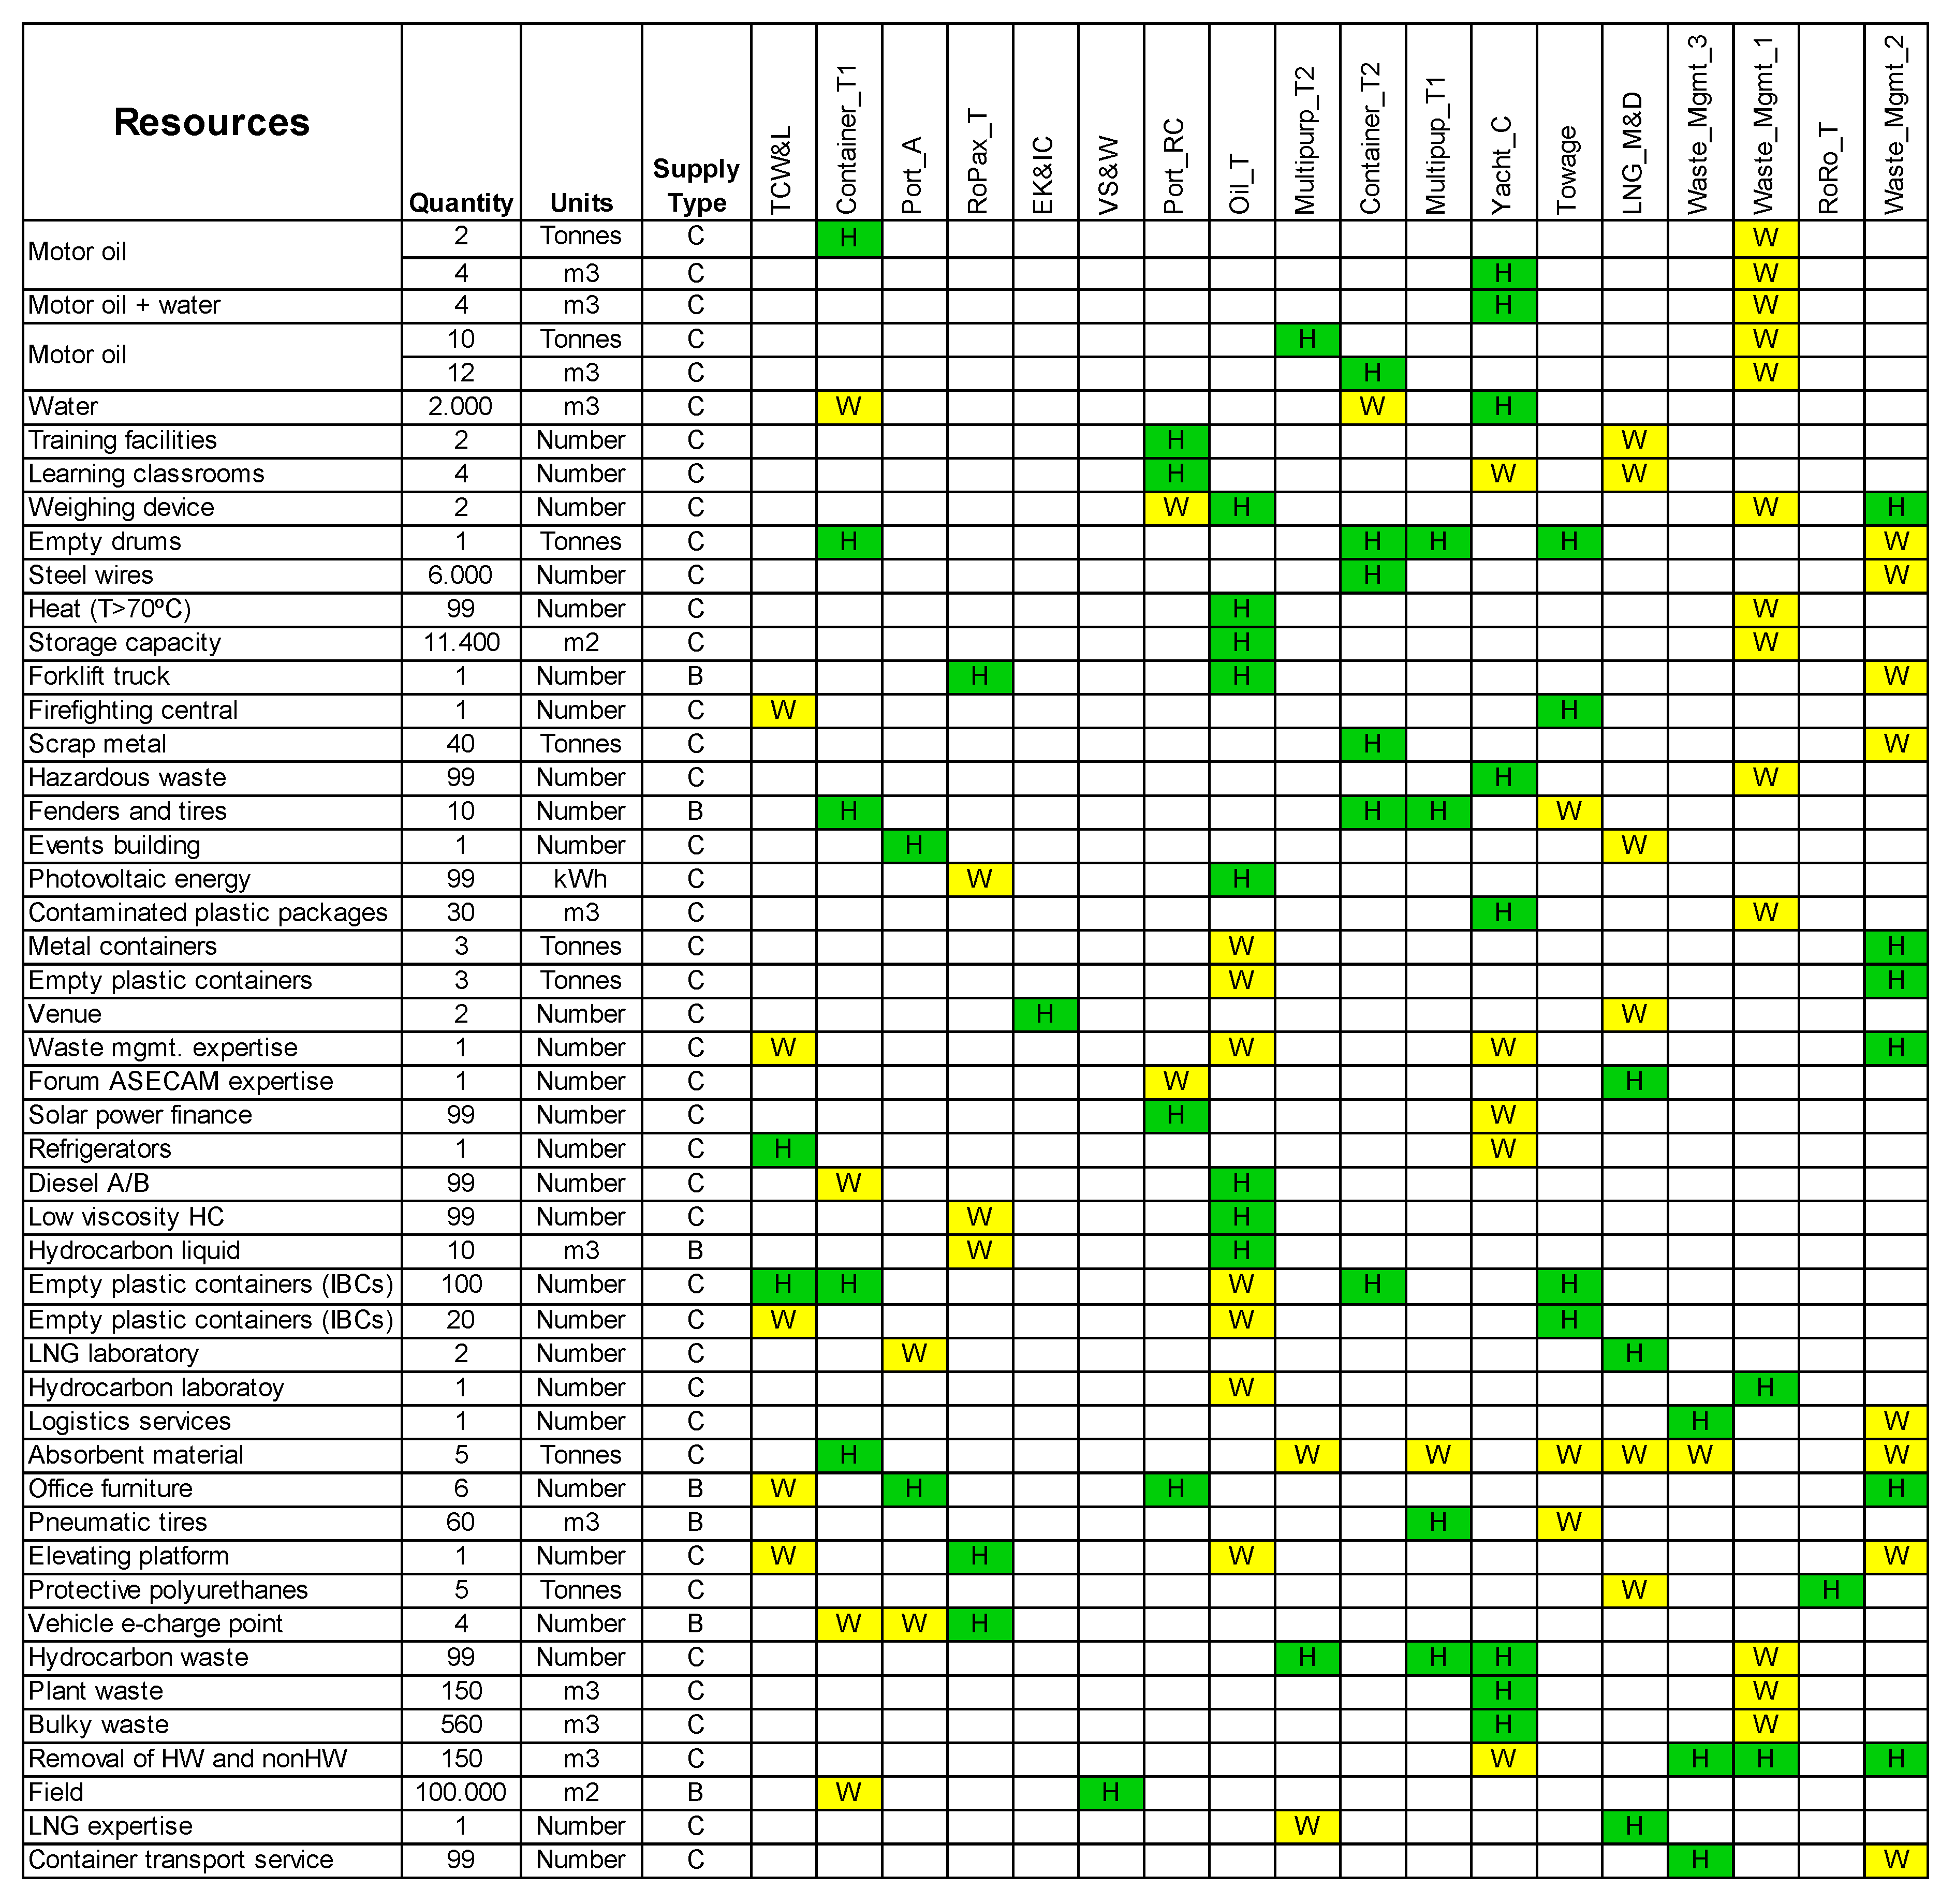
3.1. Resources Analysis and Classification into Categories

The companies offered and requested a total number of 79 different resources. Different typologies of resources were found, which were classified into eight categories, as can be seen in Table 2.
Materials was the category with the most resources (16), followed by goods (14), space (11), and expertise (11). Energy and services had about 10 different resources. Hydrocarbons (7) was considered separately from the materials category, given the number of companies that considered them along with the quantities they were prone to exchange. Finally, water (3) was the category with the least demand and offers in Valenciaport.
Figure 1 shows the number of different resources that companies have and want by categories.
Goods was the category most offered among the companies, followed by materials and hydrocarbons. In these categories, the gaps between what was offered and what was requested were greater than in the rest. Offer was greater than demand in all categories, excluding energy.
The distribution of the haves and wants of companies by resource categories is depicted in Figure 2.
Materials, goods, and energy were the categories with the greatest number of companies providing or requesting resources (>12). Space, services, and expertise had about 10 companies sharing resources, and hydrocarbons and water had eight and seven companies interested in resource exchange, respectively. Goods was the category in which the greatest number of companies offered and requested resources at once (5), followed by the space and services categories (4). On the other hand, in the energy and water categories, companies only played the provider or seeker role.

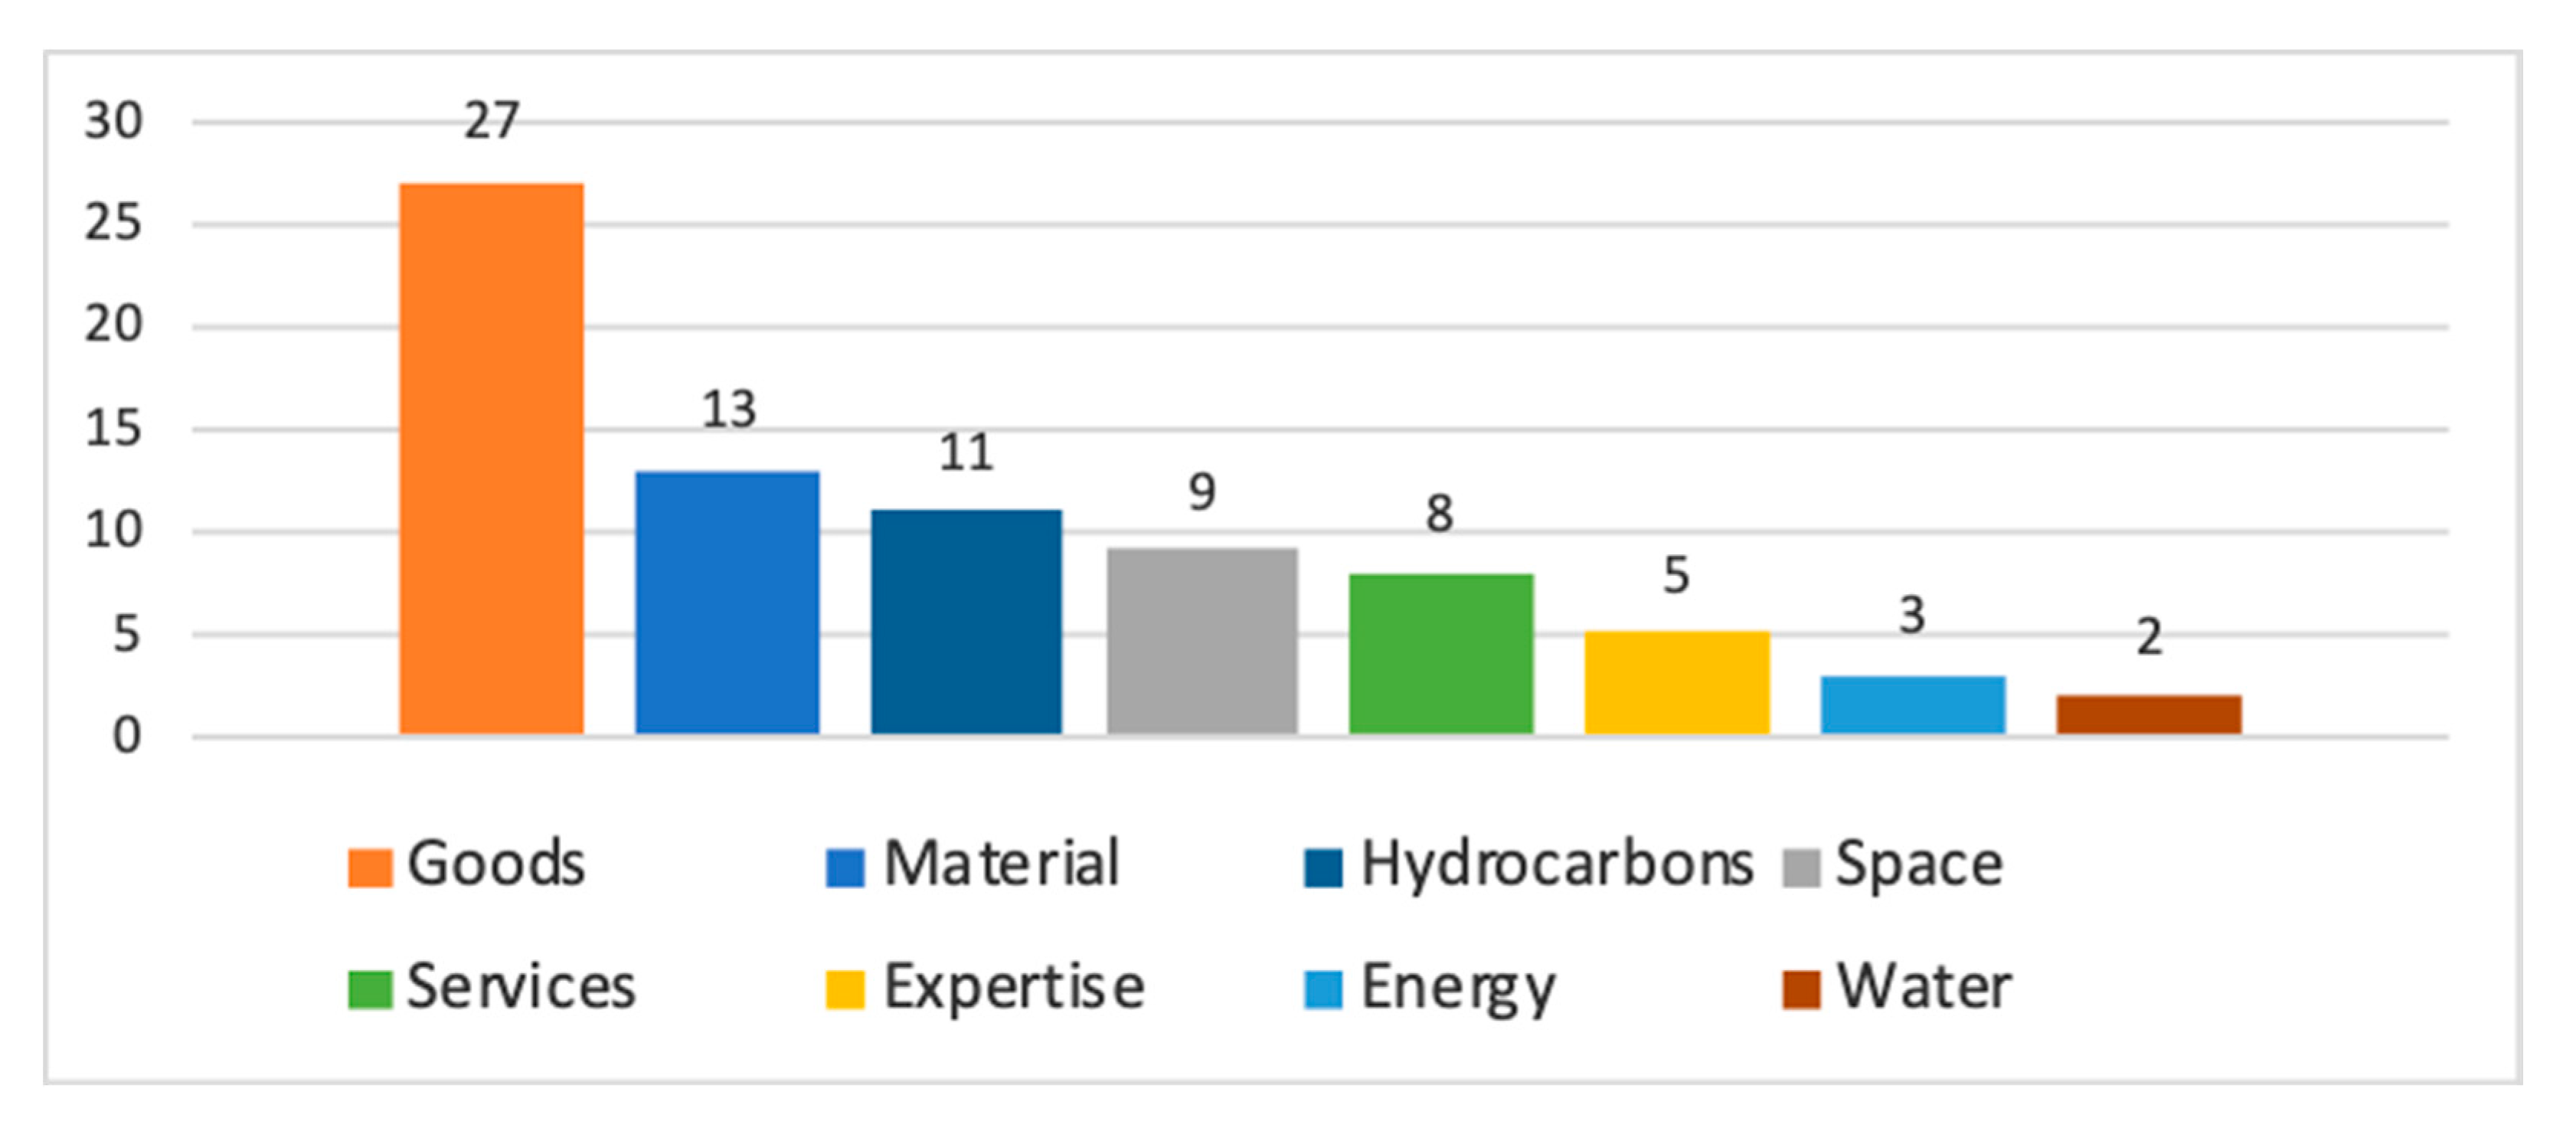
3.2. Identification of IS Possibilities of Valenciaport with Other Industrial Ecosystemns

Table 3 shows the resources that Valenciaport companies requested that no company within the community offered, as well as those that were offered but no company within the community requested.
Requested resources not provided by the Valenciaport community were related to energy, water waste management, and business management expertise needs. On the other hand, resources not requested were mainly materials, expertise related to energy and port operations management, goods related to seaport activities (e.g., tractor units, used floating barrier, towropes, and so on), space, and spare facilities.

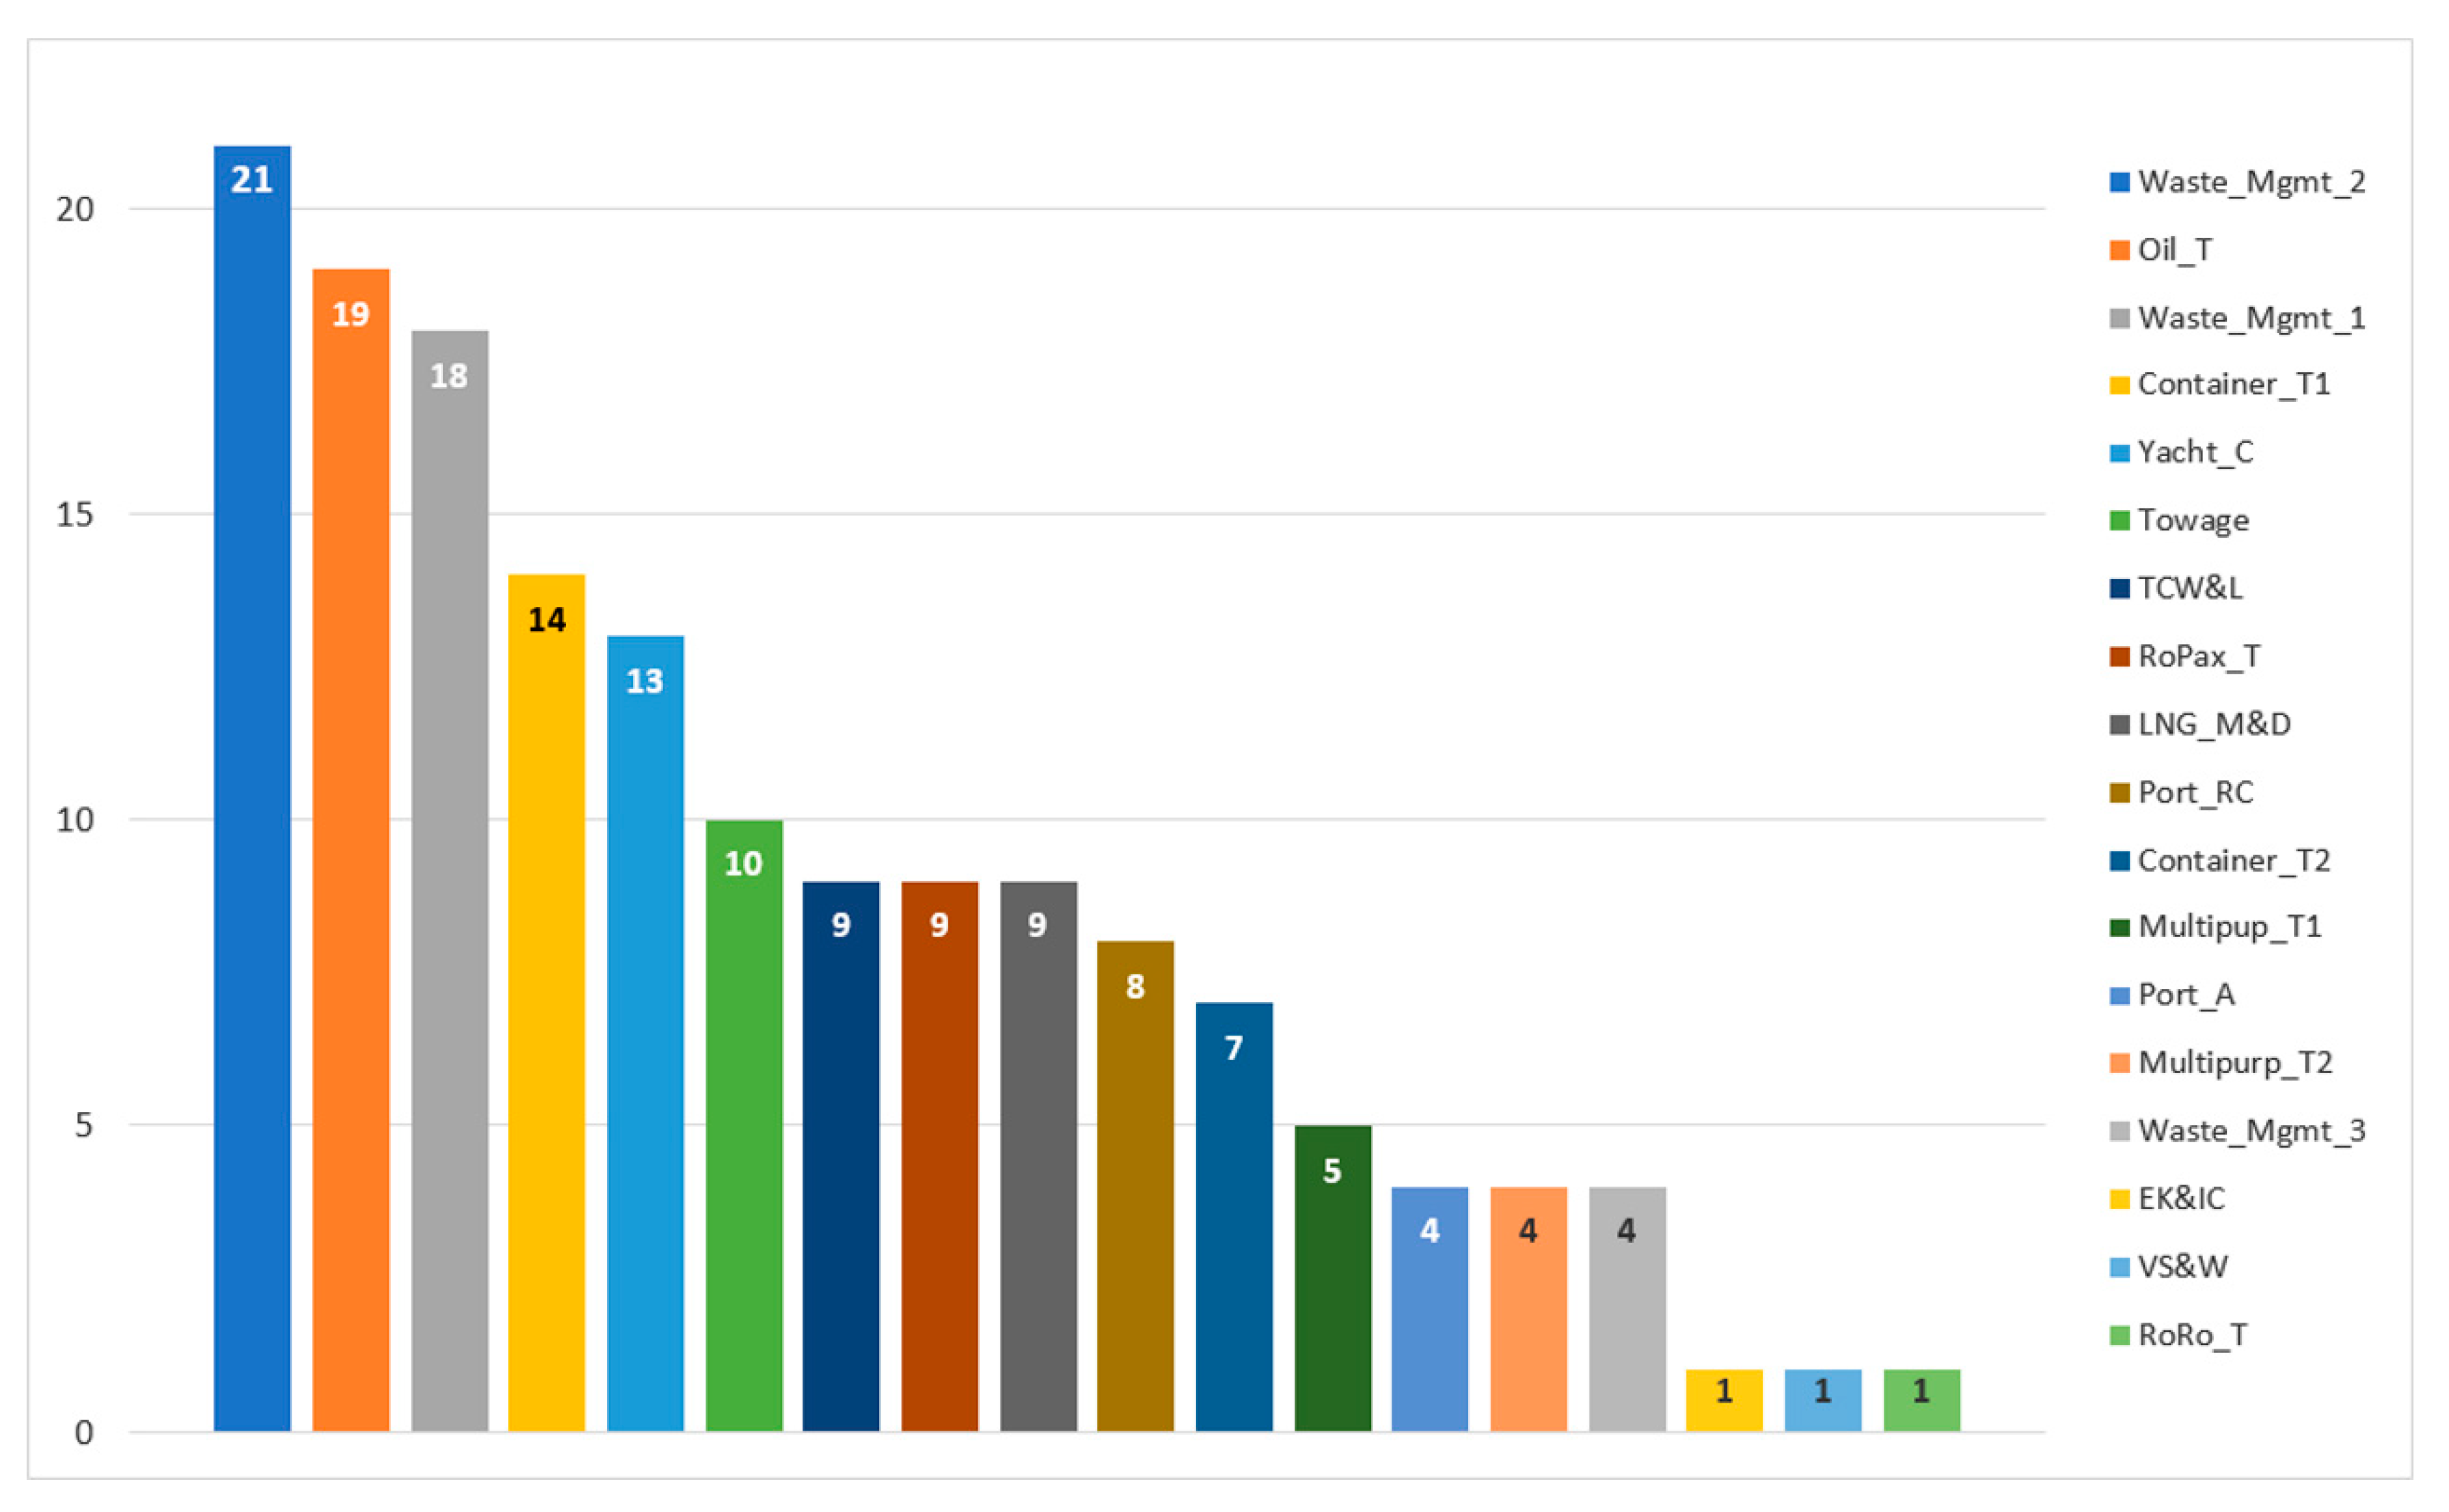
3.3. Description of Identified Matchings between Valenciaport Companies

A total number of 78 matchings were found among the Valenciaport companies. They are summarized in the report grid shown in Figure 3.
The number of matchings, sorted by category, is shown in Figure 4.
The goods category reached the greatest number of matchings among companies. To some extent, this result was expected, as more resources in this category were offered and requested by the Valenciaport community. The categories of materials and hydrocarbons each contributed more than 10 matchings. The space and services categories each contributed more than 10 possible matchings and, finally, intercompany resource sharing belonging to the expertise, energy, and water categories added 10 more matchings in total.
The number of matchings found in the Valenciaport companies is shown in Figure 5.
Two out of the three waste management companies and the oil terminal reached the greatest number of matchings, followed by the Container_T1 (14) and Yacht_C (13) companies. A second group with high symbiosis potential, having between seven and 10 possible matchings, was formed by the Container and RoPax terminals, as well as auxiliary industries such as Towage Co., Port_RC, LNG energy company, and TCW&L. Multipurpose terminals, along with the third waste management company and Port Authority, reached about five matchings. Finally, RoRo terminal, Stowage Co, and Environmental Knowledge and Innovation Community showed lesser symbiosis potential, as they barely reached one possible match.

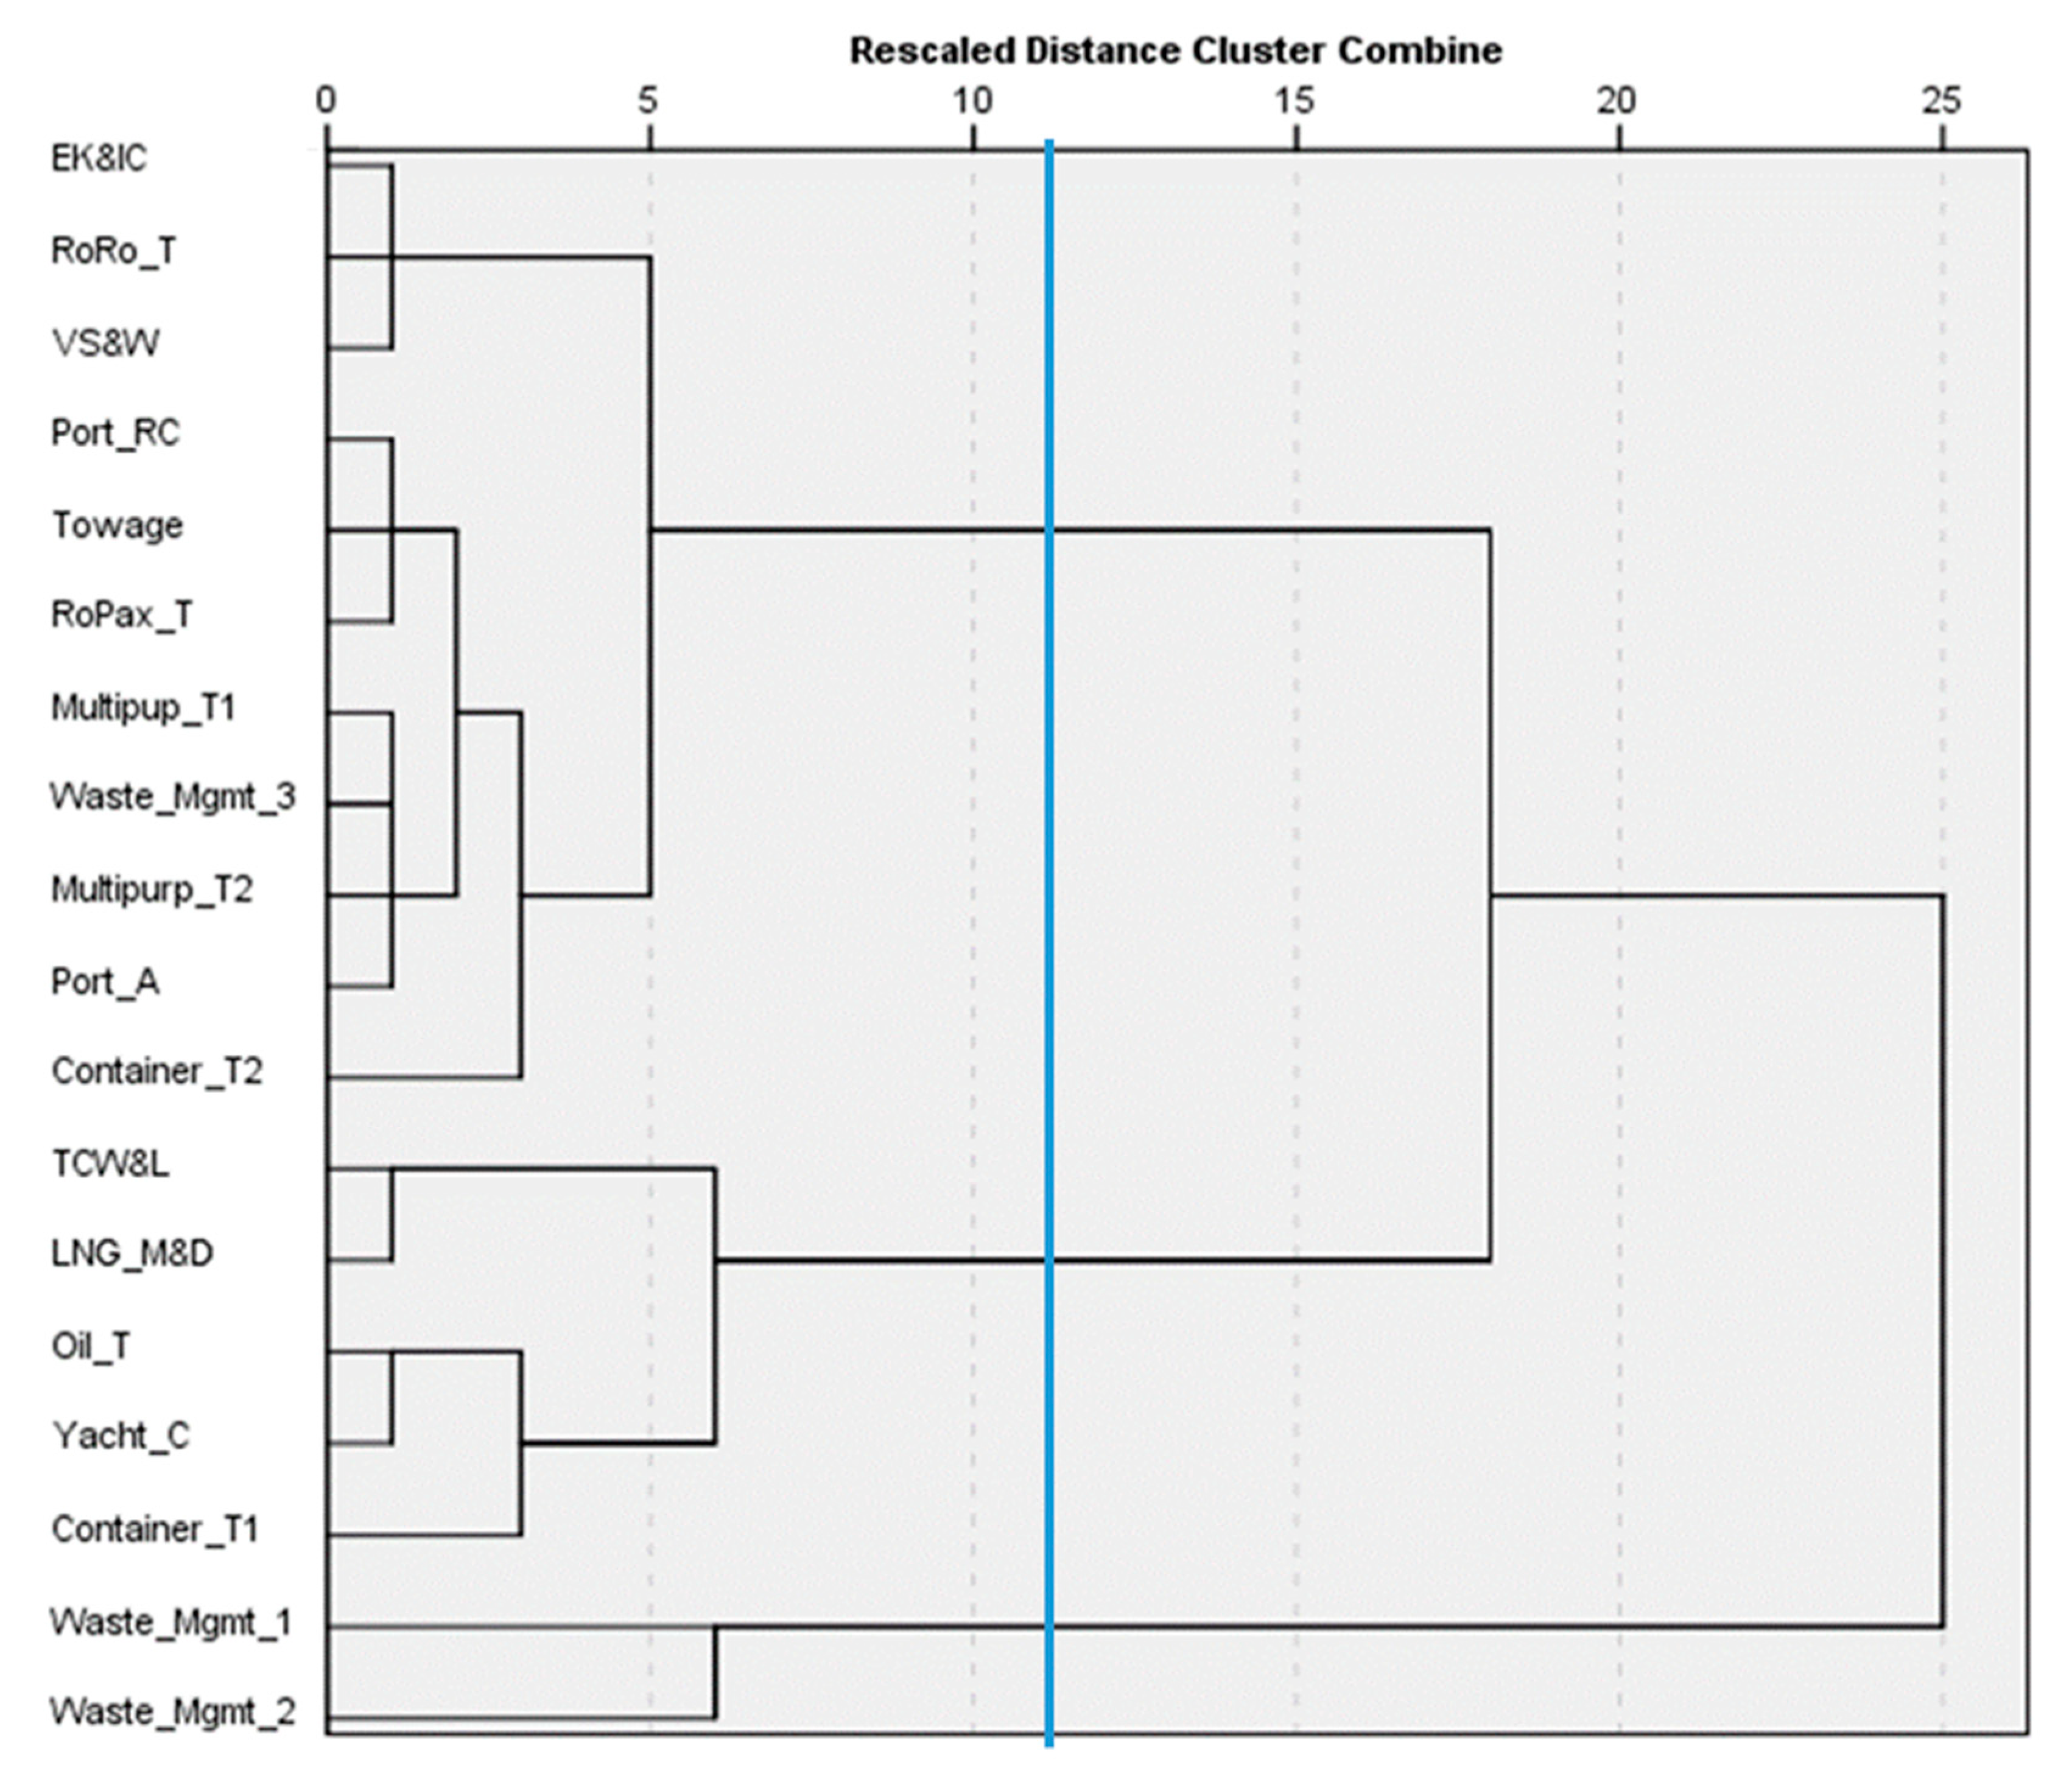
3.4. Classification of Valenciaport Companies into Groups According to Their IS Potential

The results obtained following the HCA are shown as a dendrogram in Figure 6.
The plot of the fusion stage against fusion coefficients can be seen in Figure 7, which shows a significant change of slope after stage 15. This change corroborates the existence of a three-cluster solution.
The k-means cluster analysis was carried out using the cluster centroids obtained from the HCA preliminary analysis, giving a valid solution for three clusters. The values of the final centers of clusters 1, 2, and 3 for each grouping variable are given in Table 4. Table 5 shows the number of cases corresponding to each cluster and cluster membership.
Cluster analysis allowed for classification of the companies into three groups with different IS profiles. The companies in cluster 1 offered the greatest number of potential exchanges, demanding the greatest number of resources with the most different resource typologies (see Table 4). Thus, they led the number of possible matchings found, in which they mainly played resource seeker roles. The IS profile was consistent with the role played by the waste management companies belonging to this cluster. The companies in cluster 2 had a more balanced IS profile. They had more “haves” than “wants” and, in the matchings they were involved in, they played a balanced role—as both seekers and suppliers. The variety of “wants” and “haves” typologies was also well-balanced in cluster 2. Finally, the companies in cluster 3 had a low IS profile, being involved in a minimum number of matchings, in which they mainly played the role of suppliers. The auxiliary activities developed by companies belonging to cluster 3, such as those performed by research centers and environmental communities, Port Authority support and administrator roles, and the specificity of the waste management company could explain the IS profile characteristics in cluster 3.

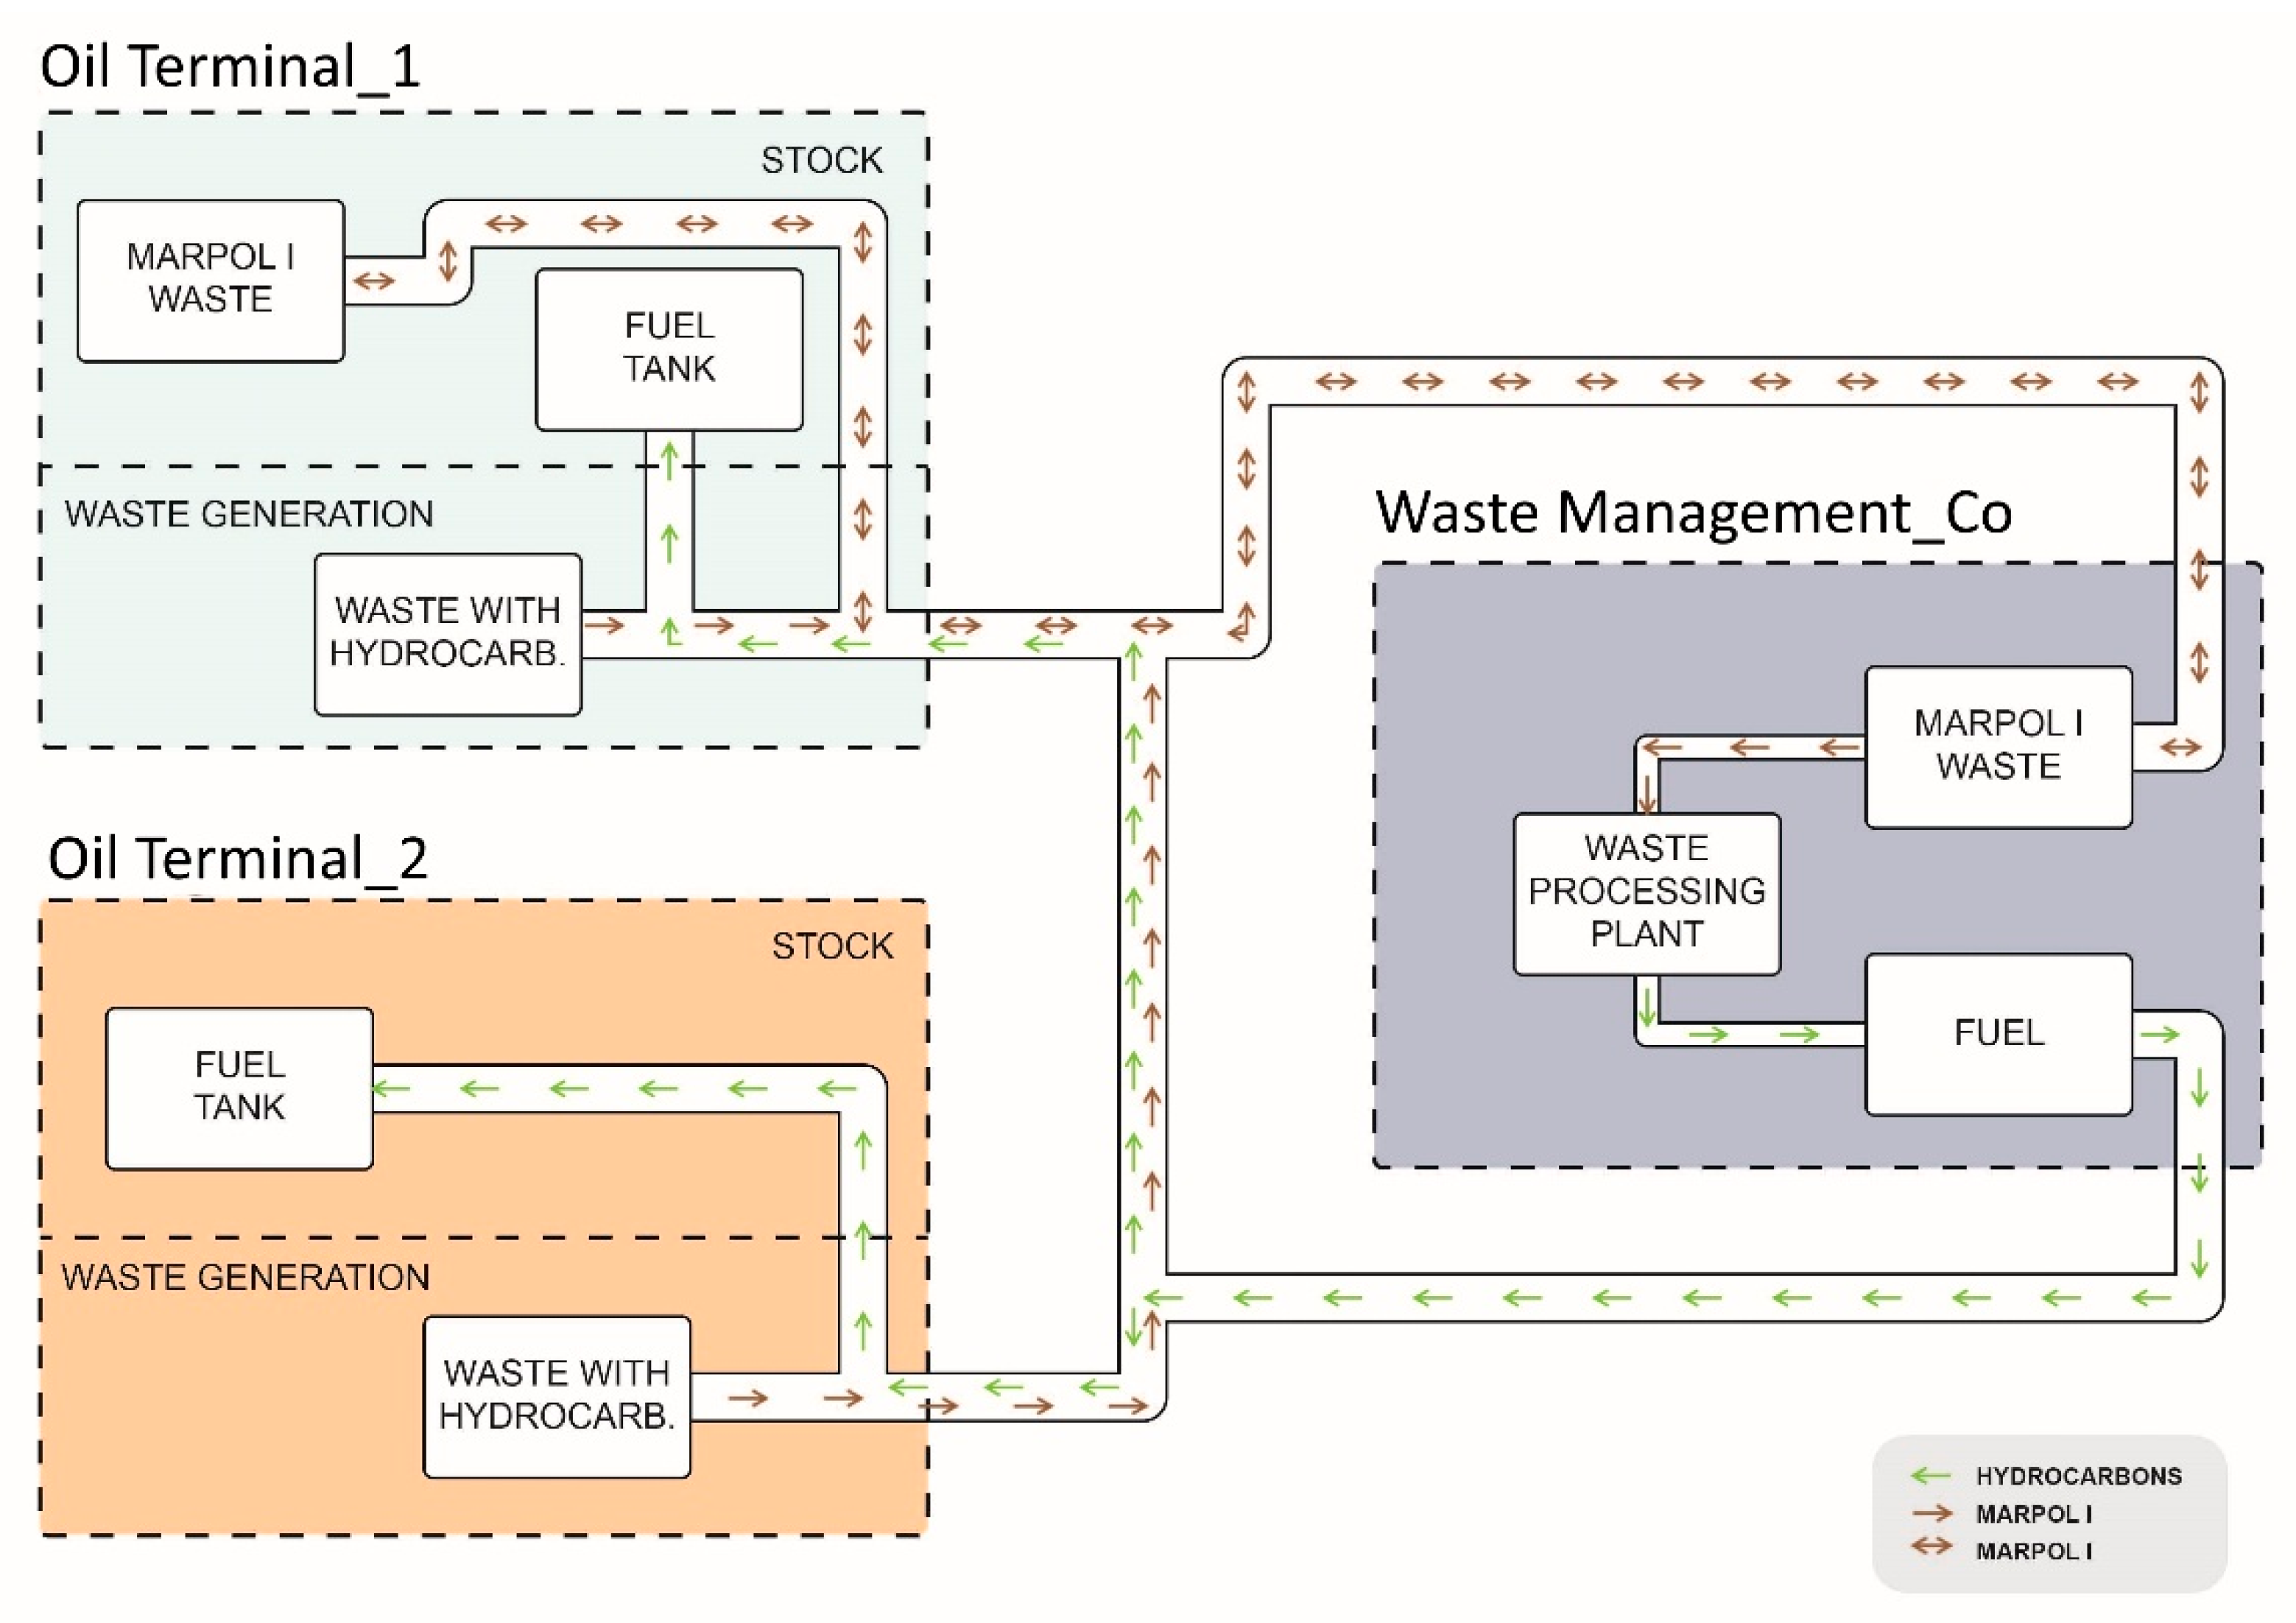
3.5. Definition of IS Projects to Be Nurtured and Developed Further

The Valenciaport companies were interested in two IS projects and agreed to explore further their possibilities. The first project (P1) was related to waste heat recovery in the port industries and facilities. The objective of P1 was to analyze the viability of implementing an energy system using a thermal network infrastructure to turn the current waste heat into passive heating energy systems (heat exchanges and thermal energy storage) within the port. Specifically, the IS team analyzed the viability of using the low-grade heat potential of Valenciaport to be utilized in producing (i) electrical power; (ii) heating; (iii) cooling; (iv) heating, cooling, and electricity simultaneously; (v) fresh water; and (vi) hydrogen, with the deployment of advanced technologies. This system would reuse the heat energy of port industries, which would otherwise be expelled and wasted, leading to a reduction of thermal and air pollution, reduction in CO2 emissions, and reduction in utility consumption and costs, as well as increasing port energy efficiency.
The second project (P2) was welcomed by five companies: oil terminals, Waste Management Co, and container terminals. A synergetic linkage already exists between two of them, as they had signed an agreement to share extra storage capacity. Likewise, the Waste Management Co recovered hydrocarbons from the oil terminals, from which recycled fuel that can be introduced back into the market is obtained. MARPOL I waste—oil and oily water waste coming from ships cleaning and maintenance operations—and recycled fuel are currently transported by special trucks among companies. Thus, the objective of P2 was to eliminate the redundant facilities and centralize the treatment of waste containing hydrocarbons, as well as conducting water purification, thus eliminating truck transport, improving security, and improving the operations efficiency of material exchanges among the companies. Thus, the companies and the IS team are now evaluating the viability of implementing a centralized water treatment system in seaport facilities for obtaining hydrocarbons as a by-product. The transport of MARPOL I waste, oil terminal waste, and hydrocarbons in both directions can be unified by connecting the oil terminals with the Waste Management Co through pipelines and automatized control systems, as can be seen in Figure 8. In addition, the Waste Management Co could take charge of the treatment of water coming from the oil terminals, eliminating redundant facilities for water treatment and management. The collected water could be eventually used by other seaport companies that need it in their processes, for example, the container terminals that had demand for water (see Figure 3).
The expected impacts of P2 are reducing abusive fossil fuel consumption and the environmental effects that it entails; obtaining a new valorized by-product; reducing time, economical, and environmental costs related to transport; avoiding environmental risks (e.g., spills); and reducing water consumption.

4. Discussion

The procedure followed in Valenciaport used the Quick Wins Workshop format to allow stakeholders to directly interact and gather resource information, along with the use of statistical clustering methods to group companies according to similar IS patterns, which has been proven to be useful to get an overview of the IS potential of a given community, promoting IS initiatives in a more controlled way.
The proposed procedure could help IS promoters both in finding IS opportunities and in IS creation. First, the Quick Wins Workshop allowed for the identification of possible resource flows, uncovering patterns of exchange, and identifying possible matchings. Second, the statistical analysis allowed for the definition of common symbiotic features among stakeholders by classifying them into groups with similar IS potential, discovering what each group offers and needs, and identifying relevant stakeholders who could act as precursors to symbiosis, making it easier to spot new opportunities and create ISNs from scratch. In this line, the identified IS profiles provided support in planning and devising the IS projects explained in Section 3.4, which will help in screening and targeting future public investment.
The objective of using the workshop formula in the Valenciaport case study was twofold: to introduce and develop the IS following an agile approach and to reinforce the community sense, providing close company interactions that close the “mental distance”, increase trust, and lead to a deeper understanding among the participants [65,66]. While previous works have shown an effect of size of the network on the number of synergies, suggesting that larger networks have the capacity to achieve more transactions [67], this hypothesis remains still unanswered [22]. In fact, Domenech and Davies [68] have suggested that local, close-knit networks can be better co-ordinated and integrated, which favors the initiation and development of IS projects. In this sense, an agile approach seemed to be the more appropriate option, taking the Valenciaport cluster as a starting network to be further developed in a flexible, iterative, and incremental way. Considering that the port area has multiple dimensions, from local to global [69], initiating IS actions in Valenciaport could have a robust effect, which might eventually influence the associated port cities, the port region, and global port networks [70]. The evolution of IS initiatives in the Marseille-Fos port, from the seaport to larger geographical areas, and the extension of the initial IS initiatives carried out by industries in the Rotterdam port to the city of Rotterdam are successful examples of the convenience of such an agile approach [27].
The PAV call to IS workshop was welcomed by Valenciaport, as a great number of stakeholders took part in the study. Both port stakeholders [70,71], such as PAV, local government, and companies performing port-specific and -related activities, and IE stakeholders [2,27,72,73], such as universities, research centers, and environmental communities took part in the study, having a well-represented seaport and IE members. This is a strong point of the study, as having active stakeholder participation and company engagement is crucial in supporting IS initiatives [5,38] given the importance that social actors’ involvement in both industrial and nonindustrial processes have to consolidate and expand ISN’s [74]. The community manager role that modern PAs play [34], building solid networks and creating awareness to co-ordinate port stakeholders, could explain, in part, the high engagement of Valenciaport in this project. In this sense, despite IS creation being, in general, summarized in three phases—identification, assessment, and implementation [38]—authors such as Yeo et al. [5] have stressed the importance that prior steps, such as those devoted to understanding local conditions, needs, and requirements and fostering a co-operative culture, have in promoting IS implementations. Apart from this crucial role played by the PAV in attracting participants, the interest in initiatives addressed to reduce the environmental impacts in Valenciaport, in part encouraged by Spanish regulation (which allows bonus port taxes if part of that bonus is invested in projects aimed at improving the port’s environmental performance [75]), was another key factor to reach the great involvement of stakeholders.
Gathered resources, both offered and demanded, were classified into categories. The resource categories arose according to classic typologies, such as materials, water, and energy flows [2,9], as well as more recently considered categories, such as goods, services, spaces, and expertise [59], along with others, such as hydrocarbons, which finally appeared due to the particular conditions of the stakeholders [22]. It is important to stress the obtained results for the energy category, as it was the only one in which the demand in Valenciaport exceeded its offer (see Figure 1). Seaports are seen as energetic hubs, as they entail the geographic concentration of energy supply and demand activities [34]. In recent decades, the need to better understand and control energy-related activities taking place near or within seaports has become more apparent, given the increasing energy relevance, increased public awareness of environmental issues, the increased focus on energy efficiency of industries, and the greater weight given to sustainability within seaport management [29,34]. In this sense, the PAV has been working towards improving the energy intensity of its terminals since 2008 [76], playing a proactive role to promote energy efficiency and sustainability. In any case, the results show an extra demand of energy among port stakeholders, which should be addressed in the near future.
With regards to sector collaboration, seaports benefit from an existing culture of intersector linkages and associations, which can lead to the implementation of IS across sectors [77]. However, further studies seem necessary to evaluate the intersector sharing possibilities in Valenciaport. The IS activity in the metal/cement cluster of Sagunto (Spain) [68] should be explored in future works, given its proximity and the possibilities that sectors such as manufacturing and construction offer to consolidate ISNs [22].
Regarding possible matching results, the 78 matchings obtained can be seen as a great number, if compared to similar seaport initiatives where only 15 opportunities for synergies were obtained [78]. Obviously, the success of this kind of project should not be only measured by quantity criteria, as further feasibility studies are necessary to evaluate the actual IS creation potential of the matchings. At the point of writing, the authors are evaluating the feasibility of matchings in a multi-expert and multicriteria decision-making process, considering technical, environmental, economic, organizational, and legal factors involved in the future IS creation under the detected synergies. Considering the variety of gathered synergies, examples of the three main types of IS symbiosis appeared [9], namely: by-product reuse (e.g., hydrocarbons recovery from MARPOL I waste), utility or facility sharing (e.g., water, energy, training facilities, spare stock storage, laboratory vehicle e-charge points, gas station, and so on), and collaboration to fit common needs across firms (e.g., logistic services, management and energy expertise, firefighting, waste management, and so on).
The definition of IS profiles by clustering techniques was crucial for better understanding the multistakeholder composition of Valenciaport, as well as to devise new strategic IS initiatives. The first identified profile was composed of two waste management companies. The waste management sector is an important player in ISNs [22], and has been identified as a key area (along with waste prevention) to implement IS and CE initiatives [79]. However, waste management companies mainly act as resource seekers in Valenciaport (see Table 4). A more proactive role is needed, promoting landfill diversion, replacing the end-of-life concept with restoration, and aiming at the elimination of waste by designing new materials and products. However, these companies find difficulties in playing such roles, as a clear and integrated regulatory framework defining what is to be understood as by-product and waste is still missing. In addition, they asked for a simplified process of discerning end-of-waste criteria. In this sense, the ratification of the EU CE package in 2018 introduced some changes to clarify those concepts on the waste framework directive [80]. In any case, IS initiatives are influenced by high territorial specificity [79]. In this sense, the roles played by public policy and the involved institutions leading to IS are crucial. Some authors have highlighted the strategic roles that policy actions play in stimulating IS in practice [81,82]. Policy measures using regulatory and economic instruments as taxes and subsidies promote IS initiatives and, thus, have a positive effect on the ulterior consolidation of ISNs [9,83,84,85]. This is why a member from the Climate Change and Environmental Quality department, on behalf of the regional government of the Valencian community, was invited to take part in the study. In this way, the regional government knew of the goals and needs of companies firsthand, allowing them to identify possible legal barriers that might hamper the implementation of IS practices.
The second IS profile allowed for identification of companies that might catalyze new kernels, given the high potential they have to expand IS by acting as both seekers and providers. All ambitious projects devised to overcome one-way exchanges among companies (see Section 2.6) considered companies belonging to this IS profile. These companies are now leading the two strategic projects described in Section 3.4, in which some companies belonging to the IS profiles one and three are also involved.
The obtained results in the Valenciaport cluster can be seen as a promising starting point, encouraging the challenge of formalizing a regional IS co-ordination system in the Valencian community. The objective of the regional government is to develop a system to co-ordinate IS initiatives that increase intercompany exchanges by improving internal and external communication, designing new business models, and partially funding viable IS projects. Following an agile approach, the initial idea was to first establish the hub of seaport circularity, then to expand it to the hub of city circularity, and, finally, extend it to embrace the regional area. However, it remains to be seen how the identified synergies may evolve and how many are finally created. Further works are needed to organize the identified synergies hierarchically, according to their viability, and to implement the more promising ones. In addition, the IS team is going to monitor the bottom-up initiatives by evaluating resource exchanges among companies, testing decentralized pure market mechanisms, and gaining information about the behaviors of companies. The objective is to gain insights into how top-down initiatives, regulated by governments or third parties, and bottom-up initiatives, regulated by companies and market laws, can influence the emergence of different exchange patterns. Furthermore, a more in-depth viability analysis of the two strategic projects devised in this study has to be carried out, as well as looking for funding sources. At the point of writing, the analysis and development of these projects has been included in a SPIRE European proposal submitted to the Low-Carbon Circular Industries H2020 work program. Finally, the legislative issues that make IS extremely complex and administratively arduous in the seaport context have to be addressed in order to develop a policy framework and support mechanisms that incentivize seaport IS in the future.

5. Conclusions

The procedure applied in the current study allowed us to analyze the IS potential in the Valenciaport community, both helping to identify IS opportunities and supporting the IS creation task. The identification of IS opportunities was achieved using the Quick Wins Workshop format, which allowed for the identification of possible resource flows, uncovering patterns of exchange, and identifying possible matchings. The IS creation was supported by clustering methods, which allowed us to define common symbiotic features among stakeholders by classifying them into groups with similar IS potential. This analysis allows managers to identify the precursors of symbiosis and the most relevant institutions within the community, and to screen and target new strategic projects to foster IS.
A great number of companies (18) from the Valenciaport community took part in the study. As a result, 79 different resources, classified into eight categories, were identified, and a total of 78 possible matchings were found. Three IS profiles were identified, the first being composed of waste management companies, the second having companies with the highest IS potential, and the last being comprised of companies with a low IS profile. Two strategic projects were devised, in a top-down approach, in which companies belonging to the second profile played a relevant role.
In summary, it can be concluded that the proposed procedure, including company profiling, provides useful managerial tools for mapping IS possibilities and developing them further in communities interested in fostering IS to reduce their environmental impact and achieving more sustainable development.

Author Contributions

Conceptualization, M.A.A.-R.; methodology, M.A.A.-R.; validation, M.A.A.-R.; formal analysis, M.A.A.-R.; investigation, M.A.A.-R., V.A.C.-B., B.P.-B., M.V., and I.C.; resources, M.A.A.-R., V.A.C.-B., B.P.-B., M.V., and I.C.; data curation, M.A.A.-R., V.A.C.-B., B.P.-B., M.V., and I.C.; writing—original draft preparation, M.A.A.-R.; writing—review and editing, M.A.A.-R.; visualization, M.A.A.-R.; supervision, M.A.A.-R., and I.C.; project administration, M.A.A.-R., and I.C.; funding acquisition, M.A.A.-R., M.V., and I.C. All authors have read and agreed to the published version of the manuscript.

Funding

This research was funded by the Valencian Institute of Business Competitiveness (IVACE), grant number IMAMCA/2019/1.

Acknowledgments

Authors want to show their gratitude to Federico Torres for supporting and promoting this study in the Valenciaport community, to Pilar Sánchez and Alicia Martí for their administrative support in the workshop organization, and to ©International Synergies Limited and James Woodcock for leading the Quick Wins Workshop and sharing information from their SYNERGie®4.0 resource management database and platform.

Conflicts of Interest

The authors declare no conflict of interest. The funders had no role in the design of the study; in the collection, analyses, or interpretation of data; in the writing of the manuscript, or in the decision to publish the results.

References

  1. Albino, V.; Fraccascia, L.; Savino, T. Industrial Symbiosis for a Sustainable City: Technical, Economical and Organizational Issue. Procedia Eng. 2015, 118, 950–957. [Google Scholar] [CrossRef] [Green Version]
  2. Chertow, M.R. Industrial symbiosis: Literature and taxonomy. Annu. Rev. Energ. Environ. 2000, 25, 313–337. [Google Scholar] [CrossRef] [Green Version]
  3. Huang, M.; Wang, Z.; Chen, T. Analysis on the theory and practice of industrial symbiosis based on bibliometrics and social network analysis. J. Clean. Prod. 2019, 213, 956–967. [Google Scholar] [CrossRef]
  4. Lee, D. Turning waste into by-product. Manuf. Serv. Oper. Manag. 2012, 14, 115–127. [Google Scholar] [CrossRef] [Green Version]
  5. Yeo, Z.; Masi, D.; Low, J.S.C.; Ng, Y.T.; Tan, P.S.; Barnes, S. Tools for promoting industrial symbiosis: A systematic review. J. Ind. Ecol. 2019, 23, 1087–1108. [Google Scholar] [CrossRef] [Green Version]
  6. Yuan, Z.; Shi, L. Improving enterprise competitive advantage with industrial symbiosis: Case study of a smeltery in China. J. Clean. Prod. 2009, 17, 1295. [Google Scholar] [CrossRef]
  7. Frosch, R.A.; Gallopoulos, N.E. Strategies for manufacturing. Sci. Am. 1989, 261, 144–152. [Google Scholar] [CrossRef]
  8. Wen, Z.; Meng, X. Quantitative assessment of industrial symbiosis for the promotion of circular economy: A case study of the printed circuit boards industry in China’s Suzhou New District. J. Clean. Prod. 2015, 90, 211–219. [Google Scholar] [CrossRef]
  9. Chertow, M.R. “Uncovering” industrial symbiosis. J. Ind. Ecol. 2007, 11, 11–30. [Google Scholar] [CrossRef]
  10. Ehrenfeld, J.; Gertler, N. Industrial ecology in practice: The evolution of interdependence at Kalundborg. J. Ind. Ecol. 1997, 1, 67–79. [Google Scholar] [CrossRef]
  11. Chertow, M.R. The eco-industrial park model reconsidered. J. Ind. Ecol. 1999, 2, 8–10. [Google Scholar] [CrossRef]
  12. Baas, L.W.; Boons, F.A. An industrial ecology project in practice: Exploring the boundaries of decision-making levels in regional industrial systems. J. Clean. Prod. 2004, 12, 1073–1085. [Google Scholar] [CrossRef]
  13. Gibbs, D.; Deutz, P. Implementing industrial ecology? Planning for eco-industrial parks in the USA. Geoforum 2004, 36, 429–439. [Google Scholar] [CrossRef]
  14. Korhonen, J.; Snaikin, J.P. Analyzing the evolution of industrial ecosystems: Concepts and application. Ecol. Econ. 2005, 52, 169–186. [Google Scholar] [CrossRef]
  15. Tudor, T.; Adam, E.; Bates, M. Drivers and limitations for the successful development and functioning of EIPs (eco-industrial parks): A literature review. Ecol. Econ. 2007, 61, 199–207. [Google Scholar] [CrossRef]
  16. Velenturf, A.P.M. Promoting industrial symbiosis: Empirical observations of low-carbon innovations in the Humber region, UK. J. Clean. Prod. 2016, 128, 116–130. [Google Scholar] [CrossRef]
  17. Chertow, M.R.; Ehrenfeld, J. Organizing self-organizing systems: Toward a theory of industrial symbiosis. J. Ind. Ecol. 2012, 16, 13–27. [Google Scholar] [CrossRef]
  18. Symbiosis Institute. 2019. Available online: http://www.symbiosis.dk/.fgde (accessed on 5 February 2020).
  19. Lieder, M.; Rashid, A. Towards circular economy implementation: A comprehensive review in context of manufacturing industry. J. Clean. Prod. 2016, 115, 36–51. [Google Scholar] [CrossRef]
  20. Neves, A.; Godina, R.; Azevedo, S.G.; Matias, J.C.O. A comprehensive review of industrial symbiosis. J. Clean. Prod. 2020, 247, 119113. [Google Scholar] [CrossRef]
  21. European Commission. Closing the Loop—An EU Action Plan for the Circular Economy; Technical Report; European Commission: Brussels, Belgium, 2015. [Google Scholar]
  22. Domenech, T.; Bleischwitz, R.; Doranova, A.; Panayotopoulos, D.; Roman, L. Mapping Industrial Symbiosis Development in Europe_ typologies of networks, characteristics, performance and contribution to the Circular Economy. Resour. Conserv. Recycl. 2019, 141, 76–98. [Google Scholar] [CrossRef]
  23. Cervo, H.; Ferrasse, J.H.; Descales, B.; van Eetvelde, G. Blueprint: A methodology facilitating data exchanges to enhance the detection of industrial symbiosis opportunities—Application to a refinery. Chem. Eng. Sci. 2020, 211, 115254. [Google Scholar] [CrossRef]
  24. European Union. Study and Portfolio Review of the Projects on Industrial Symbiosis in DG Research and Innovation: Findings and Recommendations; Publications Office of the European Union: Luxembourg, 2020. [Google Scholar] [CrossRef]
  25. Miteco Ministry. España Circular 2030. Estrategia Española de Economía Circular. 2020. Available online: https://www.miteco.gob.es/es/calidad-y-evaluacion-ambiental/temas/economia-circular/espanacircular2030_def1_tcm30-509532.PDF (accessed on 4 June 2020).
  26. Kotowska, I. Policies applied by seaport authorities to create sustainable development in port cities. Transp. Res. Proc. 2016, 16, 236–243. [Google Scholar] [CrossRef] [Green Version]
  27. Cerceau, J.; Mat, N.; Junqua, G.; Lin, L.; Laforest, V.; Gonzalez, C. Implementing industrial ecology in port cities: International overview of case studies and cross-case analysis. J. Clean. Prod. 2014, 74, 1–16. [Google Scholar] [CrossRef] [Green Version]
  28. Di Vaio, A.; Varriale, L. Management Innovation for Environmental Sustainability in Seaports: Managerial Accounting Instruments and Training for Competitive Green Ports beyond the Regulations. Sustainability 2018, 10, 783. [Google Scholar] [CrossRef] [Green Version]
  29. Gravagnuolo, A.; Angrisano, M.; Girard, L.F. Circular Economy Strategies in Eight Historic Port Cities: Criteria and Indicators towards a Circular City Assessment Framework. Sustainability 2019, 11, 3512. [Google Scholar] [CrossRef] [Green Version]
  30. Karimpour, R.; Ballini, F.; Ölcer, A.I. Circular economy approach to facilitate the transition of the port cities into self-sustainable energy ports—A case study in Copenhagen-Malmö Port (CMP). WMU J. Marit. Aff. 2019, 18, 225–247. [Google Scholar] [CrossRef]
  31. Williams, J. The Circular Regeneration of a Seaport. Sustainability 2019, 11, 3424. [Google Scholar] [CrossRef] [Green Version]
  32. Review of Maritime Transport 2019. United Nations Conference on Trade and Development Website. Available online: https://unctad.org/en/PublicationsLibrary/rmt2019_en.pdf (accessed on 11 March 2020).
  33. Zhang, Q.; Geerlings, H.; El Makhloufi, A.; Chen, S. Who governs and what is governed in port governance: A review study. Transp. Policy 2018, 64, 51–60. [Google Scholar] [CrossRef]
  34. Acciaro, M.; Ghiara, H.; Cusano, M.I. Energy management in seaports: A new role for port authorities. Energy Policy 2014, 71, 4–12. [Google Scholar] [CrossRef]
  35. Acciaro, M. Corporate responsibility and value creation in the port sector. Int. J. Logist. Res. Appl. 2015, 18, 291–311. [Google Scholar] [CrossRef]
  36. Acciaro, M.; Vanelslander, T.; Sys, C.; Ferrari, C.; Roumboutsos, A.; Giuliano, G.; Lam, J.S.L.; Kapros, S. Environmental sustainability in seaports: A framework for successful innovation. Marit. Policy Manag. 2014, 41, 480–500. [Google Scholar] [CrossRef]
  37. Grant, G.B.; Seager, T.P.; Massard, G.; Nies, L. Information and communication technology for industrial symbiosis. J. Ind. Ecol. 2010, 14, 740–753. [Google Scholar] [CrossRef]
  38. van Capelleveen, G.; Amrit, C.; Yazan, D.M. A literature survey of information systems facilitating industrial symbiosis. In From Science to Society; Otjacques, B., Hitzelberger, P., Naumann, F., Wohlgemuth, V., Eds.; Springer: Cham, Switzerland, 2018; pp. 155–169. [Google Scholar]
  39. The Materials Marketplace. Available online: http://materialsmarketplace.org/ (accessed on 24 August 2020).
  40. Online Waste Exchange for Businesses and Organizations in Singapore. Available online: http://www.zerowastesg.com/ (accessed on 23 August 2020).
  41. Zero Waste Scotland. Available online: http://cme.resourceefficientscotland.com/materials (accessed on 21 August 2020).
  42. Cecelja, F.; Raafat, T.; Trokanas, N.; Innes, S.; Smith, M.; Yang, A.; Zorgios, Y.; Korkofygas, A.; Kokossis, A. E-symbiosis: Technology-enabled support for industrial symbiosis targeting small and medium enterprises and innovation. J. Clean. Prod. 2015, 98, 336–352. [Google Scholar] [CrossRef] [Green Version]
  43. Low, J.S.C.; Tjandra, T.B.; Yunus, F.; Chung, S.Y.; Tan, D.Z.L.; Raabe, B.; Ting, N.Y.; Yeo, Z.; Bressan, S.; Ramakrishna, S.; et al. A collaboration platform for enabling industrial symbiosis: Application of the database engine for waste-to-resource matching. Procedia CIRP 2018, 69, 849–854. [Google Scholar] [CrossRef]
  44. Brown, J.; Gross, D.; Wiggs, L. The MatchMaker! system: Creating virtual eco-industrial parks. Yale F&ES Bull. 2002, 106, 103–136. [Google Scholar]
  45. Laybourn, P. Industrial symbiosis and circular economy: Best practices from the UK National Industrial Symbiosis Programme (NISP). In Proceedings of the ResourceFULL Use Workshop, Portland, OR, USA, 17 August 2017. [Google Scholar]
  46. Kastner, C.A.; Lau, R.R.; Kraft, M.M. Quantitative tools for cultivating symbiosis in industrial parks: A literature review. Appl. Energy 2015, 155, 599–612. [Google Scholar] [CrossRef]
  47. Evans, D.S.; Schmalensee, R. Failure to launch: Critical mass in platform businesses. Rev. Netw. Econ. 2010, 9, 1–26. [Google Scholar] [CrossRef] [Green Version]
  48. Ayres, R. Toward Zero Emissions: Is There a Feasible Path; INSEAD working paper, 1997, # 97/80/EPS; INSEAD: Fontainebleau, France, 1997. [Google Scholar]
  49. Baas, L. Developing an industrial ecosystem in Rotterdam: Learning by what? J. Ind. Ecol. 2000, 4, 4–6. [Google Scholar] [CrossRef]
  50. Park, H.S.; Won, J.Y. Ulsan Eco-industrial Park, challenges and opportunities. J. Ind. Ecol. 2007, 11, 11–13. [Google Scholar] [CrossRef]
  51. Boehme, S.E.; Panero, M.A.; Munoz, G.R.; Powers, C.W.; Valle, S.N. Collaborative problem solving using an industrial ecology approach. The New York/New Jersey Harbor economy-wide substance flow case studies. J. Ind. Ecol. 2009, 13, 811–829. [Google Scholar] [CrossRef]
  52. Girard, L.F.; Di Palma, M. La simbiosi come strumento di rigenerazione urbana nelle città portuali. BDC Bollettino Del Centro Calza Bini 2016, 16, 239–250. [Google Scholar] [CrossRef]
  53. De Vita, G.E.; Gravagnuolo, A.; Ragozino, S. Circular models for the city’s complexity. Urban. Inf. INU 2018, 278, 10–14. [Google Scholar]
  54. Mat, N.; Cerceau, J.; Shi, L.; Park, H.S.; Junqua, G.; Lopez-Ferber, M. Socio-ecological transitions toward low-carbon port cities: Trends, changes and adaptation processes in Asia and Europe. J. Clean. Prod. 2016, 114, 362–375. [Google Scholar] [CrossRef]
  55. Schlüter, L.; Mortensen, L.; Kørnøv, L. Industrial symbiosis emergence and network development through reproduction. J. Clean. Prod. 2020, 252, 119631. [Google Scholar] [CrossRef]
  56. Mortensen, L.; Kørnøv, L. Critical factors for industrial symbiosis emergence process. J. Clean. Prod. 2020, 212, 56–69. [Google Scholar] [CrossRef]
  57. Laybourn, P.; Morrissey, M. National Industrial Symbiosis Programme: The Pathway to a Low Carbon Sustainable Economy International Synergies; National Industrial Symbiosis Programme: Birmingham, UK, 2009. [Google Scholar]
  58. Van Eetvelde, G. Industrial symbiosis. In Resource Efficiency of Processing Plants: Monitoring and Improvement, 1st ed.; Krämer, S., Engell, S., Eds.; Wiley-VCH Verlag GmbH & Co. KGaA: Weinheim, Germany, 2018; pp. 441–469. [Google Scholar]
  59. Lombardi, D.R.; Laybourn, P. Redefining industrial symbiosis. J. Ind. Ecol. 2012, 16, 28–37. [Google Scholar] [CrossRef]
  60. Punj, G.; Stewart, D.G. Cluster Analysis in Marketing Research: Review and Suggestions for Application. J. Mark. Res. 1983, 20, 134–148. [Google Scholar] [CrossRef]
  61. Wilks, D.S. Statistical Methods in the Atmospheric Sciences, 3rd ed.; Academic press: San Diego, CA, USA, 2011. [Google Scholar]
  62. Kaufman, L.; Rousseeuw, P.J. Finding Groups in Data: An. Introduction to Cluster Analysis; Wiley: Hoboken, NJ, USA, 2005. [Google Scholar]
  63. Albino, V.; Fraccascia, L.; Giannoccaro, I. Exploring the role of contracts to support the emergence of self-organized industrial symbiosis networks: An agent-based simulation study. J. Clean. Prod. 2016, 112, 4353–4366. [Google Scholar] [CrossRef]
  64. Chopra, S.S.; Khanna, V. Understanding resilience in industrial symbiosis networks: Insights from network analysis. J. Environ. Manag. 2014, 141, 86–94. [Google Scholar] [CrossRef]
  65. Paquin, R.L.; Howard-Grenville, J. The evolution of facilitated industrial symbiosis. J. Ind. Ecol. 2012, 16, 83–93. [Google Scholar] [CrossRef] [Green Version]
  66. Paquin, R.L.; Howard-Grenville, J. Blind dates and arranged marriages: Longitudinal processes of network orchestration. Organ. Stud. 2013, 34, 1623–1653. [Google Scholar] [CrossRef]
  67. Jensen, P.D. The role of geospatial industrial diversity in the facilitation of regional industrial symbiosis. Resour. Conserv. Recycl. 2016, 107, 92–103. [Google Scholar] [CrossRef] [Green Version]
  68. Domenech, T.; Davies, M. Structure and morphology of industrial symbiosis networks: The case of Kalundborg. Procedia Soc. Behav. Sci. 2011, 10, 79–89. [Google Scholar] [CrossRef] [Green Version]
  69. Ducruet, C. Typologie Mondiale des Relations Ville-Port. Cybergeo 417. 2008. Available online: http://cybergeo.revues.org/17332 (accessed on 14 March 2020).
  70. van Klink, H.A. The port network as a new stage in port development: The case of Rotterdam. Environ. Plan. A 1998, 30, 143–160. [Google Scholar] [CrossRef]
  71. De Langen, P.W. Chapter 20-stakeholders, conflicting interests and governance in port clusters. Res. Transp. Econ. 2006, 17, 457–477. [Google Scholar] [CrossRef]
  72. Boons, F.; Baas, L. Types of IE: The problem of coordination. J. Clean. Prod. 1997, 5, 79–86. [Google Scholar] [CrossRef]
  73. Brullot, S. Mise en Oeuvre de Projets Territoriaux D’écologie Industrielle en France: Vers un Outil Méthodologique D’aide à la Decisión. Ph.D. Thesis, Université de Technologie de Troyes, Troyes, France, 2009. [Google Scholar]
  74. Mileva-Boshkoska, B.; Rončević, B.; Uršič, E.D. Modeling and Evaluation of the Possibilities of Forming a Regional Industrial Symbiosis Networks. Soc. Sci. 2018, 7, 13. [Google Scholar] [CrossRef] [Green Version]
  75. Boletin Oficial del Estado. Available online: https://www.boe.es/eli/es/rdlg/2011/09/05/2 (accessed on 1 April 2020).
  76. Cloquell-Ballester, V.A.; Lo-Iacono-Ferreira, V.G.; Artacho-Ramírez, M.A.; Capuz-Rizo, S.F. RUE Index as a Tool to Improve the Energy Intensity of Container Terminals—Case Study at Port of Valencia. Energies 2020, 13, 2556. [Google Scholar] [CrossRef]
  77. Boons, F.; Howard-Grenville, J. The Social Embeddedness of Industrial Ecology; Edward Elgar Publishing: Northampton, MA, USA, 2009. [Google Scholar]
  78. Baas, L.W.; Huisingh, D. The synergistic role of embeddedness and capabilities in industrial symbiosis: Illustration based upon 12 years of experiences in the Rotterdam harbour and Industry complex. Prog. Ind. Ecol. Int. J. 2008, 5, 399–421. [Google Scholar] [CrossRef] [Green Version]
  79. European Spatial Planning Observation Network (ESPON). CIRCTER—Circular Economy and Territorial Consequences. Draft Synthesis Report; Publications Office of the European Union: Luxembourg, 2019. [Google Scholar]
  80. Directive (EU) 2018/851 of the European Parliament and of the Council of 30 May 2018 amending Directive 2008/98/EC on Waste (Text with EEA Relevance). Available online: https://eur-lex.europa.eu/legal-content/EN/TXT/?uri=celex:32018L0851 (accessed on 12 March 2020).
  81. Costa, I.; Massard, G.; Agarwal, A. Waste management policies for industrial symbiosis development: Case studies in European countries. J. Clean. Prod. 2010, 18, 815–822. [Google Scholar] [CrossRef]
  82. Jiao, W.; Boons, F. Toward a research agenda for policy intervention and facilitation to enhance industrial symbiosis based on a comprehensive literature review. J. Clean. Prod. 2014, 67, 14–25. [Google Scholar] [CrossRef]
  83. Deutz, P.; Ioppolo, G. From theory to practice: Enhancing the potential policy impact of industrial ecology. Sustainability 2015, 7, 2259–2273. [Google Scholar] [CrossRef] [Green Version]
  84. Fraccascia, L.; Giannoccaro, I.; Albino, V. Efficacy of landfill tax and subsidy policies for the emergence of industrial symbiosis networks: An agent-based simulation study. Sustainability 2017, 9, 521. [Google Scholar] [CrossRef] [Green Version]
  85. Lehtoranta, S.; Nissinen, A.; Mattila, T.; Melanen, M. Industrial symbiosis and the policy instruments of sustainable consumption and production. J. Clean. Prod. 2011, 19, 1865–1875. [Google Scholar] [CrossRef]
Figure 1. Number of different haves and wants of Valenciaport companies classified by resources categories.
Sustainability 12 07495 g001
Figure 2. Number of resources offered (HAVES in green) and requested (WANTS in yellow) in each category by companies.
Sustainability 12 07495 g002
Figure 3. Matchings among Valenciaport companies in rows with companies that have the resource in green, and companies that want them in yellow. In Quantity, the number refers to the amount of offered resources, and “99” = undefined, and in Supply type, “C” = Continuous and “B” = Batch. Authors want to acknowledge ISL and the SYNERGie®4.0 platforms for this analysis.
Sustainability 12 07495 g003
Figure 4. Number of matchings by resource category.
Sustainability 12 07495 g004
Figure 5. Number of matchings by company.
Sustainability 12 07495 g005
Figure 6. Dendrogram using complete linkage showing companies’ groups.
Sustainability 12 07495 g006
Figure 7. Fusion stage vs. fusion coefficients.
Sustainability 12 07495 g007
Figure 8. Pipeline exchange of MARPOL I waste, oil terminal waste, and recovered fuel among companies.
Sustainability 12 07495 g008
Table 1. Stakeholders’ activity, ID, and number of stakeholders with the same activity.
Stakeholder’s ActivityIDNumber of Stakeholders
Waste ManagementWaste_Mgmt.3
Multipurpose Port TerminalMultipurp_T2
Container TerminalContainer_T2
Oil TerminalOil_T1
RoPax TerminalRoPax_T1
RoRo TerminalRoRo_T1
Vessels Stowage & WarehousingVS&W1
Temperature-controlled Warehouse and LogisticTCW&L1
LNG Management & DistributionLNG_M&D1
TowageTowage1
Yacht ClubYacht_C1
Port AuthorityPort_A1
Port Research CentrePort_RC1
Environmental Knowledge and Innovation CommunityEK&IC1
Total number of Stakeholders:18
Table 2. Resources classified by categories.
MaterialsGoodsSpaceExpertiseEnergyServicesHydrocarbonWater
Absorbent materialForklift truckOffices for rentInstallationsResidual heatVehicle e-charge pointMotor oilCollected rainwater
Broken ceramic materialTractor unitEvents buildingEnergy certificationPhotovoltaic energyTrainingHydrocarbon liquidWater from air conditioners
Paper wasteElevating PlatformConference roomStowageKinetic energyLeisure facilitiesMotor oil + waterSanitary sewage
Stowage remaining woodWeighing deviceVenueMgmt. systemElectricityLogisticsFuel sludgeWater
Scrap metalRefrigeratorsFieldForum ASECAMRenewable energyFirefighting centralDiesel A/B
Plant wasteUsed floating barrierTraining facilitiesEnergy mgmt.Alternative energy sourceGas stationLow viscosity HC
Bulky wasteSteel wiresLearning classroomsLNG expertiseSolar power financeRemoval of HW and non-HWHydrocarbon waste
Organic/solid wasteTowropesStorage capacityWaste mgmt.Heat (T > 70 °C)Container transport
Contaminated wrapsOffice furnitureRecording spaceWaste legislationCold energy
Protective polyurethanesFenders and tiresLNG laboratoryWater expertise
Protective tablecloths208L containersHydrocarbon laboratoryBusiness mgmt.
Contaminated plastic packagingEmpty plastic containers (IBC)
Plastic wasteEmpty drums
Hazardous waste
Electronic waste
Used pneumatic tires
Table 3. Valenciaport resources to share with other industries.
Requested Resources without Inner OfferOffered Resources without Inner Demand
ElectricityInstallation expertRecording space
Renewable energyOffices for rentTraining services
Alternative energy sourcesPlastic wasteLeisure facilities
Gas stationEnergy certification experts208 L containers
Waste legislation expertsBroken ceramic materialTowropes
Water purification expertConference roomKinetic energy
Business management expertiseTractor unitResidual heat
Paper wasteEnergy management expertise
Ship loading expertiseCold energy
FieldOrganic/Solid waste
Rainwater collectionContaminated wraps
Used floating barrierFuel sludge
Sanitary sewageProtective tablecloths
Management systems expertsElectronic waste
Table 4. Final center values of grouping variables per cluster.
VariablesCluster
123
Num. of Haves573.7
Num. of Wants8.54.71.7
Matchings as Supplier5.55.72.8
Matchings as Seeker145.41.1
Haves Typologies332.7
Wants Typologies3.53.11.8
Table 5. Number of cases in each cluster and cluster membership.
ClusterNumber of CasesCluster Membership
12Waste_Mgmt_1
Waste_Mgmt_2
27TCW & L
Container_T1
RoPax_T
Oil_T
Yacht_C
Towage
LNG_M & D
39Multipurp_1
Multipurp_2
RoRo_T
Container_T2
Waste_Mgmt_3
VS & W
Port_A
Port_RC
EK & IC

