1. Introduction
Chicken manure (CM) is an agricultural by-product that is commonly applied to farmland as an organic fertiliser or used as a feedstock for anaerobic digestion (AD) plants to produce renewable energy. CM has a higher nitrogen content compared to other animal manures [
1], comprising of approximately 80% uric acid, 10% ammonium and 5% urea [
2]. Within the CM, bacterial enzymes degrade uric acid to urea. In environments with increased pH and moisture, urea is further converted to ammonium and volatilises as ammonia gas to the atmosphere [
2,
3]. The high nitrogen content of CM in poultry houses causes respiratory problems in livestock and humans, increases greenhouse gas emissions and limits its potential as a feedstock for AD [
1,
2]. As an organic fertiliser, the quantity of manure applied to agricultural land is restricted by nitrogen content. In comparison to other livestock manures, CM application rates per hectare have to be reduced, requiring additional land adjacent to poultry farms for land spreading. Incorrect land application of CM can lead to increased greenhouse gas emissions, water course eutrophication and the spread of pathogens [
1].
In an analogous process in AD plants, the high protein, uric acid and urea contents in CM are readily degraded to ammonium ions (NH
4+) and ammonia (NH
3), which can inhibit biogas production [
4]. Ammonium is highly soluble and found in the digestate. Ammonia, however, is both soluble in digestate and present in the gaseous form as a biogas constituent. The relative proportions of ammonium and ammonia are dependent on the digester’s pH and temperature [
4]. As temperature and pH increase, ammonium conversion to ammonia also increases [
5]. Low concentrations of ammonium are beneficial to the digestion process and aid microbial growth [
6] through the synthesis of amino acids, proteins and nucleic acids [
5]. Ammonium does not diffuse across cell membranes as readily as ammonia [
5]. High concentrations of ammonia within the liquid digestate phase causes ammonia diffusion into microbial cells. Intracellular ammonia can react with hydrogen ions (H
+) to produce intracellular ammonium [
5]. This can lead to a pH imbalance between intracellular and extracellular concentrations, causing an intracellular proton imbalance and potassium deficiency due to ammonia/potassium exchange reactions [
4]. As the digester pH increases, ammonia is more readily produced and inhibition effects increase [
5]. Biogas yields are negatively affected, as methanogens are more susceptible to ammonia inhibition than other anaerobic micro-organisms, with acetate-utilising methanogens more susceptible to inhibition compared to hydrogen-utilising methanogens [
1]. Additionally, CM from layer hens can contain broken eggs and feather debris that have a high sulphur content. There is a synergistic inhibition effect on biogas yields when high ammonia and sulphur concentrations occur concurrently [
1]. With increasing inhibition of methanogens, acidogenic bacteria continue to produce volatile fatty acids (VFA) [
5]. As methane production is now reliant on hydrogenotrophic methanogens, hydrogen partial pressure increases and longer-chain VFA are no longer degraded. As VFA concentrations increase, the pH decreases and the digester becomes unstable [
5].
Various methods can be used to reduce potential ammonia inhibition in digesters. Typically, commercial AD plant operators will dilute CM with other feedstocks to reduce the overall nitrogen content and increase the carbon/nitrogen ratio [
7]. This method relies on access to suitable alternative feedstocks and from an economic perspective, the availability of additional digester volume units relative to biogas yield [
8]. The addition of trace elements is also important in reducing inhibition, as trace elements are required for synthesis of essential coenzymes for microbial growth [
7]. Alternatively, there are a range of chemical processes for stripping nitrogen out of the digester [
4,
8,
9,
10]. Research has demonstrated that air can be passed over the top of the digestate, both with and without pH adjustment, to achieve high ammonia removal efficiencies of 69–78%. However, with pH adjustment, there are health and safety concerns due to dosing commercial digesters with strong alkali [
9]. Similarly, air can be circulated through the digestate (usually in a side-stream) to remove ammonia. However, introducing air into a digester can disturb the anoxic environment [
4]. Flue gas, which does not oxygenate the AD environment, has been shown to be a more suitable carrier gas for ammonia removal (stripping) compared to biogas or air [
4]. A problem of ammonia stripping with air or other gases is that efficiency is reduced with the increasing total solids (TS) content of the digestate [
9]. Moreover, stripping processes have a high energy demand, and if the pH is increased to improve efficiency, then there is a requirement for alkali addition [
9]. Research at the laboratory scale conducted to overcome these gas stripping problems includes a leach bed with a sulfuric acid-filled recirculating membrane which successfully removed ammonia from a mono-fed CM lab-scale digester [
10]. This reactor demonstrated a total ammonia nitrogen (TAN) reduction from 10,000 to 2000 mg/L over 40 days and a methane yield increase of 2.3 times compared to the control digester with no ammonia removal [
10]. Other research has shown that total nitrogen (TN) can be converted to TAN through a pre-hydrolysis step, followed by membrane removal of ammonia. This process demonstrated a 78–83% conversion of TN to TAN during pre-hydrolysis, although TAN removal was limited to 27% [
8].
In the current study, we focused on testing and validating a novel nitrogen recovery process (NRP) developed by Alchemy Utilities Ltd. The Alchemy Utilities NRP involved a pilot-scale (1 m
3) batch reactor that was tested as a pre-commercial prototype, related to patent number WO 2019/092314 AI [
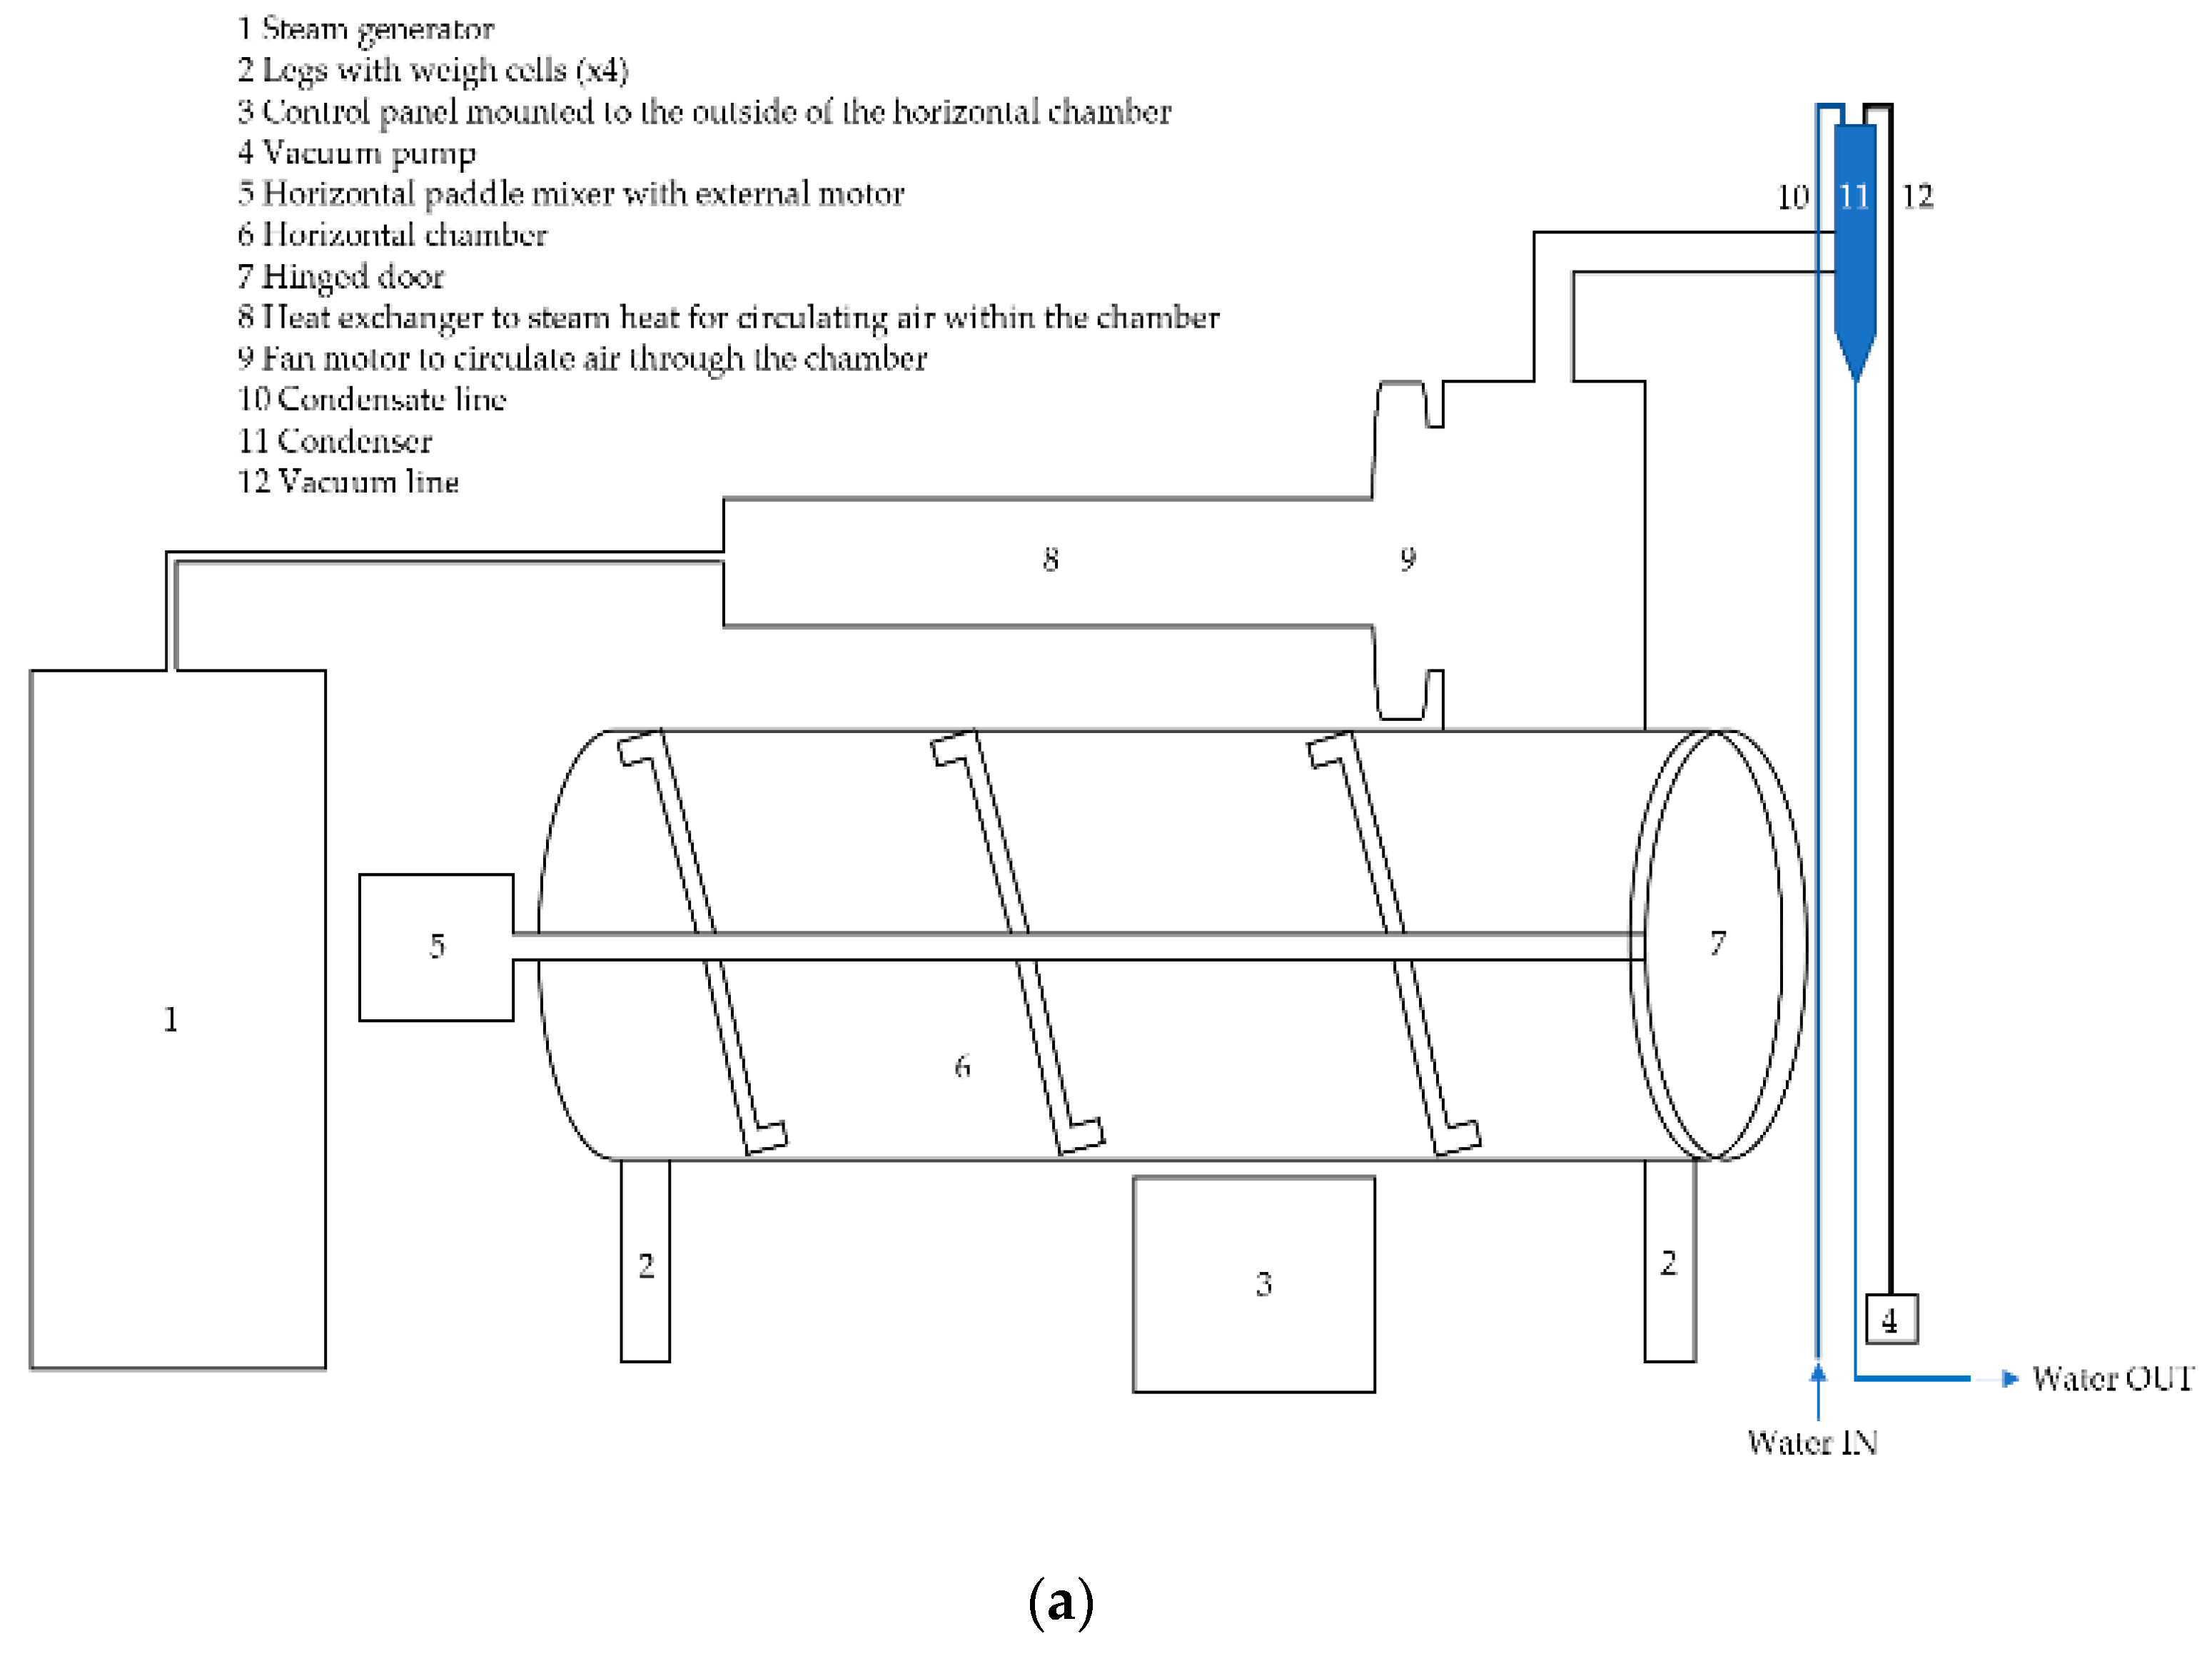
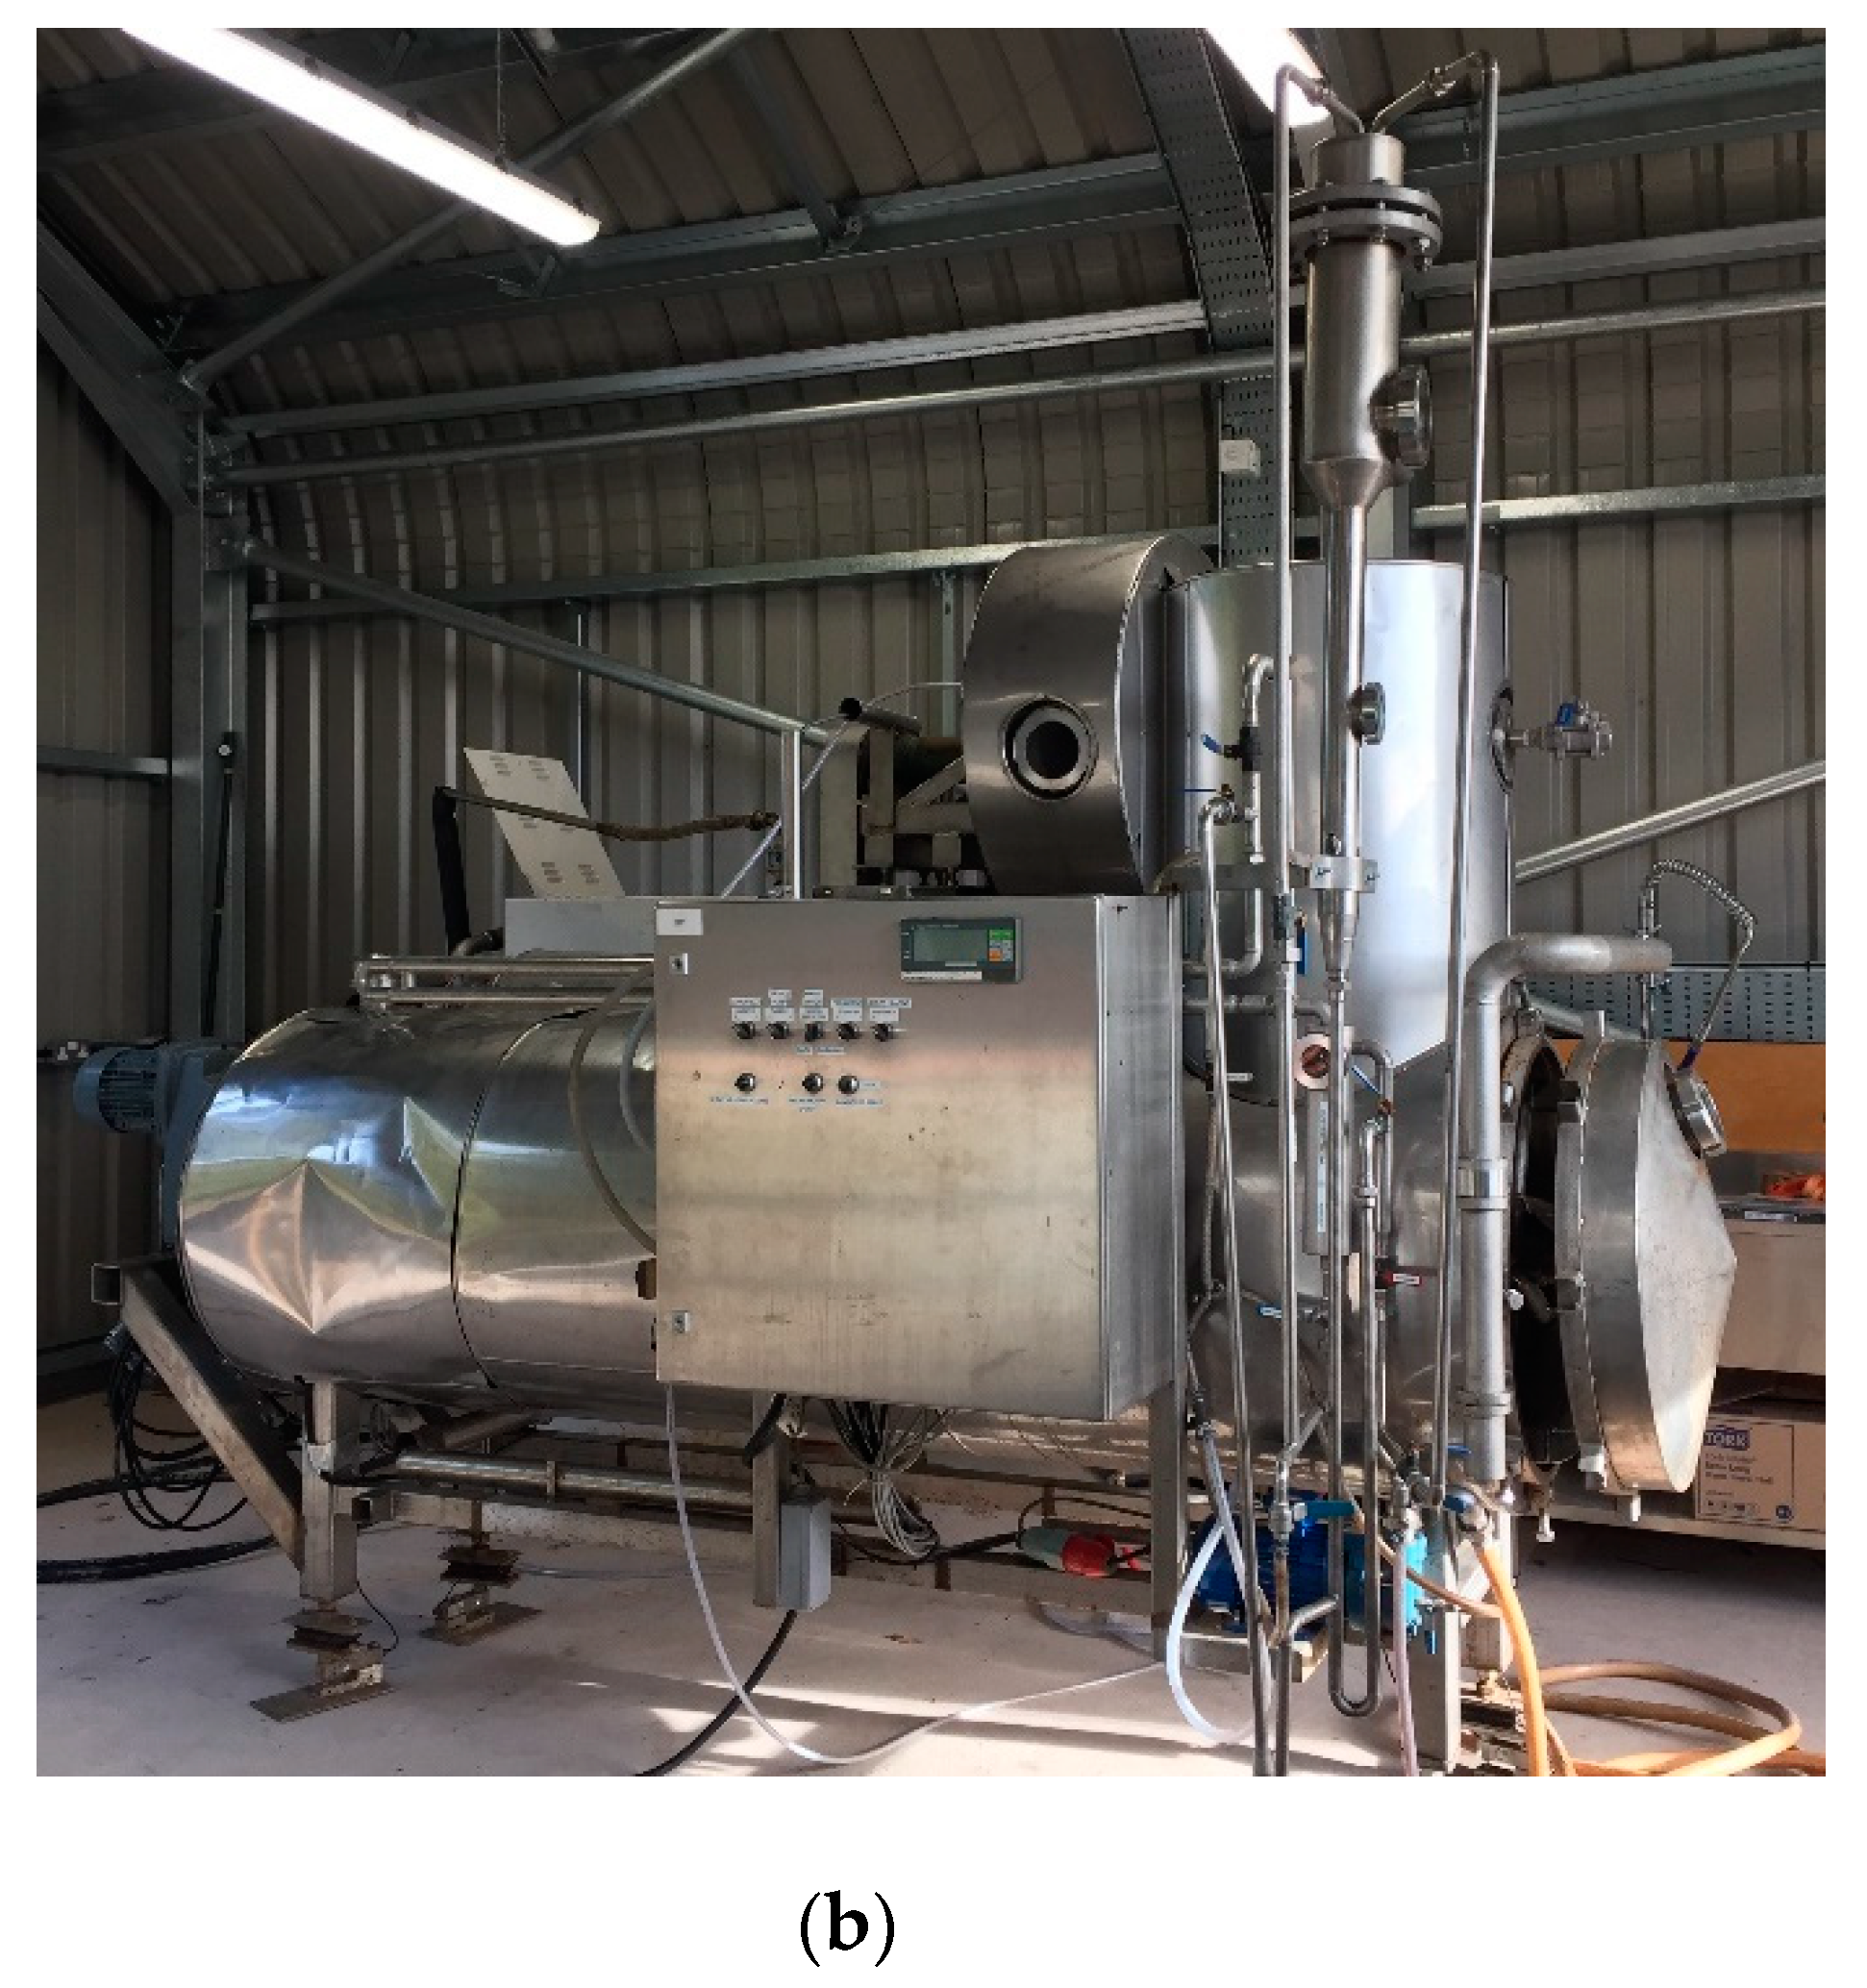
11]. The NRP prototype employed an electrically heated horizontal chamber with an internal paddle mixing system to agitate the CM, increasing volatilisation. Steam- and electrically heated air was used to volatilise ammonium in the CM as it was mixed. The volatilised ammonium air stream was then removed from the chamber using a vacuum pump and solubilised in an aqueous stream in a condensation system (see
Figure 1a,b). The ammonium in the condensation stream was recovered using acid precipitation in the laboratory. Following the removal and recovery of ammonium nitrogen from fresh layer CM, wet biochemical methane potential (BMP) assays were performed on the treated CM. BMP assays were also performed on fresh CM (control) that was not subjected to the NRP. The overall aim of this research was to investigate and quantify the removal of ammonium nitrogen from fresh layers’ CM using the NRP and to determine if NRP-treated CM would increase methane yield in comparison to the untreated fresh CM. If successful, this research could provide an initial assessment as to the suitability of decentralised, farm-scale nitrogen recovery from CM to be used as a nitrogen source for further fertiliser production. Additionally, pre-treating the CM through the NRP may provide a valorisation method for CM to be a more competitive feedstock for AD plants, reducing the inhibition effects that can be seen compared to digesting fresh CM. If this is achievable, AD plants could digest greater quantities of CM and create a better revenue stream for chicken producers. The NRP works on the concept of processing a smaller quantity of feedstock, rather than processing vast quantities of liquid digestate to remove nitrogen. Further, by recovering the nitrogen as ammonium nitrate/sulphate, this by-product has further valorisation pathways to increase revenue. Therefore, the NRP may present a more economic, energy-efficient process to be undertaken at the farm scale compared to some of the other technologies currently being researched. The purpose of the research is not to compete with current larger-scale, centralised nitrogen fertiliser manufacturing technologies, but to look for novel decentralised valorisation opportunities.
2. Materials and Methods
2.1. NRP Experimental Design
Two NRP experiments were conducted to determine the effect of operating time on the performance of the batch NRP at removing and recovering nitrogen from CM. A “Long-test” experiment was conducted, operating the NRP for as long as required until the loss of weight from the CM ceased; the NRP prototype included weigh cells to monitor weight loss in the chamber. The other experiment conducted was a “Short-test” experiment to maximise nitrogen removal from the CM, whilst minimising energy input and operating times. The Short-test was half the time duration of the Long-test. The Long-test was undertaken for 4 h and the Short-test was undertaken for 2 h.
Prior to each experiment, fresh layers’ CM (approximately 300 kg fresh weight (FW)) was collected from a local producer (Oakland Farm Eggs, Telford, UK). The reactor was pre-warmed using an electrical heating system surrounding the circumference of the horizontal chamber (between the inner and outer layers) for two hours prior to the start of each experiment. For the Short-test, the chamber outer temperature reached 95 °C, whilst the outer chamber temperature for the Long-test only reached 75 °C within the two hours. This temperature difference was due to differing outside weather temperatures and an inconsistency in the heating rate of the equipment. The reason for this difference is unknown as both experiments should have heated similarly during the start-up phase. However, as the experiment progressed, the heating rate increased as both experiments reached the same operating temperatures during the experiment. This is a limitation of the pilot-scale technology. After two hours of electrical heating, the NRP chamber door was opened and the chamber was loaded with 50 kg FW of fresh layers’ CM treated with 5 L of 10% w/w sodium hydroxide. The addition of sodium hydroxide increased the pH of the CM to above 10. The CM was loaded into the chamber in five equal sections (zones) throughout the chamber’s length (i.e., 10 kg of CM per zone). These five zones are artificial designations within the chamber to allow for equal filling and emptying of the chamber. There is no anticipated difference in the operation of any zones and it would be expected that there would be no compositional difference in the CM at the end of the experiment between the zones. The NRP was resealed and heated for a further 1 h. In addition to using the electrical heating system, the air within the chamber was heated further using a steam generator to transfer heat into the airspace. This heated air was circulated through the chamber using a fan motor. After one hour of heating, the internal temperature within the chamber had reached 65 °C at the front and 45 °C at the back during the Short-test, and 75 °C at the front and 55 °C at the back of the chamber during the Long-test. One hour after the CM was added, the CM paddle mixer and condensation systems commenced. Water flowed continuously though the condensation system and a vacuum was applied to the NRP chamber to move ammonia into the water stream. The condensation system had a water inflow rate of 18 L/minute and a pH of 6.92. Water cascaded over the incoming air stream to solubilise the ammonia gas, producing an ammonium solution. This was removed from the NRP via the condensate and vacuum lines and acidified in the laboratory to produce ammonium nitrate or sulphate, depending on the acid used. The Short-test was operated for a further 2 h, whilst the Long-test experiment was operated for 4 h until CM weight loss ceased. For both experiments, the chamber reached the same final operating temperature (98 °C at the front and 75 °C at the back).
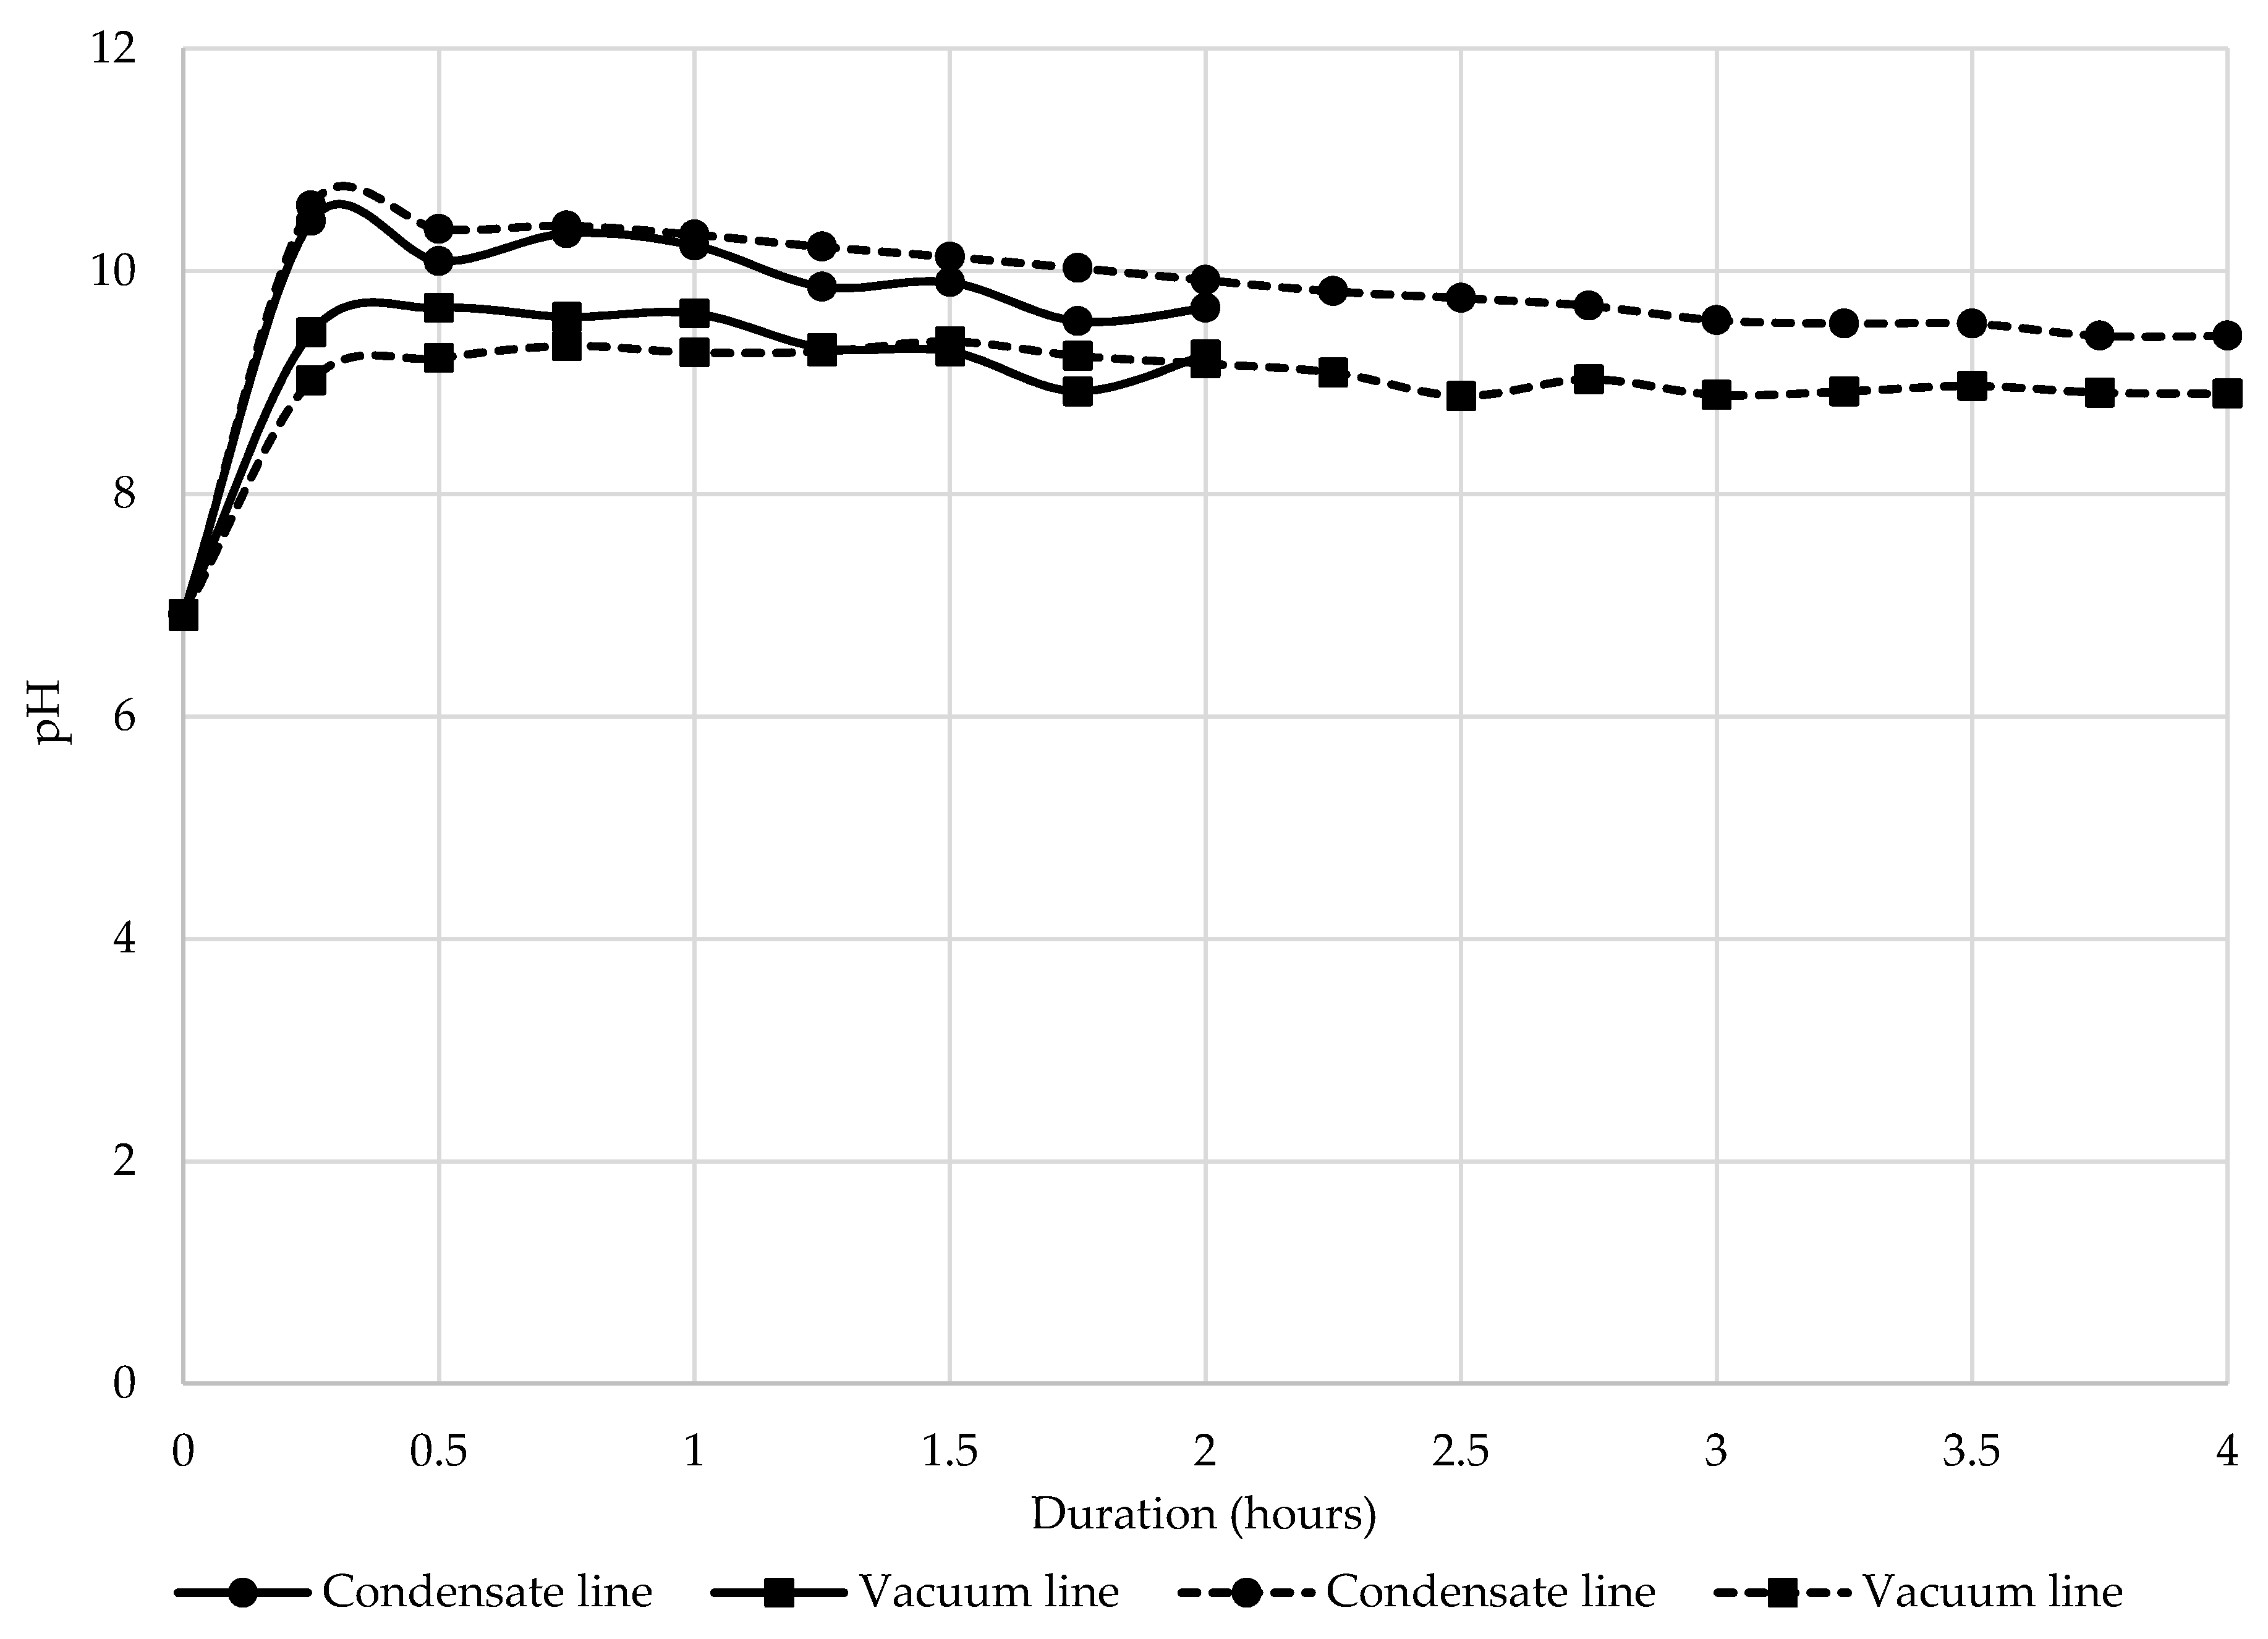
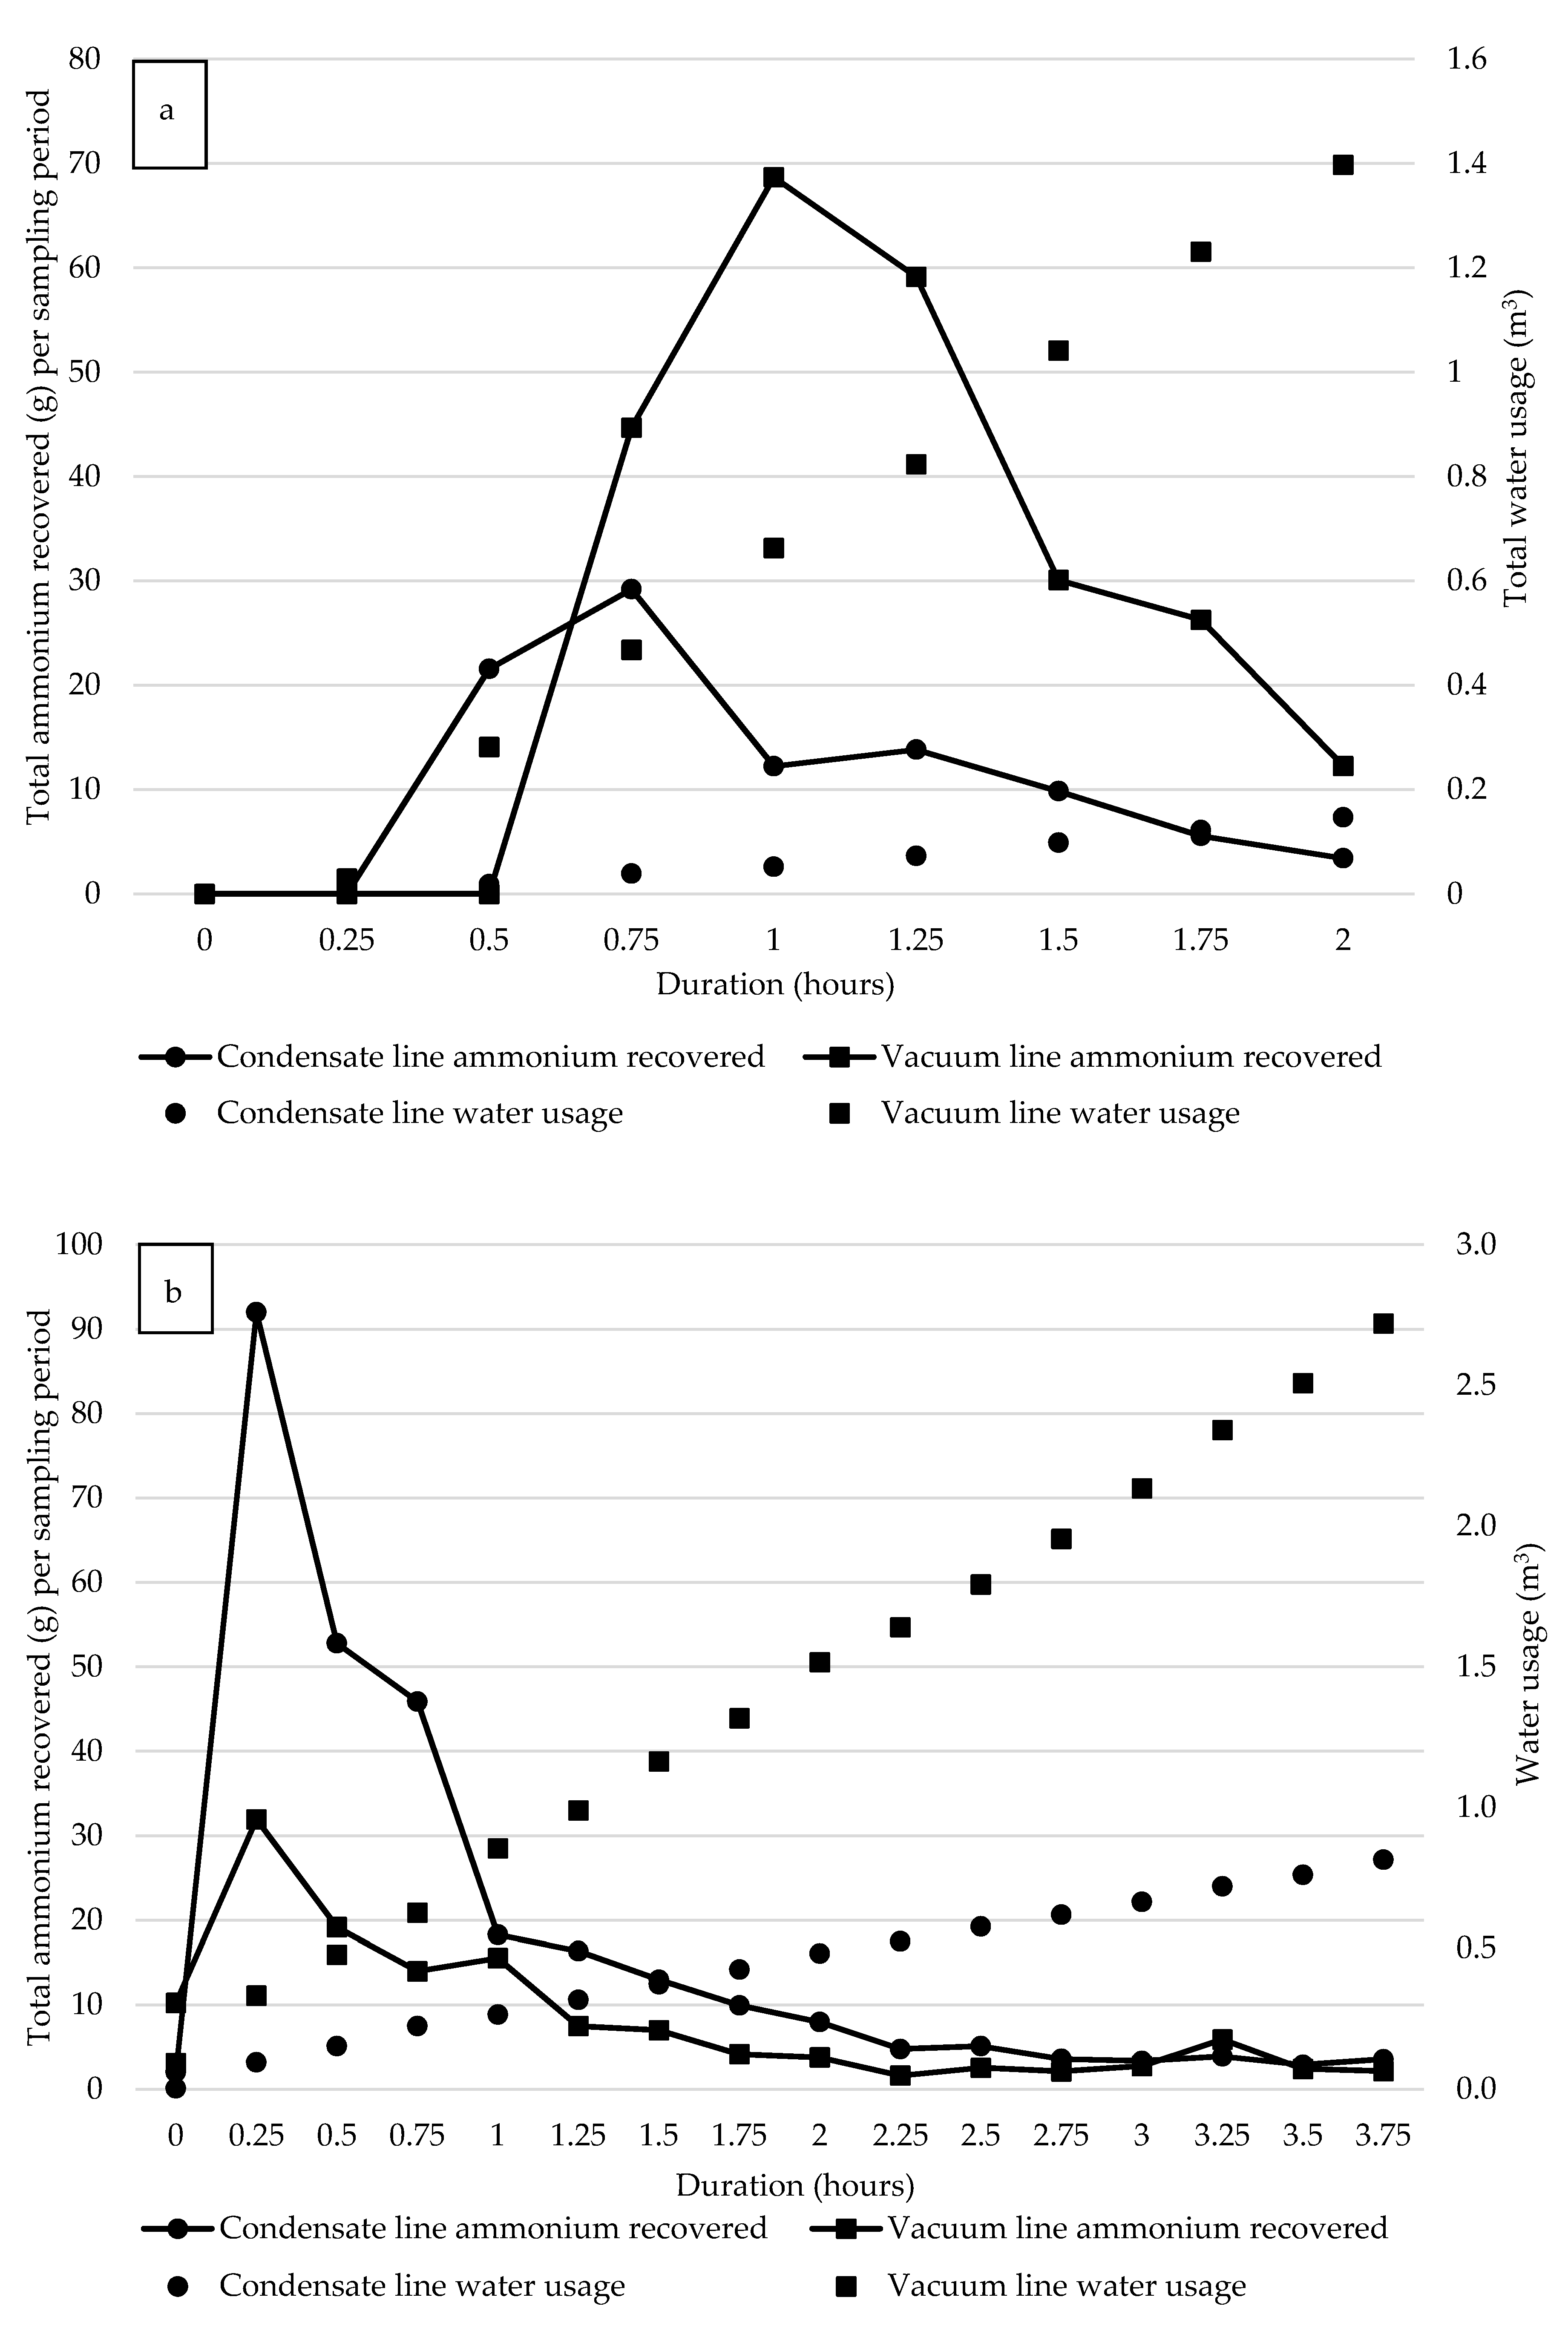
During both experiments, water samples were taken from the condensate and vacuum lines every 15 min. Water samples were analysed for pH and ammonium concentration. Once each test had been completed, the NRP was cooled overnight to ambient temperature and the CM was removed from the five zones of the chamber. CM from each zone was analysed for TS, TN and ammonium concentrations.
2.2. BMP Experimental Design
Samples of the fresh CM and the CM post-NRP-treatments (a representative sample from all five NRP zones) (
Table 1) were anaerobically digested in BMP assays to determine the effect of the NRP on the biogas yield potential and digestibility of the CM. The experiment was conducted as a 3 × 3 factorial, investigating both the CM pre-treatment method and loading rate, as follows:
NRP pre-treatment—
- (a)
Fresh CM (not processed through the NRP, abbreviated to group name “Fresh”);
- (b)
Short-test NRP CM (CM processed for two hours using the Short-test NRP operation conditions, abbreviated to treatment name “Processed Short (PS)”);
- (c)
Long-test NRP CM (CM processed until the NRP weight-loss stopped, abbreviated to treatment name “Processed Long (PL)”).
Loading rate (inoculum to feedstock on a volatile solids (VS) basis)—
Additionally, cellulose controls (to standardise the biological activity (methane yield per gVS fed) of the sludge to the theoretical methane yield of cellulose) and blanks (to determine methane yield from digestate alone) were undertaken. All BMP assays were replicated three times, totalling 33 BMP assays. The total working volume of all assays was standardised with distilled water (working volume of 50 mL) to ensure the headspace for biogas production was equal across all treatments. All BMP assays were randomly allocated a bottle number and randomly distributed throughout the incubator. A BMP assay was undertaken at mesophilic temperature (35 °C) and operated for 35 days.
2.2.1. Preparation of BMP Components
Prior to the start of the experiment, 4 L of sewage sludge digestate was collected from a local sewage works (Severn Trent, Shropshire, UK) and sieved (600 µm) to remove larger particles. The sewage sludge was left at room temperature to degas for 7 days.
2.2.2. BMP Experimental Routine
The CM and sewage sludge were analysed for TS and VS (see
Section 2.3) content prior to the start of the experiment to determine loading volumes for the BMP assays (methodology adapted from [
12]). The BMP assays were loaded on an inoculum/feed substrate VS ratio of 2:1 [
12], as shown in
Table 2. BMP assays were untaken in 125 mL Wheaton serum bottles, sealed with a butyl rubber stopper and an aluminium foil crimped collar. Once each BMP assay was assembled, the bottles were sealed, flushed with nitrogen (ten min) to remove any oxygen present in the headspace and equalised to atmospheric pressure. The bottles were placed in a pre-warmed incubator (35 °C). BMP assays were manually swirled (ten horizontal rotations) per day, prior to biogas sampling. The biogas pressure and volume were measured using a pressure transducer and gas tight syringe (see
Section 2.3). Biogas pressure was measured and recorded every 2–3 days, with biogas removed before each bottle reached a pressure of 1 pound per square inch. Biogas composition (methane, carbon dioxide and hydrogen sulphide) were measured using a micro-GC (see
Section 2.3). During experimental days 17–31, the biogas pressure was measured every 2–3 days, however the biogas was left in the bottle. This was due to the decreasing rate of biogas producing an insufficient sample size to accurately analyse biogas composition more frequently. Once biogas produced had ceased (35 days), the bottles were opened and analysed for pH, ammonium and TN.
2.3. Chemical Analyses
For the NRP condensate water and digestate samples, the pH was analysed using an integrated pH and temperature probe (Jenway, Stone, UK) that was calibrated daily. Similarly, ammonium nitrogen analysis was conducted on these two sample types following the standard method [
13] on a Foss Kjeltec 1035 sampler. The TS and VS content of the CM samples (pre- and post-NRP) and sewage sludge were analysed using standard methods [
14]. For TN determination, CM and liquid digestate samples were freeze-dried (to preserve volatiles) for one week to constant weight. The samples were then analysed using the Dumas method [
13] on a Leco FP-528 (LECO, Stockport, England), calibrated daily using 0.1 g of oven dried ethylenediaminetetraacetic acid. TS, VS and TN losses were calculated using the following calculation relative to TS, VS and TN contents of the substrates entering the digester (IN) compared to the composition of the digestive removed from the digesters (OUT).
BMP assay biogas pressure was measured using a pressure transducer (Gems Sensors and Controls, Basingstoke, UK) fitted with a three-way tap to a hypodermic needle (23G × 1 inch) and a gas syringe [
15]. The hypodermic needle of the pressure transducer was inserted through the bung of the bottle and the pressure was recorded. The biogas was released into a tight syringe and the volume of biogas was recorded. Methane and carbon dioxide analyses were determined using an Agilent 490 micro-GC (Agilent Technologies LDA UK Limited, Stockport, UK), with dual columns (molsieve column for methane and a CP-PoraPLOT U column for carbon dioxide). The injector and columns were pre-heated to 60 °C and 80 °C, respectively. Biogas was sampled for 10 ms onto the molsieve (backflush set to 34 s) and 100 ms for the PoraPLOT. The sample was transferred using helium and analysed for 115 s at a pressure of 120 kPa. Biogas volumes were corrected to standard temperature (0 °C) and pressure (1 atm). Carbon dioxide yield data have not been presented as they are not relevant to the findings of this report.
2.4. Statistical Analyses
The BMP experiment was analysed as a 3 × 3 factorial ANOVA to determine the effect of the NRP pre-treatment method and loading rate, with three replicates per treatment. All statistical analyses were conducted using GenStat version 18, with a significance level of p < 0.05, using Fisher’s least significant difference.
4. Discussion
The NRP was successful at removing nitrogen from the CM as indicated by the increase in pH and ammonium concentrations in the condensation system water lines. The pH increased rapidly from the start and remained high through the duration of the experiment, however the majority of the ammonium was recovered within the first hour (Long-test) and first one hour and a half (Short-test).
The concentration of ammonium within the water lines was diluted as the system used a lot of incoming water. The NRP unit tested was a prototype and the commercial unit will use recirculating water in the condensation system. This will reduce the requirement for fresh water and concentrate the ammonium in solution. A more concentrated ammonium solution will also require more acid to precipitate the nitrogen from the solution for further use. The intention of this step (when done at scale) would be to recover a solid ammonia product that could be used in fertiliser production. There may be an overestimation in the water volume used for the vacuum line, as air was also removed with the water stream, overestimating the water that flowed through the flow meter.
The NRP was effective at drying the CM, although the efficiency of both the heating and mixing systems varied along the length of the chamber which was an unexpected finding. The CM did not move evenly throughout the length of the chamber and accumulated inside the door and at the back. This accumulation had two different effects. The inside of the door area was not heated, so there was a reduction in TN removal from the CM in this area. Additionally, the CM that accumulated inside of the door had a higher moisture content that could have been due to vapours condensing against the non-heated surfaces as the chamber cooled overnight. A commercial NRP would not have this problem, as it will be designed for continuous flow operation instead of batch operation. The greatest weight of CM accumulated at the back of the chamber, but it still dried significantly greater than the front zones. This was because the heating was more effective at the back of the chamber. This will need to be addressed for the commercial NRP design, to ensure even drying throughout the chamber.
The duration of the NRP operation had a significant effect on losses. As would be expected, there was a far greater loss in FW and moisture content from the Long-tests compared to the Short-tests. However, when the rate of loss was analysed, both experiments lost similar rates of FW and moisture during the first two hours of operation, however the CM dried further as the Long-test had a longer duration. Similarly, TS and VS losses were greater for the Long-test as some of the CM became dust-like and was moved through to the condensation system towards the end of the experiment. Interestingly, the TN loss was similar in both experiments as there was no variation in TN loss throughout the length of the chamber. Therefore, there was a benefit for operating the NRP for the shorter duration to remove the same amount of TN without using additional energy and water, unless a drier CM is required, for example, for long-term storage.
The quantity of TN removed was lower than the quantity of ammonium (g) recovered in the condensation system. This anomaly is due to several reasons. The CM was freeze-dried to try to retain volatiles prior to TN analyses. There is a possibility that these volatiles were still lost during freeze-drying, underestimating the ammonium concentration in the TN analyses [
16]. Similarly, ammonium could not be analysed effectively in fresh CM. This was due to the heterogenic nature of the fresh CM, producing repeatable, but varied ammonium concentrations. Fresh CM ammonium concentrations varied from 109 to 297 mg/kg TS (average 183 mg/kg TS). Therefore, the ammonium concentration in fresh CM could not be accurately determined and used in the ammonium loss calculations. This was not a problem with both NRP-treated CM samples, as they were homogeneous, producing minimal variation in the replicated ammonium analyses. One further complication of the NRP system was that a solid, white precipitate developed in the condensation system in subsequent tests. This white precipitate was analysed as sodium chloride or hydroxide and was formed due to the high mineral content of the condensate water.
A comparison of the efficiency of the NRP with other nitrogen removal technologies is hard to determine, as other technologies are based on analysis of liquid digestates for which ammonia can be accurately quantified. As ammonia analyses of solid CM were varied, a true comparison is difficult. Nitrogen removal efficiencies from CM during this experiment varied from 14.3% TN removal for the Long-test compared to 16.7% TN removal for the Short-test. This TN removal efficiency is similar to using ammonium stripping technology with biogas as the carrier gas, which removed 16% TN [
4]. Further experiments demonstrated that this TN removal efficiency could be increased by altering the carrier gas, as flue gas removed 45% TN and air removed 86% TN [
4]. There has been a range of other research works undertaken using ammonium stripping on liquid digestates that have produced varied results. A two-stage AD process with ammonium stripping demonstrated 90% TN removal and 77% ammonium removal over a 3.6-day period [
17]. Ammonium removal efficiencies from digestate have varied from 13.7 to 28.8% per day depending on the process temperature (35–70 °C) when ammonium stripping was undertaken in a semi-continuous process over a two-day period [
7]. To achieve higher ammonium removal efficiencies, digestate stripping over a four-day period at 55 °C at pH 8–9 demonstrated an 82% removal rate [
18]. Ammonium gas stripping technologies use the premise of increasing the pH and temperature of the digestate to promote ammonium removal and, as a consequence, carbon dioxide removal. As ammonium is removed, the pH of the digestate decreases as carbon dioxide is simultaneously removed. Carbon dioxide removal causes an increase in the pH again, aiding greater nitrogen removal and the ammonium/carbon dioxide removal cycle continues [
4]. The removal of carbon dioxide would not have occurred during the NRP as carbon dioxide was not present within the CM, limiting ammonium removal rates when comparing the NRP technology to other liquid ammonium stripping technologies. Another study researched the pre-treatment of CM for ammonium removal prior to AD. CM was mixed with water to form a slurry and then heated to 70 °C, at pH 10 for two days. The ammonium removal rate was 16% [
7]; this is lower than other ammonium stripping technologies described above which were undertaken with digestate and would have benefited from the removal of carbon dioxide alongside ammonium, increasing the ammonium stripping efficiency.
Many papers presented ammonium removal from liquid digestates [
5,
7,
18] instead of TN removal, although an energy model for the economics of these high-input technologies was not presented. Ammonium represents a proportion of the TN concentration, with ammonia representing a proportion of the ammonium concentration [
5]. The presented ammonium removal efficiencies for other technologies may appear to be higher than the TN removal from the NRP, however caution should be taken in making direct comparisons as ammonium only represents a proportion of TN.
To achieve these higher ammonium removal efficiencies, ammonium stripping technologies have to be operated with high levels of inputs (chemicals, energy and time) to achieve these results. Previously, ammonium stripping pig slurry at 80 °C achieved an ammonium reduction of 80–90%, however it was considered too difficult and expensive to be undertaken at commercial scale [
19]. One advantage of the NRP is that it is recovering ammonium from a solid material, compared to larger quantities of liquid digestate that would require a greater energy input. Additionally, the NRP is operated over a far shorter time period (2–4 h) and it is anticipated that the technology would require a lower level of inputs. To optimise ammonium removal from feedstocks prior to AD, feedstocks should contain a high percentage of ammonium within the TN concentration [
20]. Further research is required to quantity the levels of inputs needed by the NRP technology as it is redesigned from a batch pilot-scale technology to a continuous flow commercial-scale technology. During this redesign, consideration should be given to improving the efficiency of recirculating water use within the condensation system and developing more effective heating and mixing throughout the chamber.
For the BMP experiment, most of the treatment methane yields were similar (178–209 mL/gVS fed) to other BMP published values for fresh CM of 259 mL/gVS fed [
21]. Treatment PL 8:1 produced a significantly lower yield to the other treatments of 132.5 mL/gVS fed. However, the cellulose control did not produce as much methane as expected (259 mL/gVS fed compared to the standard of 350–380 mL/gVS fed) [
22], which may have been due to a poor microbial inoculum source [
21]. Therefore, the treatment methane yields could have been higher than observed if digested with a more robust inoculum.
The significantly highest methane yield was achieved from treatment PS 2:1. Interestingly, the total biogas and methane yields did not significantly increase with increased loading rate. This demonstrates that biogas yield inhibition occurred at the highest loading rates (2:1) for feedstocks Fresh and PL, as these feedstocks were not effectively utilised and converted to increased biogas yields. However, this inhibition did not occur for treatment PS 2:1. Overall, it should be noted that the use of the NRP did not reflect in large changes in total biogas (no significance) and methane yields (some significance) between treatments. Many of the NRP-treated CM treatments produced similar (PL 2:1 and PL 4:1) and lower methane yields (PS 4:1, PS 8:1 and PL 8:1), compared to Fresh CM. This was a surprising result. As the NRP has volatilised nitrogen, other volatile components and moisture had also been lost from the CM. This may have reduced the digestibility of the CM, as noted by the statistically similar total biogas yields across all treatments of the BMP assay. A similar reduction in methane yield was noted when side-stream ammonium stripping was used during the digestion of CM. The side-stream ammonium stripping was effective at removing ammonium, but the increased temperature and pH of the process altered the digester operating conditions and microbial enzyme activity, reducing methane yield [
7]. The significantly higher hydrogen sulphide yields for treatments PS and 2:1 separately suggest that the sulphur contained within the CM was converted to hydrogen sulphide more efficiently. The hydrogen sulphide yields noted in this experiment were low compared to many commercial AD plants. If longer-term continuous digestion trials were undertaken and a similar change in hydrogen sulphide yields were noted for NRP CM, then this could have commercial relevance depending on the level of hydrogen sulphide produced. A high level of hydrogen sulphide within the biogas can cause engine corrosion [
23], although the yields are low in comparison to commercially operated AD plants.
Across all treatments, there was no practical change in pH by the end of the experiment. There was a significant variation in ammonium concentration between treatments, but this was also not of practical relevance as all treatments produced similar concentrations (1.49–1.58 g/L). Although the ammonium levels were high, they were within the known concentrations for mesophilic digestion [
6]. However, as the ammonium concentration could not be determined in the solid CM at the start of the experiment, some treatments may have received a higher concentration than others, for example, the Fresh treatment, as results from the NRP suggest that ammonium was recovered in the condensation system. Interestingly, the difference in ammonium concentrations did not increase linearly with increasing loading rates. This would suggest that an increased rate of ammonium conversion to ammonia occurred at the higher loading rates. If the BMP assays were extended to continuous digester experiments, this may have had a significant longer-term digester stability effect as accumulation of ammonium was not occurring at the higher loading rates leading to methanogenic inhibition.
All experiments lost TN during the BMP assay, with the Fresh treatment receiving the most TN at the start of the experiment and having the greatest concentration by the end of the experiment. This loss of TN can be attributed to microbial degradation and conversion of nitrogen to ammonia gas [
24]. As there was not a significant change in treatment pH, this would suggest that some of the TN was converted to soluble ammonia to counterbalance an increase in VFA production for some treatments [
5]. The variation in TN loss across treatments was more variable for loading rate compared to pre-treatment methodology. TN loss was greatest at loading rate 2:1, which would suggest that this treatment was able to liberate nitrogen as ammonia gas and inhibition of the methanogens did not occur.
BMP assays are limited in their scope to assess initial methane yield from one batch-fed experiment. Initial inhibition (if significant) can be determined, but longer-term continuously fed AD experiments are required to see if the methane yield can be improved from the digestion of CM pre-treated using the NRP compared to fresh CM. AD plants gradually see inhibition occurring due to increasing ammonium concentrations from digesting CM [
4] and longer-term experiments would determine this. Further, the digestibility of the NRP-treated CM could also be ascertained as well as if microbes can adapt to this new feedstock. The results to date demonstrate the potential in using the NRP to recover nitrogen from fresh layers’ CM for further valorisation and that the NRP-treated CM does anaerobically digest. Further commercial implications on achieving a longer-term methane yield and/or increased loading rate of NRP-treated CM into AD plants require further research.


