Article

Examining Spatial Association of Air Pollution and Suicide Rate Using Spatial Regression Models

1
School of Geography and Planning, Sun Yat-sen University, Guangzhou 510275, China
2
Department of Geography, College of Science, Swansea University, Swansea SA28PP, UK
3
Faculty of Architecture, The University of Hong Kong, Hong Kong, China
4
Zhou Enlai School of Government, Nankai University, Tianjin 300350, China
5
Computational Social Science Laboratory, Nankai University, Tianjin 300350, China
*
Author to whom correspondence should be addressed.
Sustainability 2020, 12(18), 7444; https://doi.org/10.3390/su12187444
Submission received: 31 July 2020 / Revised: 25 August 2020 / Accepted: 1 September 2020 / Published: 10 September 2020
(This article belongs to the Section Sustainability in Geographic Science)

Abstract

:
Air pollution can have adverse impacts on both the physical health and mental health of people. Increasing air pollution levels are likely to increase suicide rates, although the causal mechanisms underlying the relationship between pollution exposure and suicidal behaviour are not well understood. In this study, we aimed to further examine the spatial association of air pollution and suicidal behaviour. Specifically, we investigated whether or how PM2.5 levels are spatially associated with the adult suicide rates at the district level across London. As the data used are geospatial data, we used two newly developed specifications of spatial regression models to investigate the spatial association of PM2.5 levels and suicide. The empirical results show that PM2.5 levels are spatially associated with the suicide rates across London. The two models show that PM2.5 levels have a positive association with adult suicide rates over space. An area with a high percentage of White people or a low median household income is likely to suffer from a high suicide rate.

1. Introduction

A number of studies have revealed the negative effects of air pollution on health outcomes [1,2,3,4]. A recent study uncovered that air pollution can have adverse impacts on both the physical and mental health of people [5]. In recent years, a few studies uncovered that increasing air pollution levels are likely to increase violent crime rates [5,6], although the causal mechanisms underlying the relationship between pollution exposure and aggressive behaviour are not well understood [6]. We are interested in whether air pollution affects other human behavior like suicide.
Suicide is affected by socioeconomic and environmental factors [7,8,9,10,11]. On the one hand, some studies examined the social determinants of suicide [7,8]. Using the data of 25 European Union countries, Ferretti and Coluccia examined the relationship between suicide rates and socioeconomic factors, such as demography, economic development, education, healthcare systems, living conditions, and the labour market [7]. They found that countries with high suicide rate levels are linked to high levels of at-risk-of-poverty rates, high annual growth rates for industry and low healthcare expenditures. Andrés et al. investigated the social effects on suicide in Japan between 1957 and 2009. They uncovered that divorce showed the highest association with suicide, particularly for men [12]. Machado et al. used panel data from all 5507 Brazilian municipalities from 2000 to 2011 to investigate the impact of socioeconomic determinants on suicide rates [8]. They found that, of the social determinants, income was found to have a significant negative association with suicide rate, whereas a low-level education had a positive association [8].
One the other hand, quality of physical environment is found to be associated with suicidal behavior [9,11,13]. Helbich et al. investigated the associations of green space exposure (e.g., exposure to parks, gardens, trees, or grass), blue space exposure (e.g., exposure to rivers, lakes, canals, or ponds), coastal proximity, and suicide risks using municipal-level suicide data between 2005 and 2014 in the Netherlands [14]. They found that municipalities with a large proportion of green space are linked to a reduced suicide risk compared with municipalities with less green space [14]. Moreover, water quality is found to be associated with suicidal behavior [9,10,11]. Helbich et al. found that the lithium levels in drinking water are spatially linked with suicide mortality in Austria [9]. There are a few studies examining the association of lithium levels in drinking water and suicide in other European places, like Italy and Greece [10,11]. Vita et al. summarised the existing studies and concluded that higher lithium levels in drinking water may be associated with a reduced risk of suicide in the general population [15]. Apart from lithium levels in drinking water, arsenic levels in drinking water are found to be associated with suicide mortality, although the two studies derived inverse findings [13,16].
In recent years, some scholars attempted to examine the association of air pollution and suicide [17,18,19,20,21,22,23,24,25,26]. Szyszkowicz et al. examined the effects of ambient air pollution on emergency department (ED) visits for suicide attempts in Vancouver, Canada, and found positive and statistically significant associations among carbon monoxide (CO), nitrogen dioxide (NO2), sulphur dioxide (SO2), and particulate matter (PM10) for all suicide attempts in the cold period [18]. Yang et al. examined the temporal relationship between suicide and air pollution, weather, and unemployment variables from 1991 to 2008 in Taipei City. They found that SO2 and ozone could increase the risk of suicide at longer time scales [19]. Kim et al. undertook a detailed meta-analysis of completed suicides in relation to five major pollutants over six years in the 16 administrative regions of the Republic of Korea, controlling for socioeconomic and weather influences on suicide rates [20]. They found that ozone and PM10 are significantly related to suicide rates. Bakian et al. identified an increased risk of suicide associated with acute exposure to NO2 and PM2.5 during the days preceding suicide in Salt Lake County, Utah [21]. To examine the relation between the level of air pollution and suicide mortality, Ng et al. used suicide mortality data for Tokyo for the 11-year period from 2001 to 2011, and found that positive associations were observed for the four air pollutants (PM2.5, suspended particulate matter, SO2, and NO2) in the summer although associations were reversed in autumn [24]. Moreover, some studies further examined the association of air pollution and suicide for different population groups. Casas et al. investigated the association between short-term variation in air pollution and 10 years of suicide mortality from 2002 to 2011 in Belgium [23]. They found that increases in outdoor air pollutants such as PM10 or ozone can trigger suicide, particularly during warm periods, and PM10 may have strong trigger effects among children and the elderly population. Min et al. found that adults exposed to high air pollution had an increased likelihood of suicide death in South Korea, and people with underlying diseases or living in metropolitan areas may be more susceptible to high air pollution exposure [25]. Lee et al. found that air pollution exposure increased the risk of suicide in 26 South Korean cities, and the effect was greater in elderly, lowly educated, white-collar, and married people [26].
Although previous studies had offered evidence on the association of air pollution and suicide, more empirical studies are needed to offer additional evidence from different perspectives. First, previous studies [18,19,20,21,22,23,24,25,26] focused on whether and how air pollution is temporally associated with suicide; whether and how air pollution is spatially associated with suicide is not adequately examined. Second, previous empirical studies [19,20,24,25,26] focused mostly on Asian cities while not much is known about cities in other regions. Third, while previous studies [18,19,20,21,24,25,26] are conducted at the city level, empirical studies at a finer scale are needed to better examine the association of air pollution levels and suicide rates as sometimes air pollution levels vary a great deal across a city.
To bridge the research gaps, we aimed to investigate whether or how PM2.5 levels are spatially associated with the adult suicide rates at the local scale across London. Specifically, we investigated the association of PM2.5 levels and the suicide rates, controlling for socioeconomic factors. As the data used are geospatial data, we used a spatial regression model to investigate the association of PM2.5 and suicide. Moreover, two newly developed specifications of spatial regression models were estimated: ‘matrix exponential spatial specification of spatial autoregressive model’ and ‘random effects specification of eigenvector spatial filtering model’. As a consequence, a positive association between PM2.5 levels and the suicide rates is empirically found across London.

2. Materials and Methods

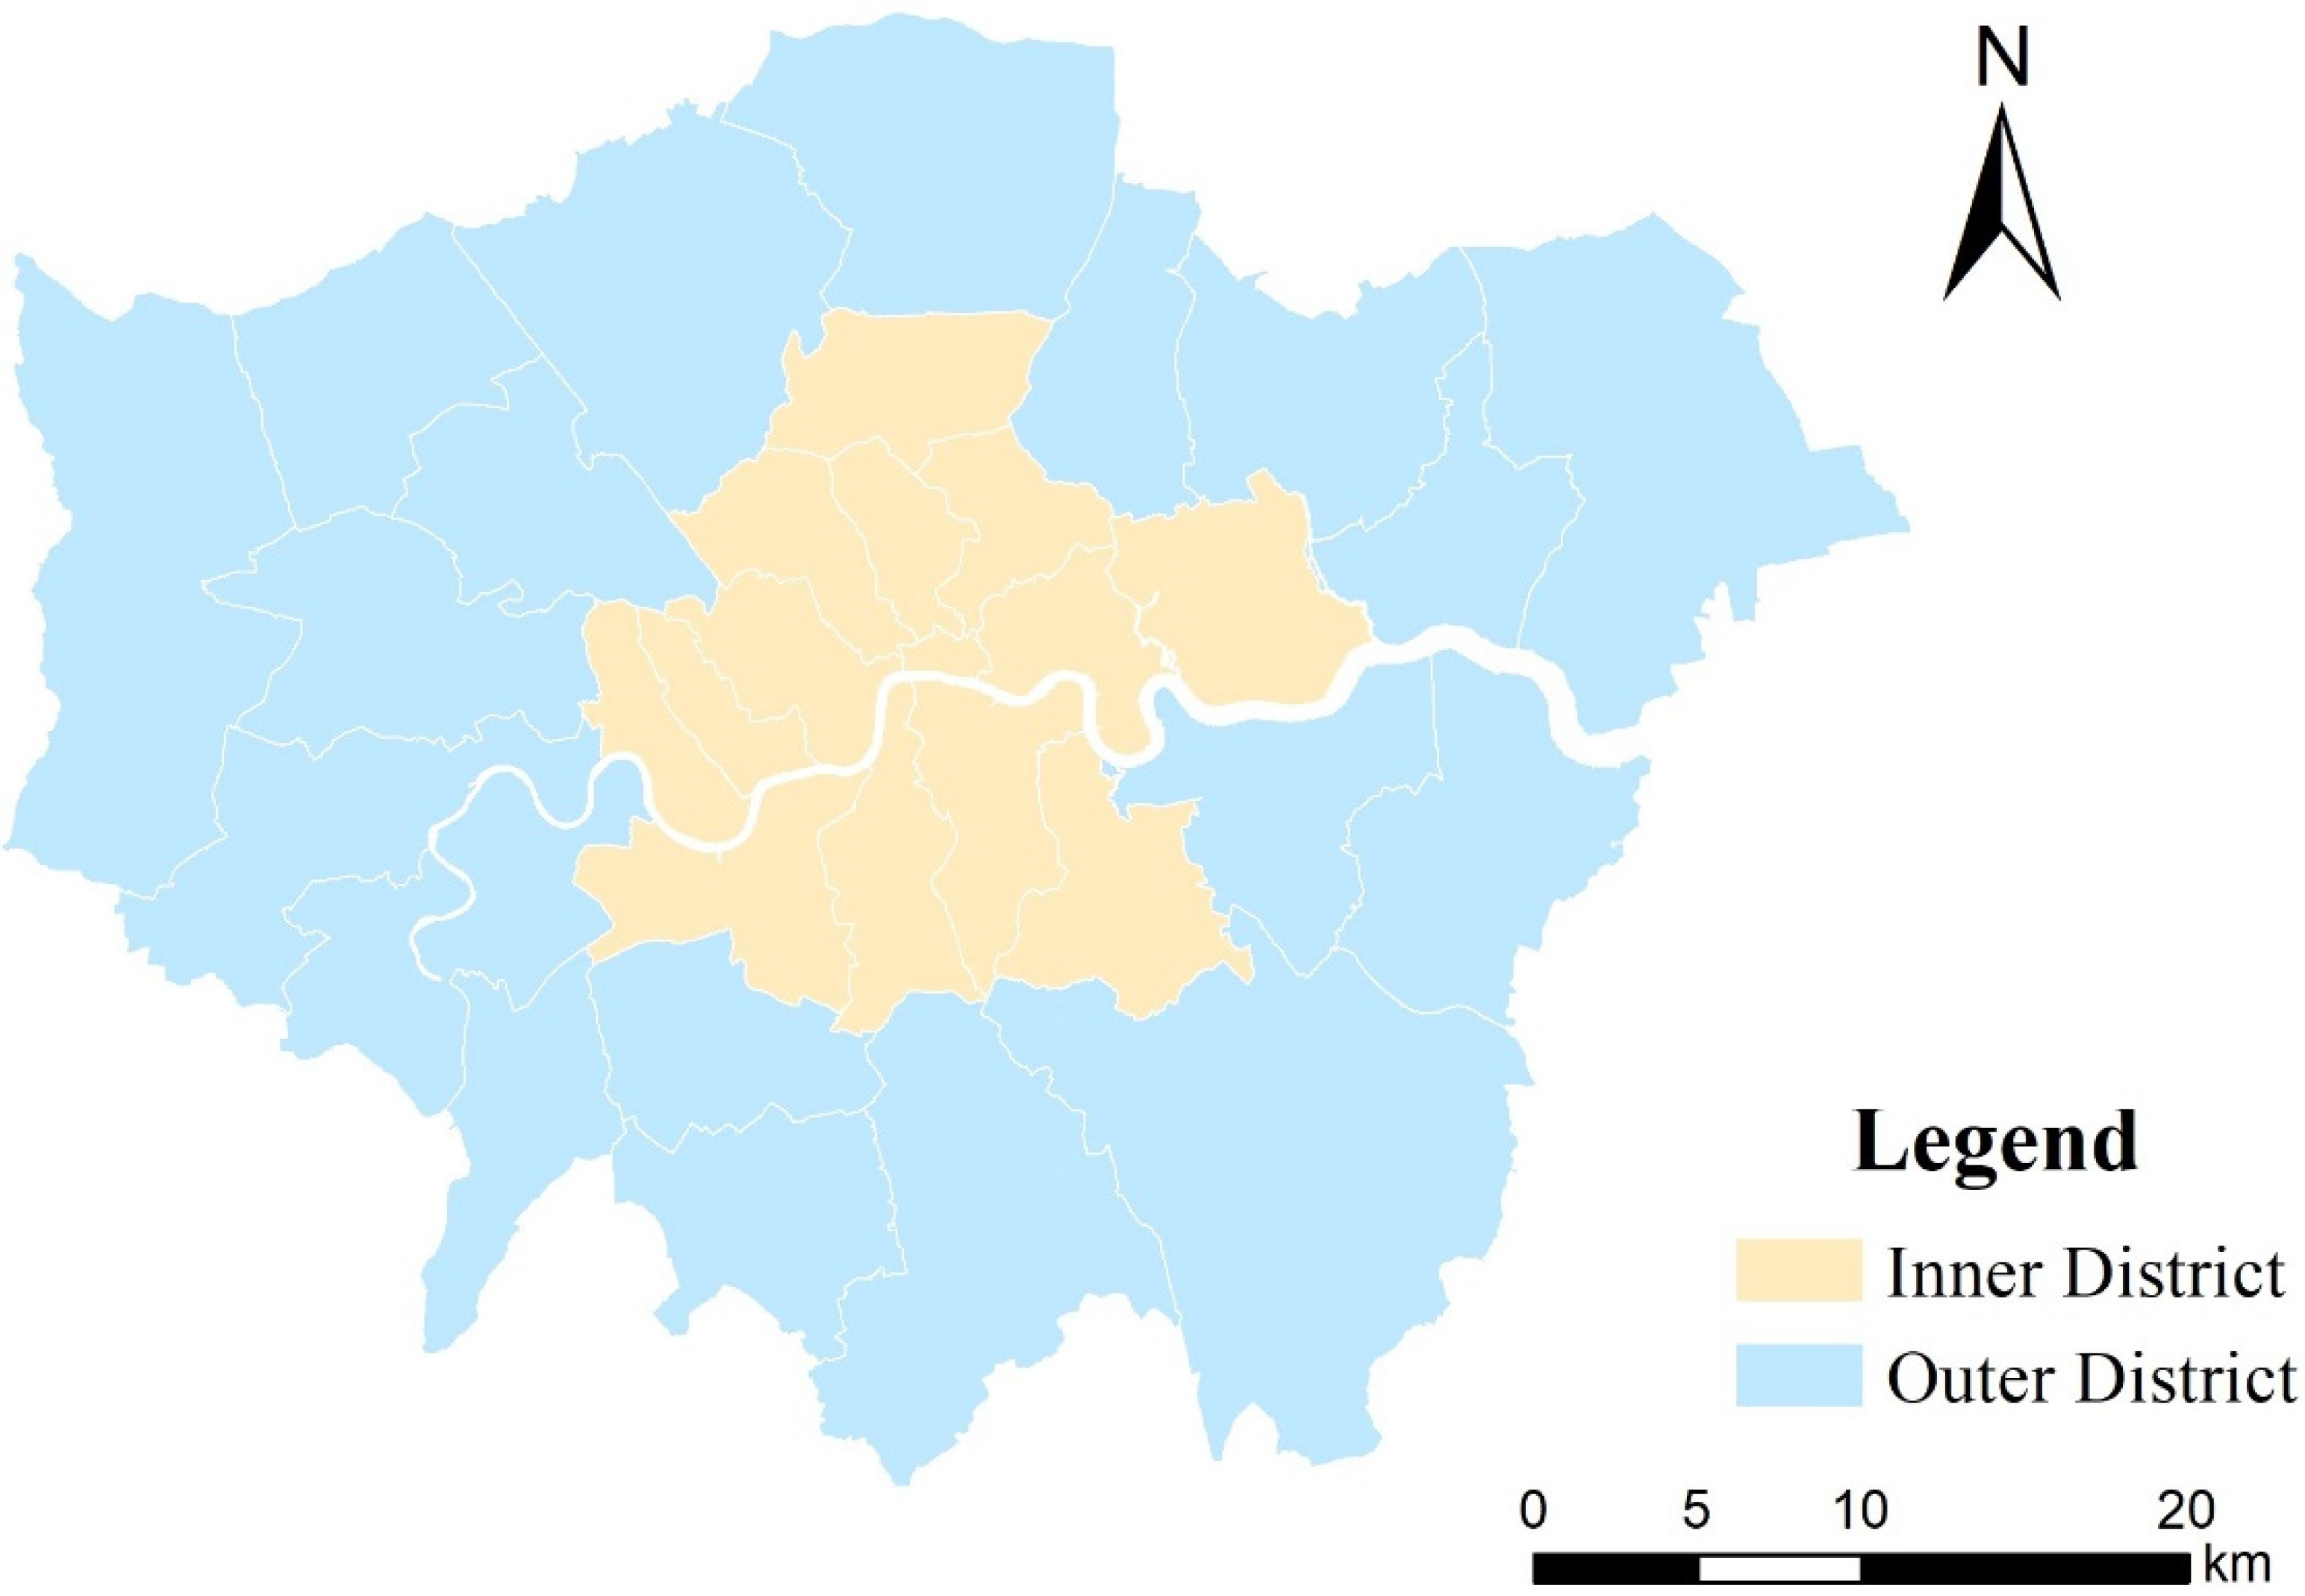
2.1. Case Study and Data

In this study, we focus on adult suicide rates across Greater London. Greater London, also called London region, consists of 33 districts (local authority districts, LADs), including the City of London and 32 boroughs. Of these 14 around and including the City of London are inner districts, and the other 19 are outer districts (see Figure 1). It is noted that one district (City of London) is excluded in this study as it has a relatively small number of households (see the grey area in Figure 2 and Figure 3). The historical suicide data were produced by UK’s Department of Health. London Datastore reproduced and shared the data after aggregating suicide cases into boroughs of London (https://data.london.gov.uk/dataset/suicide-mortality-rates-borough). Figure 2 maps the average annual rate of adult suicide (per 100,000 persons) from 2011 to 2015 at the district level across Greater London. The population, income, unemployment, qualification, and jobs data were produced by UK’s Office for National Statistics (ONS). London Datastore selects London’s data and shares them (https://data.london.gov.uk/). Air pollution data were downloaded from Defra (https://uk-air.defra.gov.uk/data/pcm-data). Defra aggregated the background pollution maps into borough levels after adjusting for population (see Figure 3). The background pollution maps at 1 × 1 km resolution are modelled each year under Defra’s Modelling of Ambient Air Quality (MAAQ) contract.
Additionally, we list both suicide rates and PM2.5 levels in the 32 districts simultaneously (see Table 1). High values of suicide rate and PM2.5 level are likely to co-occur in inner districts, e.g., Westminster and Islington, while low values of suicide rate and PM2.5 level are likely to co-occur in outer districts, e.g., Harrow and Enfield.

2.2. Air pollution Level and Confounding Factors

We took account of demographic factors as confounding factors. Table 2 lists the explanatory and response variables in this study. Here, suicide rate is represented by directly age-standardised rate of suicides per 100,000 persons, aged 15 and over. As the district-level suicide rate differs largely from one year to another, we averaged 5-year data and used the average suicide rate in the 5-year period (2010–2014) as the responding variable. Table 2 also shows descriptive statistics of variables used in this study.

2.3. Estimate Models

As geospatial data are used to estimate models in this study, spatial regression models are used instead of non-spatial regression models, e.g., ordinary least squares (OLS) models. In this study, we select two newly developed specifications of spatial regression models. One is a spatial autoregressive (SAR) model and the other is an eigenvector spatial filtering (ESF) model. Specifically, we will use two specifications of spatial regression models: matrix exponential spatial specification of spatial autoregressive model (MESS-SAR model) and random effects specification of eigenvector spatial filtering model (RES-ESF model).
Spatial autoregressive model (MESS-SAR model): The matrix exponential spatial specification (MESS) model has analytical, computational, and interpretive advantages over conventional spatial autoregressive models [27]. Additionally, the MESS-SAR model produces R2 values which are direct measures of the explanation capacity of the model while conventional spatial regression models do not. The coefficients estimated in the MESS-SAR model are usually similar to those in OLS models, but residual spatial correlation is much lower [27,28].
Eigenvector spatial filtering model (RES-ESF model): Compared to spatial autoregressive models estimated based on parametric estimation methods (e.g., maximum likelihood estimation or Bayesian estimation), eigenvector spatial filtering is computer intensive since it is a nonparametric statistical method which is distribution free without sacrificing too much information in a sample [29]. Although eigenvector spatial filtering (ESF) models are computationally demanding, they are likely to outperform spatial autoregressive (SAR) models in the applications of urban and regional studies, ecological studies, and so on [30]. Furthermore, a random effects specification of ESF (RES-ESF) had been developed because of its usefulness for spatial dependence analysis considering spatial confounding [31]. The RES-ESF model is found to outperform the conventional ESF model [30,31]. Besides, the RES-ESF model produces R2 values as well.

3. Empirical Analysis

In this section, we demonstrate and discuss the empirical results. Here we demonstrate the model estimation results and discuss the contributions of explanatory variables. The estimates of all the models used in this study were implemented in R. Specifically, the MESS-SAR models and RES-ESF models are estimated using the package ‘spatialreg’ and ‘spmoran’ respectively.

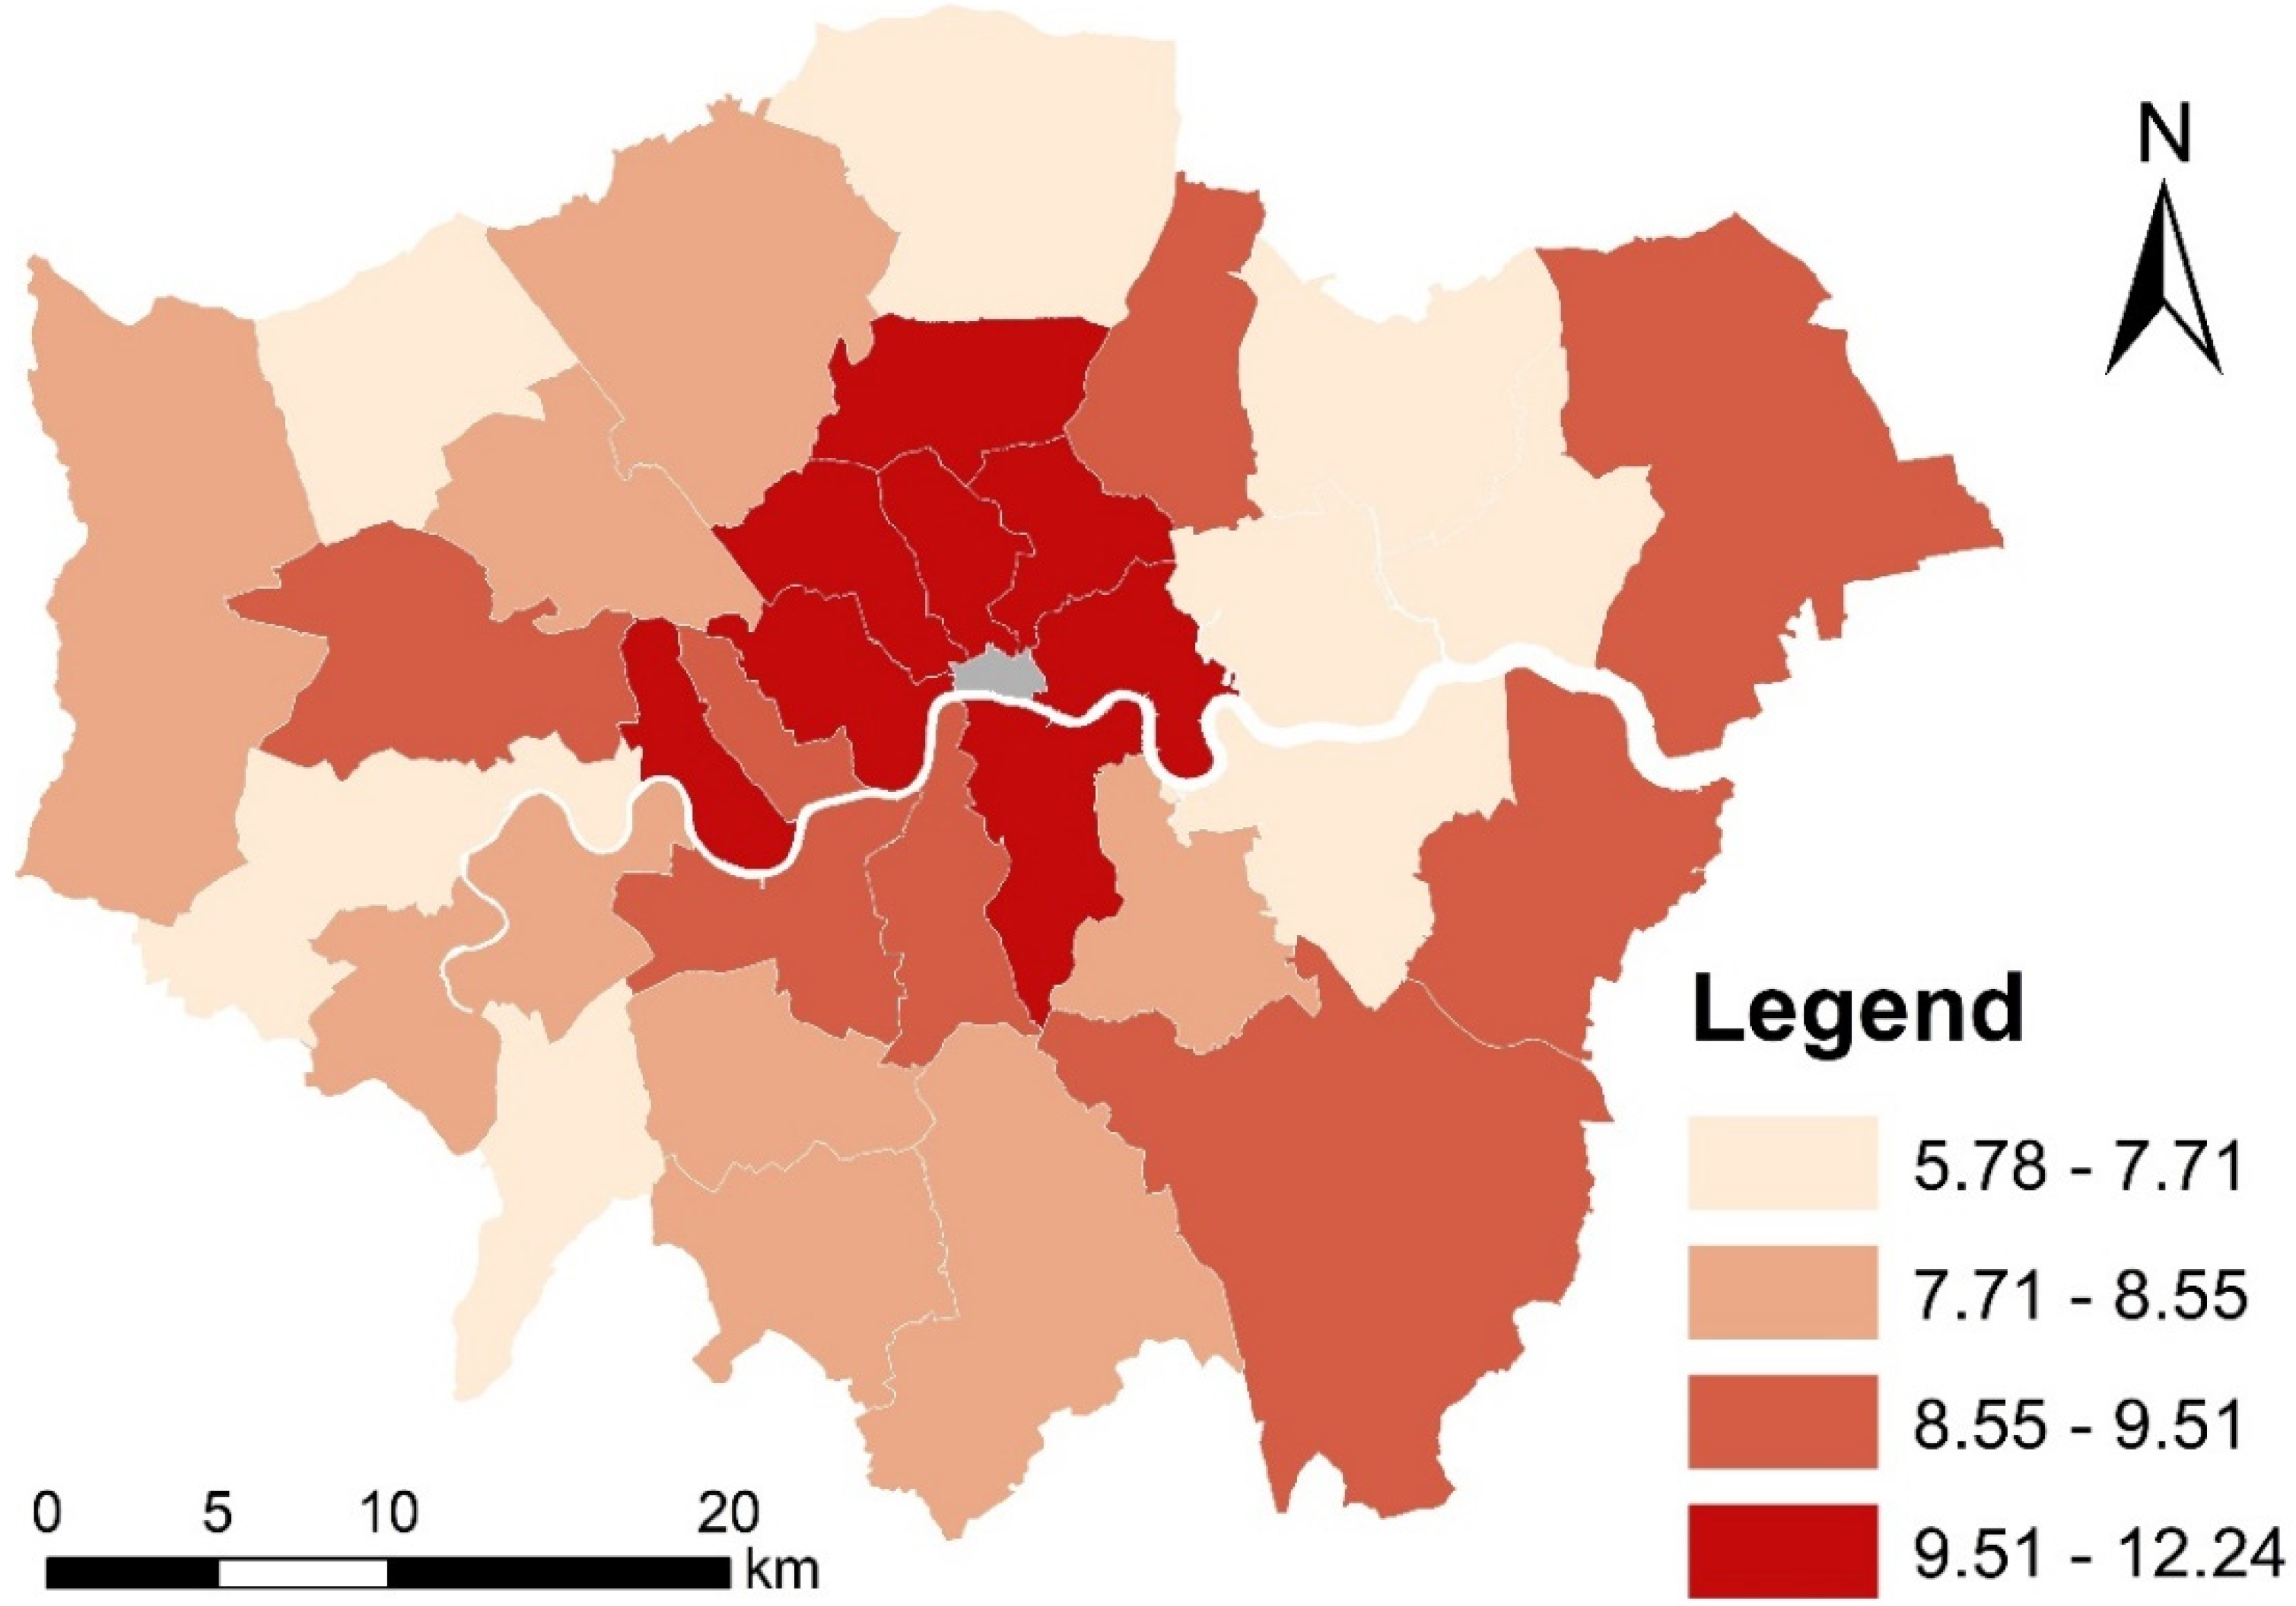
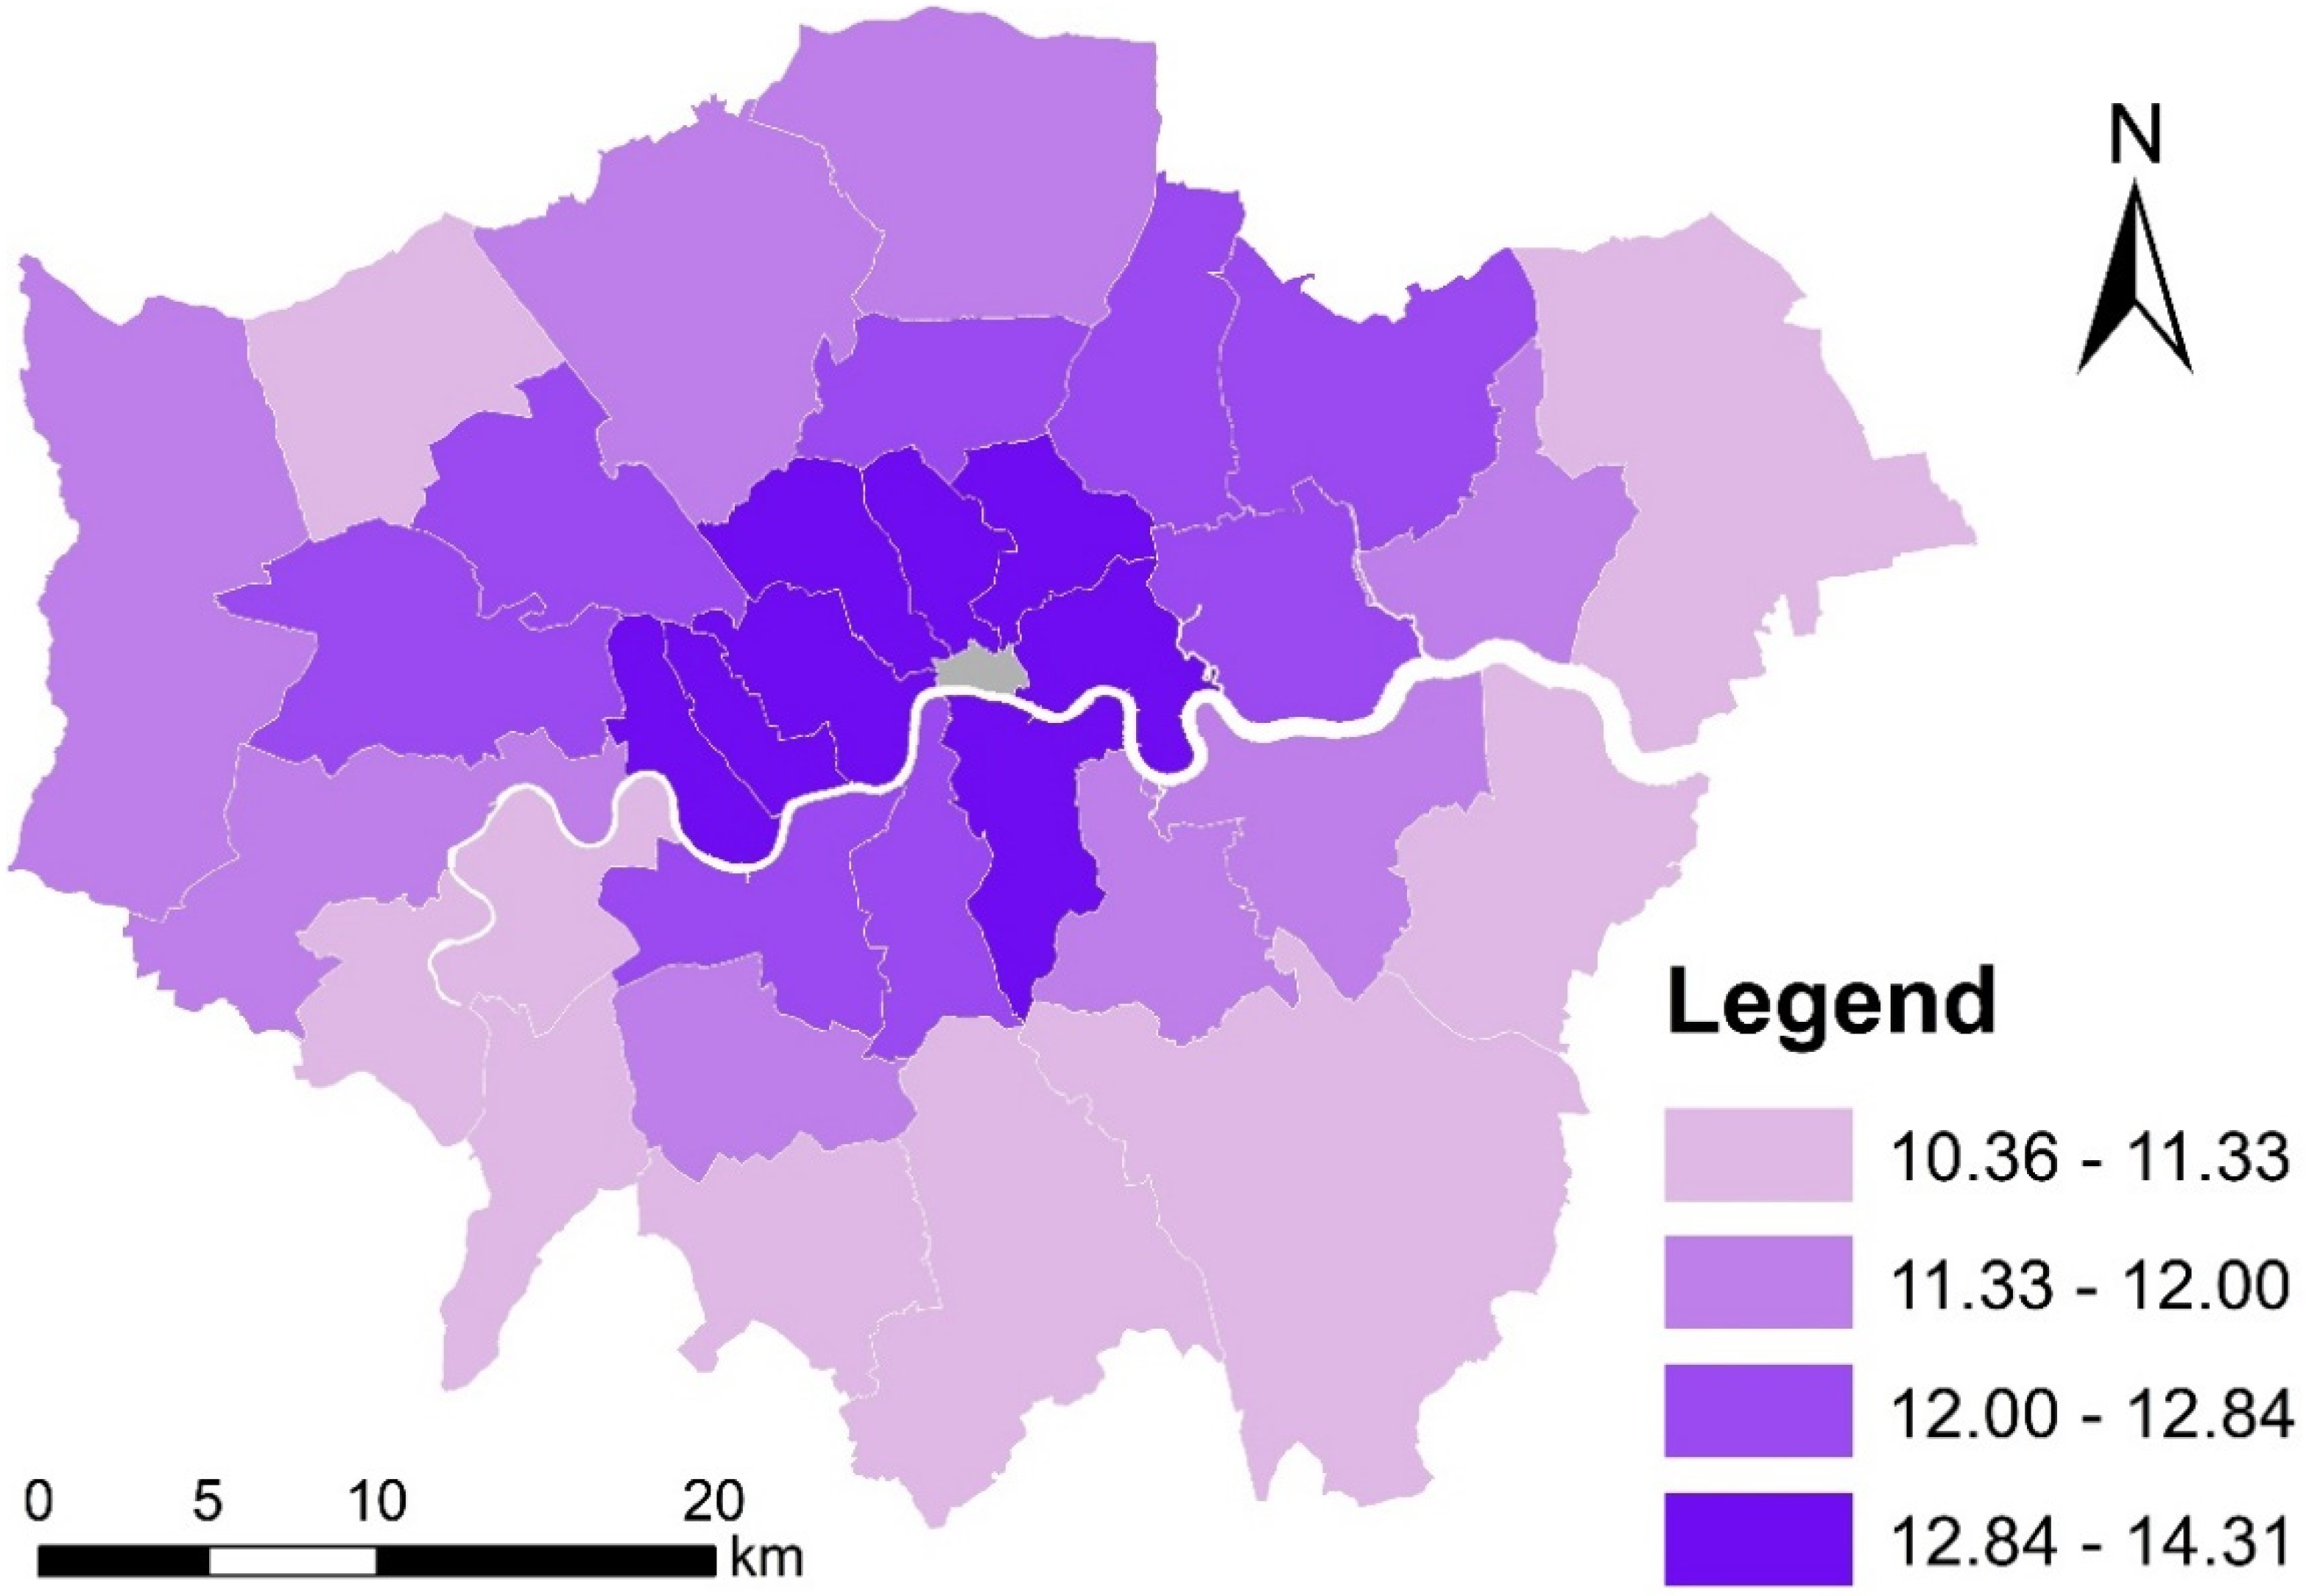
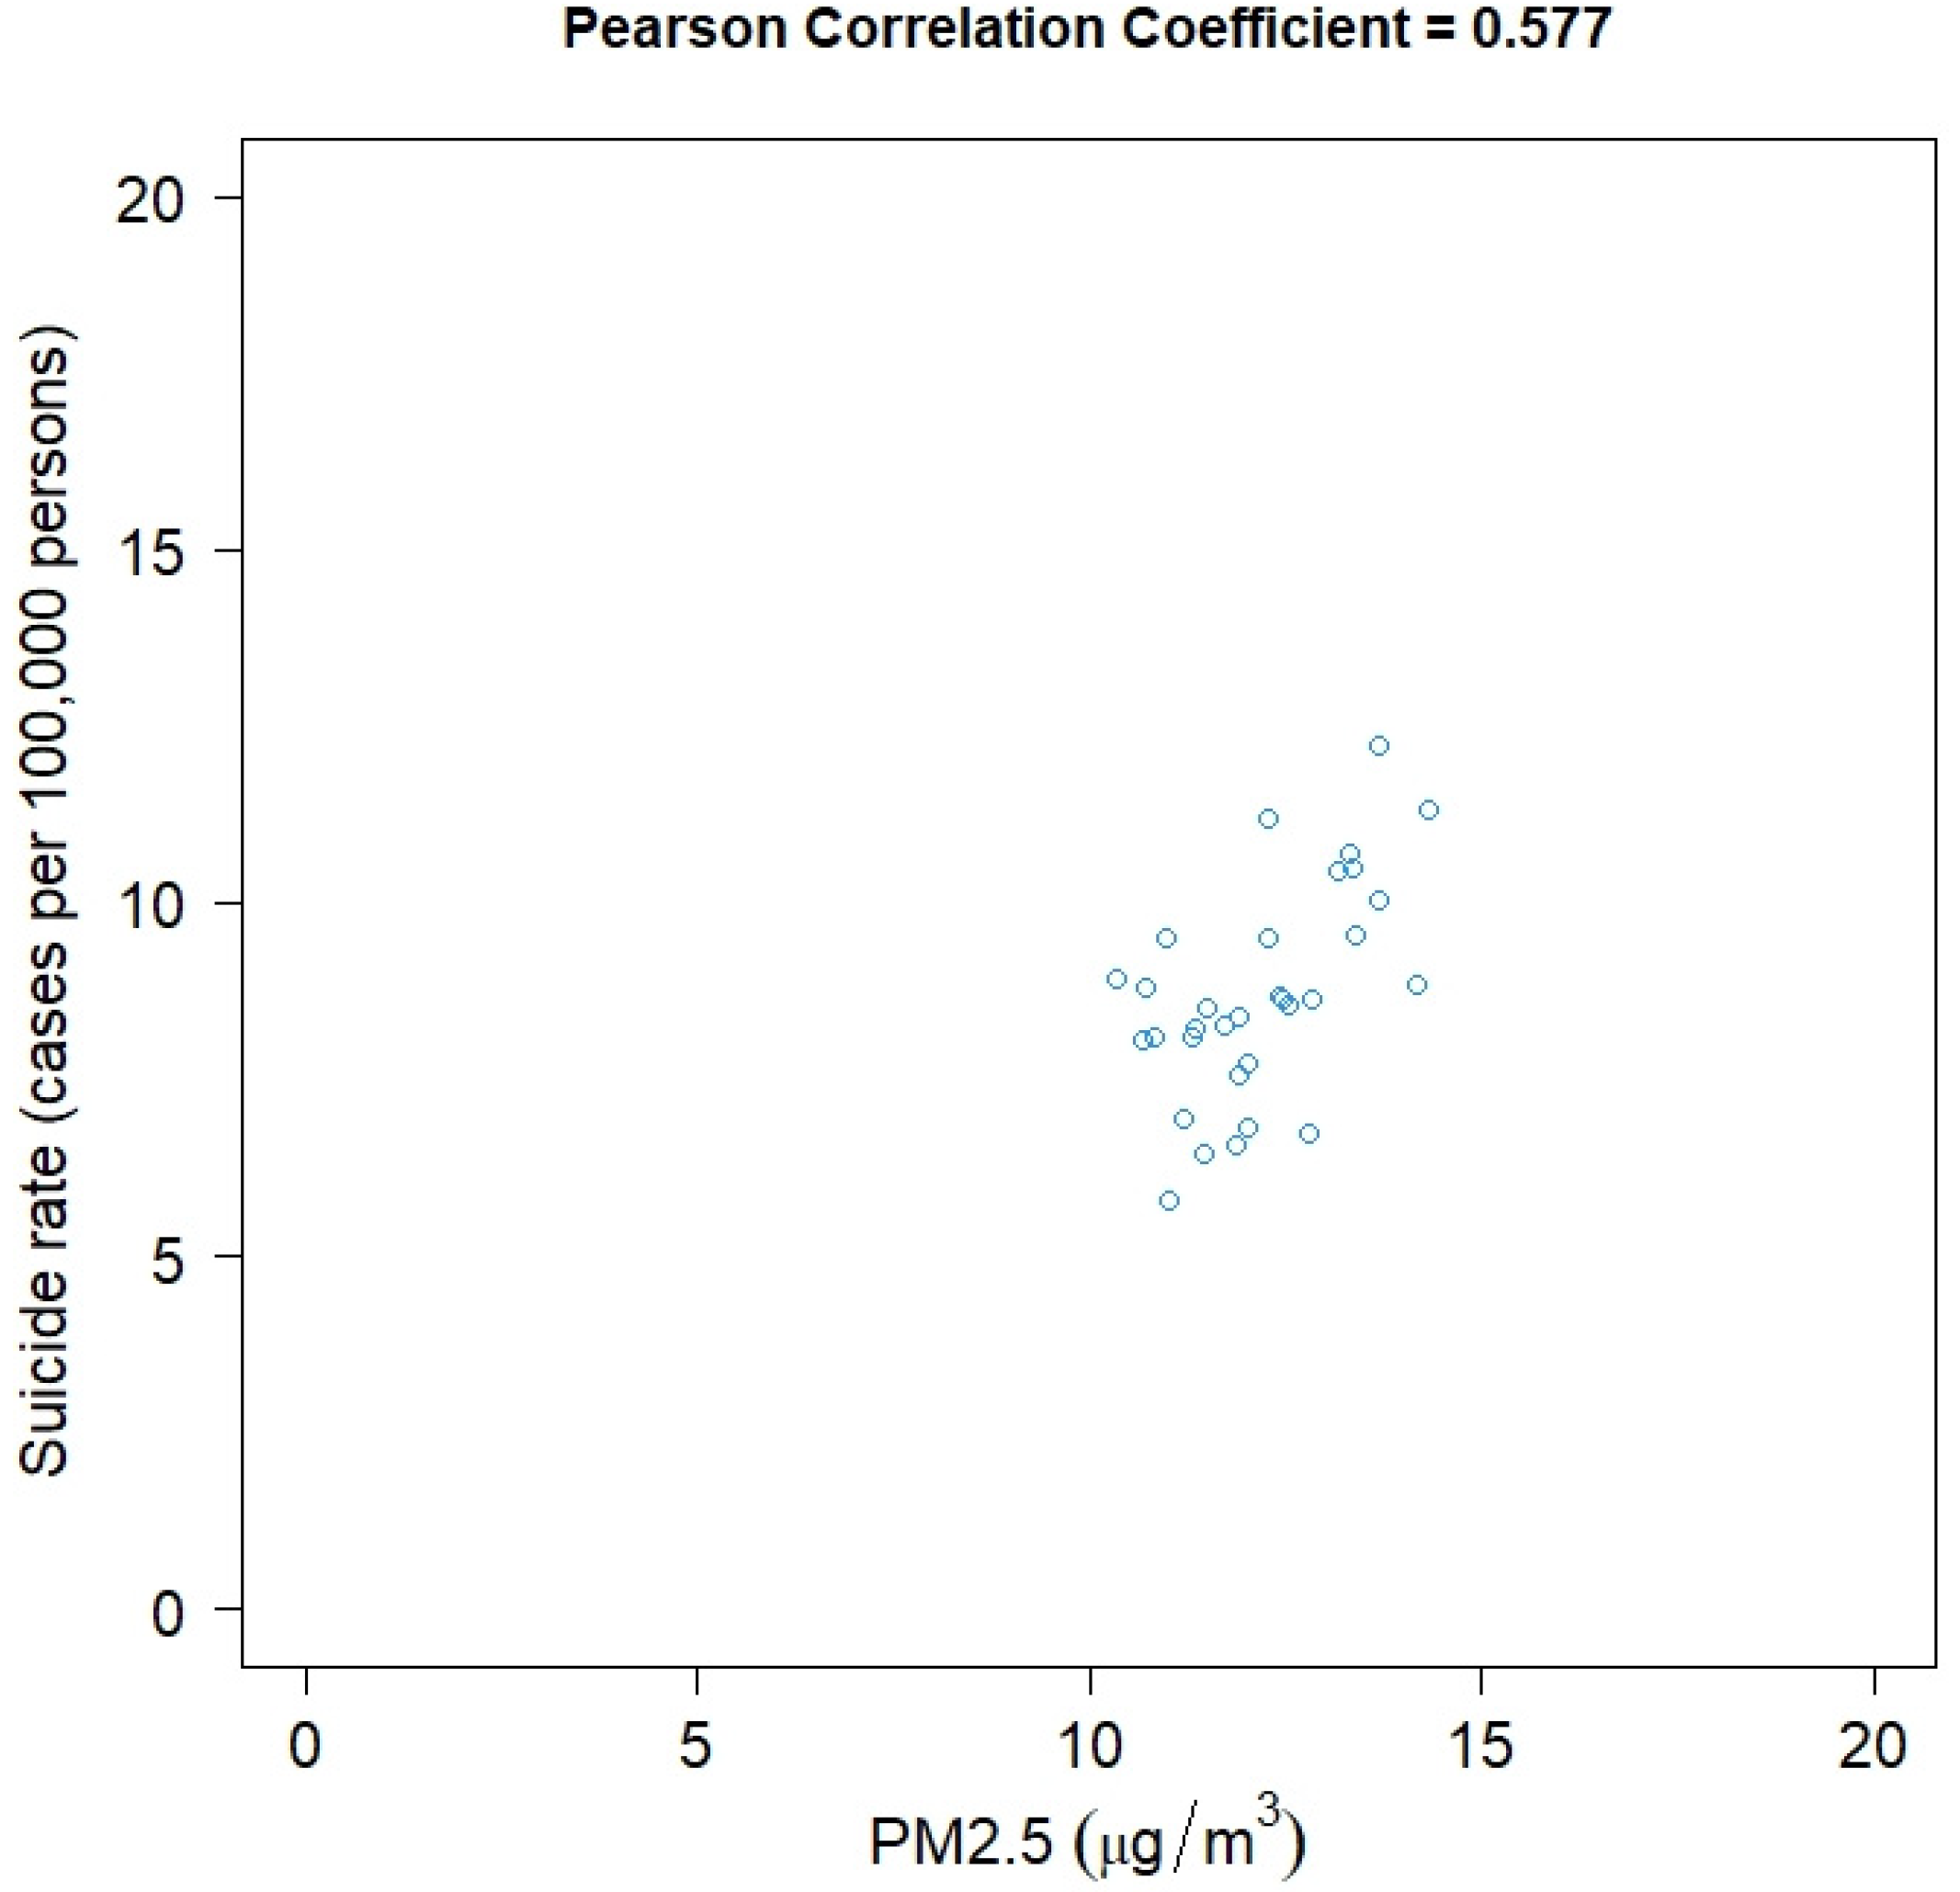
3.1. Correlation of Suicide Rate and PM2.5 Level

First of all, we performed a correlation analysis to explore the potential relationship of PM2.5 levels and the suicide rates. Figure 4 shows the Pearson’s correlation coefficient (Pearson’s R value) of PM2.5 levels and suicide rates. The Pearson’s R value is 0.577, indicating PM2.5 level seems to be positively related to suicide rate across Greater London.

3.2. Association of PM2.5 Level and Suicide Rate, Controlling for Socioeconomic Factors

We further investigated the association of PM2.5 levels and suicide rates, controlling for socioeconomic factors. As one district (City of London) is excluded in this study, 32 observations (32 districts) were used to estimate the MESS-SAR and RES-ESF model. Table 3 shows estimation results for the MESS-SAR and RES-ESF models estimated. The R2 values of the MESS-SAR and RES-ESF models are 0.600 and 0.469 respectively. The MESS-SAR model appears to outperform the RES-ESF model owing to a lower Akaike information criterion (AIC) value and a higher R2 value. As Table 3 shows, the PM2.5 level has a statistically significant association with suicide rate (i.e., DSRS). PM2.5 level is positively associated with suicide rate. WHT_P and M_INC have statistically significant associations with suicide rate (i.e., DSRS). WHT_P is positively associated with suicide rate, while M_INC is negatively associated with suicide rate. This indicates that an area with a high percentage of White people or a low median household income is likely to suffer from a high suicide rate. These two findings are consistent with previous studies [32,33]. Specifically, based on national suicide data between 1996 and 2001 in England and Wales, Bhui et al. found that classical suicide risk indicators such as suicidal ideas, depressive symptoms, emotional distress, and hopelessness were significantly more common among White British inpatients than other ethnic groups in England and Wales [32]. Based on an adult psychiatric morbidity survey conducted across England (N = 5779 participants), Wetherall et al. found that absolute income was negatively associated with suicidal thoughts across England [33].

3.3. Discussions

In a recent study, using a composite air pollution score by combining six major pollutants: CO, NO2, SO2, total suspended particulate (TSP), PM10, and PM2.5, Lu et al. examined the association of air pollution and crime at the city level across the US from 2001 to 2009 [5]. They found that air pollution is positively associated with a variety of crime categories, including murder, rape, robbery, assault, burglary, and motor vehicle theft. Lu et al. further attempted to explore the underlying mechanisms [5]. Lu et al. identified one mechanism, anxiety, that explains the effects of air pollution on unethical behavior—air pollution heightens anxiety, which in turn increases unethical behaviour [5]. This might be used here to explain how PM2.5 could increase suicidal behavior. In other words, PM2.5 might have an indirect effect on suicidal behaviour. From epidemiologic research, Szyszkowicz et al. inferred that pollutant exposure may be a factor in depression, which could contribute to suicide risks [18]. Szyszkowicz et al. further empirically investigated the associations between ambient air pollution and emergency department (ED) visits for depression [34]. They found that, as hypothesised, there is a positive association between exposure to air pollution and ED visits for depression. Therefore, PM2.5 might have an indirect effect on suicide risks through increasing psychologically negative emotions like anxiety and depression.
Toxicological evidence from experimental animal studies show that exposure to gaseous and particulate air pollutants can cause adverse neurological effects ranging from behavioural changes to neurodegeneration [18]. Szyszkowicz et al. speculated that exposure to air pollution could lead to mental disorders which is considered the main determinant of suicide [18]. To attempt to explain how air pollution impacts suicide, Kim et al. discussed the impact of air pollution on the central nervous system and suggested multiple mechanisms for the effect of air pollution on the central nervous system (CNS) [20]. Particularly, air pollution can affect the immune system and thereby induce behavioral changes through effects on neurotransmitter systems [20]. Besides, ozone or its reaction products could influence the metabolism of serotonin, one of the neurotransmitters associated with aggressive behavior and suicide [20]. Recently, Gładka et al. reviewed experimental, clinical, and epidemiological studies on exposure to PM2.5 and its impact on depression and suicide [22]. Particularly, it is estimated that around 60–80% of all suicide victims suffer from depression, while 15% of patients with severe depression eventually commit suicide [22,35]. PM2.5 was reported to be positively associated with depressive symptoms [36,37]. Therefore, an increasing PM2.5 level is likely to cause an increase in health risks (e.g., depression level) associated with suicide.
Although previous studies explained some potential mechanisms, it might be early to state that decreases in PM2.5 could decrease risks of suicidal behaviour. On the one hand, more empirical studies are needed to further provide more empirical evidence on the association of PM2.5 and suicidal behaviour. On the other hand, more studies from medical and psychological sciences are needed to explain the underlying mechanisms. Particularly, it is of much importance to understand whether the potential effects of PM2.5 on suicide are direct or indirect.

4. Conclusions and Future Work

In this paper, we examined the spatial association of PM2.5 levels and adult suicide rates across Greater London. The empirical results show that PM2.5 levels are spatially associated with suicide rates across London. The two models both show that PM2.5 levels have a positive association with adult suicide rates. An area with a high percentage of White people or a low median household income is likely to suffer from a high suicide rate.
There are some limitations in this study. First, this study focuses on the long-term association of air pollution and suicide. The short-term association might be different or complex, thereby it is worth evaluating as well. Second, since the data used is aggregate data, there might be an ecological fallacy. More specifically, the modifiable areal unit problem (MAUP) often exists in geographical research. The result might change if the areal unit changed. Third, this study accounts only for PM2.5 as the pollutant, while other pollutants are not empirically discussed. Different pollutants might affect suicidal behaviour in different ways.
In the future, additional aspects should be considered. First, we would examine the association at finer spatial and temporal scales if PM2.5 data with high spatial and temporal resolutions could be available in the near future. Studies with finer spatial scales could help to evaluate the influences of MAUP, and studies with finer temporal scales could help to examine the shorter-term association. Second, other air pollutants like SO2, NO2, and ozone would be used as potential influential factors of suicide in the future so as to investigate the associations of other air pollutants and suicidal behaviour. Third, we would attempt to examine the association of PM2.5 and negative emotions, which could help to empirically explain the underlying mechanisms.

Author Contributions

Conceptualization, Y.S., T.O.C., J.X., X.S.; Methodology, Y.S.; Formal analysis and investigation, Y.S.; Writing—original draft preparation, Y.S., T.O.C., J.X., X.S.; Writing—review and editing, Y.S., T.O.C., J.X., X.S., Y.H.; Funding acquisition, Y.S., Y.H.; Resources, Y.S., T.O.C. All authors have read and agreed to the published version of the manuscript.

Funding

This work is supported by the Fundamental Research Funds for the Central Universities (Grant No. 37000-31610453), China; the General Program of Social Science of Tianjin (Grant No. TJGL19-005), China; the Fundamental Research Funds for the Central Universities (Grant No. 63192205), China; and the Fundamental Research Funds for the Central Universities (Grant No. 37000-31610445), China.

Acknowledgments

We are thankful to the anonymous reviewers for their helpful comments.

Conflicts of Interest

The authors declare no conflict of interest.

References

  1. Lipsett, M.J.; Ostro, B.D.; Reynolds, P.; Goldberg, D.; Hertz, A.; Jerrett, M.; Smith, D.F.; Garcia, C.; Chang, E.T.; Bernstein, L. Long-term exposure to air pollution and cardiorespiratory disease in the California teachers study cohort. Am. J. Respir. Crit. Care. Med. 2011, 184, 828–835. [Google Scholar] [CrossRef]
  2. Anderson, J.O.; Thundiyil, J.G.; Stolbach, A. Clearing the air: A review of the effects of particulate matter air pollution on human health. J. Med. Toxicol. 2012, 8, 166–175. [Google Scholar] [CrossRef] [PubMed] [Green Version]
  3. Pope, C.A., III; Turner, M.C.; Burnett, R.T.; Jerrett, M.; Gapstur, S.M.; Diver, W.R.; Krewski, D.; Brook, R.D. Relationships between fine particulate air pollution, cardiometabolic disorders, and cardiovascular mortality. Circ. Res. 2015, 116, 108–115. [Google Scholar] [CrossRef] [PubMed]
  4. Shah, A.S.; Lee, K.K.; McAllister, D.A.; Hunter, A.; Nair, H.; Whiteley, W.; Langrish, J.P.; Newby, D.E.; Mills, N.L. Short term exposure to air pollution and stroke: Systematic review and meta-analysis. BMJ 2015, 350, h1295. [Google Scholar] [CrossRef] [PubMed] [Green Version]
  5. Lu, J.G.; Lee, J.J.; Gino, F.; Galinsky, A.D. Polluted Morality: Air Pollution Predicts Criminal Activity and Unethical Behavior. Psychol. Sci. 2018, 29, 340–355. [Google Scholar] [CrossRef] [PubMed] [Green Version]
  6. Burkhardt, J.; Bayham, J.; Wilson, A.; Berman, J.D.; O’Dell, K.; Ford, B.; Fischer, E.V.; Pierce, J.R. The relationship between monthly air pollution and violent crime across the United States. Rev. Environ. Econ. Policy 2019, 1–18. [Google Scholar] [CrossRef]
  7. Ferretti, F.; Coluccia, A. Socio-economic factors and suicide rates in European Union countries. Leg. Med. 2009, 11, S92–S94. [Google Scholar] [CrossRef]
  8. Machado, D.B.; Rasella, D.; Dos Santos, D.N. Impact of income inequality and other social determinants on suicide rate in Brazil. PLoS ONE 2015, 10, e0124934. [Google Scholar] [CrossRef]
  9. Helbich, M.; Leitner, M.; Kapusta, N.D. Geospatial examination of lithium in drinking water and suicide mortality. Int. J. Health Geogr. 2012, 11, 19. [Google Scholar] [CrossRef] [Green Version]
  10. Pompili, M.; Vichi, M.; Dinelli, E.; Pycha, R.; Valera, P.; Albanese, S.; Lima, A.; de Vivo, B.; Cicchella, D.; Fiorillo, A.; et al. Relationships of local lithium concentrations in drinking water to regional suicide rates in Italy. World J. Biol. Psychiatry 2015, 16, 567–574. [Google Scholar] [CrossRef]
  11. Giotakos, O.; Tsouvelas, G.; Nisianakis, P.; Giakalou, V.; Lavdas, A.; Tsiamitas, C.; Panagiotis, K.; Kontaxakis, V. A negative association between lithium in drinking water and the incidences of homicides, in Greece. Biol. Trace Elem. Res. 2015, 164, 165–168. [Google Scholar] [CrossRef] [PubMed]
  12. Andrés, A.R.; Halicioglu, F.; Yamamura, E. Socio-economic determinants of suicide in Japan. Int. J. Soc. Econ. 2011, 40, 723–731. [Google Scholar] [CrossRef]
  13. Pompili, M.; Vichi, M.; Dinelli, E.; Erbuto, D.; Pycha, R.; Serafini, G.; Giordanoa, G.; Valera, P.; Albanese, S.; Lima, A.; et al. Arsenic: Association of regional concentrations in drinking water with suicide and natural causes of death in Italy. Psychiatry Res. 2017, 249, 311–317. [Google Scholar] [CrossRef] [PubMed]
  14. Helbich, M.; De Beurs, D.; Kwan, M.P.; O’Connor, R.C.; Groenewegen, P.P. Natural environments and suicide mortality in the Netherlands: A cross-sectional, ecological study. Lancet Planet. Health 2018, 2, e134–e139. [Google Scholar] [CrossRef] [Green Version]
  15. Vita, A.; De Peri, L.; Sacchetti, E. Lithium in drinking water and suicide prevention: A review of the evidence. Int. Clin. Psychopharmacol. 2015, 30, 1–5. [Google Scholar] [CrossRef] [PubMed]
  16. Rihmer, Z.; Hal, M.; Kapitány, B.; Gonda, X.; Vargha, M.; Döme, P. Preliminary investigation of the possible association between arsenic levels in drinking water and suicide mortality. J. Affect. Disord. 2015, 182, 23–25. [Google Scholar] [CrossRef]
  17. Biermann, T.; Stilianakis, N.; Bleich, S.; Thürauf, N.; Kornhuber, J.; Reulbach, U. The hypothesis of an impact of ozone on the occurrence of completed and attempted suicides. Med. Hypotheses 2009, 72, 338–341. [Google Scholar] [CrossRef]
  18. Szyszkowicz, M.; Willey, J.B.; Grafstein, E.; Rowe, B.H.; Colman, I. Air pollution and emergency department visits for suicide attempts in Vancouver, Canada. Environ. Health Insights 2010, 4, EHI-S5662. [Google Scholar] [CrossRef]
  19. Yang, A.C.; Tsai, S.J.; Huang, N.E. Decomposing the association of completed suicide with air pollution, weather, and unemployment data at different time scales. J. Affect. Disord. 2011, 129, 275–281. [Google Scholar] [CrossRef]
  20. Kim, Y.; Myung, W.; Won, H.H.; Shim, S.; Jeon, H.J.; Choi, J.; Carroll, B.J.; Kim, D.K. Association between air pollution and suicide in South Korea: A nationwide study. PLoS ONE 2015, 10, e0117929. [Google Scholar] [CrossRef]
  21. Bakian, A.V.; Huber, R.S.; Coon, H.; Gray, D.; Wilson, P.; McMahon, W.M.; Renshaw, P.F. Acute air pollution exposure and risk of suicide completion. Am. J. Epidemiol. 2015, 181, 295–303. [Google Scholar] [CrossRef] [Green Version]
  22. Gładka, A.; Rymaszewska, J.; Zatoński, T. Impact of air pollution on depression and suicide. Int. J. Occup. Med. Environ. Health 2018, 31, 711–721. [Google Scholar] [CrossRef]
  23. Casas, L.; Cox, B.; Bauwelinck, M.; Nemery, B.; Deboosere, P.; Nawrot, T.S. Does air pollution trigger suicide? A case-crossover analysis of suicide deaths over the life span. Eur. J. Epidemiol. 2017, 32, 973–981. [Google Scholar] [CrossRef] [PubMed]
  24. Ng, C.F.S.; Stickley, A.; Konishi, S.; Watanabe, C. Ambient air pollution and suicide in Tokyo, 2001–2011. J. Affect. Disord. 2016, 201, 194–202. [Google Scholar] [CrossRef] [PubMed]
  25. Min, J.Y.; Kim, H.J.; Min, K.B. Long-term exposure to air pollution and the risk of suicide death: A population-based cohort study. Sci. Total Environ. 2018, 628, 573–579. [Google Scholar] [CrossRef] [PubMed]
  26. Lee, H.; Myung, W.; Kim, S.E.; Kim, D.K.; Kim, H. Ambient air pollution and completed suicide in 26 South Korean cities: Effect modification by demographic and socioeconomic factors. Sci. Total Environ. 2018, 639, 944–951. [Google Scholar] [CrossRef]
  27. LeSage, J.P.; Pace, R.K. A matrix exponential specification. J. Econom. 2007, 140, 190–214. [Google Scholar] [CrossRef]
  28. LeSage, J.P.; Pace, R.K. Introduction to Spatial Econometrics; CRC Press: Boca Raton, FL, USA, 2009; Chapter 9. [Google Scholar]
  29. Tiefelsdorf, M.; Griffith, D.A. Semiparametric filtering of spatial autocorrelation: The eigenvector approach. Environ. Plan. 2007, 39, 1193–1221. [Google Scholar] [CrossRef]
  30. Murakami, D.; Griffith, D.A. Eigenvector spatial filtering for large data sets: Fixed and random effects approaches. Geogr. Anal. 2019, 51, 23–49. [Google Scholar] [CrossRef] [Green Version]
  31. Murakami, D.; Griffith, D.A. Random effects specifications in eigenvector spatial filtering: A simulation study. J. Geogr. Syst. 2015, 17, 311–331. [Google Scholar] [CrossRef]
  32. Bhui, K.S.; Dinos, S.; McKenzie, K. Ethnicity and its influence on suicide rates and risk. Ethn. Health 2012, 17, 141–148. [Google Scholar] [CrossRef]
  33. Wetherall, K.; Daly, M.; Robb, K.A.; Wood, A.M.; O’Connor, R.C. Explaining the income and suicidality relationship: Income rank is more strongly associated with suicidal thoughts and attempts than income. Soc. Psychiatry Psychiatr. Epidemiol. 2015, 50, 929–937. [Google Scholar] [CrossRef] [PubMed] [Green Version]
  34. Szyszkowicz, M.; Kousha, T.; Kingsbury, M.; Colman, I. Air pollution and emergency department visits for depression: A multicity case-crossover study. Environ. Health Insights 2016, 10, EHI-S40493. [Google Scholar] [CrossRef] [Green Version]
  35. Tondo, L.; Isacsson, G.; Baldessarini, R. Suicidal behaviour in bipolar disorder: Risk and prevention. CNS Drugs 2003, 17, 491–511. [Google Scholar] [CrossRef] [PubMed]
  36. Pun, V.C.; Manjourides, J.; Suh, H. Association of ambient air pollution with depressive and anxiety symptoms in older adults: Results from the NSHAP study. Environ. Health Perspect. 2017, 125, 342–348. [Google Scholar] [CrossRef] [PubMed] [Green Version]
  37. He, G.; Chen, Y.; Wang, S.; Dong, Y.; Ju, G.; Chen, B. The Association between PM2.5 and Depression in China. Dose-Response 2020, 18. [Google Scholar] [CrossRef] [PubMed]
Figure 1. Inner and outer districts of Greater London (Data source: London Datastore).
Sustainability 12 07444 g001
Figure 2. Average annual rate of adult suicide (cases per 100,000 persons) from 2011 to 2015 across Greater London (Data source: London Datastore).
Sustainability 12 07444 g002
Figure 3. Average population-weighted annual mean PM2.5 levels (μg/m3) from 2012 to 2014 at the district level across Greater London in 2011 (Data source: Defra).
Sustainability 12 07444 g003
Figure 4. Scatterplot of PM2.5 level and suicide rate across Greater London.
Sustainability 12 07444 g004
Table 1. Suicide rates and PM2.5 levels in the 32 districts.
BoroughSuicide RatePM2.5 LevelBoroughSuicide RatePM2.5 LevelBoroughSuicide RatePM2.5 Level
Barking and Dagenham7.5611.90Hammersmith and Fulham10.7013.34Merton8.51 11.50
Barnet8.2811.72Haringey11.1812.28Newham6.74 12.79
Bexley9.5110.99Harrow5.7811.01Redbridge7.71 12.01
Brent8.5512.55Havering8.7810.71Richmond upon Thames8.11 11.33
Bromley8.9310.36Hillingdon8.2011.34Southwark10.43 13.17
Camden10.4813.37Hounslow6.8412.00Sutton8.05 10.68
Croydon8.1210.83Islington12.2413.68Tower Hamlets10.04 13.69
Ealing8.6212.46Kensington and Chelsea8.8314.17Waltham Forest8.68 12.44
Enfield6.4411.47Kingston upon Thames6.9311.21Wandsworth9.50 12.27
Greenwich6.5811.87Lambeth8.6312.84Westminster11.31 14.31
Hackney9.5313.39Lewisham8.3711.91
Suicide rate and PM2.5 level represent ‘average annual rate of adult suicide (cases per 100,000 persons) from 2011 to 2015′ and ‘average population-weighted annual mean PM2.5 levels (μg/m3) from 2012 to 2014′ respectively.
Table 2. Descriptive statistics of variables used.
VariablesFull NamesYearsMeanSD
DSRSDirectly age-standardised rate of suicides (cases per 100,000 persons)2011–20158.691.52
DTDistrict type---
ML_PPercent of males aged 16 and over (%)2010–201449.420.97
WHT_PPercent of White people (%)2012–201461.314.85
INC_MAverage median annual household income (1000£)2010–201250.8215.6
UNE_RUnemployment rate (%)2010–20148.581.88
NQL_PPercent of working-age population with no qualifications (%)2010–20148.682.74
JOB_DJob density (jobs/persons)2011–20150.860.72
PM2.5Population-weighted annual mean PM2.5 level (μg/m3)2012–201412.171.07
Table 3. Estimation results for the MESS-SAR and RES-ESF models.
ParameterResponse: DSRS
MESS-SARRES-ESF
Intercept4.6343.742
BR_T ‘Outer1.0040.963
ML_P−0.401−0.384
WHT_P0.068 *0.067 *
M_INC−0.065 *−0.064 *
UNE_R0.0900.052
NQL_R−0.211−0.177
JOB_D0.4680.482
PM2.52.102 ***1.982 ***
Adjusted R-squared0.6000.469
AIC102.195125.665
Significance codes: ‘***’ 0.001; ‘**’ 0.01; ‘*’ 0.05; ‘.’ 0.1. Note: MESS-SAR: matrix exponential spatial specification of spatial autoregressive; RES-ESF: random effects specification of eigenvector spatial filtering.

