Article

Using Eye-Tracking Technology to Measure Environmental Factors Affecting Street Robbery Decision-Making in Virtual Environments

1
Department of Architecture, Sejong University, 209, Seoul 05006, Korea
2
Department of Police Science, Kyungnam University, Gyeongsangnam-do 51767, Korea
*
Author to whom correspondence should be addressed.
Sustainability 2020, 12(18), 7419; https://doi.org/10.3390/su12187419
Submission received: 25 June 2020 / Revised: 30 August 2020 / Accepted: 1 September 2020 / Published: 9 September 2020

Abstract

:
There is a lack of quantitative data regarding how offenders make decisions about committing a crime or how situational factors influence such decisions. Detailed crime data on decision-making among criminals are required to improve the accuracy of research. Demonstrating a new methodology for assessing the factors impacting criminal decision-making among street robbery offenders, this study identifies visual data that influence criminal decision-making, and verifies the significance of the measured data. To this end, this study first identified and organized the physical aspects affecting criminal decision-making based on the Crime Prevention Through Environmental Design (CPTED) literature. Next, participants were informed of a street crime scenario and asked to replicate the behaviors of criminals in the virtual environment of Grand Theft Auto 5. Factors affecting criminals’ decision-making were then quantitatively assessed using eye-tracking technology. Multivariate logistic regression analysis was used to verify the significance of the measured data. Results show that windows placed adjacent to the street, balconies and verandas, and signs indicating territoriality have a significant effect on criminals’ decision-making. Confirming the influence of CPTED factors on the occurrence of street robbery, this study advances a new way of acquiring quantitative data through eye-tracker technology, a method hitherto unexplored by existing research on street robbery.

1. Introduction

1.1. Background and Purpose of the Study

The occurrence of street robbery is influenced by a number of factors, including the criminal’s behavior, the victim’s vulnerability, appropriateness of the location, and people’s daily activities [1]. Street robbery data and existing studies also indicate a high probability of street robbery reoccurring in the same locations [2,3,4,5]. Such findings enable the examination of the environmental factors of locations where street robbery frequently occurs [2]. Nonetheless, we were hitherto unable to identify latent street criminals in reality or predict the occurrence of street robbery. There is a growing recognition of the importance of Crime Prevention Through Environmental Design (CPTED), an approach seeking to lower the crime rate by creating environments that hinder its occurrence. Although existing criminal research has focused on criminals’ biological and psychological features, scholars are becoming increasingly interested in predicting crime based on situational factors, including CPTED elements that make crime more likely to occur in certain locations [2,6,7]. Situational factors affect the process of criminal decision-making, with related studies conducted on the basis of crime theories and analyses of post-incident crime data [2].
Three types of crime data are used in current criminal research. First, scholars like Armitage [8] have surveyed convicts in order to establish crime data based on the analysis of criminal behavior. This data type is particularly popular. For instance, Weisburd [2] found the surveying of individuals to be the dominant unit of empirical analysis in almost two thirds of the articles published in Criminology. However, this method does not allow for the quantitative testing of the impact of different environmental characteristics (as in the CPTED approach) in the offender decision-making process. Consequently, it is difficult to gather precise data from offenders [8]. The second type of data is open crime data. Comprising time and location data, open crime data are frequently used by programs like PredPol and HunchLab to predict crime. Open crime data are recorded by police and related organizations through the reports and testimony of victims, but they are limited insofar as they do not include any other specific details. Nonetheless, these data include a range of data from the macro level (including cities, counties, and states) to the meso level (such as census tracts, census block groups, and neighbors) [2]. The third kind of data consists of micro-level factors regarding the crime location. Related studies are currently limited. According to Weisburd [2], only 4.3% (31) of the 719 papers submitted to Criminology over a 25-year period analyzed micro-level factors affecting crime. This may be due to the difficulties associated with conducting micro-level analysis in current criminal research.
As such, a new method of analyzing the environmental factors that form the basis of criminal decision-making is necessary to overcome the limitations inherent in existing research. Quantitative measurements of micro-level factors are also necessary to ensure objective results. Addressing this need, this study proposes the use of eye-tracker technology to measure the time and frequency with which street robbers fix their gaze on surrounding elements that affect their decision-making. Using the virtual environment of Grand Theft Auto 5 (GTA5), a game acclaimed for its close replication of real environments, this study verifies the effectiveness of the proposed methodology by confirming whether the quantitatively measured values of street elements significantly influenced participants’ decisions to commit crime. This study also discusses the usability of the results.
Identifying which street elements significantly affect the criminal decision-making process requires analysis from the criminal’s perspective, particularly insofar as visually perceived situational factors constitute the basis of this cognitive process [9]. Accordingly, this study uses eye-tracker technology to gather data from the criminal’s standpoint. The eye tracker enables researchers to quantitatively estimate when and for how long a participant’s gaze is fixed on an object, thereby overcoming the reliability issue of existing crime data.
Although the environment in which an actual crime is committed needs to be replicated in order to use the eye-tracker measurement method, there is a limitation to replicating criminal behavior in reality. To address this obstacle, this study uses a virtual environment to replicate the occurrence of street robbery. In the virtual environment, the eye tracker measured the situational factors that might affect decisions to commit crime.

1.2. Street Robbery and Bounded Rationality

In general, research on criminal behavior can be divided into two fields: situational criminology, which analyzes the situational elements of the site where crime occurs, and criminal psychology, which studies criminal behavior. The situational approach of routine activity theory conceptualizes street robbery as a fundamental criminal behavior [10]. According to routine activity theory, places where street robberies frequently occur have a pattern facilitating the occurrence of crime. Certainly, both criminological theory and actual crime incidents indicate that crime is more likely to happen in certain locations [10]. Based on such theoretical grounds and the empirical evidence provided by crime data analysis, we can derive the locational conditions influencing the criminal decision-making of street robbery offenders. In this respect, extant research indicates that offenders first consider the situation—such as the target’s vulnerability and the appropriateness of the location—before committing the crime [11]. In terms of location, street robbery occurs more frequently in densely populated areas [11], particularly urban centers [12]. Street robbers typically select a target location close to their residence as they seek familiar locational conditions [12]. Furthermore, street robbery frequently occurs in garages, public transportation sites, and parking lots in urban centers [13]—that is, environments that promote people carrying cash [12,13].
The majority of studies analyzing criminal behavior under the aforementioned conditions adopt rational choice theory [14], understanding the decision to commit a crime as the outcome of comparing the benefits and risks entailed in doing so [15]. Such research indicates that criminals tend to target distracted individuals who appear to possess abundant cash and valuable goods [16], as well as situations from which they can easily escape and where they can readily monetize stolen goods [2]. However, some critics argue that rational choice theory alone is insufficient for understanding street robbery, particularly insofar as it may not accurately reflect criminal decision-making in real-life situations [17,18,19]. Scholars have suggested that the criminal behavior of street robbery is more accurately perceived through the “bounded rationality” perspective [18]. Claiming that the process of criminal decision-making is too complicated for the application of rational choice theory in practice, Robles [18] was the first to advance bounded rationality as a perspective that accounts for cognitive and ecological factors as well as rational choice. According to Robles [18], street criminals make decisions based on the simultaneous consideration of situational, social, and environmental factors, and after visually perceiving relevant environmental elements.
As such, although rational choice theory is an appropriate and valuable perspective for street robbery analysis, researchers also need to consider the ecological factors that influence criminal decision-making at the moment of committing the crime. As summarized in Table 1, the extant research indicates that, in addition to the process of rational choice, situational, social, environmental, and temporal aspects are important factors in the criminal decision-making process of street robbers.

1.3. The Need for Smaller-Scale Research on Crime Environments and CPTED Theory

Crime prediction models use open crime data that include basic information such as the type, time, and location of the crime. However, public crime data are limited in scope and do not reflect the characteristics of individuals with criminal records, resulting in the need for studies to control for the variables that significantly impact criminal decision-making. Therefore, further research on more segmented and micro-level factors is necessary to improve the reliability of results [2]. Nonetheless, it is difficult to consider all factor types—that is, ecological, situational, social, environmental, and temporal factors—in a micro-level analysis. Indeed, while most of the factors that affect street robbery decision-making are determined by ecological elements (e.g., impulsiveness, mistakes, the ethical consciousness of criminal behavior, street culture, alcohol consumption, psychoactive substance abuse, collective behavior, and simple behavior), defining a pattern of factors has proven challenging [14]. Moreover, with much of the available crime data based on victim reports, data regarding criminals’ ecological aspects are rarely available.
Social, economic, and temporal factors are often represented in statistical data and approached from a sociodemographic perspective. However, despite their high status as quantitative data in criminology research, these factors do not necessarily have a direct influence on criminal decision-making. Consequently, researchers turned to analyzing the physical features of the crime environment as factors influencing criminal behavior, resulting in the development of defensible space theory, CPTED, and crime pattern theory [20], which define the properties of a crime site. For instance, crime rates have been shown to decline as the potential for criminal behavior detection increases [21]. According to these theories, crime rates decrease in environments that facilitate crime detection because fear influences criminals’ decision-making in such locations [22].
According to Cozens and Lee [20,22], it is possible to reduce crime rates by reinforcing territoriality, increasing scrutiny of the environment via natural surveillance, and maintaining buildings and streets using the five principles of CPTED. Natural surveillance can occur through buildings adjacent to the street and the absence of obstacles that hinder observation [23]. Cozens [20] argues that natural surveillance via first-floor windows is especially advantageous in terms of spotting criminal behavior. Brown et al. [24] found that balconies and verandas on the exterior of buildings also increase the chance of detecting criminal behavior. Although they hinder intrusion, walls and fences are common obstacles to natural surveillance because they block visibility. Other obstacles include telephone poles, roadside trees, vehicles parked on the street, and front yards [25,26]. Crime prevention grilles placed on windows can also hinder natural surveillance [27,28].
Clearly defined territoriality is also important, with street robbery typically occurring in public places. According to statistical data from the United States [11], the greatest number of crimes occur in non-private, public spaces such as public parking lots, bus stops, and subways. More specifically, street robbery frequently occurs in public parking lots where natural surveillance is hindered by parked cars, providing favorable conditions for escape. Criminals can also hide between parked cars while waiting for victims.

1.4. Use of Virtual Environments

Given that criminals’ visual perception greatly influences their decision-making, this study examines criminal behavior by analyzing visual perception in a virtual environment. A virtual environment allows users to freely experience a rendered digital space that appears similar to the actual environment, with user movement monitored through the display [29]. Various industries and research fields have begun using virtual environments and the method of predicting human behavior in virtual reality (VR) has been deemed reliable as the participants are able to freely experience the rendered virtual space and the virtual environment allows for complete immersion [29].
Dibbell [29] was one of the first scholars to examine crime in virtual environment [29]. Extant studies have tended to use virtual environments to examine burglaries—the approach enabling researchers to undertake previously difficult studies that reflect criminal decision-making [29]. In this respect, van Gelder has discussed the extent to which results from criminal research using virtual environments can be applied, and the degree to which psychological and behavioral factors can be realized in virtual environments [29].
This study uses the virtual environment of GTA5, which replicates the urban environment of the Californian city of Los Angeles (LA) in the United States. Developed by Rockstar Games at a cost of over USD 100 million, the game is acclaimed for its close replication of real environments (Figure 1). According to Filipowicz et al. [30], while not a perfect reproduction of the real world, GTA5 provides a bountiful virtual environment for data collection. Indeed, the game possesses 1000 different artificial intelligence (AI) pedestrians, 262 vehicles, 14 types of weather, as well as realistic bridges, traffic lights, tunnels, and intersections [30]. Offering a first-person perspective of realistic environments, GTA5 negates the financial and technological limitations of creating virtual cities and street environments. Such limitations have impacted the use of virtual environments in street robbery research, which requires the replication of a relatively small space. The virtual environment of GTA5 reproduces street environments accurately enough for the gathering of street environment data for autonomous vehicles, and is even being used to develop autonomous vehicles. According to Davide Bacchet of the start-up car company NIO, virtual environments provide a cost-effective alternative to the limited and cost-prohibitive data available from real roads in developing autonomous navigation technology.
The creation of visual and auditory environments is essential because street criminals first cognize the threat of detection through sight and hearing during criminal decision-making [18]. Advancing the importance of immersion in studies using virtual environments, van Gelder [31] claims that replicating sound in virtual environments helps enhance users’ cognizance of these environments. The sounds in GTA5 increase participants’ immersion as they replicate the sounds heard in real urban environments and street robbery encounters, such as screams and police sirens. As GTA5 is run on computers, it was presented to participants on a 21-inch display at a resolution of 1920 × 1080; all lights were switched off to enhance participant immersion. Participants used the game controller Ex-Air to freely explore the virtual Los Angeles environment; this controller was selected due to its popularity, simple controls, and ease of use. Speakers were used to block possible noise from the living environment, thereby promoting immersion in the virtual environment through the cognition of GTA5’s soundscape.

1.5. Eye-Tracker Technology

Gaze movement follows the point where an individual’s cognition and attention are focused. Gaze fixation and saccade are essential in eye-tracking technology. According to Wedel et al. [32], eye tracking quantitatively outputs gaze, fixation, and saccade, thereby measuring how long an individual’s gaze remains focused on a given point [32]. Eye trackers have subsequently been used in psychology and marketing to obtain survey results and have only recently been utilized in community design [33]. Few studies have used eye-tracking technology in the field of community design, and the use of such technology is especially insufficient in research related to crime environments.
Eye-tracker technology includes both fixed and goggle types. A fixed eye tracker can determine where the user’s gaze is directed and how long it remains fixed by analyzing the location of their pupils [33]. This study placed a GP3 Gazepoint eye tracker at the bottom of the 21-inch display (Figure 2). A fixed eye tracker was used because the VR of GTA5 is experienced via a monitor and, unlike the goggle type, fixed eye trackers enable participants to become immersed in the experiment without the inconvenience of having to wear the eye-tracker device. Eye-tracker results are presented as quantitative data comprising path and heat map data, which are used to determine the factors cognized by street criminals in the process of criminal decision-making. Participants underwent the process of gaze calibration to increase the accuracy of individual gaze fixation (Figure 3).

2. Methods

2.1. Participants

A total of 20 male university students participated in the experiment. Participants were between the ages of 26 and 29; M (age) = 27.75, SD (age) = 0.967. University students were selected as participants in order to prevent insincere study participation, given that students who are financially dependent on their parents tend to value the participation payment more than office workers. Males were selected because the rate of committing street robbery is considerably higher among males compared to females [1]. Participants’ ages, monthly allowances, VR control proficiency, and street robbery experience were surveyed through a questionnaire in the process of setting up the experiment. None of the participants had been involved in a street robbery prior to the experiment.
Participants encountered a scenario in which they were asked to explore the city in search of targets for crime (Figure 4). In the scenarios, participants received preliminary instructions to commit crimes after weighing the risk of detection versus the potential benefits in searching for street robbery targets. The criminal decision-making scenarios were written based on extant research and in a manner that participants could easily understand. Research indicates that street robbers evaluate the suitability of targets based on their visibility, accessibility, and perceived value [34]. Street robbers rationally decide whether the space is familiar and suitable to commit robbery and escape easily [11,12]. The scenarios were provided to help participants consider the process of criminal decision-making for an added sense of reality. Participants were asked to individually search for an environment suitable for committing a crime. To prevent insincere participation, those who committed criminal decision-making without being detected were given an extra reward of KRW 200,000 in addition to the participation payment of KRW 20,000; those who were detected by the surrounding surveillance environment became ineligible for the participation payment.
Control proficiency was evaluated at 1 point for low proficiency and 10 points for high proficiency. To ensure meaningful results, participants were required to achieve five points or higher for control proficiency to proceed with the experiment. This study investigated whether participants’ monthly allowance and game control proficiency affected the dependent variable based on the experiment results of the 20 participants.
First, participants’ allowances were analyzed due to the possibility of insincere participation by those who receive greater allowances and thus view the experiment compensation as less important. Accordingly, this study investigated the influence of participants’ monthly allowance on the results to ensure that the compensation did not influence the research outcomes. Table 2 presents participants’ monthly allowances and proficiency results.
Second, this study investigated the influence of control proficiency to ensure the reliability of the study’s results. The extent to which allowance and game control proficiency impact the results was examined through a univariate logistic regression analysis, the results of which are presented in Table 3.
Results yielded significance probabilities greater than 0.05 for monthly amount of allowance spent and game control proficiency, indicating that the variables did not impact criminal decision-making in the virtual environment. Seven of the eight participants who made criminal decisions were successful, indicating sincere participation in the experiment.

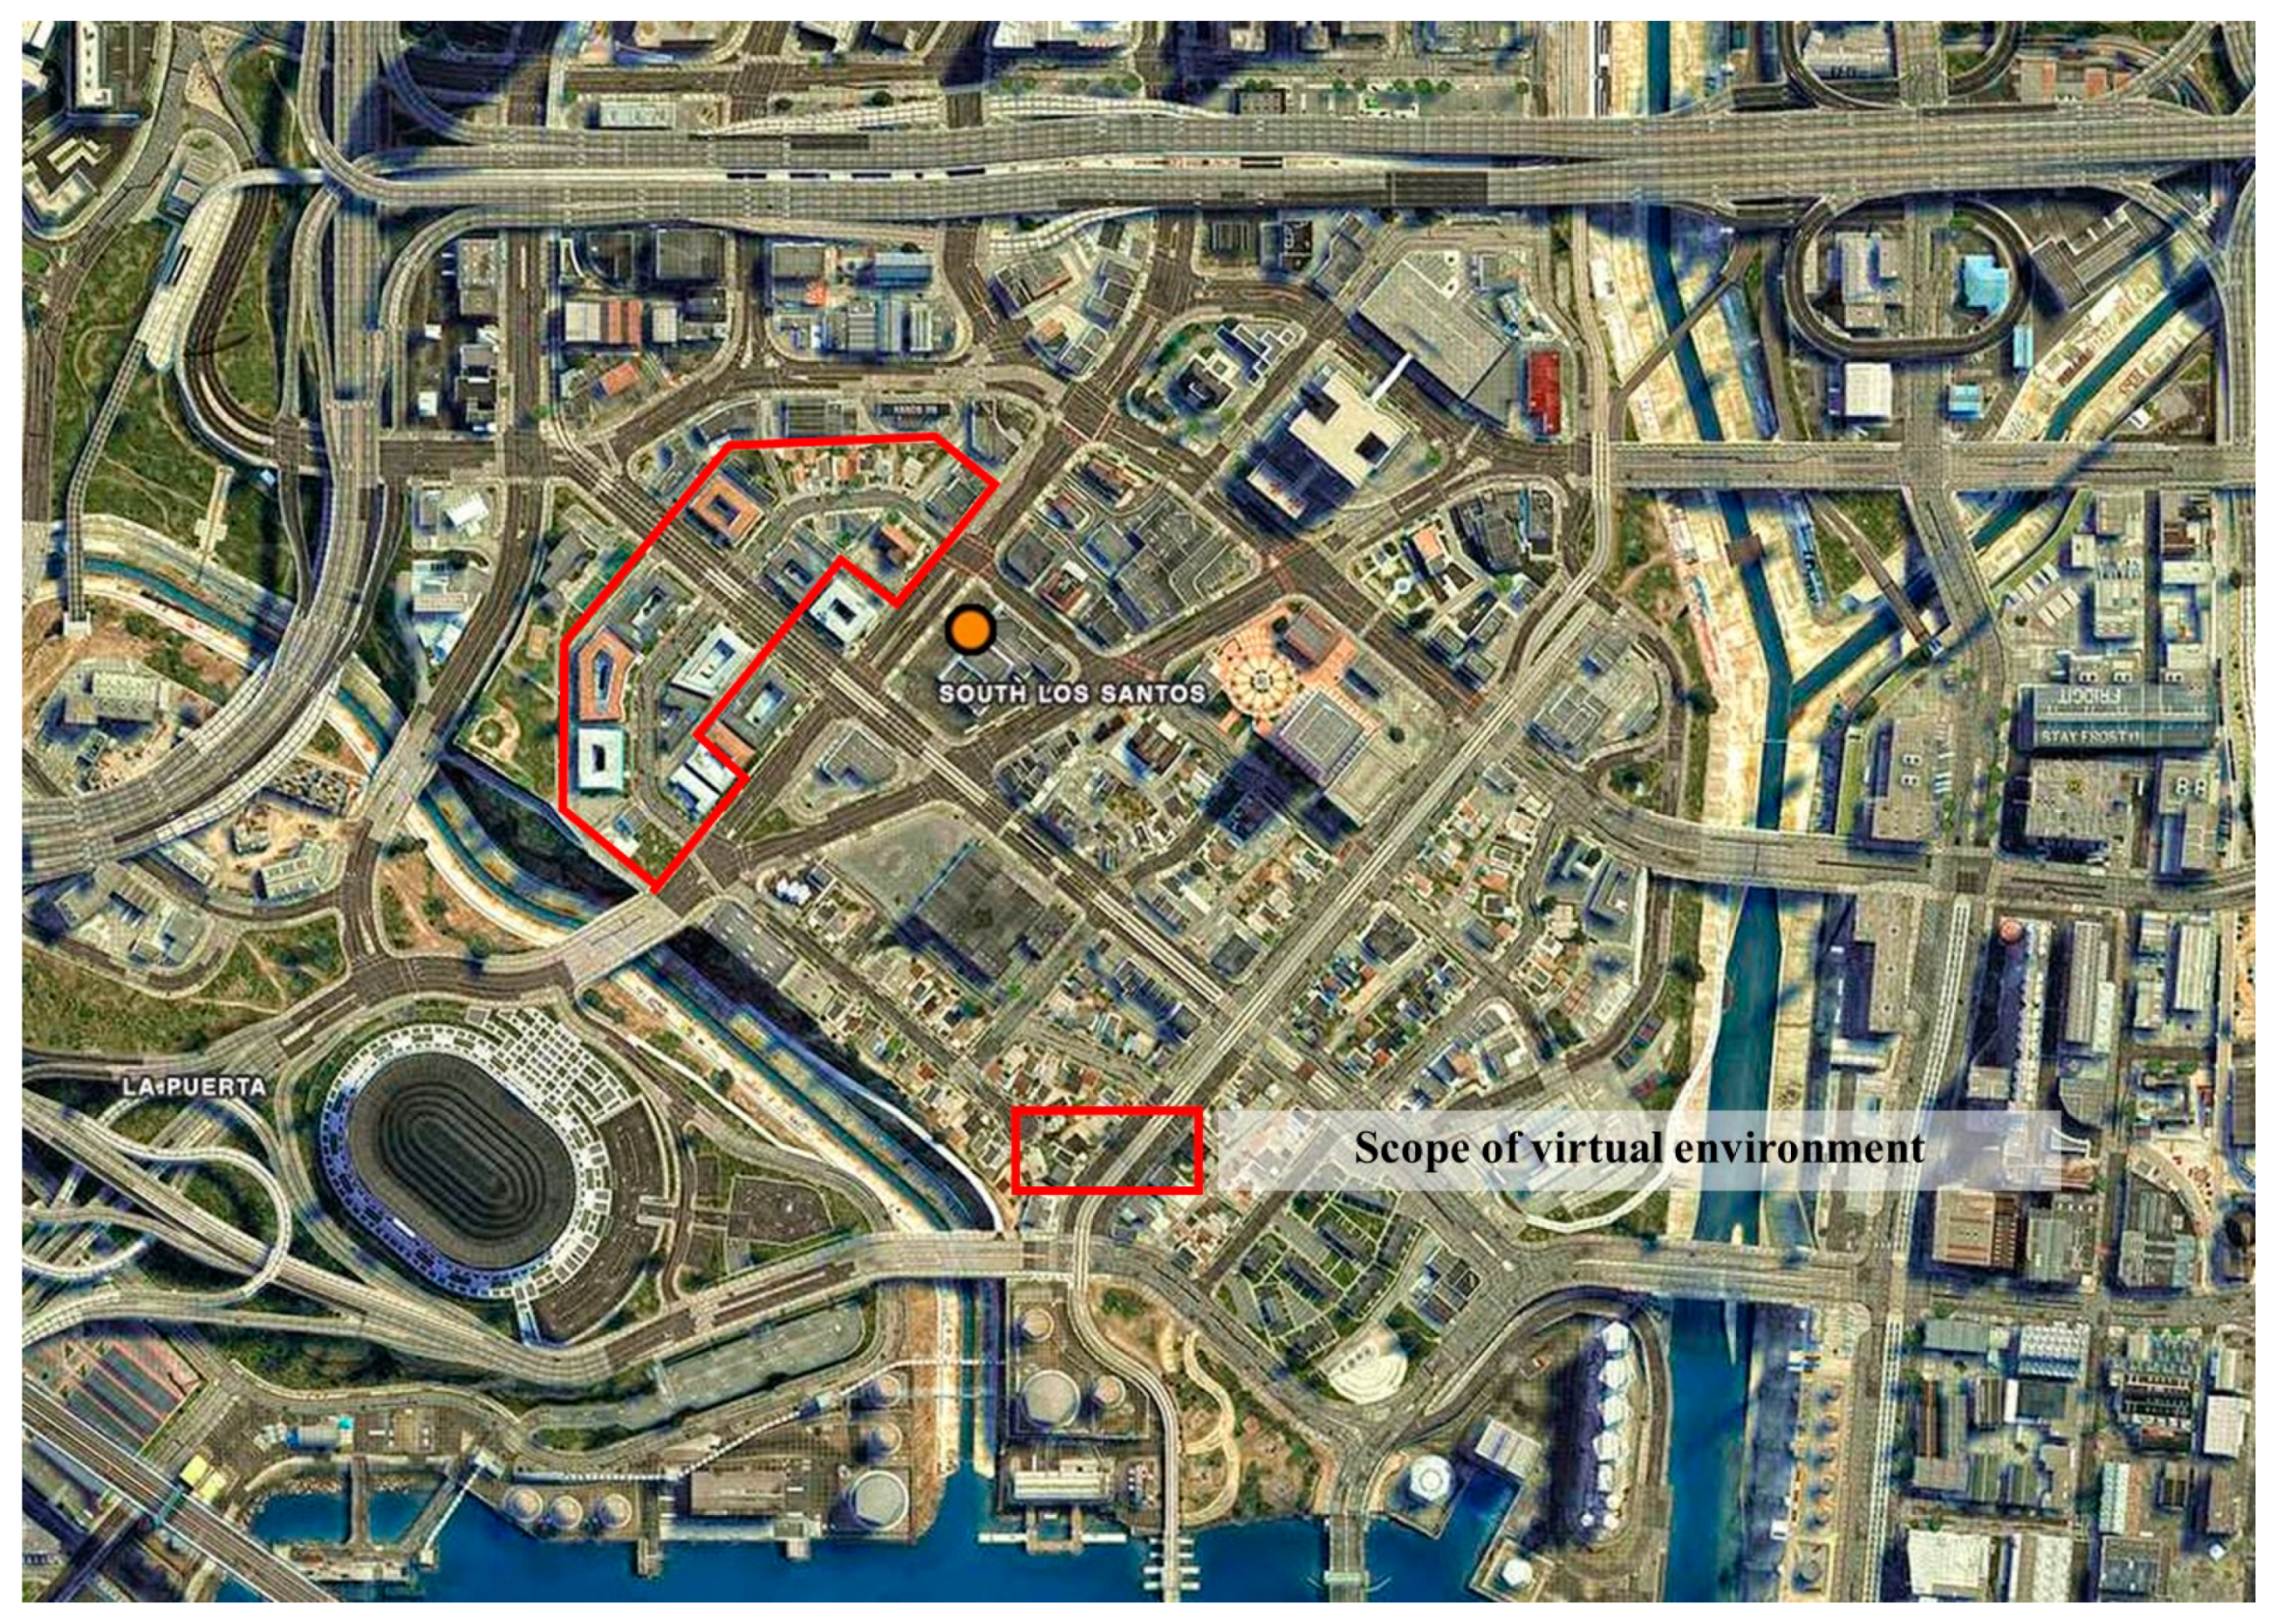
2.2. Setting the Scope of Virtual Environment

For the purposes of this study, the experimental scope of the virtual environment in GTA5 consisted of a location replicating a low-rise residential area in LA. The scope was limited to the residential area because street robbers tend to focus on aspects other than the surrounding physical environment in areas that are near a busy street or are commercially active [1]. Moreover, the physical environment has a greater impact on street robbery in residential areas because roads are narrow, and buildings are closer to the sidewalks compared to urban commercial zones. Figure 5 and Figure 6 depict the physical environments of the replicated residential areas used in this study, while Figure 7 presents the experimental scope of the virtual environment in GTA5.

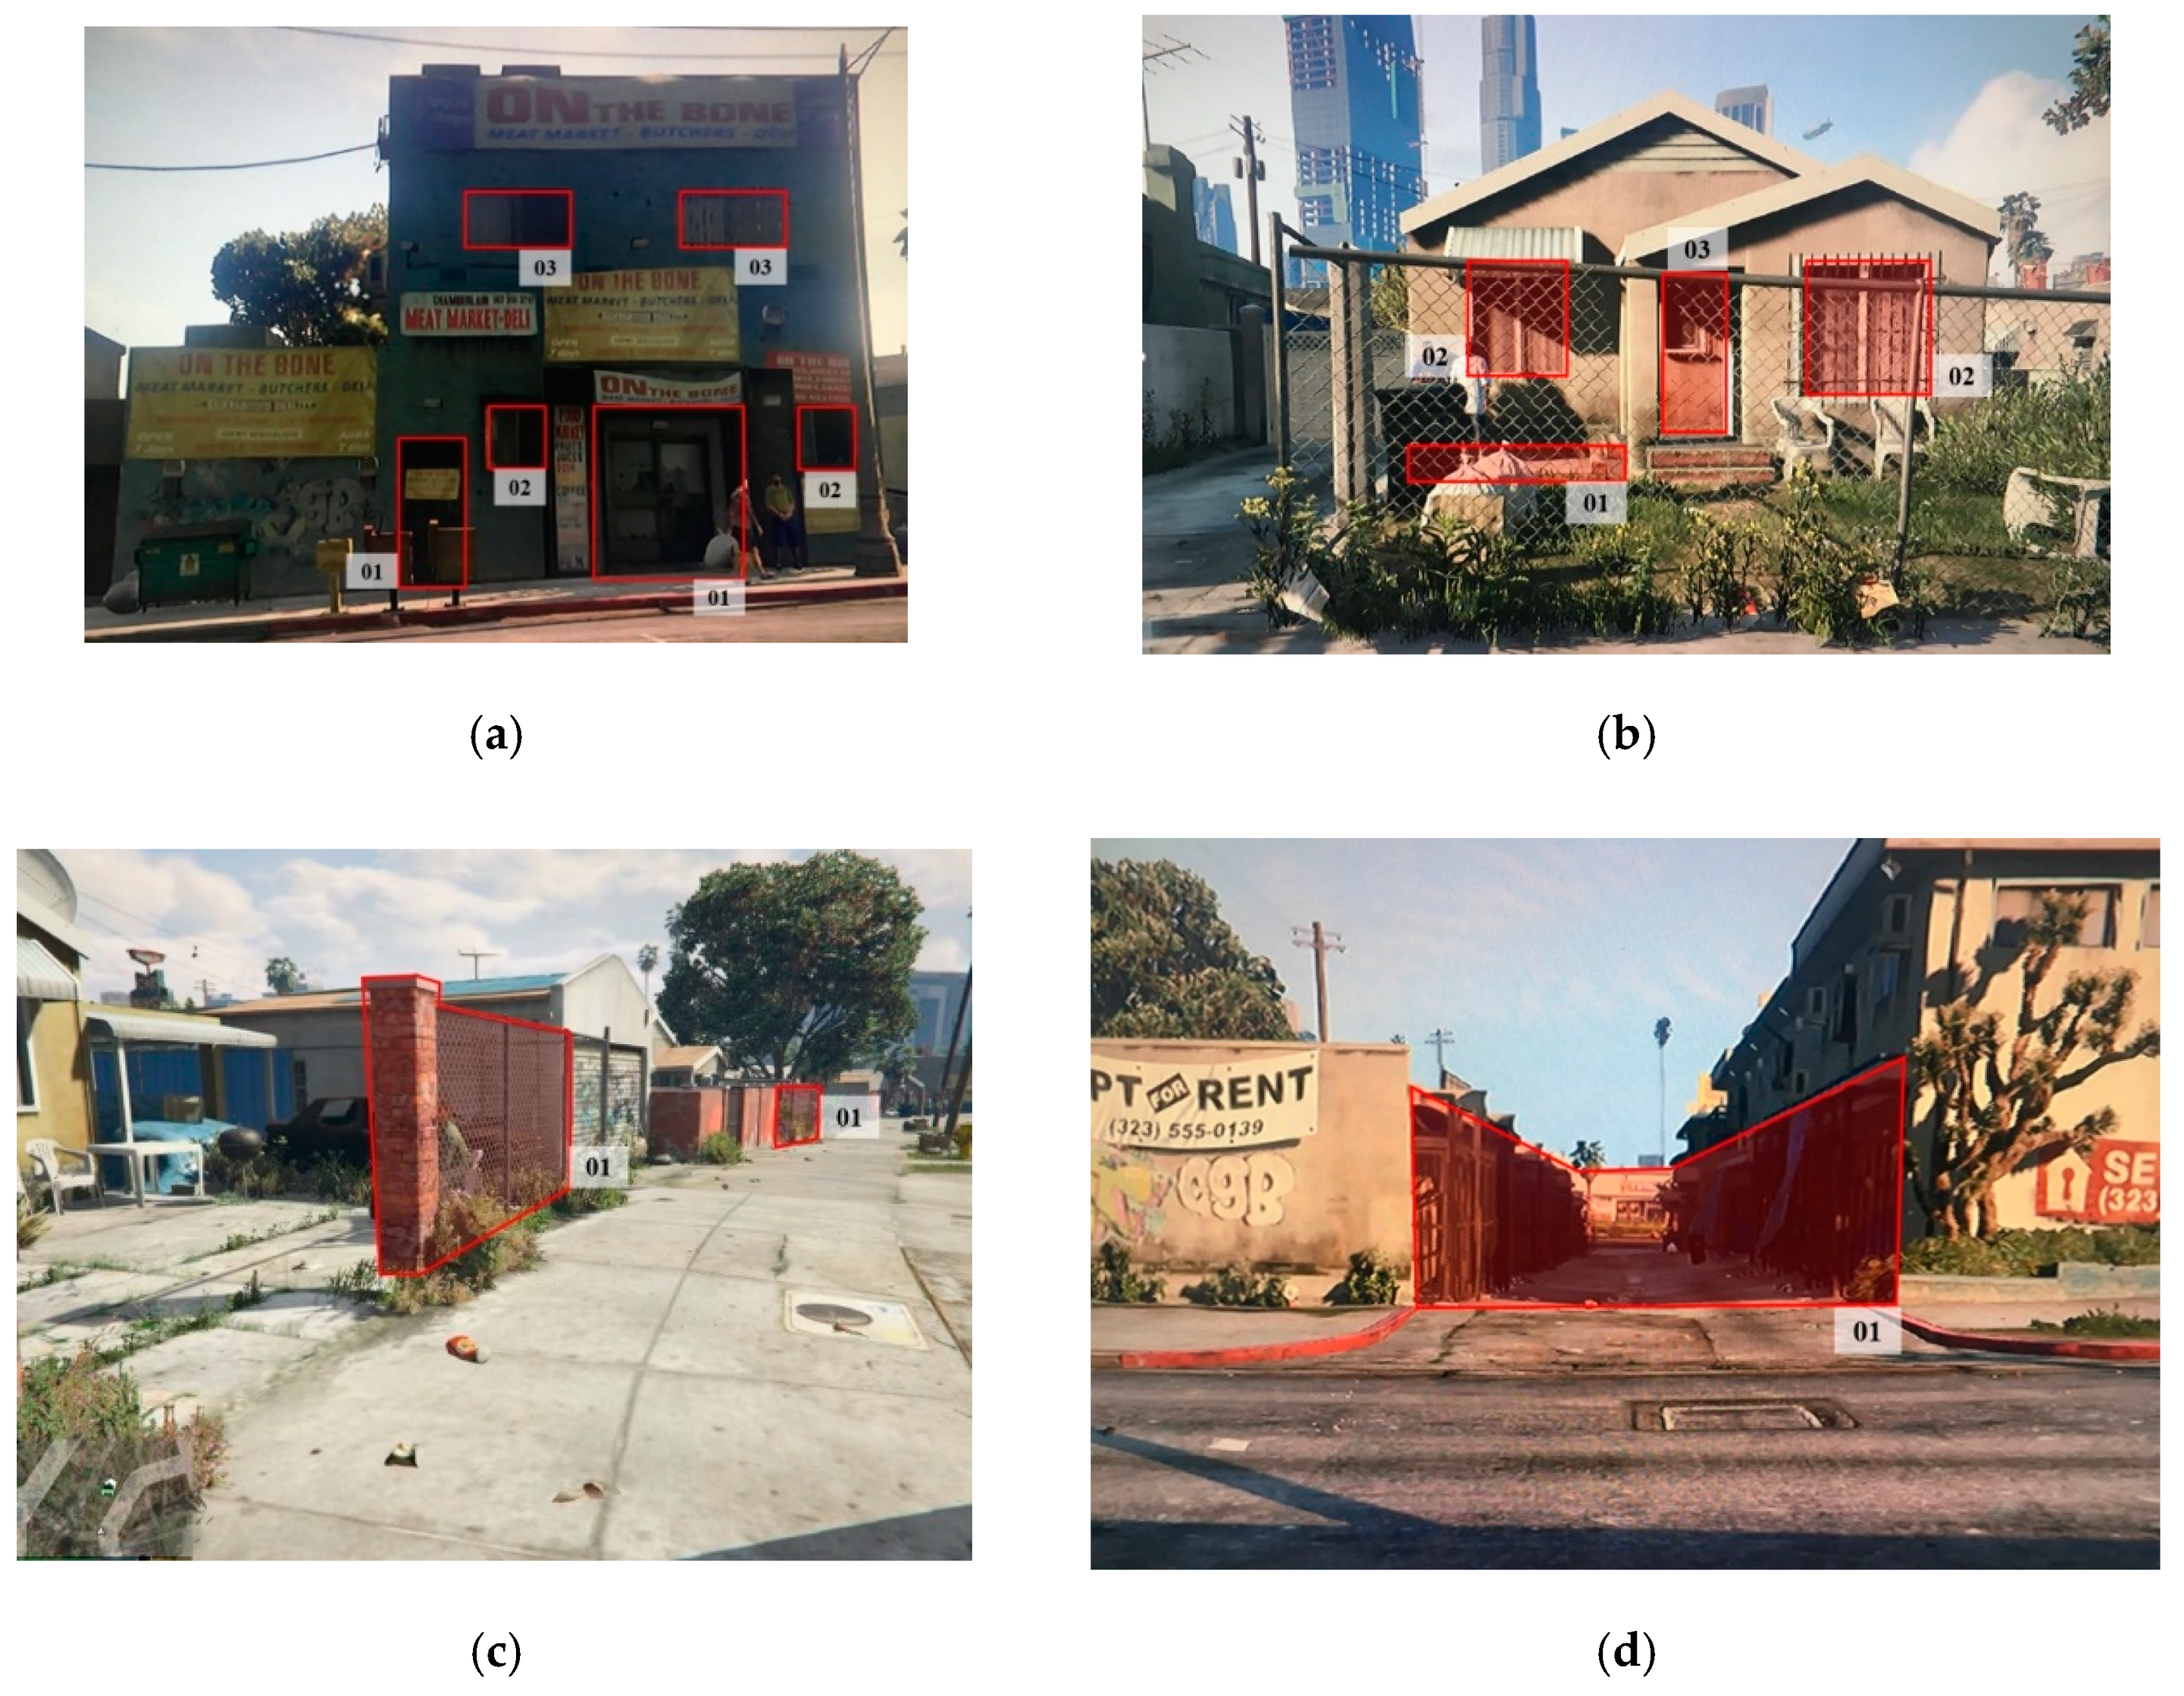
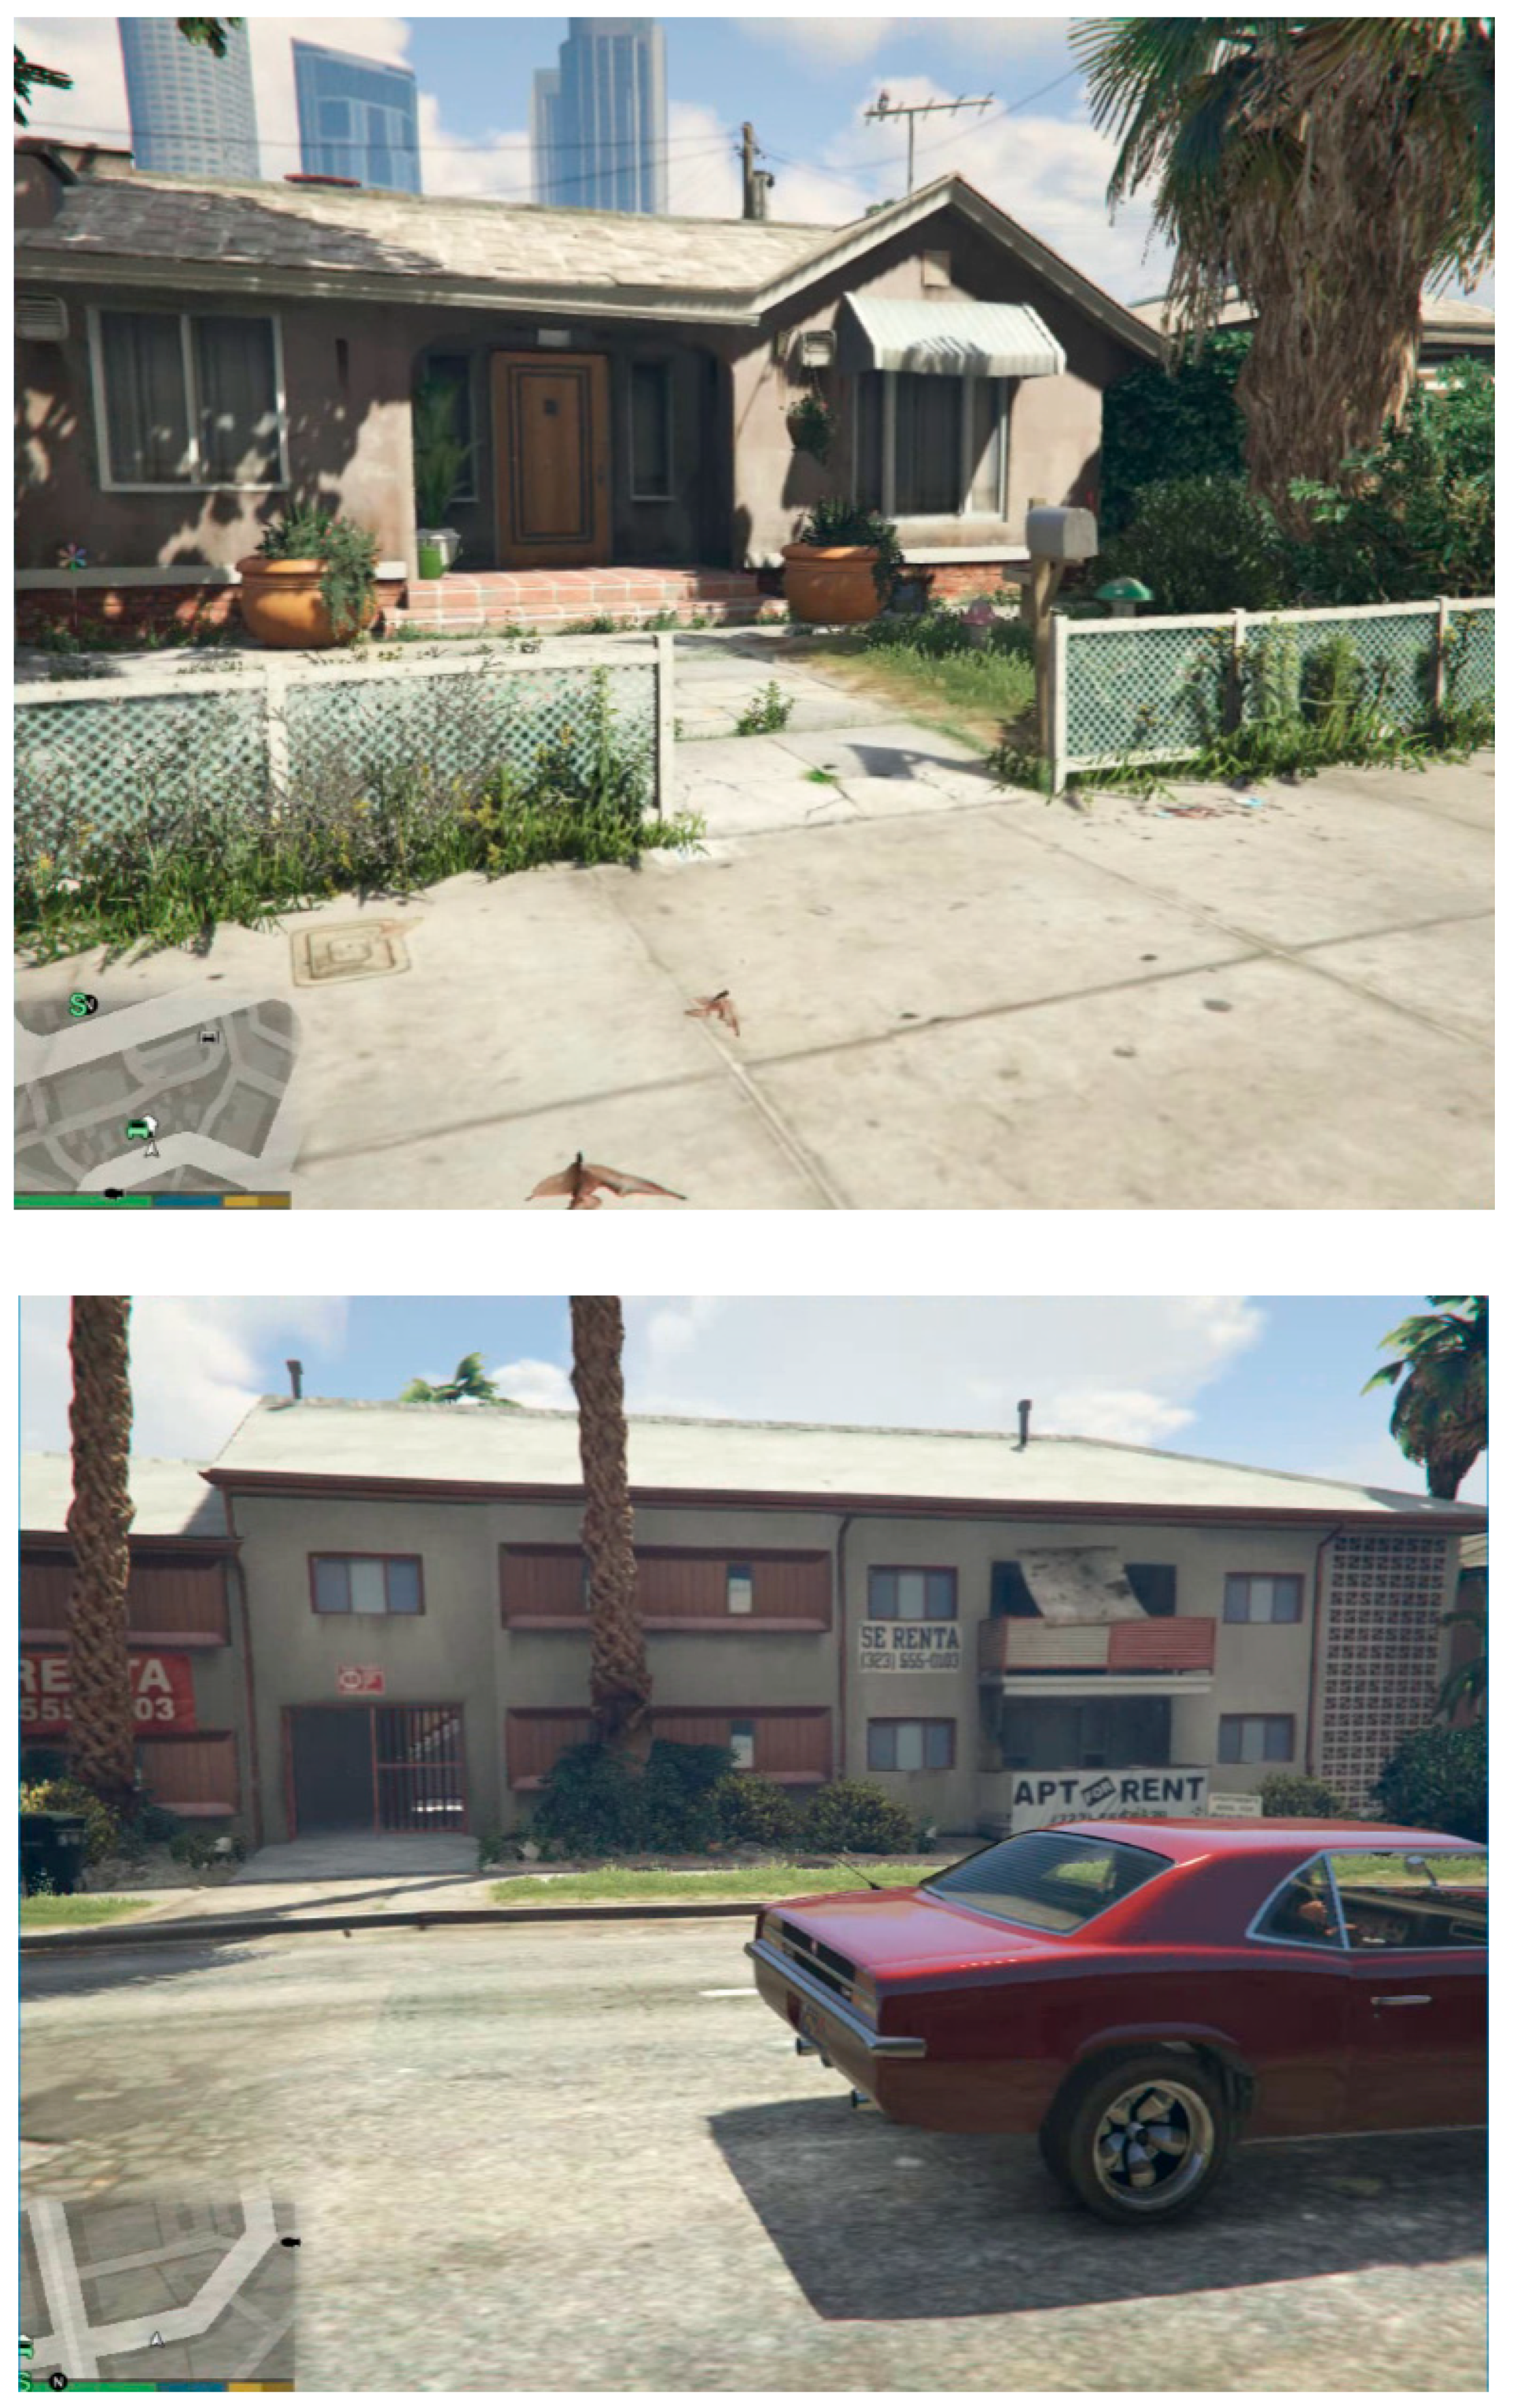
2.3. Setting the Variables

This study considers the role of the surrounding situational elements in the physical environment and rational choice in criminal decision-making. This study controlled for ecological, economic, environmental, social, and temporal factors as follows. First, the ecological aspects of street robbery are difficult to predict. However, as the methodology of this study is bounded to street robbery, which can be defined as a pattern, unpredictable ecological factors are controlled. Second, although statistical data indicate that 95% of street crimes are committed to obtain valuables, it is necessary to consider cases in which the objective of criminal behavior is not money or other valuables when considering the economic environment of a crime [35]. This study controlled for economic elements by selecting university students who are financially dependent on their parents as research subjects. Third, this study defines social factors as population density, social community, and the gap between social classes. This study controls social aspects because it centers on a single research site, and because the participants—who comprise Korean university students from the same social class—cannot be regarded as socially diverse. Finally, temporal factors are also controlled because street robbery occurs at different times depending on people’s routine activities [15,36], which means that a set time cannot be defined.
As such, this study examines two variables: rationality in criminal decision-making and the physical environment. Among the physical variables that can be replicated in VR, this study selected factors that affect natural surveillance according to CPTED theory (Figure 8, Table 4).

2.4. Measures

Area of Interest (AOI) refers to the object or space on which respondents subconsciously fix their gaze, and it indicates the area in VR to which they pay attention. Two types of data can be assessed through the eye tracker. First, the length of time for which the participant’s gaze remains fixed on an AOI is defined as the “time of fixation,” reflecting the total amount of time an individual’s gaze is fixated on an AOI. Second, the “total number of fixations on AOI” refers to the number of times the participant’s gaze is fixed on a single AOI category, indicating the number of times the participant’s gaze is directed at an AOI. Figure 9 presents the AOI categories identified in the GTA5 virtual environment.
As the time varied for each participant, this study analyzed the data obtained through the eye tracker after dividing the measured data by the time each participant spent on the experiment. The dependent variable is measured as a binary variable, indicating whether a criminal decision was made or abandoned (0 = criminal decision made; 1 = crime abandoned). Detection after a criminal decision is made (detection by police) was calculated as a binary variable for those who made a criminal decision (0 = crime detected; 1 = crime successful). Table 5 presents the variables used in this study.
After beginning the experiment, participants familiarized themselves with the virtual space, perceived their surrounding environment, and searched for potential targets. The physical environment evaluated by participants during the criminal decision-making process was measured using the eye tracker. Figure 10 presents the experimental process from the identification of a target to the making of a decision. Figure 11 and Figure 12 present the examples of virtual environment and gaze fixation. Figure 13 presents examples of gaze heatmaps.

3. Results

3.1. Eye-Tracking Results

Eye-tracking data on each AOI were produced from the experiment results of the 20 participants, and the importance of the factors considered by participants when actually committing a crime was deduced by analyzing each AOI category (Table 6).
As Table 6 shows, the AOI that received the most attention from participants in terms of gaze time and frequency and fixation count was signs of territoriality (TE1), which scored the highest average ratios of gaze time (0.091315) and fixation count (0.224065). As such, participants tended to subconsciously fix their gaze on signs of territoriality longer and more frequently than other AOIs. Conversely, private parking spaces (NA6) yielded the lowest values, with an average gaze time ratio of 0.014475 and average fixation count ratio of 0.037320.
The average ratio of time spent divided by the average ratio of fixation count (Avg ratio A/Avg ratio B) reflects how carefully a participant observed each AOI while gazing at it. Of the possible AOIs, visibility from the main street (NA5) yielded the highest value and was the most carefully observed AOI during the experiment. In contrast, territoriality divided by see-through fences (TE2) yielded the lowest value, with participants quickly shifting their gaze to consider other AOIs.

3.2. Correlation Analysis of Independent Variables

This study analyzed the correlations between the identified AOIs and independent variables. When the p-value is smaller than 0.05 in correlation analysis, the correlation between variables is above 0. Correlation between variables is considerably high when the absolute value of the Pearson coefficient is over 0.7, indicating high multicollinearity in subsequent regression analyses. Table 7 presents the correlation analysis results.
According to the eye-tracking data, building entrances (NA1), exposed balconies and verandas (NA2), and surveillance windows (NA3) exhibit a high Pearson coefficient and p-values below 0.01, indicating that these independent variables have the same effect. Data indicate that potential offenders perceive several elements of a building simultaneously, particularly when windows are situated near entrances and the building has balconies.
Results show a significant correlation between signs of territoriality (TE1) and building entrance (NA1) at 0.992 (p < 0.01). This can be explained by the fact that these elements will be cognized simultaneously, with signs and notices displaying territoriality typically installed close to street-side entrances. Results also reveal a high correlation between territoriality defined by see-through fences (TE2) and exposed balconies and verandas (NA2), surveillance windows (NA3), and first-floor windows (NA4), attributable to the fact that both windows and verandas are included in the region defined by see-through fences.

3.3. Logistic Regression Analysis

Regression analysis was conducted to examine the extent to which independent variables affect the dependent variable. As the dependent variable in this study is categorical data, logistic regression analysis is an appropriate means of verifying whether the independent variables have a significant effect on the dependent variable. Logistic regression analysis does not directly predict the occurrence of an event but indicates the probability of the event happening. Accordingly, its value ranges from 0 to 1. A resulting dependent variable value—that is, the probability—greater than 0.5 indicates that the event will occur, while a value lower than 0.5 indicates that the event will not occur.
This study conducted logistic regression analysis to examine the effect of each AOI category on the criminal decision-making process using variables exhibiting high correlations between eye-tracked factors, as identified by the correlation analysis. In this respect, visibility from the main street (NA5) and maintenance of streets (MA1) were excluded from the regression analysis because they showed a high correlation with most natural surveillance factors, which could cause misinterpretation due to multicollinearity. Entrances adjacent to streets (NA1) was also excluded due to a high correlation between this variable and balconies (NA2), windows exposed to streets (NA3), and signs indicating private territoriality (TE1). First-floor windows adjacent to the street (NA4) was analyzed separately as this variable indicated no significant correlations with other variables, and because first-floor windows provide a means of surveillance that differs from that provided by second-floor and side windows, which are not adjacent to the street. Therefore, the independent variables analyzed in this study were limited to NA2, NA3, NA4, NA6, SS1, and TE1.
First, the Hosmer–Lemeshow test was conducted to assess the model’s goodness-of-fit using the measured data (Table 8). The Hosmer–Lemeshow test is a goodness-of-fit test deeming a hypothetical model a good fit for the data if the p-value is greater than 0.05. If the model passes the goodness-of-fit test, the results of the logistic regression analysis can be considered significant. The test produced a p-value of 0.477, which is considerably greater than ⍺ = 0.05 and confirms goodness-of-fit.
Table 9 presents the model’s prediction accuracy, with classification accuracy indicating how well the measured data were predicted by comparing the observed and predicted values. A score of 0 (zero) signifies that a criminal decision was made, while a score of 1 signifies that a criminal decision was not made. The model classified the six participants who made criminal decisions and the two participants who abandoned criminal behavior at a 75.0% probability. Conversely, the three participants who abandoned criminal behavior and the nine who made criminal decisions were accurately classified at a rate of 75.0%. Therefore, 75.0% of the 20 participants were accurately classified as individuals who made criminal decisions, as were 75.0% of those who abandoned crime. The results in Table 9 indicate that the model has an accuracy of 75% and is able to predict criminal decision-making at a probability of 75%.
Multivariate logistic regression analysis was conducted to estimate the coefficient (B), its standard error (S.E.), p-value, odds ratio (Exp(B)), and the confidence interval for the odds ratio. Table 10 presents the results of the logistic regression analysis.
Among the variables measured through the eye tracker, variables NA2, NA3, NA4, and TE1 had p-values smaller than ⍺ = 0.05, indicating that each AOI category impacting criminal decision-making is statistically significant. The constant term is not significant because its p-value is greater than ⍺ = 0.05 at 0.129.
The variable NA2, which is the estimated coefficient (0.558) of the time of fixation on balconies and verandas, is the value estimating the change in whether or not to make a criminal decision per ln(P(criminal decision made)/P(criminal decision not made), assuming other covariates to be constant. The variable NA3, which is the estimated coefficient (0.525) of the time of fixation on windows exposed to streets, is the value estimating the change in making a criminal decision compared to not making a criminal decision per ln(P(criminal decision made)/P(criminal decision not made), assuming other covariates to be constant. The variable NA4, which is the estimated coefficient (1.613) of the time of fixation on the first-floor windows adjacent to streets, is the value estimating the change in making a criminal decision compared to not making a criminal decision per ln(P(criminal decision made)/P(criminal decision not made), assuming other covariates to be constant. The variable TE1, which is the estimated coefficient (0.700) of the time of fixation on signs indicating private territoriality, is the value estimating the change in making a criminal decision compared to not making a criminal decision per ln(P(criminal decision made)/P(criminal decision not made), assuming other covariates to be constant.
The odds ratio (1.747) of the variable NA2 is greater than 1, indicating that the odds of not making a criminal decision increase 1.747-fold for every 0.495 s (coding category/average experiment time) spent fixated on balconies and verandas. The odds ratio (1.691) of NA3 is greater than 1, indicating that the odds of not making a criminal decision increase 1.691-fold for every 1.077 s (coding category/average experiment time) spent fixated on windows exposed to streets. The odds ratio (5.019) of NA4 is much greater than 1, indicating that the odds of not making a criminal decision increase 5.019-fold for every 1.196 s (coding category/average experiment time) spent fixated on first-floor windows adjacent to streets. This indicates that windows installed adjacent to streets where crimes occur have a considerable effect on criminal decision-making based on natural surveillance. Finally, the odds ratio (2.019) of TE1 is greater than 1, indicating that the odds of not making a criminal decision increase approximately twofold for every 1.78 s (coding category/average experiment time) spent fixated on signs marking territoriality.

4. Discussion

4.1. Discussion

This study identifies and examines factors influencing criminal decision-making in potential street robbery scenarios in a virtual environment. This study’s methodology and results differ from those in extant studies in three ways. First, this study deduces a new type of quantitative data. The quantitative data on physical aspects used in previous research tend to be limited to the number and size of street environment factors, which can be measured within a given space or buffer and have been used together with social, economic, and behavioral factors in large-scale analyses. This study used an eye tracker to assess hitherto unexplored street environment elements influencing the criminal decision-making process. The results of this study can thus be differentiated from those of existing research based on the revealing how the deduced quantitative data directly and significantly impact criminal decision-making.
Second, this study differs from the extant literature in its demonstration of the influence of the physical environment on people’s decision-making. Several studies have examined the influence of the physical environment on people and crime using Google Street View. However, this approach is limited insofar as Street View can only be viewed from automobile-accessible streets and cannot provide temporal variables—such as pedestrians and traffic—that influence criminal decision-making [37,38,39]. In this respect, the use of VR has an advantage insofar as it provides an experience of the physical environment by allowing study participants to freely explore the space.
Third, this study differs from others by using an already developed VR. Previous studies have discussed the use of virtual environments in various ways, with investigations of the psychological factors of criminals made possible by realizing the psychological environment experienced by criminals through VR. As van Gelder [31] notes, the use of VR enables the analysis of criminal behavior by providing an alternative that is able to replicate real environmental factors. Previous studies have used VR to examine burglary, which requires replicating a relatively small space. However, research on street robbery has been limited by the financial and technological difficulties of replicating a city environment. This study overcame such obstacles by replicating a street robbery scenario in the already established VR of GTA5.
The results of this study can be utilized in two ways. First, crime prediction constitutes a significant area of study in contemporary criminal research. For instance, the crime data organized and analyzed by CompStat, a crime statistics system, have been used by programs such as PredPol and HunchLab to predict and reduce crime. CompStat crime data are recorded after the incident based on the reports and testimony of victims. Comprising only basic information such as the location and time of the crime, such data have limited utility for micro-level analysis. Measuring the street environment factors that impact criminal decision-making from a criminal’s perspective, the results of this study provide a new type of analytical data on micro-level factors that will enable more accurate crime prediction when used in a crime prediction system.
Second, the findings of this study can be used as reference data when establishing future CPTED evaluation criteria. As the odds of committing a crime fall with the rise in the amount of time a criminal fixates on street environment factors influencing criminal decision-making, it is anticipated that CPTED standards will be established based on the extent to which each factor is exposed on the streets.

4.2. Limitations and Themes For Future Research

Studies utilizing eye-tracker and VR technology face several limitations, with such research being at an elementary stage. The primary objective of studies utilizing VR is to investigate the extent to which criminal behavior and social factors can be replicated through VR, and whether resulting findings are plausible. Such studies essentially analyze the correlation between study results derived from VR and actual crimes. Moreover, in terms of bounded rationality, street robbers’ criminal decision-making cannot depend only on the rational choice of the offender. However, this study controlled for the social, economic, and ecological factors influencing criminal decision-making. This issue must be addressed in future research.
The reliability and extent to which participants’ cognition of physical factors replicated in a virtual environment relate to reality can be considered a controversial element of this study. This limitation is shared with other studies employing virtual environments; reliability increases in accordance with the similarity of the virtual environment to reality, and the degree to which participants are able to cognize it in a manner similar to reality. In their study using a virtual environment, van Gelder et al. [31] noted that participants lacked sufficient cognizance of the environment due to the absence of virtual entities other than themselves. In the case of GTA5, the existence of virtual entities with individual AIs assisted in replicating a crime scene more closely resembling the actual environment. The presence of virtual entities is especially helpful in replicating the psychological pressure felt by criminals in a crime scenario. VR technology is constantly being developed and becoming increasingly similar to reality. Therefore, the reliability of study results using VR is anticipated to improve in the near future. Moreover, according to Van Sintemaartensdijk et al. [37], when establishing a virtual environment incorporating eye-tracking, researchers need to test the extent to which such elements are clearly visible and whether the gaming experience influences the speed of detection. This should lead to superior automatic recognition by participants, producing more significant results at a behavioral level.
Another limitation of this study involves the design of the research environment: study participants were university students in their twenties and not actual criminals. It is realistically impossible to conduct an experiment with actual criminals as the subjects. While scholars like Garwood (2011), Halsey and White (2008), and Holifreter et al. (2010) advance the potential for university students to commit street robbery, the measurement of their latency is limited. Although this study was conducted on the premise that there is a possibility that the participants could commit a crime, there is a clear difference between the awareness of students and first-time street robbers and that of experienced street criminals, who have a tendency to be bolder and less limited by moral conscience. As such, a research method that controls for these variables is required.
This study is also limited with respect to the number of participants. This study conducted regression analysis with 20 students; however, results would have greater impact if the experiment were conducted with a larger sample. Moreover, the regression model did not consider multi-collinearity. Consequently, this study only derives possible explanations regarding the relativity between dependent and independent variables. In order to produce more useful regression equations, future studies should be conducted with more participants to yield more accurate results. The correlations among variables must also be considered to produce more significant results.
The degree to which participants can freely control their virtual avatar in a virtual environment may also affect the accuracy of results. While analysis indicated that game proficiency does not impact research results, there is certainly a difference in the cognition of virtual environment between individuals who are skilled at playing video games and those who are not. Immersion is extremely important in virtual environment research (as discussed in previous research), and it is necessary to consider situations where participants may not be able to adequately cognize a virtual space due to differences in individual proficiency with virtual environments.
Future studies should also consider participants’ personal behavior and social factors. According to Monk [1], street criminals tend to target those who appear to possess valuable goods, with individual differences in perspective when selecting targets. Moreover, various social variables influence street criminals, such as targeting a specific racial group or selecting vulnerable targets. Social factors merit further consideration for a number of reasons; for instance, the virtual environment used in this study was based on LA, while the participants comprised citizens from the Republic of Korea. Additionally, there may be social and cultural differences among the participants. Although this study was conducted after controlling for factors other than those in the physical environment, this is a problem that must be overcome in future research.
The research scope of this study was a residential area in an urban center in the United States. While street robbery mainly occurs in urban centers, street robbery near the main street is markedly different from that in residential areas and is subject to numerous environmental effects such as the surrounding traffic and presence of commercial areas [12]. In order to explore these micro-level stages, research must be conducted in a virtual environment created through numerous case studies involving analyses of the urban scale moving on to the street scale.
As noted, current crime data consist of fairly simple locational information. If criminal research is to advance, crime data comprising more accurate and micro-level information are necessary. Accurate crime data enable the analysis of criminals’ social, cultural, and behavioral factors. Locational data of individual criminal behavior will allow for more comprehensive micro-level crime research by enabling the understanding of future crime environments.
Finally, while a combination of eye-tracking technology and VR allows for the assessment of the speed of crime detection; this feature was unavailable for the current study [33]. Accordingly, future crime research should examine the speed of crime detection using eye-tracking technology integrated with VR, thereby enhancing our understanding of the deterrent effect of guardianship while testing automatic recognition at a behavioral level [36].

4.3. Conclusions

This study demonstrates the use of eye-tracker technology to measure the amount of time and frequency with which street robbers fix their gaze on physical factors influencing criminal decision-making. This study quantitatively measured the physical factors that significantly impact criminal decision-making as a new technique and confirmed its utility in actual crime research by verifying the results through various types of statistical analysis. In doing so, this study contributes to the literature in two ways.
First, this study replicated criminal behavior in VR and identified common street environment factors from those recognized by previous studies using eye-tracker technology. Results show that balconies and verandas adjacent to streets, first-floor windows adjacent to streets, and signs and notices reinforcing territoriality are street environment factors that significantly influence criminal decision-making. While not significantly impactful, other street environment elements affected each participant in a different way.
Second, this study suggested the possibility of predicting street robbery occurrence based on the amount of time participants’ gazes were fixed on physical factors significantly impacting criminal decision-making. The longer the time of gaze fixation on street environment factors that significantly affect criminal decision-making, the higher the chance of not making a criminal decision. This finding could become an important standard for determining the physical features that must be exposed to reduce crime when designing buildings in spaces next to streets.

Author Contributions

Conceptualization, J.w.Y. and S.J.; Methodology, J.w.Y. and D.K.; Software, J.w.Y.; Validation, S.J.; Formal Analysis, J.w.Y. and D.K. and S.J.; Investigation, J.w.Y. and D.K.; Resources, D.K.; Data Curation, J.w.Y. and D.K.; Writing—Review & Editing, J.w.Y.; Visualization, J.w.Y.; Supervision, D.K. and S.J.; Project Administration, S.J.; Funding Acquisition, S.J. All authors have read and agreed to the published version of the manuscript.

Funding

This work was supported by the National Research Foundation of Korea (NRF) grant funded by the Korean Government (MSIT) (No. NRF-2018R1A2B2005528).

Conflicts of Interest

The authors declare no conflict of interest.

References

  1. Monk, K.M.; Heinonen, J.A.; Eck, J.E. Street Robbery; Department of Justice, Office of Community Oriented Policing Services: Washington, DC, USA, 2010.
  2. Weisburd, D. The law of crime concentration and the criminology of place. Criminology 2015, 53, 133–157. [Google Scholar] [CrossRef]
  3. Weisburd, D.; Amram, S. The law of concentrations of crime at place: The case of Tel Aviv-Jaffa. Police Pract. Res. 2014, 15, 101–114. [Google Scholar] [CrossRef]
  4. Andresen, M.A.; Malleson, N. Testing the stability of crime patterns: Implications for theory and policy. J. Res. Crime Delinq. 2011, 48, 58–82. [Google Scholar] [CrossRef]
  5. Curman, A.S.; Andresen, M.A.; Brantingham, P.J. Crime and place: A longitudinal examination of street segment patterns in Vancouver, BC. J. Quant. Criminol. 2015, 31, 127–147. [Google Scholar] [CrossRef] [Green Version]
  6. Bennett, T. Situational crime prevention from the offender’s perspective. In Situational Crime Prevention: From Theory to Practice; Heal, K., Laycock, G., Eds.; Her Majesty’s Stationary Office: London, UK, 1986; pp. 41–52. [Google Scholar]
  7. Shariati, A.; Guerette, R.T. Situational crime prevention. In Preventing Crime and Violence; Teasdale, B., Bradley, M.S., Eds.; Springer International Publishing: Cham, Switzerland, 2017; pp. 261–268. [Google Scholar]
  8. Armitage, R.; Monchuk, L. What is CPTED? Reconnecting theory with application in the words of users and abusers. Policing 2017, 13, 312–330. [Google Scholar] [CrossRef]
  9. Cohen, L.; Felson, M. Social change and crime rate trends: A routine activity approach. Am. Sociol. Rev. 1979, 44, 588–608. [Google Scholar] [CrossRef]
  10. Haberman, C.P.; Ratcliffe, J.H. Testing for temporally differentiated relationships among potentially criminogenic places and census block street robbery counts. Criminology 2015, 53, 457–483. [Google Scholar] [CrossRef]
  11. U.S. Department of Justice. Criminal Victimization in the United States, 2007, Statistical Tables: National Crime Victimization Survey; US Department of Justice, Office of Justice Program: Washington, DC, USA, 2007.
  12. U.S. Department of Justice. Criminal Victimization in the United States, 2005, Statistical Tables: National Crime Victimization Survey; US Department of Justice, Office of Justice Program: Washington, DC, USA, 2005.
  13. Piotrowski, P. Street robbery offenders: Shades of rationality and reversal theory perspective. Ration Soc. 2011, 23, 427–451. [Google Scholar] [CrossRef]
  14. Clarke, R.V.G.; Felson, M. (Eds.) Routine Activity and Rational Choice; Transaction Publishers: Piscataway, NJ, USA, 1993; Volume 5. [Google Scholar]
  15. Wright, R.T.; Decker, S.H. Armed Robbers in Action: Stickups and Street Culture; Northeastern University Press: Boston, MA, USA, 1997. [Google Scholar]
  16. Boudon, R. Limitations of rational choice theory. Am. J. Sociol. 1998, 104, 817–828. [Google Scholar] [CrossRef]
  17. Green, D.; Shapiro, I. Pathologies of Rational Choice Theory: A Critique of Applications in Political Science; Yale University Press: New Haven, CT, USA, 1996. [Google Scholar]
  18. Robles, J.M. Bounded rationality: A realistic approach to the decision process in a social environment. Theoria 2007, 16, 41–48. [Google Scholar]
  19. Hwang, Y.; Jung, S.; Lee, J.; Jeong, Y. Predicting residential burglaries based on building elements and offender behavior: Study of a row house area in Seoul, Korea. Comput. Environ. Urban 2017, 61, 94–107. [Google Scholar] [CrossRef]
  20. Cozens, P.; Love, T. A Review and Current Status of Crime Prevention through Environmental Design (CPTED). J. Plan. Lit. 2015, 30, 393–412. [Google Scholar] [CrossRef]
  21. Cozens, P.M.; Saville, G.; Hillier, D. Crime prevention through environmental design (CPTED): A review and modern bibliography. Prop. Manag. 2005, 23, 328–356. [Google Scholar] [CrossRef] [Green Version]
  22. Lee, I.; Jung, S.; Lee, J.; MacDonald, E. Street crime prediction model based on the physical characteristics of a streetscape: Analysis of streets in low-rise housing areas in South Korea. Environ. Plan. B 2019, 46, 862–879. [Google Scholar] [CrossRef]
  23. Zelinka, A.; Brennan, D. SafeScape. Creating Safer, More Livable Communities through Planning and Design; American Planning Association: Chicago, IL, USA, 2001. [Google Scholar]
  24. Brown, B.B.; Burton, J.R.; Sweaney, A.L. Neighbors, households, and front porches: New urbanist community tool or mere nostalgia? Environ. Behav. 1998, 30, 579–600. [Google Scholar] [CrossRef]
  25. Greenberg, S.W.; Rohe, W.M.; Williams, J.R. Safety in urban neighborhoods: A comparison of physical characteristics and informal territorial control in high and low crime neighborhoods. Popul. Environ. 1982, 5, 141–165. [Google Scholar] [CrossRef]
  26. Foster, S.; Giles-Corti, B.; Knuiman, M. Creating safe walkable streetscapes: Does house design and upkeep discourage incivilities in suburban neighborhoods? J. Environ. Psychol. 2011, 31, 79–88. [Google Scholar] [CrossRef]
  27. Perkins, D.D.; Wandersman, A.; Rich, R.C.; Taylor, R.B. The physical environment of street robbery: Defensible space, territoriality and incivilities. J. Environ. Psychol. 1993, 13, 29–49. [Google Scholar] [CrossRef]
  28. Brown, B.B.; Perkins, D.D.; Brown, G. Crime, new housing, and housing incivilities in a first-ring suburb: Multilevel relationships across time. Hous. Policy Debate 2004, 15, 301–345. [Google Scholar] [CrossRef]
  29. Dibbell, J. My Tiny Life: Crime and Passion in a Virtual World; Holt Publishers: New York, NY, USA, 1998. [Google Scholar]
  30. Filipowicz, A.; Liu, J.; Kornhauser, A. Learning to Recognize Distance to Stop Signs Using the Virtual World of Grand Theft Auto 5. In Proceedings of the TRB annual meeting 2917, Washington, DC, USA, 8–12 January 2017. No. 17-05456. [Google Scholar]
  31. Van Gelder, J.L.; Otte, M.; Luciano, E.C. Using virtual reality in criminological research. Crime Sci. 2004, 3, 10. [Google Scholar] [CrossRef] [Green Version]
  32. Wedel, M.; Pieters, R. Eye tracking for visual marketing. Found. Trends Mark. 2008, 1, 231–320. [Google Scholar] [CrossRef] [Green Version]
  33. Noland, R.B.; Weiner, M.D.; Gao, D.; Cook, M.P.; Nelessen, A. Eye-tracking technology, visual preference surveys, and urban design: Preliminary evidence of an effective methodology. J. Urban 2016, 10, 1–13. [Google Scholar] [CrossRef]
  34. Groff, E.R. Simulation for theory testing and experimentation: An example using routine activity theory and street robbery. J. Quant. Criminol. 2007, 23, 75–103. [Google Scholar] [CrossRef]
  35. Klaus, P.A. Crimes against Persons Age 65 or Older, 1992–1997; US Department of Justice, Office of Justice Programs (Bureau of Justice Statistics): Washington, DC, USA, 2000.
  36. Van Sintemaartensdijk, I.; van Gelder, J.L.; van Prooijen, J.W.; Nee, C.; Otte, M.; van Lange, P. Mere presence of informal guardians deters burglars: A virtual reality study. J. Exp. Criminol. 2020, 14, 1–20. [Google Scholar] [CrossRef] [Green Version]
  37. Vandeviver, C. Applying Google Maps and Google Street View in criminological research. Crime Sci. 2014, 3, 13. [Google Scholar] [CrossRef]
  38. Rundle, A.G.; Bader, M.D.M.; Richards, C.A.; Neckerman, K.M.; Teitler, J.O. Using Google Street View to audit neighborhood environments. Am. J. Prev. Med. 2011, 40, 94–100. [Google Scholar] [CrossRef] [Green Version]
  39. He, L.; Páez, A.; Liu, D. Built environment and violent crime: An environmental audit approach using Google Street View. Comput. Environ. Urban 2017, 66, 83–95. [Google Scholar] [CrossRef]
Figure 1. Comparison between the virtual environment of Grand Theft Auto 5 (GTA5) (top) and the real world (bottom).
Sustainability 12 07419 g001
Figure 2. GP3 Gazepoint Eye Tracker.
Sustainability 12 07419 g002
Figure 3. Calibration process of the eye tracker.
Sustainability 12 07419 g003
Figure 4. Street robbery scenario.
Sustainability 12 07419 g004
Figure 5. Typical physical elements in an LA residential area: (01) see-through fence; (02) building entrance; (03) first-floor window; (04) surveillance window; (05) balcony; (06) sign indicating territoriality; and (07) parking lot.
Sustainability 12 07419 g005
Figure 6. Typical physical elements in an LA residential area: (01) see-through fence; (02) building entrance; (03) first-floor window; (04) surveillance window; (05) balcony; (06) sign indicating territoriality; and (07) parking lot.
Sustainability 12 07419 g006
Figure 7. Scope of virtual environment.
Sustainability 12 07419 g007
Figure 8. Crime Prevention Through Environmental Design (CPTED) factors.
Sustainability 12 07419 g008
Figure 9. Area of Interest (AOI) categories in VR; (a) 01. Balcony (NA2). 02. First-floor window (NA4). 03. Entrance adjacent to the street (NA1); (b) 01. Balcony (NA2). 02. First-floor window (NA4). 03. Entrance adjacent to the street (NA1); (c) 01. See-through fence (TE2); (d) 01. Alley (SS1); (e) 01. Degree of maintenance of the street environment (MA1); (f) 01. Parking lot (MA6).
Sustainability 12 07419 g009aSustainability 12 07419 g009b
Figure 10. Experimental process: (a) Time is measured starting from the moment the participant’s gaze fixes on a target; (b) the AOI of each physical factor in the street environment is measured; (c) criminal decision-making occurs.
Sustainability 12 07419 g010
Figure 11. Examples of the virtual environment.
Sustainability 12 07419 g011
Figure 12. Examples of gaze fixation.
Sustainability 12 07419 g012
Figure 13. Examples of gaze heatmaps.
Sustainability 12 07419 g013
Table 1. Factors Affecting Street Robbery.
CategoryFactorDefinition
Criminal behaviorRational choiceStreet criminals decide on criminal intent after rationally considering the monetary advantages and disadvantages of committing the crime.
Ecological factorsThe unpredictable behavior and mentality of criminals when committing the crime.
Examples include impulsiveness, mistakes, ethical consciousness of criminal behavior, street culture, alcohol consumption, psychoactive substance abuse, collective behavior, and simple behavior [14].
Surrounding situationPhysical factorsPhysical factors of the street environment that influence street criminal decision-making (CPTED).
Social factorsSocial characteristics that influence criminal decision-making (e.g., population density, community, and racial diversity).
Economic factorsDegree to which economic level influences street robbery decision-making. Most street criminals commit crimes for money and other valuables.
Temporal factorsPeople’s behavioral patterns are affected by routine activities and relate to changes in time. The definition of the behavioral pattern is based on the temporal factors.
Table 2. Participant Statistics.
NMinMaxMeanS.D.
Age20262927.750.967
Monthly allowance (KRW 10,000)20301005820.673
VR control proficiency206107.551.356
Table 3. Regression Result of Monthly Allowance and Control Proficiency of the Participants in Relation to Criminal Decision-Making Outcome.
BS.E.WalsDegree of Freedomp-ValueExp(B)95% Confidence Interval for Exp(b)
MinMax
Monthly allowance0.4870.3132.41710.1201.6270.8813.005
Constant−1.2981.1391.29910.2540.273
Control proficiency0.4470.3931.2920.10.2561.5630.7233.377
Constant−2.9252.9290.99810.3180.054
Table 4. Measured CPTED Factors According to CPTED Theory.
CategoryComponents in VRType
Natural surveillanceNA1. Buildings with entrances exposed to the street
(Eye-tracking data on buildings with entrances exposed to the street)
Continuous
NA2. Exposed balconies or verandas
(Eye-tracking data on exposed balconies or verandas)
Continuous
NA3. Windows exposed to the street
(Eye-tracking data on windows visible from the street)
Continuous
NA4. First-floor windows adjacent to the street
(Eye-tracking data on windows adjacent to the street)
Continuous
NA5. Visibility from main streets
(Eye-tracking data on main street traffic)
Continuous
NA6. Presence of a parking lot
(Eye-tracking data on public parking lots)
Continuous
Spatial structureSS1. Alleys and open spaces
(Eye-tracking data on alleys and open spaces)
Continuous
SS2. Presence of alleys near the crime scene
(0 = Escape via the alleyway after committing crime; 1 = Escape through other means after committing crime)
Categorical
TerritorialityTE1. Signs indicating private territory
(e.g., signs and murals)
Continuous
TE2. Territoriality defined by see-through fences
(Eye-tracking data on a territory’s interior via see-through fences)
Continuous
MaintenanceMA1. Degree of maintenance of the street environment
(Eye-tracking data on trash and incivilities)
Continuous
Table 5. Description of the Variables.
VariableDescriptionType
Time of fixation(s)Amount of time the participant’s gaze remains fixated on an AOI during the experiment.Scale
Time of fixation/Total experiment timeRatio of time for fixation divided by the total experiment time; expressed as a ratio due to variation in experiment times.Scale
Total number of fixations on AOIMeasures the number of times a participant’s gaze is fixed on a single AOI.Scale
Total number of fixations on AOI/Total experiment timeExpressed as a ratio due to variation in experiment times. Scale
Criminal decision-makingDecision to commit street robbery during the experiment (0 = criminal decision made; 1 = criminal decision not made).Category
Crime detectionDetection after crime is committed (0 = detected; 1 = not detected).Category
Table 6. Descriptive Statistics of Eye-Tracking Results.
AOI CategoryRatio of Time Spent
Time Spent/Total Experiment Time (Ratio A)
Ratio of Fixation Count
Fixation Counts/Total Experiment Time (Ratio B)
Avg Ratio A/Avg Ratio B
AvgSDAvgSD
NA10.0554000.01397460.1329200.02322090.416792
NA20.0294450.00729890.0673150.13786600.437421
NA30.0505750.1759200.1330350.04742120.380163
NA40.0418400.01728310.1063750.04327380.393325
NA50.0583600.2872910.1291500.05330040.451878
NA60.0144750.00750360.0373200.01786880.387860
SS10.0557500.02568590.1291500.05330040.431669
TE10.0913150.02865070.2240650.05848410.407538
TE20.0730650.01888560.1939400.03910370.376740
MA10.0503550.2213800.1231900.05396190.408759
AOI Category Abbreviation
NA1: Building with entrances exposed to the street.NA6: Presence of alleys near the crime scene.
NA2: Exposed balconies or verandas.SS1: Alleys and open spaces.
NA3: Windows exposed to the street.TE1: Signs indicating private territory.
NA4: First-floor windows adjacent to the street.TE2: Territoriality defined by see-through fences.
NA5: Visibility from main streets.MA1: Degree of maintenance of the street environment.
Note. Average of total experiment time = 170.8 (s).
Table 7. Correlation Analysis Results.
NA1NA2NA3NA4NA5NA6SS1TE1TE2MA1
NA1-
NA20.872 **-
NA30.920 **0.683 **-
NA40.576 **0.3810.423-
NA50.865 **0.773 **0.889 **0.144-
NA6−0.137−0.315−0.0590.234−0.448-
SS1−0.390−0.586 **−0.131−0.588 **−0.1850.432-
TE10.922 **0.3080.588 **−0.3120.689 **0.0640.542 *-
TE20.461 *0.749 **0.900 **0.699 **−0.517 *−0.115−0.517 *0.197-
MA1−0.778 **−0.466 *−0.831 **−0.722 **−0.642 **0.1050.387−0.141−0.922 **-
AOI Category Abbreviation
NA1: Building with entrances exposed to the street.NA6: Presence of alleys near the crime scene.
NA2: Exposed balconies or verandas.SS1: Alleys and open spaces.
NA3: Windows exposed to the street.TE1: Signs indicating private territory.
NA4: First-floor windows adjacent to the street.TE2: Territoriality defined by see-through fences.
NA5: Visibility from main streets.MA1: Degree of maintenance of the street environment.
Note. * p < 0.05, ** p < 0.01.
Table 8. Hosmer–Lemeshow Test Results.
Chi-SquareDegree of Freedomp-Value
Hosmer–Lemeshow test3.90130.272
Table 9. Classification of Model Prediction Accuracy.
Observed ValuePrediction
Crime DecisionClassification Accuracy %
01
Stage 1Crime decision06275.0
13975.0
Total percentage 75.0
Note. The cut-off value is 0.500.
Table 10. Logistic Regression Results.
BS.E.WalsDegree of Freedomp-ValueExp(B)95% Confidence Interval for EXP(B)
MinMax
NA20.5580.2684.12810.0371.7471.0332.954
NA30.5250.2594.10210.0431.6911.0172.812
NA41.6130.7684.40810.0365.0191.11322.627
NA60.2670.2111.60310.2051.3060.8641.973
SS10.2660.1921.91410.1671.3050.8951.902
TE10.7000.2676.85710.0092.0131.1923.400
Constant term−1.4160.9322.30410.1290.243
AOI Category Abbreviation
NA1: Building with entrances exposed to the street.NA6: Presence of alleys near the crime scene.
NA2: Exposed balconies or verandas.SS1: Alleys and open spaces.
NA3: Windows exposed to the street.TE1: Signs indicating private territory.
NA4: First-floor windows adjacent to the street.TE2: Territoriality defined by see-through fences.
NA5: Visibility from main streets.MA1: Degree of maintenance of the street environment.

