Article

Team Management, Diversity, and Performance as Key Influencing Factors of Organizational Sustainable Performance

by
Elena Cizmaș
1,*,
Emőke-Szidónia Feder
2,
Mădălina-Dumitrița Maticiuc
1,* and
Silvia Vlad-Anghel
1
1
Management Department, Faculty of Economics and Business Administration, West University of Timișoara, 300115 Timișoara, Romania
2
Marketing and International Economic Relations Department, Faculty of Economics and Business Administration, West University of Timișoara, 300115 Timișoara, Romania
*
Authors to whom correspondence should be addressed.
Sustainability 2020, 12(18), 7414; https://doi.org/10.3390/su12187414
Submission received: 17 August 2020 / Revised: 4 September 2020 / Accepted: 7 September 2020 / Published: 9 September 2020
(This article belongs to the Section Sustainable Management)

Abstract

:
This paper examines the effects of management functions on the performance of diverse teams working on projects in the Information Technology (IT) industry, as well as the impact of their performance on organizational sustainable performance. Grounded on organizational management and work team management specific empirical studies and literature, we clarified the content of management functions in the framework of teamwork and acknowledged manners to express the performance of teams distinguished through diversity, as well the most relevant positive effects of team results on organizational performance. On the above basis, we built the online questionnaire. The study involved 189 respondents, who work either in Romania or in the Czech Republic on IT field specific projects. Empirical results show that, individually, some management functions are connected with co-workers’ and teams’ performance, while others are not, but considered together, in interdependence with joint effects, they influence the team’s performance and the organization’s performance from the perspective of its sustainable strategic competencies.

1. Introduction

Nowadays, organizations’ operational environment has become increasingly dynamic and complex, especially as a result of globalization and digitalization phenomena. In order to meet the requirements of such an environment, companies have developed organic structures to increase their flexibility [1], become more flattened and decentralized, reduced their degree of formalization, and favored competence-based authority and organized work in teams. In this context, numerous companies hire employees from different cultures and countries, with cultural diversity having a crucial impact on the management of work teams [2].
A work team can be considered as a set of people with specific complementary competences, who interact regularly for a certain period of time, in the context of a mutual dependence determined by the pursuit of one or more common goals, of which achievement all members feel mutually responsible [3]. In mono-cultural teams, members come from the same cultural milieu and share identical values, while within multicultural teams they come from different cultural contexts.
The literature is rich in research and point of views on the factors that influence the performance of teams. Studies show that team performance depends on a multitude of factors: The task entrusted to the team, the available resources, the organizational context in which it evolves, the diversity of members, the differentiated levels of knowledge in the common language of communication, the operational processes of the team, etc. [4,5].
From the consulted literature, especially in the empirical research field, it appears that the factor mostly correlated with team performance is diversity, although these studies show conflicting findings. Some research [6] reports that the impact of diversity on team performance cannot be anticipated, other studies [7] present the lack of statistical significance for the effects of diversity on team performance or argue that there is no direct linkage between diversity and performance [8,9,10], while some investigations [11,12] highlight the negative effects of diversity, such as risks of conflicts and cohesion issues. However, other studies [13,14] emphasize that the diversity of knowledge, skills, perspectives on the situation, competencies, professional specialization, and work experience existing in culturally diverse teams lead to an increase in their performance.
Regarding cultural diversity, some researchers explain these contradictory results in terms of the analyzed types and characteristics of cultural differentiation, such as surface-level (like ethnicity or country-of-origin) or deep-level (as values or attitudes associated with culture) elements considered within the studies [15]. Similarly, Bui et al. [16] shows that social diversity may lead to negative stereotypes and attitudes towards other members and may have negative consequences on performance, while differences in knowledge, skills, and abilities have positive effects on team performance. However, Díaz-Fernandez et al. [17] consider that inconsistent findings on the influence of top management team diversity on company performance are largely due to inadequate testing methodologies. These contradictory results suggest the necessity to discover moderating factors of the relationship between diversity and performance in order to make pertinent prediction on the performance of diverse teams [18]. Among the moderating factors considered within the studies, work climate, the type of team task, and team management can be acknowledged.
Tirmizi [5], starting from various models on team effectiveness, proposed a theoretical model, without empirical validation, which argues that certain characteristics of culturally diverse teams influence team performance through the climate factors encompassing the following variables: Trust, cohesion, commitment, involvement, and efficacy. Trust has also been linked to team performance by De Jong and Elfring [19], Schraeder et al. [20], and Druskat and Wolff [21] because it facilitates cooperation and collaboration. Likewise, Rezvani et al. [22] demonstrate that team emotional intelligence generates trust increase and reduces conflicts, with these having positive influences on team performance.
Related to the types of team tasks, Jehn et al. [14] demonstrate that demographic diversity (race, ethnicity, gender) generates a high level of team moral in the case of strong interdependence of tasks. Related to tasks, Nouri et al. [18] conducted studies on mono—and bi—cultural small teams of two persons, and found that in the case of interdependent tasks that require performance accuracy, specific and clear tasks help to overcome the negative effects of cultural diversity on cooperation and conflict resolution processes and have a positive effect on performance. If a creative performance is expected, low task specificity facilitates team creativity when the interdependence of the members is low, because it binds them less.
Despite the large number of studies on factors influencing the performance of diverse teams, we ascertain that few of them consider team management as a mediator factor between diversity and performance. Rather, the focus of researchers was on correlating leadership style with team performance [8,23]. Bebenova-Nikolova [24] argues that when cultural diversity is well managed, diversity leads to increased performance, and when ignored, it will negatively influence performance. Similarly, Thomas et al. [25] sustain that management support for appropriate diversity management is positively correlated with performance. This support includes training and team rewards, but the most important recompenses are related to intrinsic motivation, linked to the satisfaction felt as a result of task completion. Tirmizi [5] supports that the team diversity can be an advantage or disadvantage depending on the task and the team activity management manner, along with the idea that task type and member interdependences are variables that influence the success of the team.
Also, cultural diversity and its effects have been frequently analyzed in the academic milieu on student teams [26,27], and less in the framework of companies. Thus, we note the existence of little research on the performance of teams gathered around projects in the IT field, probably due to the fact that these companies are reluctant to provide internal information for fear of competition.
Given the above considerations, we aimed to empirically examine the effects of management functions on performance of heterogeneous teams, especially of teams with cultural diversity attributes and working on IT projects. We proposed to detect which management function has impact on the success of teams working on such projects, but also to identify their joint effect on team-level performance and on organizational performance, given the high interdependency between them. In our research, the definition of performance objectives is made from the perspective of the positive effects of diversity, especially of the cultural diversity.
To achieve the above objective, we assembled our research on the foundation of extant literature and empirical studies in the field of organizational management and work team management, particularly of multicultural teams. Starting from the information in these fields, in Section 2.1 we clarified the content of management functions in the context of culturally diverse teams. The positioning of the issue is sourced from the general content of each management function, from their empirically proved relation with performance and from the impact that the societal culture traits from which the members of multicultural teams come from, or of the organizational culture, may have on the management functions’ operation modes. Thus, after Hofstede’s [28,29] approach, the characteristics of the societal or organizational culture related to Power Distance, Uncertainty Avoidance, Individualism versus Collectivism, Masculinity versus Femininity, and Long-Term versus Short-Term Orientation influence the management of companies and implicit work of teams. For example, the culture in which the manager and team members were formed influences various aspects of management, like goal setting, decision making, as well as the practiced leadership style, which are dependent on the Power Distance level; the need for clarity, structure, rules, and procedures is influenced by the Uncertainty Avoidance dimension; the level of Individualism impacts the orientation towards individual objectives or supporting mostly the team’s objectives and the weight of relationships; the importance given to social values, such as cooperation and work climate quality, are influenced by the Femininity of culture; the Long-term orientation of the organizational culture influences the company’s sustainable development strategy. Additionally, according to the cultural model of Hall [30], the degree of clarity and specificity in defining objectives and tasks depends on cultural habits of communication: In high cultural context, information is implicit, while in low-context cultures, information is explicit, clear, and detailed.
Afterwards, considering that the study of the management–performance relationship is made in the context of teams working on IT projects and that performance is approached from the angle of the positive impact of diversity, in particular of the cultural diversity, we justify our choices based on three arguments.
Firstly, the IT sector is one of the most dynamic segments in all economies, characterized by increased innovativeness, short lifecycle of high-tech products, services, and technologies, along with the rapid diffusion of innovations on multiple foreign markets. The ability of companies to generate innovations in this sector has a direct impact on business in terms of creating sources of competitive advantage, which can help companies to ensure their sustainable growth in the long term [31].
Secondly, a large number of culturally diverse teams work in IT companies and, given that among the positive effects of diversity, presented in detail in Section 2.2, the majority of research on the topic indicate increased learning capabilities, creativity, and innovation of diverse teams, as well as adaptation to new situations [15,32,33], we anticipate a link between the level of innovativeness and adaptation to various markets of multicultural companies in the IT sector and the positive effects of team diversity of those working on projects within them.
Thirdly, as Rezvani et al. [22] argued, tasks in projects foster interaction, collaboration, and communication between team members, idea generation to solve challenges, with all of them leading to the development of members’ soft skills, to synergy creation, and possible development of team’s collective competence.
Consequently, taking into account the above arguments, and based on the principles of the competence-performance theory [22,34], which sustains that skills can lead to effective performance, as well as based on the competency-based management model in the field of human resources, we considered that a chain of competencies can be developed, by aggregating the individual competences of team members and the collective competences of the team, and which generates effective sustainable performance at company level. These aspects are presented in more detail in Section 2.3 of the paper.

2. Theoretical Background

2.1. The Management Functions

Our research interest is related to the influence of diverse work teams’ management on their successful results and on organizational performance. In the literature, we did not find studies that would make this connection in terms of the process approach of the management, respectively of the management functions.
The most numerous explanations given to the management are from the process perspective. Thus, management is the “process by which activities are completed efficiently and effectively, through and with the help of the work activities of others” [35] (p. 28). In the same sense, Certo’s conceptualization of management emerges, as “the process of reaching organizational goals, by working with and through people, as well as with other organizational resources” [36] (p. 11).
The process term corresponds to the managers’ fundamental activities. As a pioneer in the field, Fayol described the management process through five activities or functions exercised by managers, namely: Planning, organizing, commanding, coordinating, and controlling [37]. Regarding the number, content, and name of managerial functions, there is no unanimously accepted point of view. According to Bibu et al. “the management process consists of a set of actions through which the manager plans, organizes, trains, makes decisions, and controls the executing activities of non-managerial employees in order to achieve the objectives of the organization in terms of efficiency and effectiveness” [38] (p. 92). Some theorists in the field maintain the coordination function that appears at Fayol and deal with the following managerial functions: Forecasting/planning, organization, coordination, training-motivation/leading, and evaluation-control [39,40,41,42]. However, the majority of scientific papers in the international literature includes coordination within the organization management function and approach the management process through four main activities performed by managers: Planning, organizing, directing (often called leading), and controlling [35,43].
In terms of content, planning consists of setting goals, establishing strategies, and developing plans to achieve those goals [35,38]. Ford et al. [44] consider planning a critical element for performance. Planning is about making decisions. Involving members in decision making about goals and ways to achieve them is important because it develops trust between co-workers [18]. Other authors [45,46] show that the manner of goal setting for a team influences the development of cohesion between members within multicultural teams. Thus, as already pointed out, cohesion and trust, as climate elements, play a decisive role on team effectiveness [5,21].
However, in the context of multicultural teams, members’ expectations regarding the degree of involvement in setting goals may differ depending on the cultural experience from the origin country and on their previous work experiences, experiences correlated with the accustomed power distance [4]. Also, from the perspective of members’ cultural experience concerning their communication in high/low contexts, Waxin and Barmeyer [4] problematize how explicit the objectives should be set at team level, with specificity being favored in cultures with low context communication. The abovementioned aspects allow us to consider that in the IT field, planning at the level of diverse teams requires the establishment of clear and specific objectives. In order for team goals to be accepted and supported by teammates and to build trust between co-workers, we consider that team goals should be established with the involvement of members and should always have priority over the individual interests and goals.
Organization, as management function, concerns the establishment of tasks and responsibilities, the assignment of human resource responsible for each task [20,35], as well as the allocation of other categories of resources, the definition of rules and procedures so that the established objectives and plans to be achieved [20,38]. The authors cited previously claim that organization includes coordination, because resources have to be coordinated for their proper direction towards achieving common goals.
Regarding work in multicultural teams, Waxin and Barmeyer [4] points out three aspects: The need to structure tasks is culturally differentiated, depending on the cultural experience related to uncertainty avoidance; the distribution of roles must be done not only according to professional competence, but also according to the members’ social and intercultural competencies and the degree of knowledge of the common working language; rules for operation, on one hand, must be established in the early stage of team dynamic, and on the other hand, must permit for all members to participate in their elaboration, in order to be accepted and respected by them. Analogous ideas are found in the research of Pazos [47], who recommended that teams must agree on the rules and procedures of operation, while Tang et al. [48] emphasize the need for clear rules and procedures, especially in the context of complex tasks, in order to avoid disagreements. In the view of the above, we consider that organizing the work of IT teams characterized by diversity requires the establishment of clear roles, responsibilities, rules, and procedures in such a way that they become accepted and respected by members; we also believe that the allocation of roles must be made by a responsible individual who possess not only the technical skills needed to take on the role, but also possess the social and emotional skills desirable to relate, especially since diversity also includes the source of cultural differentiation between members.
Leading consists of motivating and providing support to employees involved in goal achievement, identification, and usage of the most effective communication channels and resolution of conflicts [35] so that co-workers actions to be aligned with defined goals and plans. As noted by Wu et al. [49], Nicolaides et al. [50], and Herbert [51], there are a number of studies dealing with the confirmation of the positive effect of leadership on team performance.
Regarding diverse teams, which also includes surface-level cultural differentiation characteristics, Kearney and Gebert [52] confirm a positive relationship between diversity and team performance, mediated by the leadership style. Expectations regarding the leader’s behavior differ culturally. Waxin and Barmeyer [4] emphasized that in the context of multicultural teams, the leader should adapt his style not only to the situation, but also to the organizational culture and to the cultural preferences of team members. The latter depends on the preferred stimulus, the need to participate in decision-making, and the preference for explicit or implicit communication style. The same idea is underlined by Rothacker and Hauer, who, following an empirical research involving 333 participants with different ethnic origins and from 50 different countries, concluded that situational leadership “can be used as a basis to motivate employees with different national backgrounds (…) or to motivate multinational teams” [53] (p. 236). Based on the above, we judge that in leading diverse teams there should be a focus on communication in order to facilitate the expression of members’ opinions, to support teammates in solving problems, including conflict situations, to adapt the motivation style to the needs and expectations of members, and to practice fair motivation in relation to each member’s contribution and the team’s results.
Controlling consists of monitoring both organizational and employee performance, actions, and progress towards goals [12,54], evaluating performance, comparing them with objectives, and correcting any deviations from predetermined goals [35,38]. Following the control, managers should provide feedback to employees on their performance, so that they can correct their own mistakes in a timely manner, avoid errors in the future, and improve and develop their competences [38].
The issue of controlling in multicultural teams is addressed by Piccoli et al. [55], who demonstrated that in self-directed virtual teams individual satisfaction was higher and correlated with effective communication, while in virtual teams where behavior control was applied, as a method of managerial control, this control had no significant impact on virtual team effectiveness. We consider that the results obtained depended on the small size of the virtual teams, also on how performance was defined, with satisfaction being an option to express it. Regarding control, Lai and Yang [56] proved that it plays a moderating role between information sharing among team members and team effectiveness. Other authors [57,58], place their focus on the use of certain tools in controlling team activity and demonstrate that their application improves team performance. Thus, Lambovska [57] proposes a fuzzy-logic-based tool, while Courtright et al. [58] support the use of the “team charter”, a team progress monitoring document.
In diverse teams acting within companies, we appreciate that control, as an activity of evaluating the results in relation to the predefined objectives and preset tasks and roles for each team member, requires evaluating both the contributions of each co-worker to the team’s performance and the extent to which each constituent of the team showed appropriate attitude and behavior to the teamwork during the joint task.
It is important to recognize that within the management process, the management functions (planning, organizing, leading, and controlling) are not necessarily performed successively, with managers assuming several management functions simultaneously during a workday and that these management functions are strongly interdependent [35,38].

2.2. The Positive Effects of Diversity

Any team implies a certain degree of diversity (gender, age, skills and competences, personality, nationality, and values), with diversity generating certain positive effects. Thus, Amaram [59], based on empirical studies, argues that a diverse mix of employees leads to better decisions, that women are said to have higher tolerance for ambiguity than men and increase the ability of their belonging collective to adapt to change, and that the capabilities of women and minorities offer a wider labor pool that leads to competitive advantage gains.
Díaz-Fernandez et al. [17] analyze team diversity at strategic level of companies, in terms of age, education, and experience. They consider the size of the company and of the teams as growth factors of diversity and invokes the theory of complexity and complex causality to demonstrate that there is no single, winning combination of the diversity elements of the top management team that determines company performance, however diversity features of this type of team “lead to high performance, depending on how it is configured with the diversity of other attributes of the top management team” [17] (p. 165).
Cultural diversity includes differentiating factors such as ethnicity or country-of-origin (at surface-level) and like values and attitudes (at deep-level), whose positive effects have been identified and inventoried through empirical studies and literature reviews conducted by a significant number of researchers, as detailed below.
Among the papers that highlights the positive impact of cultural diversity for multicultural organization, we note the review of Amaram [59], which identifies as positive effects a better understanding of a diverse clientele requirements within the increasing global market, an improved organizational flexibility and ability to adapt to changes, a display of multiple perspectives and interpretations in dealing with complex issues and improved problem solving, have an advantage in attracting and retaining the best talents through fair and equitable career advancement treatment and, in research-oriented and hi-tech industries, even creativity manifests itself due to diversity.
Similar perceptions and views are presented by Meier [60] and Cox and Blake [61], who argue that cultural diversity is a source of competitive advantage and presents the followings as advantages of cultural diversity for companies: A better adaptation to different local contexts and sustainable entrance into other markets, as a result of an improved knowledge on customers’ habits and preferences, in the virtue of its’ culturally diverse staff; innovation from the confrontation of several points of view, because differences between cultures broaden the knowledge base of a group and generate more solutions; increased capacity to solve complex problems due to the diversity of skills and competencies in multicultural teams; a better adaptation to complex environments, offering more suppleness; attracting high-potential employees through more interesting career prospects; developing openness to other people; a better understanding of the habits and practices of interlocutors, but also a better self-understanding; an enlargement of the general culture; an extension of their own vision on profession; and the promotion of foreign language usage.
At the level of multicultural team, Trefry and Vaillant [62] state that cultural diversity makes the team and its members to perform better in terms of adaptability to new or unforeseen situations.
Based on empirical research, Jang concludes that the incidence of multicultural members significantly enhanced the creative performance of a team and that “the presence of cultural insiders (members who share the cultural background of some or all team members) and cultural outsiders (members who share the cultural background of none of the members in a team) each led to a higher level of creative performance” [32] (p. 1000). Similarly, Barthorpe et al. [63] argue that, although in the short term, multicultural teams perform poorly, in the long run, their results are better than of the mono-cultural teams, especially in terms of creative performance and problem-solving capability.
Bantel [33] points out that the culturally diverse teams provide a framework that develops members’ skills and competencies, and also broadens their perspectives.
Stahl et al. [15], starting from their own empirical research and from their meta-analysis of 108 empirical studies on 10,632 multicultural teams, aimed to identify the positive aspects of cultural diversity within the teams, as well as the processes that lead to these effects. The most relevant ideas on the effects of cultural diversity that can be retained from these theoretical and empirical studies [7,15] are:
  • Learning for team members, as a result of teamwork, and team learning, as the ability of a team to learn collectively;
  • Creativity and innovation, as a result of interactions between members and the combination of knowledge, perspectives, and ideas from different sources;
  • Member satisfaction. Satisfaction arises from the adequate coverage of needs, or, in multicultural teams, needs for new experiences, for challenges, or even adventures are covered, needs to which other types of diversity do not respond well;
  • Communication effectiveness. The authors [15] disclose that although many studies reveal that cultural diversity generates communication problems, most often due to the aversion between different cultures, differences in values and attitudes between members can also be a source of knowledge and lead to more interaction and more effective communication;
  • Productivity;
  • Adaptability;
  • Facilitates the integration of members in multinational companies, as well as the development of social networks: Team members who had positive experiences within corporations frequently maintained contact with their former colleagues even after the dissolution of the team.
Tirmizi [5] argues that the performance of the multicultural team should refer both to the actual task accomplishment and to how well the members feel together. In the explanatory model of the performance of multicultural teams, the author expresses the results of multicultural team through the following team effectiveness criteria: satisfaction, learning, performance, and productivity.

2.3. Performance of Multicultural Teams and Research Hypotheses

Regarding the effects of diversity reflected in the literature, we notice some complementary combinations, even mixtures of concepts such as productivity, performance, effectiveness, or efficacy, which from an economic and managerial perspective have elements of differentiation. We do not propose here a debate on these concepts, but we will consider their most commonly accepted sense and connotation, in order to avoid confusion and formulate ways of expressing performance at co-worker, team, and organizational levels, under the impact of cultural diversity.
From an economic perspective, performance is assessed in relation to the extent to which the results obtained correspond to those preset. Performance is frequently explained in the business literature via efficiency criteria (effort-related effects), effectiveness, and employee satisfaction [38]. Thus, if an organization or a team is effective, efficient, and achieves member satisfaction, it can be considered performing. Satisfaction expresses the feeling of contentment and fulfillment that appears after satisfying the needs and expectations of employees [3]. For instance, productivity, as an. efficiency indicator, shows the achievement of results through the good use of time or human resources. Effectiveness refers to the ability to do the right things during the process that allows the achievement of the expected results.
Regarding teams, effectiveness is explained by the team’s ability to successfully perform the task and is correlated with teamwork behavior [64]. “Teamwork behavior is considered an effective way to create synergy in work teams” [65] (p. 4), a synergy necessary to obtain performance. The teamwork behavior means manifestations of support behaviors towards others, communication, and coordination among employees engaged in inter-dependent tasks, all specific to the “quality of co-workers’ relationships” between members [65]. Tasa et al. [64] share the same opinion, according to which the success of a team is dependent on interpersonal communication skills, problem solving, conflict resolution, but also on important individual skills in teamwork.
A reflection on diversity gains discussed above, as well as these conceptual clarifications, allows one to note that diversity generates positive results on three levels: At the level of team members (co-workers), at the level of teams, and at the level of companies. A closer look shows us that these gains are not only expressed in terms of economic results such as efficiency (productivity), but especially in terms of competence. The logic according to which the latter can be approached is specific to the competency–performance theory claiming that organizational level results depend on the cooperation between different business areas [22]. Also, the approach of competencies can be made from the perspective of the competency-based management models existing in the human resources and strategic management fields, models that propose the construction of a chain of competencies and an aggregation of competence levels starting from individual, to the collective, and finally, at organizational echelon, so that the company develops sustainable distinctive competencies [66,67,68,69]. Thus, cultural diversity becomes a source of strategic competencies and competitive advantage [60], by developing innovation capacities and transferring skills acquired from one market to another [70].
Consequently, the positive effects of cultural diversity discussed in Section 2.2 can be treated as performance and we divided them into the following three categories: At the level of individual team members (co-workers), at team level, and at organizational level.
At the level of co-workers or team members, qualitative successful results are included, considered as manners to express individual performance and that correspond to the teamwork behavior-related efficacy criteria. They occur as a result of effective learning experiences through intensive interactions with team members [65] and refer to the development of important personal and interpersonal skills to perform the ask. From our point of view, within this category fall the following six positive effects: increased member satisfaction, professional skills development of the team members, development of members’ language skills, improvement of members’ communication skills, enhancement of the team members’ empathy, and the development of tolerance and openness towards other cultures.
Starting from the management functions discussed in Section 2.1 and from the abovementioned qualitative positive results for the members of culturally diverse teams, we formulate the following hypotheses:
Hypothesis 1 (H1).
Managerial functions have positive, direct, and significant effect on individual co-workers’ performance.
Hypothesis 1a (H1a).
Planning has positive, direct, and significant effect on individual co-workers’ performance.
Hypothesis 1b (H1b).
Organizing has positive, direct, and significant effect on individual co-workers’ performance.
Hypothesis 1c (H1c).
Leading has positive, direct, and significant effect on individual co-workers’ performance.
Hypothesis 1d (H1d).
Controlling has positive, direct, and significant effect on individual co-workers’ performance.
Hypothesis 1e (H1e).
The four managerial functions have a joint, positive, direct, and significant effect on individual co-workers’ performance.
At the team level, specific quantitative and successful process results of the team are included, which correspond to the efficiency and effectiveness criterion. This category includes the following effects: Increased team productivity, analyzing problems from several cultural perspectives, and making better decisions, along with enhanced ability to solve complex problems.
Regarding the impact of the team management on its collective performance, we formulated the following hypotheses:
Hypothesis 2 (H2).
Managerial functions have positive, direct, and significant effect on team-level performance.
Hypothesis 2a (H2a).
Planning has positive, direct, and significant effect on team-level performance.
Hypothesis 2b (H2b).
Organizing has positive, direct, and significant effect on team-level performance.
Hypothesis 2c (H2c).
Leading has positive, direct, and significant effect on team-level performance.
Hypothesis 2d (H2d).
Controlling has positive, direct, and significant effect on team-level performance.
Hypothesis 2e (H2e).
The four managerial functions have a joint, positive, direct, and significant effect on team-level performance.
At the company level, as an aggregate result of the contributions of diverse teams and their members, two sustainable strategic competencies were included, considered as ways of expressing organizational sustainable performance: On one hand, the increased company adaptability on the market as a result of the accumulated knowledge regarding the cultural practices and customs of its own members; on the other hand, the manifestation of innovation.
The arguments for which we considered the two criteria (innovation and adaptability) suitable as organizational sustainable performance are presented below.
Sustainable performance is commonly understood as the durable performance of the organization, in the long term, that guarantees a perspective of continuity and that takes into account the interests of all stakeholders [71,72,73]. It appears at the interaction between the internal environment of the organization and its external environment, connecting business, society, and the environment. Definitions of sustainable organizational performance may differ according to its economic, environmental, and social components specific assessment and metrics [71,72,73].
Our interest in understanding the concept is related to the positive effects through which diversity, particularly the cultural one, generates long-term performance of the organization. From the studied literature, we observed lately a shift and an increase in importance given to certain indicators, other than the traditional financial ones, indicators that evaluates sustainable performance, such as the capability to develop employees’ talents and capacities as employee sustainable performance [72,73,74]; the company’s innovation capacity [65,71,72,75]; and organizational responsiveness or adaptability [75,76]. Other authors [76,77,78] even make a correlation between the last two criteria and argue that innovation increases the company’s organizational agility and enhance the sustainable performance of the company.
Considering the previously presented particularities of the organizational sustainable performance, the following hypotheses are formulated:
Hypothesis 3 (H3).
Individual co-workers’ performance has positive, direct, and significant effect on company-level sustainable performance.
Hypothesis 4 (H4).
Team-level performance has positive, direct, and significant effect on company-level sustainable performance.
Complementarily, in order to highlight the effects of cultural diversity, we performed a comparative analysis between mono-cultural and multi-cultural teams included within our sample, regarding the influence of individual and collective performance of the team on sustainable organizational performance, given that team performance is impacted by the four management functions.
In hypotheses formation, we started from two similar statements, formulated by Amaram, who considered that “there is substantial literature which argues that diversity has performance advantages over homogeneous work structures” [59] (p. 4) and by Stahl et al. [15], according to whom cultural diversity is a differentiating factor that can have different positive impacts on a team results than other sources of diversity.
Based on the previously discussed, we formulate the following hypotheses:
Hypothesis 5a (H5a).
There is significant difference between the mono-cultural and multi-cultural teams regarding the individual co-workers’ performance on company-level sustainable performance.
Hypothesis 5b (H5b).
There is significant difference between the mono-cultural and multi-cultural teams regarding the team-level performance on company-level sustainable performance.
Following these clarifications, we constructed a questionnaire addressed to multicultural IT companies within IT project-based teamwork is accentuated, in order to collect the data necessary for the empirical study.

3. Research Methodology

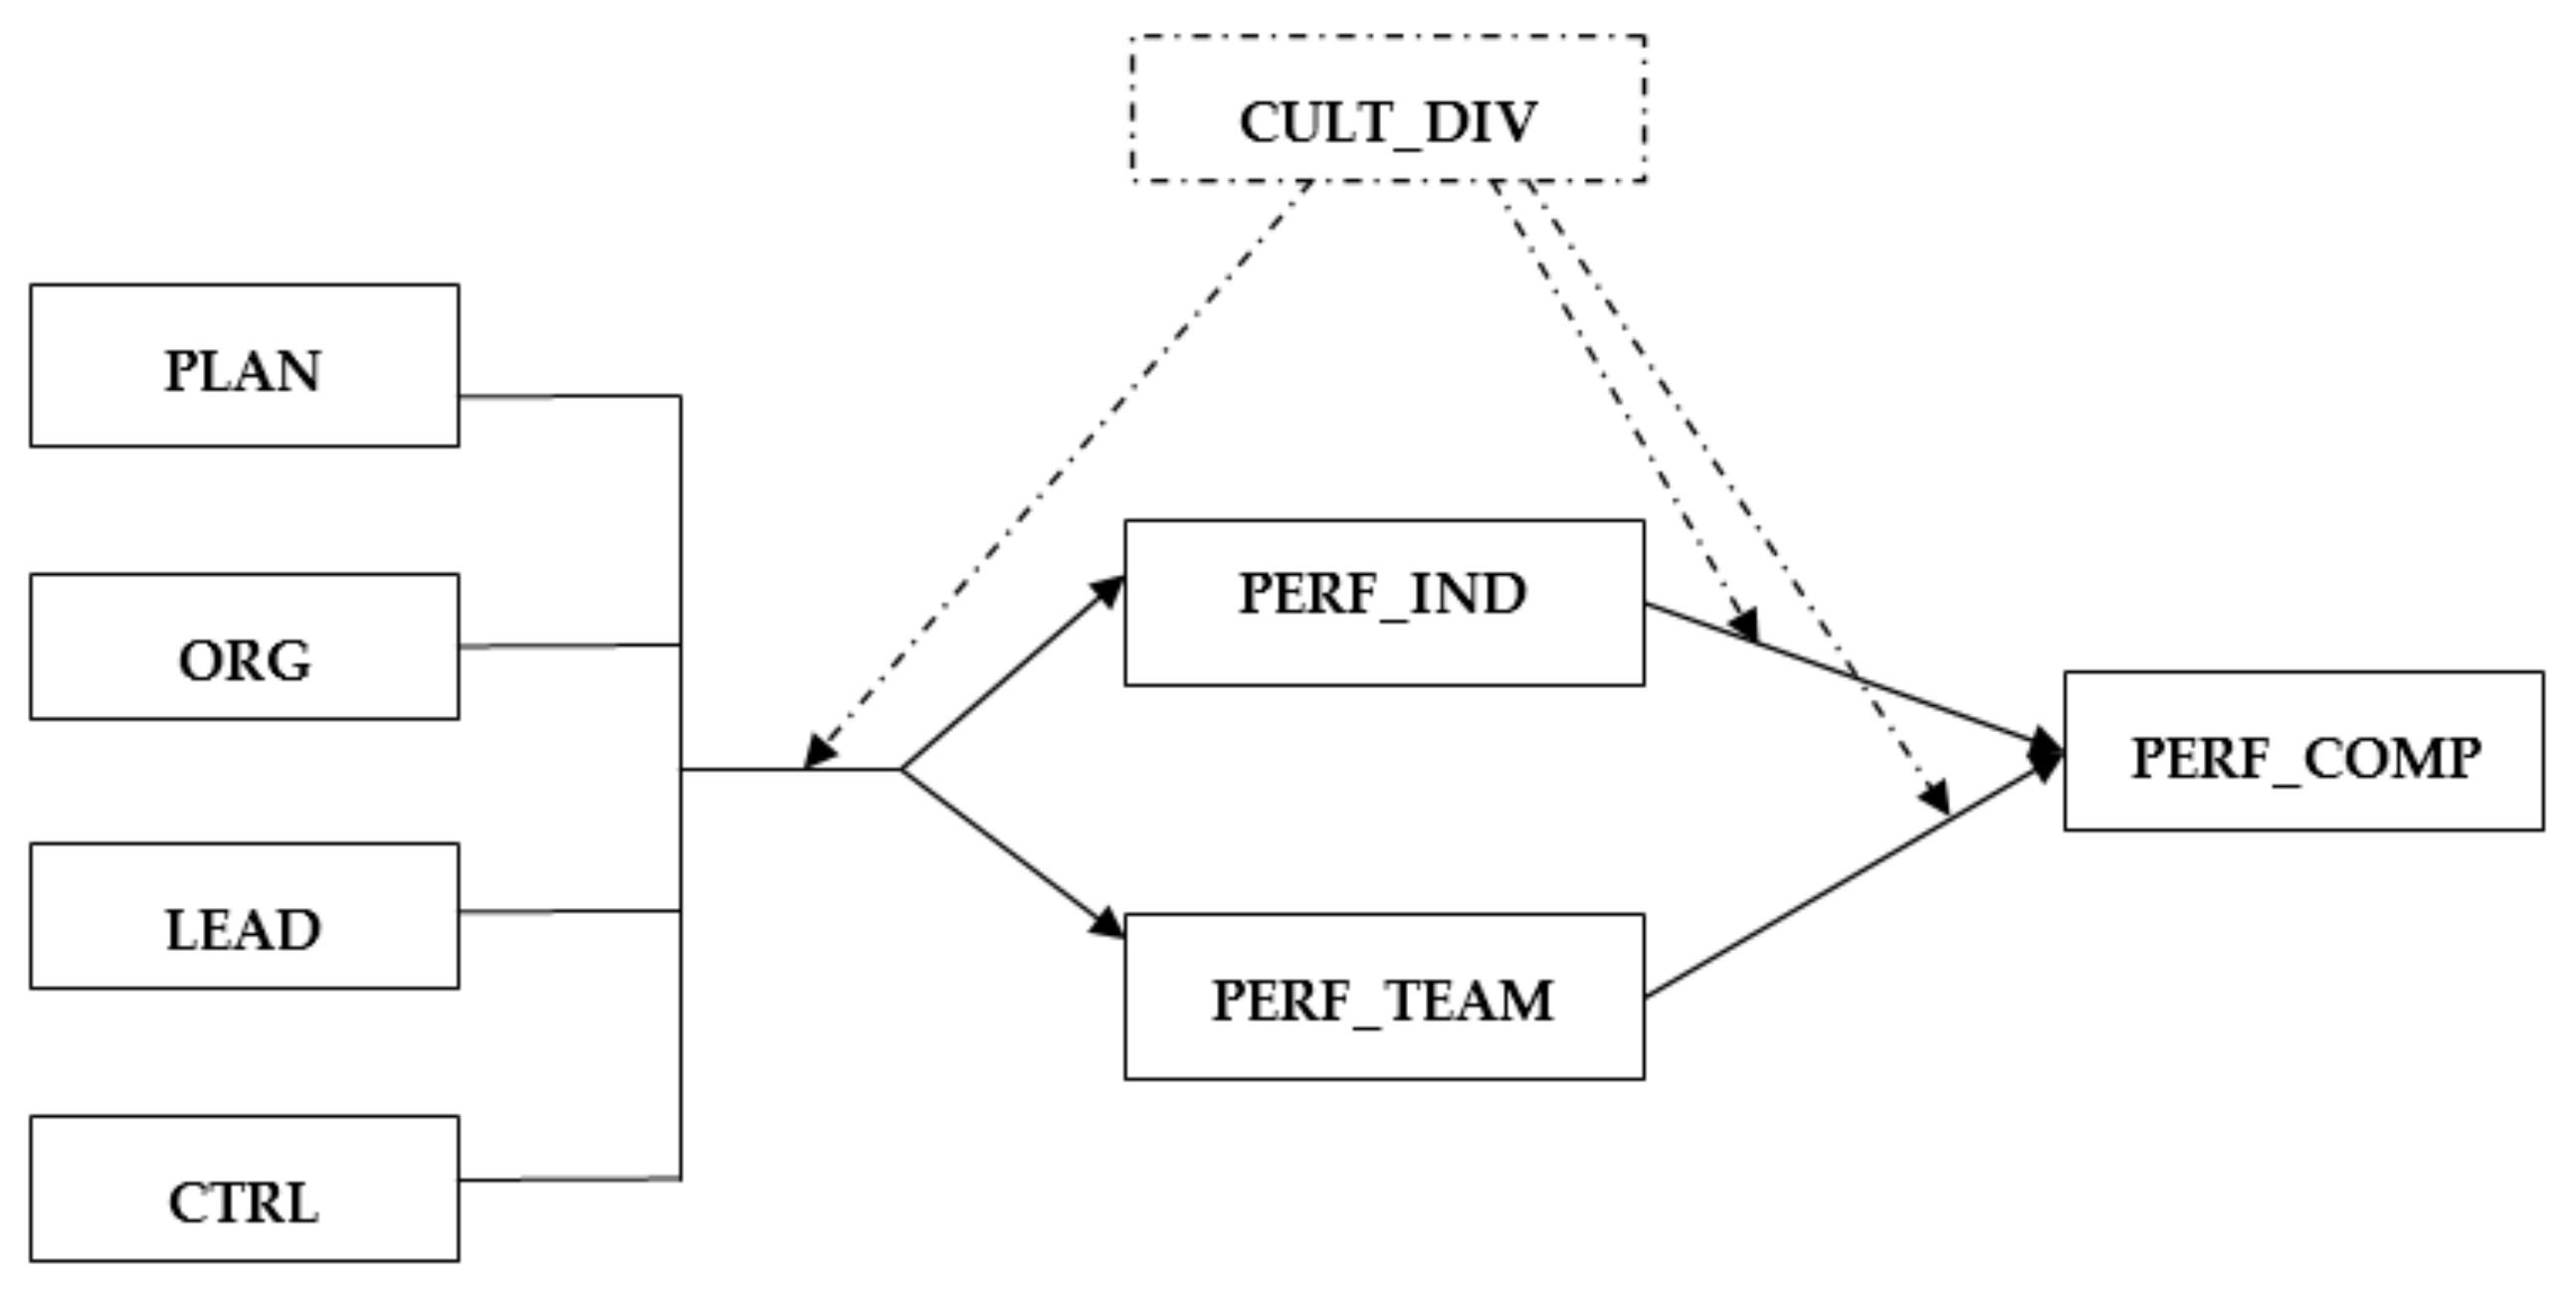
3.1. Research Aim and Model

Since every business is contextually embedded in the same time and reliant on internal environment, the aim of the proposed explanatory research is to explore the individual and joint impact of the managerial functions on the performance obtained at team member level and collective team-level, all convertible lastly in genuine company-level sustainable performance. The analyzed teams work on IT projects and are characterized by diversity, mainly cultural diversity. Performance at the abovementioned three levels has been defined in terms of the positive effects of cultural diversity. Complementarily, a contingency perspective is applied in order to investigate potential differences between mono- and multicultural teams regarding the relation between the performance at team member and collective team-level and the performance at organizational level.
A quantitative research approach was favored to assess the above proposed research aim, specific hypothesis, and model (Figure 1).
As predominant within the general, strategic, human resources, and intercultural management literature, a structured questionnaire-based sample survey was applied for data collection purposes, due to the lack of available internal company and team specific secondary data within IT domain. Therefore, primary data were collected on self-reporting bases for all the modeled variables, and on team and respondent specific demographics. In this sense, respondents were asked to state their perception or opinion about certain assertions on the subject matter expressing and interpreting the constructs of the research model.

3.2. Variables and Measures

The measurement model and the incorporated constructs’ operationalization presumed the development of several multi-item-based scales. All questions and statements from the survey, reflected in Table A1, have been developed to provide an overview of the analysis and are based on the previously presented scientific theory.
For antecedents, as independent variables, a literature review on the management functions was used in order to create and express their specific content, adapted from the general approach to the context of culturally diverse work teams. Thus, based the items included within the questionnaire were used in the empirical research: Planning (PLAN) measured through 4 items, organizing (ORG) considered composed by 5 items, leading (LEAD) outlined with the help of 4 items, while controlling (CTRL) observed through 2 items. For each item enclosed in the questionnaire to measure management functions, we used an evaluation scale from 1 = Strongly disagree to 5 = Strongly agree. Item descriptions are included in Table A1 (Appendix A).
As moderator, the cultural diversity of teams was considered, describing the cultural diversity of employees and workforce, the culture to which employees originally belong and come from. As a categorical variable, cultural diversity allows for comparisons between mono-cultural and multicultural teams.
For the mediators and dependent variable, based on the critical review of the literature presented in Section 2.3., authors considered the positive effects of diversity as performance, dividing them into the following three categories: Individual level co-worker, team-level, and organizational-level. The ways to express performances was agreed and integrated in the questionnaire as follows: Individual-level co-workers’ performance (PERF_IND) measured with 6 items, team-level performance (PERF_TEAM) observed through 3 items, while company-level sustainable performance (PERF_COMP) considered 2 main items. Each performance type specific set of items included in the questionnaire has been evaluated on a scale from 1 = Not at all to 5 = To a very great extent (Table A1).
To limit response bias, statements specific to the modeled variables, managerial functions, individual-, team-, and company-level performance were mixed and arranged logically and in dynamic within the questionnaire. In the closing section of the data gathering instrument, the categorical variables and open questions on team demographics and personal information were added. For all independent, mediator, and dependent variables, latent composite higher-order constructs were formed by aggregating the average value of multiple items measured on Likert scales as ordinal data.

3.3. Research Setting

The empirical section of the study concentrates on the IT sector of two Central-Eastern European countries, namely the Czech Republic (CZ) and Romania (RO), due to several similarities between the two national economies regarding the dynamics and innovativeness of the IT sector, concerning the capacity to penetrate other markets with products and services created within this sector and originated from the two selected countries, as well as being related to the major cultural resemblances.
Both countries are perceived as digital challengers within the European Union [79], sustained by the dynamics of several Information and Communications Technologies (ICT) specific indicators of the 2020 PREDICT [80] and European Innovation Scoreboard [81] Datasets. In this sense, the ICT output reached 24.58 billion € in CZ and 18.36 billion € in RO for 2017, with a long-term (2000–2017) average annual increase of 8.22% for CZ and of 9.99% for RO. Moreover, for 2019, the value added by the Czech ICT sector was of 10.54 billion €, representing 4.71% of the Gross Domestic Product (GDP), whereas in RO it was of 10.79 billion €, reflecting 4.83% of the total GDP. The long-term (2000–2019) development shows that the ICT sector increased annually its value added in average by 6.97% in CZ and by 8.56% in RO. Furthermore, in 2019, the number of employees in ICT was of 177,890 persons in CZ and 233,740 persons in RO, with an average annual growth of 2.64% and 2.92%. In the same year, labor productivity per employee reached 59,250 €/person in CZ and 46,170 €/person in RO, with an average annual growth dynamic of 5.52% and 5.48%. In 2017, the number of ICT sector specific enterprises was of 42,113 in CZ and 23,490 in RO, with a 20.97% and 18.31% overall growth compared to 2009.
The competitiveness and increased innovativeness of the high value-added ICT sector is primarily based on the creation and diffusion of state-of-art technologies, encompassing both new and improved products, with the ability to commercialize these incremental and radical innovations in international markets. Therefore, the value of sales of new-to-market and new-to-company innovations (as percentage of turnover) reached 12.96% in CZ and 4.74% in RO for 2019. Further, the exports of medium and high technology products (as share of total exports) for 2019 peaked at 68.1% for CZ and 57.4% for RO, reaching within the 2012-2019 timeframe an average annual growth of 2.035% and 2.027%, respectively.
Consequently, we can conclude that in both countries the ICT sector is continuously expanding, developing, and innovating. Novak et al. [79] considers that this sector can be the new source and the next growth engine of progress in the Central and Eastern European region, even the foundation of a successful sustainable development model. Based on Eurostat data [82], for CZ the number of immigrants reached 65,910 persons, while emigrants were 26,742 persons in 2018. Comparatively, in the case of RO, immigrants reached 172,578 persons, while emigrants were 231,661persons. Previous values suggest an increase of multiculturalism specific to the labor market within the two countries.
Concerning the cultural profile of the Czech Republic and Romania, from the perspective of the Hofstede model [28,83], the two countries are more similar in terms of the following dimensions that influence company management: Power Distance, being hierarchical societies (CZ with a score of 57 and RO with a noteworthy score of 90); Uncertainty Avoidance, suggesting an appetite for precision, details, and structured work (CZ appears with a score of 74 and RO with a score of 90); and Long-Term Orientation, regarding the preference for pursuing long-term performance (scores being 70 for CZ and 52 for RO). In exchange, the two main differences between the countries regard that, on one hand, CZ is considered to be more Individualistic (score 58) accentuating personal interests, while RO is rather Collectivist (score 30) with a group oriented approach, although more recent studies [84] sustained that individualism is growing in the Romanian society; on the other hand, CZ is considered to be a Masculine society (score 57) driven by materialism and competition, while RO rather Feminine (score 42) characterized by accents on social and emotional values.

3.4. Sample

Companies of interest from Romania and the Czech Republic have been selected based on 3 criterions: (i) Activity domain in the IT sector; (ii) company size: Large or multinational companies and their subsidiaries; and (iii) cultural diversity of employees within the company. The IT sector was targeted due to its high dynamics, major contribution to digitalization, and its significant role in economic growth and in the transition towards the European digital economy goal. Thirty-two companies were contacted from the two countries, from which 14 responded positively and 18 invoked confidentiality reasons and business secrecy policies for not participating in the study. From the 14 respondent companies, half were located in the Czech Republic and half in Romania.
Primary data were gathered within the December 2019–February 2020 timeframe, via single-informant self-administered online questionnaires. The questionnaire was created in English, the language officially used within the selected companies. A contact person within each company was delimited to distribute the online questionnaire. Along with the link to the online questionnaire, a cover letter was also transmitted to each voluntary respondent to explain the aim of the research and to assure their privacy and anonymity. As well, in order to enhance the response rate, contacts identified were reminded by phone at the middle of January 2020. Both IT leaders and members from the same teams were requested to complete the questionnaires by self-reporting their options on the given set of statement.
From the 430 questionnaires distributed via e-mail to the voluntary respondents with the help of the contact persons, 327 were returned, assuring an initial response rate of 76.05%. Afterwards, in the first iteration, the invalid surveys were eliminated if more than half of the responses (>17 items) were missing. In the next iteration, if 6 important items were missing (the 3 items specific to team performance, the 2 items describing organizational performance, and the item delimiting the team type from diversity perspective) in an additive manner, responses were considered incomplete and excluded. Within the third iteration, the sample was limited to those teams where both the team leader and at least ¾ of the team members responded. Finally, the sample included 28 teams and 189 respondents, who properly filled in the questionnaire, a sample size meeting the statistical requirements for structural equation modeling. Therefore, the effective response rate of 43.95% can be considered acceptable and comparable in sample size [18,47,53,58,75] or response rate [22,49] with other studies in the field.
In order to obtain a more complete picture on the respondents and their work team profiles, several evaluation criteria were included, like team size, team setup, team type, along with the respondent’s location, position, experience within the company, and country of origin.
Concerning team demographics, the included work teams were mainly medium and large sized: Over 15 members (32.28%), between 5 and 8 members (31.75%), between 9 and 15 members (29.10%), and below 5 members (6.88%). Regarding team setup, 92.59% of the respondents were in permanent teams, while 7.41% in temporary teams, reassigned as needed. Depending on team types, 5 classes were delimited, where the surveyed groups were preponderantly face-to-face multicultural teams (42.86%) and virtual bi- or multicultural teams (37.57%), followed by face-to-face mono-cultural teams (12.70%), face-to-face bicultural teams (3.70%), and finally virtual mono-cultural teams (3.17%).
Regarding the individual demographic aspects, 14.81% of the participants within the study were leaders of the 28 analyzed IT teams, while 85.19% of the respondents were team members, each group having 6 to 7 members on average. As for the experience within the company, the majority of the employees had more than 1 year within the company (71.43%) or between 6 months and 1 year (20.63%), while the least (7.94%) had below 6 months of experience with the analyzed IT companies. Concerning the localization of the work groups, data show similarities: Slightly more than half of the respondents were from the Czech Republic (50.79%) and somewhat less than half from Romania (49.21%). Respondents belong to a number of 15 cultures, their origin countries and cultures being dispersed as follows: Romania (54.50%), Czech Republic (26.98%), Slovakia (5.82%), Russia (3.17%), Moldavia (2.65%), Belarus (1.59%), and India (1.06%), as well as Belgium, Germany, Hungary, Poland, Serbia, Spain, Switzerland, and Ukraine (0.53% each).

3.5. Data Analysis Approach

Following the suggestions of Hair et al. [85], the empirical data and research model evaluation involved a sequential application of several statistical techniques specific for complex models, in order to fully examine available data in SPSS Statistics, version 27 (IBM, Armonk, NY, USA) and AMOS software, version 22 (IBM, Armonk, NY, USA).
In the first phase of the statistical analysis, standard descriptive statistics were reported at individual item level and, afterward obtaining them, at the first-order latent constructs level.
In the second phase, the measurement model was evaluated via the α Cronbach-based scale reliability appraisal, followed by the exploratory factor analysis (EFA) based on principal component extraction and varimax rotation for factor loading and construct composition purposes. The analysis was supplemented with convergent validity assessment using composite reliability (CR) and average variance extracted (AVE), along with discriminant validity assessment by comparing square root of the AVE with correlations involving the other constructs, as indicated in the Fornell-Larcker [86] testing system. EFA was completed with confirmatory factor analysis (CFA) to verify the factor structure of the latent variables.
The assessment for potential common method bias and multicollinearity was evaluated using the variance inflation factors (VIF) value [87]. Another corrective endeavor concerns the composite variable, which was created to evaluate the joint effects. In order to eliminate any potential bias, all variables were mean-centered previous the combination of the management functions, a technique approved by Hair et al. [85].
In this phase, the predictive power of the proposed model was also analyzed in order to identify the accuracy of the measurement model. According to Hair et al. [85], several goodness-of-fit indices, like χ2/df, NFI, RFI, IFI, TLI, CFI, and RMSEA, should be reported to assess the overall model fit.
In the third phase, for structural model evaluation and hypotheses testing purposes, advanced statistical analysis was employed in the form of structural equation modeling (SEM) [85]. SEM technique is suitable to investigate, via path analysis, causal relations (H1a–d and H2a–d), mediations (H1+3, H2+4), and moderations (H5a,b). Additionally, four alternative models were considered in order to discover the most suitable variant for the considered variables. Finally, in order to evaluate the role of cultural diversity as moderator, z-scores were calculated for between-groups statistics [88] aiming to emphasize statistically significant distinctions and similarities between mono-cultural and multicultural teams.

4. Empirical Findings

The employed data analysis algorithm includes several procedures and techniques to permit, on one hand to identify the exact, truthful, and accurate factorial structure of the proposed latent variables, and on the other hand to discover the statistically pertinent and relevant relations within the proposed research model.

4.1. Descriptive Statistics

As standard descriptive statistics, means and standard deviations were determined specific to each survey item, presented in Table 1. The mean values of all responses are in the range of 3.556 to 4.132, while the standard deviations fall between 0.798 and 1.088. Item-level statistics were considered necessary to be reported due to the novelty of the proposed measurement scales.
For the four items describing the planning management function, the five items relating to. organizing, the four items concerning leading, the two items regarding controlling, the six items on the subject of individual co-workers’ results, the three items referring to team-level results, and the two items on the topic of company-level sustainable performance, survey responses have mean values within the following ranges: 3.937–4.122, 3.910–4.026, 3.989–4.132, 4.095–4.095, 3.556–3.783, 3.566–3.693, and 3.566–3.587. In all the above cases, the lower limit of the ranges is well above the value of 3.000, the mean value of potential responses measured and given on 5-point Likert scales.
Standard deviations are below the limit of 1.000 in the case of the items specific to the four management functions, being between 0.839 and 0.922 for planning, between 0.872 and 0.920 for organizing, between 0.798 and 0.917 for leading, and between 0.951 and 0.951 for controlling. As for the items concerning individual co-workers’ performance, team-level performance, and company-level sustainable performance, standard deviations are ranged between: 0.927 and 1.062, 1.001 and 1.088, and 0.989 and 1.068. With the upper limits being just slightly above the threshold value, they will not create any bias or statistical difficulty.
Table 1 includes also further item-level statistics specific for factorial analysis necessary for construct creation and measurement model evaluation, while Table 2 contains fundamental descriptive statistics for the latent variables.

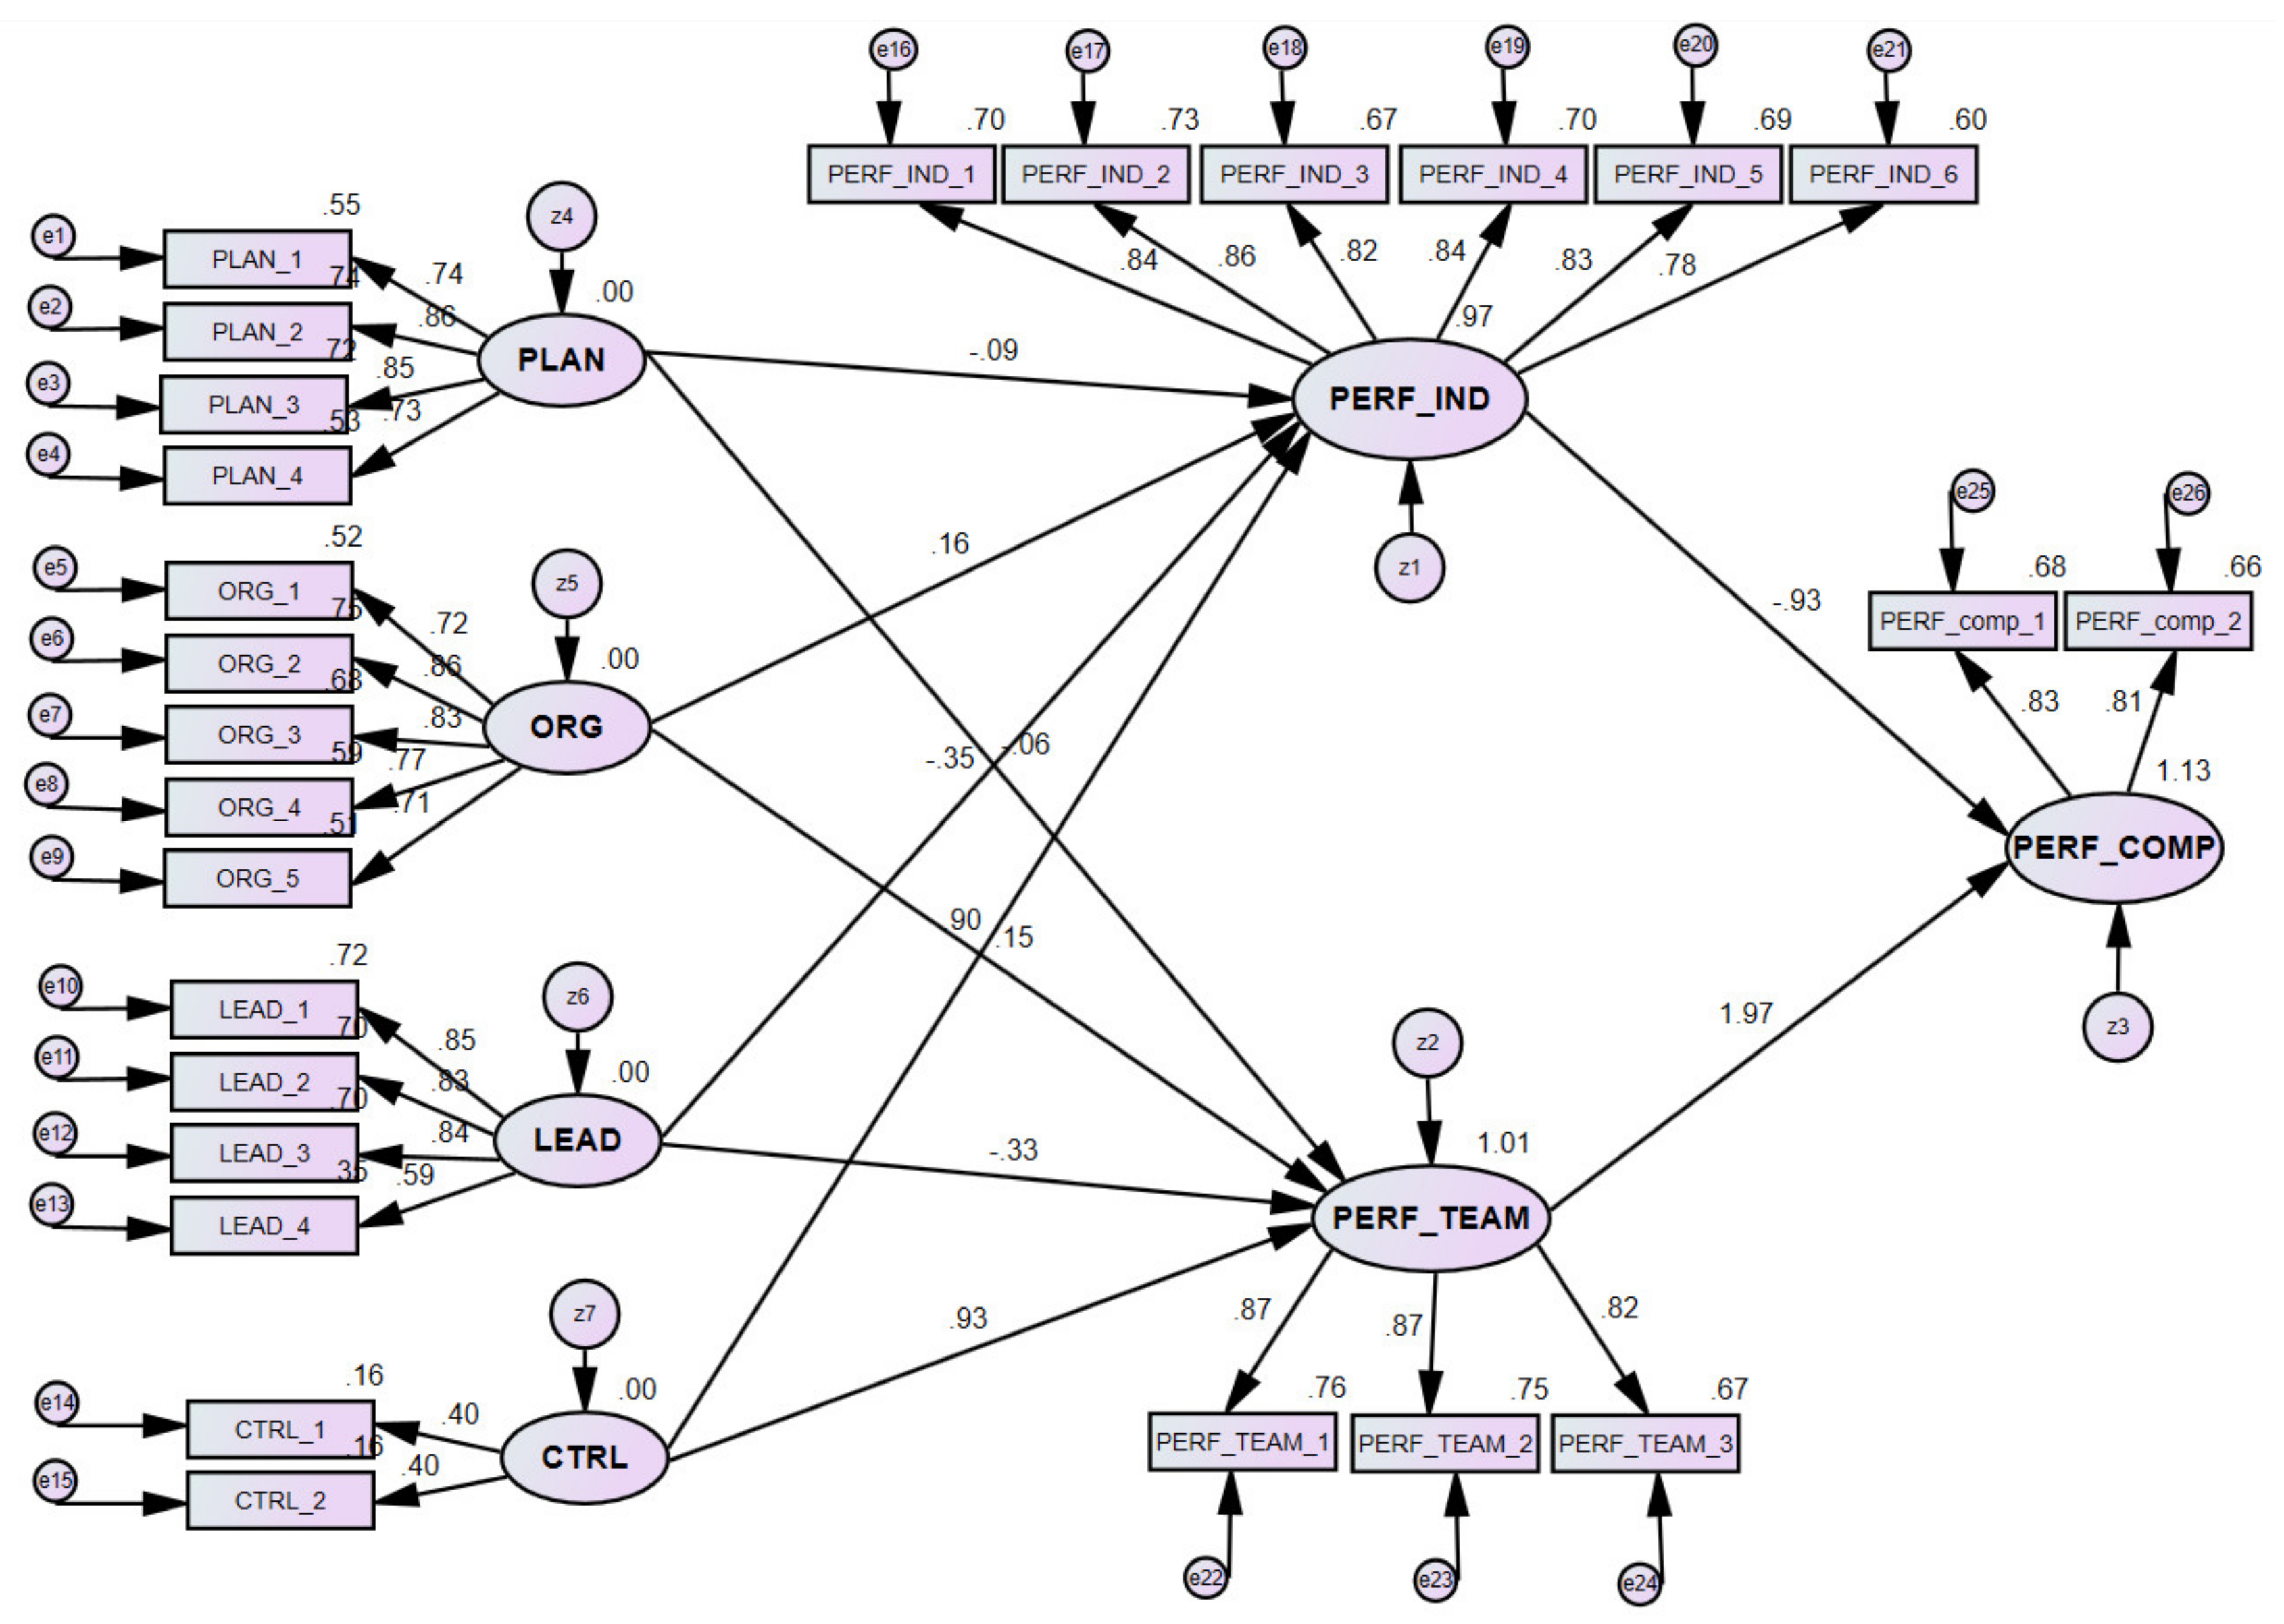
4.2. Measurement Model Evaluation

In order to evaluate the measurement model, first a reliability analysis was conducted, followed by exploratory and confirmatory factor analysis for the modeled variables and relations. Therefore, Table 2 encompasses descriptive, reliability, validity, and common method bias specific statistics.
For the evaluation of internal consistency of the observed items representing the seven latent variables, a double standard was applied evaluating both Cronbach’s alphas and composite reliability (Table 2). All the considered measures had Cronbach alpha coefficients included within the range of 0.753–0.904, well above the threshold level of 0.700 considered sufficient in business research topics [85]. Moreover, composite reliabilities of all constructs were above the threshold value of 0.700 [86], ranging between 0.939 and 0.958, thus demonstrating that every single scale applied in the survey is reliable.
Exploratory factor analysis was required to be employed for the newly proposed measurement scales, being appropriate to examine the internal structure and relations between observed variables within the proposed latent variables. Based on Hair et al. [85], to check the suitability of factor analysis, the Kaiser–Meyer–Olkin (KMO) test values and Bartlett’s significance levels were evaluated, results being between 0.500 and 0.874 for KMO and with p < 0.001 calculated significance levels. Table 1 provides the factor loadings associated to each item coupled with a given latent variable, being the result of the effective exploratory factor analysis based on principal component extraction and varimax rotation options. Factor leadings ranged between 0.817 and 0.886 for planning, between 0.782 and 0.878 for organizing, between 0.711 and 0.883 for leading, of 0.903 for controlling, between 0.787 and 0.851 for individual co-workers’ performance, between 0.845 and 0.892 for team-level, as well as of 0.896 for company-level sustainable performance. All the identified exploratory factor solutions had high loadings, above the threshold of 0.500 [85], thus no item was excluded from further analysis.
Following the suggestions of Fornell and Larcker [86], convergent validity was assessed with average variance extracted (AVE) values for each construct, while discriminant validity through the comparisons between square roots of AVEs and correlations between the respective construct and the other first-order latent constructs. For convergent validity, data analysis (Table 2) revealed that all AVEs specific to the modeled constructs are ranged between 0.824–0.903, exceeding the 0.500 limit, thus items loaded on their specific construct. Data analysis findings (Table 3) emphasized that all square roots of AVEs (ranged between 0.908 and 0.950) exceeded that correlations between first-order latent constructs (ranged from 0.151 to 0.872), thus assuring discriminant validity too.
For measurement model validation purposes, factor analysis was conducted in a composite manner, conducted both in exploratory (Table 2 and Table 3) and confirmatory ways (Table 1, Figure A1). Confirmatory factor analysis can be considered a suitable method connected to structural equation modeling. Standardized regression weights specific for observed variables were ranged between 0.728 and 0.862 for planning, between 0.713 and 0.864 for organizing, between 0.591 and 0.846 for leading, of 0.397 and 0.404 for controlling, between 0.777 and 0.855 for individual co-workers’ performance, between 0.819 and 0.865 for team-level performance, and between 0.811 and 0.826 for company-level sustainable performance. Therefore, confirmatory factor analysis was assured for almost all of the constructs, where controlling was the only exception, as the standardized regression weights were slightly lower than the threshold value of 0.450 [85]. Because exploratory factorial analysis assured the validity for the first-order latent constructs and proved high standardized factor loading, the current form of the controlling construct was considered acceptable.
Furthermore, within Table 2 presents the means and standard deviations are reported for each first-order latent construct. Means for the seven constructs included within the research model were within the range of 3.577 and 4.079, well above the average of the used measurement scale. As well, standard deviations of the seven first-order latent constructs were in the 0.711 and 0.921 interval, thus within the range for normal distributions.
The assessment for potential common method bias (CMB) was required because self-reported answers were collected from single informants, without comparing members’ and leaders’ responses at team level. The recommendation of Podsakoff et al. [87] was considered to appraise CMB using the variance inflation factors (VIF). Complementarily, multicollinearity must be assessed due to the necessity of construct combination in the case of management functions to assess their synergistic joint influence. Following the indications of Hair et al. [85], variables were first mean-centered and afterwards the variance inflation factors evaluated. VIFs (Table 3) ranged between 2.461 and 4.487 for the considered latent constructs, while VIF for the joint effect of the four managerial functions was only 1.912. In all the cases, VIFs were well below the cutting value of 10, thus indicating that the variables and the model are unbiased and free of potential multicollinearity.
Goodness of Fit indicators specific to the measurement model (Figure A1) revealed an acceptable connection and fit between data and the research model structure, according to the values of normal fit index (NFI) = 0.701, relative fit index (RFI) = 0.664, incremental fit index (IFI) = 0.756, Tucker-Lewis index (TLI) = 0.723, comparative fit index (CFI) = 0.753, parsimoniously normed fit index (PNFI) = 0.623, and root mean square error of approximation (RMSEA) = 0.129.

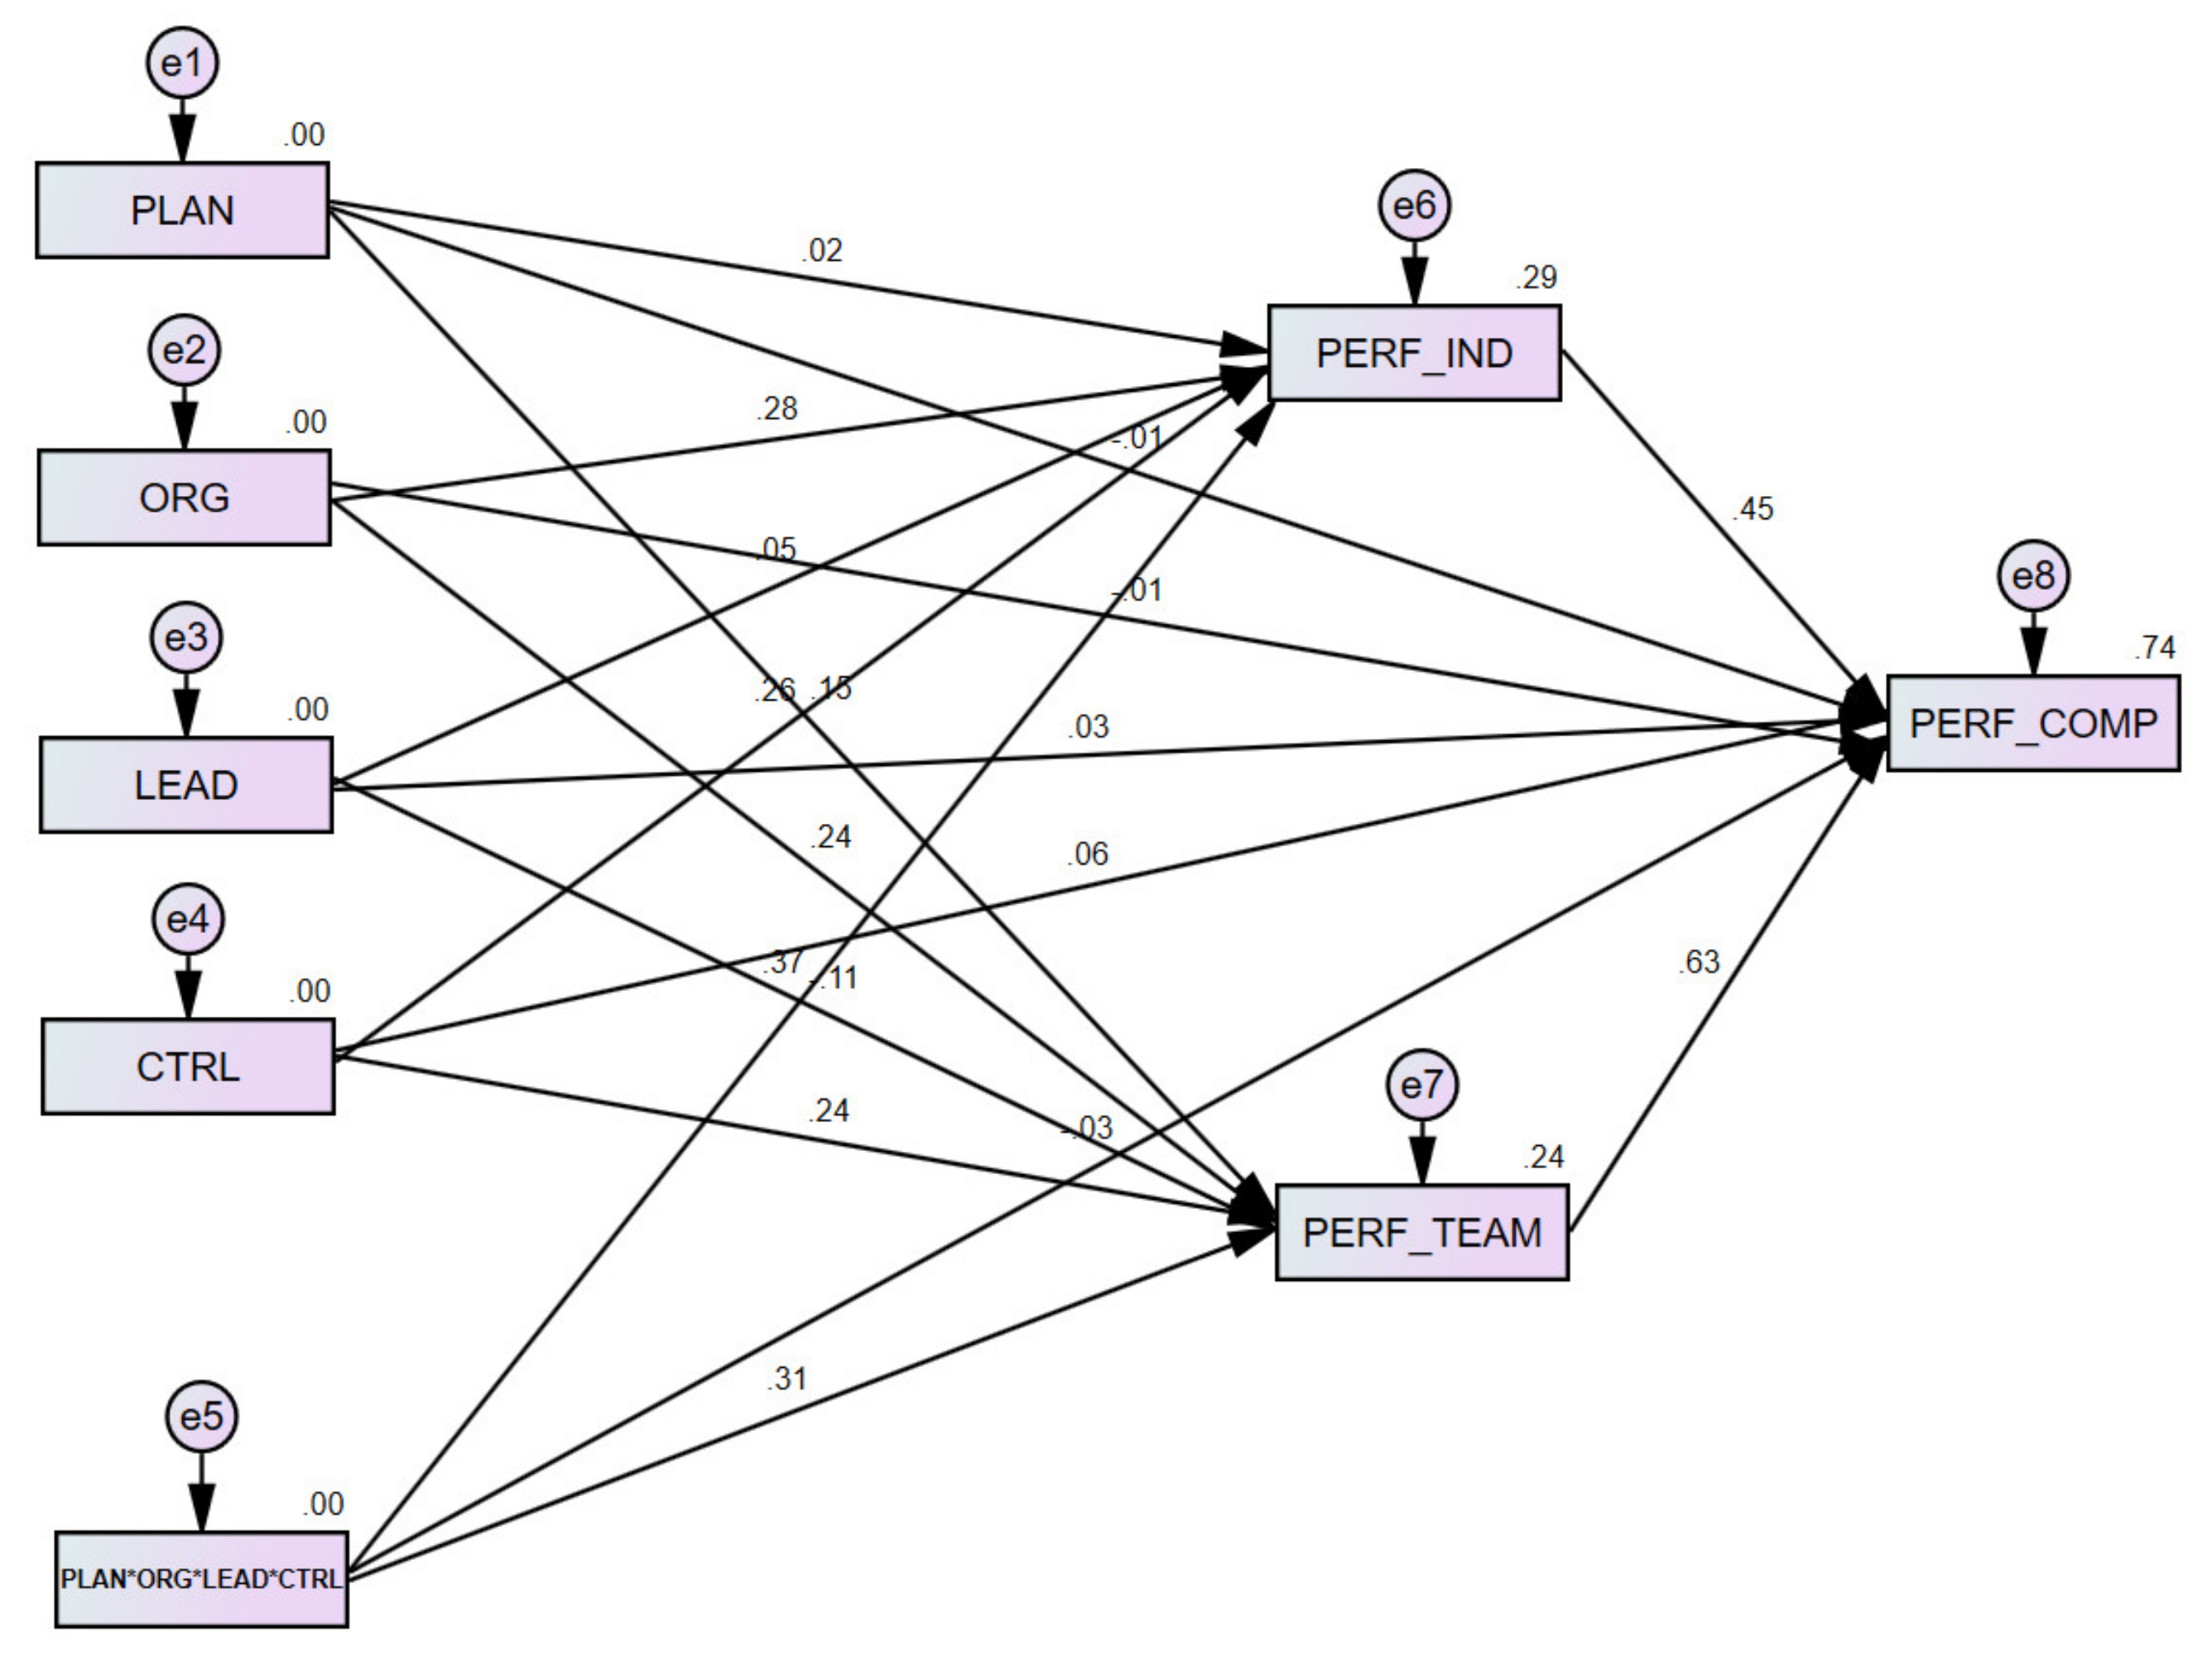
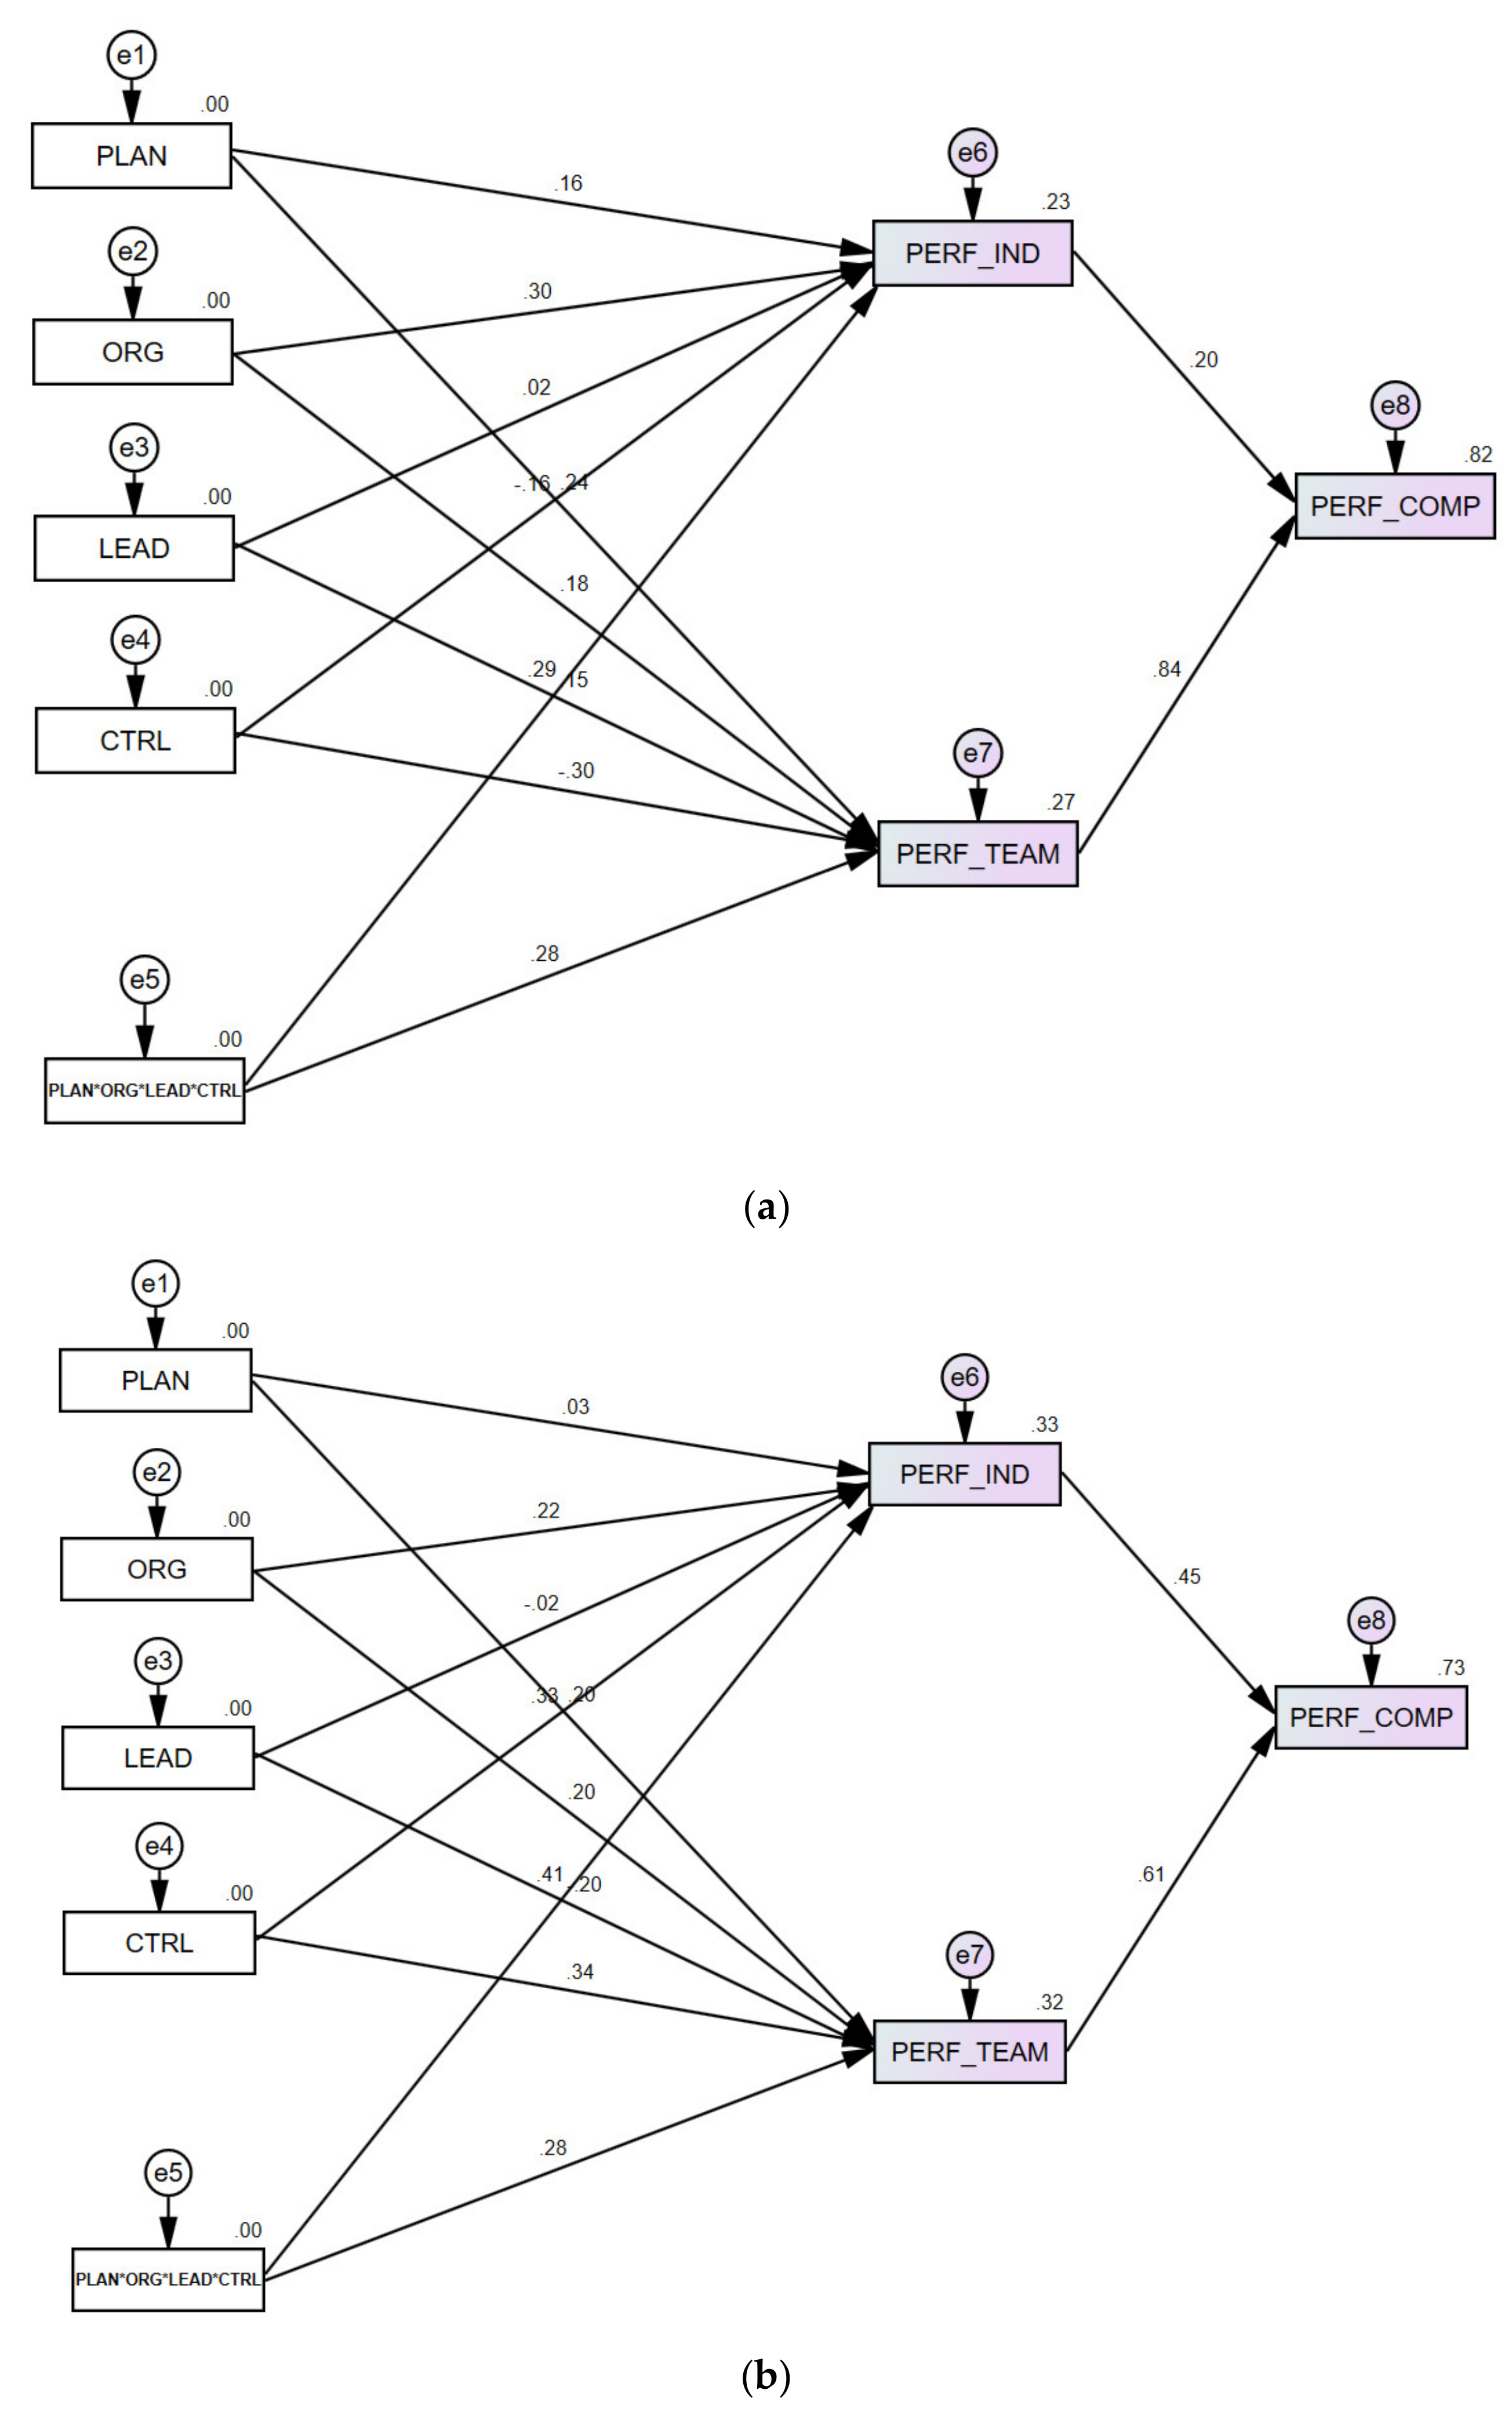
4.3. Structural Model Evaluation and Hypotheses Testing

Structural equation modeling was applied to test the hypothesized relationships among the elements of the proposed research model. Latent variable structural model-based path analysis (Figure A2) specific statistics are included in Table 4, regarding standard (st.) regression weight or estimate (β), standard error (S.E.), critical ratio for regression weight (C.R.), and statistical significance (p) for each relation.
The first four hypotheses (H1a–d) deliberate around the individual influence of each managerial function on individual-level performance of co-workers. With reference to planning, as one of the managerial functions, the analysis results indicated a path coefficient of 0.021 with a low statistical significance of p = 0.731 (p > 0.05). Consequently, H1a was not supported. Regarding the influence of organizing on individual-level performance of co-workers, the data analysis indicated a positive path coefficient of 0.280 with a statistical significance of p < 0.001. Accordingly, H1b was supported. Concerning the effect of the managerial function of leading, the analysis results indicated a negative path coefficient of –0.055 with a low statistical significance of p = 0.375 (p > 0.05). Thus, H1c was not supported. Referring to the influence of controlling on individual-level performance of co-workers, the data analysis findings indicated a positive path coefficient of 0.263 with a statistical significance of p < 0.001. Therefore, H1d was supported.
The next hypothesis (H1e) considered the joint effect of the four managerial functions on the individual-level performance of co-workers. Regarding the common effect of planning, organizing, leading, and controlling, the data analysis results indicated a positive path coefficient of 0.366 with a statistical significance of p < 0.001. Accordingly, H1e was supported, highlighting the necessity of the proper correlation and combination of all the four managerial functions in order to obtain enhanced co-worker performance within the team and implicitly to contribute to the performance of the group when aggregated.
The following four hypotheses (H2a–d) deliberated around the individual influence of each single managerial function on team-level performance. With reference to planning, the analysis results indicated a path coefficient of 0.147 with a statistical significance of p = 0.020 (p < 0.05). Consequently, H2a was supported. Regarding the influence of the organizing on team performance, findings indicated a positive path coefficient of 0.241 with a statistical significance of p < 0.001. Accordingly, H2b was supported. Concerning the effect of leading, the analysis results indicated a negative path coefficient of –0.108 with a limited statistical significance of p = 0.089 (p > 0.05). Thus, H2c was not supported. Referring to the influence of controlling on team performance, the data analysis indicated a positive path coefficient of 0.243 with a statistical significance of p < 0.001. Therefore, H2d was supported.
The subsequent hypothesis (H2e) considered the joint effect of the four managerial functions on team-level performance. Regarding the common effect of planning, organizing, leading, and controlling, the analysis results indicated a positive path coefficient of 0.306 with a statistical significance of p < 0.001. Accordingly, H2e was supported, emphasizing the necessity of an appropriate correlation and common implementation of all the four managerial functions in order to obtain enhanced performance for the whole team.
The succeeding hypothesis (H3) within the main model considered the contribution of the performance of each co-worker within the team to the company-level sustainable performance. Data analysis results indicated a positive path coefficient of 0.434 with a statistical significance of p < 0.001. Consequently, H3 was supported.
The last hypothesis (H4) specific to the main model considered the potential effect of team-level performance on company-level sustainable performance assuring business continuity in time. Data analysis results indicated a positive path coefficient of 0.640 with a statistical significance of p < 0.001. Therefore, H4 was supported.
Figure A1 shows the significant causal relationships validated among the latent variables. A total determination coefficient (R2) of 0.739 reflects a high level of shared influence explained by the four of endogenous variables (management functions and the two mediators (individual co-workers and team-level performance) on the variance of exogenous variable (company-level sustainable performance).
In order to discover the best fitting alternative research model, four competing additive versions were considered (Models 1–4 in Table 5), all with different structural components, consisting of different types of relations and having special forms. In all the models, the endogenous company-level sustainable performance construct was maintained as dependent variable.
The direct model (1) encompasses the simplest structure, including only the immediate direct and straight forward relationships among the four management functions (independent variables) and company-level sustainable performance (dependent variable). In this case exclusively, organizing (β = 0.216, p = 0.002) and controlling (β = 0.251, p < 0.001) had significant positive influence, explaining a limited amount (12.7%) variance of the company-level sustainable performance construct.
The interaction model (2) was grounded within the complementary approach rationale, by including simultaneously both the individual effects and the combined synergistic pattern of the four management functions. By creating a joint effect type new independent variable, besides organizing (β = 0.225, p < 0.001) and leading (β = 0.286, p < 0.001), the additional mutual effect variable (β = 0.278, p < 0.001) has also been statistically validated, explaining a supplementary 9.2% from the variance of the company-level sustainable performance variable, reaching to a total R2 of 0.219.
Due to low determination within the previous models, the next model (3) considered the individual co-worker’s performance and team-level performance as mediating factors between the four management functions (as treated in model 1) and the company-level sustainable performance. In this mediation model, organizing (β = 0.269, p < 0.001) and controlling (β = 0.215, p = 0.001) maintained their direct influence on companies’ sustainable performance, thus emphasizing a partial mediation. Both organizing and controlling had also direct influence on the mediators—individual co-workers’ performance (β = 0.231, p < 0.001; β = 0.202, p = 0.003) and on team-level performance (β = 0.269, p < 0.001; β = 0.215, p = 0.001); which in turn (β = 0.444, p < 0.001; β = 0.658, p < 0.001) had significant influences on company-level sustainable performance. Model 3 explained 70.7% of variance of the companies’ sustainable performance, thus the mediating relations added an increase of 58% within the determination level.
Within the complete model (4), we added to the previous mediation model (3) the four-way synergistic joint effect of the management functions, both in a direct and mediated manner. All the direct individual and joint influences of the management functions on company-level sustainable performance were statistically insignificant. The direct effects of organizing (β = 0.28, p < 0.001), controlling (β = 0.263, p < 0.001) and the four-way combination of the managerial functions (β = 0.366, p < 0.001) on co-workers’ performance were supported, complementary, planning (β = 0.147, p = 0.020), organizing (β = 0.241, p < 0.001), controlling (β = 0.243, p < 0.001) and the four-way combination of the managerial functions (β = 0.306, p < 0.001) on team-level performance were found valid. Further, the mediators, individual co-workers’ performance (β = 0.447, p < 0.001) and team-level performance (β = 0.63, p < 0.001) had positive impact on sustainable performance. The above valid and invalid relations describe a full mediating model, which explained a significant total effect of 73.9% of variance of the company-level sustainable performance. Therefore, model 4 highlighted the greatest explanatory power of the alternative models, imposing the consideration of both the individual and synergistic management function tetrad, the mediating role of individual and team performance, all in order to explain de company-level sustainable performance.
In order to complete the above analysis regarding the influence of cultural diversity in the case of the proposed research model, the sample has been split into mono-cultural and multicultural clusters, depending on the self-declared type of team setup. Therefore, 30 respondents and their answers were included within the mono-cultural subset of data, while 159 respondents within the multicultural subset.
Considering the cultural diversity-based moderated model based data analysis (Table 6, Figure A3), the contribution of the individual co-worker performance, and of the team-level performance on the company-level sustainable performance within the mono-cultural cluster, findings indicated positive path coefficients of 0.199 and 0.842 with statistical significance of p = 0.012 and p < 0.001.
In the case of the multi-cultural cluster, the contribution of the individual co-worker performance and of the team-level performance on the company-level sustainable performance, findings showed positive path coefficients of 0.415 and 0.606 with statistical significance of p < 0.001.
In order to test hypotheses H5a-b, Lowry and Gaskin’s [88] methodology was applied aiming to highlight the statistically relevant differences between the two clusters. A negative significant z-score was calculated for the effect of team-level performance on the company-level sustainable performance (z = −1.985, p < 0.05), emphasizing a more powerful relation for the mono-cultural cluster than for the multicultural cluster. A positive significant z-score was obtained for the influence of individual co-workers’ performance on the company-level sustainable performance (z = 3.872, p < 0.001), emphasizing a more powerful relation for the multicultural cluster than for the mono-cultural cluster. Consequently, hypotheses H5a and H5b are both valid.
In the case of the mono-cultural team cluster, Figure A3a illustrates the main causal relationships with a total determination coefficient (R2) of 0.828, reflecting an elevated level of variance explained by the four endogenous variables (management functions) and the two mediators (individual co-workers’ and team-level performance) within this subsample, compared to the case of the general model or of the multi-cultural subsample. Comparatively, within the multicultural team cluster, Figure A3b points out the key causal relationships with a total determination coefficient (R2) of 0.727, reflecting a slightly lower amount of variance explained by the considered variables, than in the case of the mono-cultural teams or within the general model.

5. Discussions

First, regarding our assumptions that managerial functions have positive, direct, and significant effect on individual and collective team performance (H1 and H2), partially supported findings were obtained.
Planning has no impact on individual co-workers’ performance but is significantly correlated with collective team performance. So, planning does not lead to the development of neither technical nor the soft skills corresponding to social and cultural intelligence of team members. This aspect could be explained by the IT field specific practices, where goals are predefined in a very specific way and then are allocated at the level of the operational teams, without the participation of team members in goals settlement. The lack of interaction between members regarding goal setting is what may explain why planning does not contribute to the development of co-worker skills related to communication, empathy, or openness to other cultures. About the increase of satisfaction at the level of team members, Sărătean [3] emphasizes that the feeling of participation in decision making is little correlated with the level of satisfaction and that it is more related to involvement. Instead, our empirical research shows that planning is correlated with team-level performance, respectively with the level of productivity obtained, with the quality of decisions made and with the development of the ability to solve complex problems. The most likely explanation is that productivity is a clear, numerical indicator, and the achievement of team specific goals was better correlated with a numerical result. Secondly, during the achievement of the team’s goals, syncope may appear, which requires, on the one hand, priority and support given to common objectives, and on the other hand, critical thinking and sharing ideas, aspects that lead to decisions and complex problem solving.
Organizing is positively correlated both with individual co-workers’ performance and with the collective performance of the team. Teamwork in the IT field involves complex, specific, and interdependent tasks, which require interactions between members, and some already mentioned research [5,18] show the dependence of performance on the type of tasks and on tasks interdependency. In this context, the obtained empirical results confirm that the establishment of clear roles, rules, and procedures and the assignment of people with profiles corresponding to the role to be assumed are measures that lead, on the one hand, to the development of professional, linguistic, social, and intercultural skills of members, and to their satisfaction after the task completion, and on the other hand, develops collective decision-making, problem solving capabilities, and increased team productivity. Further, we presume that the validation of hypothesized assumptions related to the impact of organization on performance in the case of diverse IT teams is strengthened by the type of tasks given to the team.
The relationships between leading and individual co-workers’ performance and collective performance of the team were not validated. These were surprising results, given the several contradictory empirical researches evoked in the theoretical part of the paper [39,40,41,42], which confirmed the positive effect of leadership on team performance. We would have expected that motivation by adapting to the needs and cultural profile of members, as well as the performance based rewarding, determine the satisfaction of members, as it is known according to Stacy Adams’ equity theory, that motivation generates satisfaction when the individual feels treated equitable [3] and when personal needs are covered. Likewise, we expected that a good interaction with the team leader and his/her problem-solving support would lead to the development of the individual and collective abilities of the team members. A few possible explanations for these results could relate to the fact that the really important team rewards for diverse teams are primary related to the feeling of personal achievement after task completion [25], and thus not to the material rewards. In the case of IT teams, the salary level is negotiated at the beginning of teamwork depending on the tasks to be performed and does not change over time on individual performance basis; thus, the error of self-favoring in attribution may have worked in the case of the received answers [3], demonstrating that people tend to attribute their success to themselves and consider others or contextual factors responsible in situations of failure. In the case of the studied teams, team members assumed success and did not consider that the leader, by exercising the function of leading, would have positively influenced the results; moreover, it is possible that leading, as authors conceptualized it, does not have a direct positive connection with the results, rather through other mediating factors.
Control has a direct and significant influence on both the individual performance of the members and the collective performance of the team. Our approach towards control took into account the evaluation of both sides of members’ contribution: The contribution to the actual team performance and the co-working members’ skills. Empirical findings within the current research show that monitoring during the accomplishment of common tasks leads directly both to the development of members’ interpersonal and professional skills, and to the registration of satisfaction, as a probable result of the feedback loop that the control implies aspects validated by the work enrichment theory of Hackman and Oldham [3]. As well, we consider that as a result of the feedback loop and unfavorable consequences for inadequate performance, control also leads to increased team productivity, along with enhanced decision-making and problem-solving skills.
When comparing the influence of management functions on performance, based on the level of statistical significance, we deduce that organizing and controlling have a slightly greater positive influence on individual performance than on team performance, probably due to the immediate effect of these managerial actions on each member.
Second, the joint impact of the management functions on performance is confirmed, both at individual level and entire team level, due to the fact that they are highly interdependent. As a nuance, we notice that the common influence of the four managerial functions is positive and slightly higher on individual level than on the collective level of performance. These results corroborate the opinion of Bibu et al. [38] that the neglect or minimization of the importance of one or more of the management functions affects the full achievement of the common goal.
Thirdly, with regard to hypotheses H3 and H4, for multicultural companies in the IT sector, the study confirmed the direct, positive, and significant link between, on the one hand, the performance in terms of members’ skills development and the team-level quantitative and qualitative performance, and on the other hand, the development of sustainable strategic competences through which we conceptualized performance at company level. As an observation, we note that the collective performance of the team have a greater positive influence than the performance at individual-level on companies’ performance, most likely because the conjugation and coalesce of individual contributions and competences, synergistic effects are obtained at team level and then at company level. However, it remains for future research to prove the synergistic effect between individual and team performance. Anyways, this research empirically validated that cultural diversity is a source of competitive advantage, similarly as stated by Meier [60] and Cox and Blake [61].
Fourth, comparisons between mono-cultural and multicultural IT teams (H5) highlight the next similarities and differences.
For both mono-cultural and multicultural teams working in the IT sector, a positive relation was validated between the individual team members’ performance and the sustainable performance of the company, with the observation that between-group statistics proved a significant difference between the two clusters, in the sense that this relation was greater for multicultural teams than for the mono-cultural ones. Considering this difference, hypothesis H5a was supported.
Likewise, although for both types of teams, the positive effect of team-level performance on the sustainable performance of the company was confirmed, the group differences proved a statistically significant disparity, where effects were stronger for mono-cultural teams than in the case of multicultural team settings. This differentiation validates hypothesis H5b.
In connection to both team categories, the team-level common performance has a greater positive influence on company performance than the individual co-workers’ performance.
However, we note that, in our research, the estimates and statistical significance of the links between individual and collective performance of both mono- and multicultural teams and the sustainable performance of the company are influenced by the individual and joint impact of the management functions, as shown in Figure A3.
As conclusion for hypothesis H5, there is significant difference between the mono-cultural and multi-cultural teams regarding the individual co-workers’ performance on company-level sustainable performance, and team-level performance on company-level sustainable performance. For both relations, cultural diversity can be a potential predictor of performance differences.

6. Conclusions, Implications, Limitations, and Future Research Directions

6.1. Conclusions

The management of IT diverse teams influences the performance of each co-worker and their collective performance if all management functions are assumed and implemented in conjunction by the manager. Nevertheless, in the case of operational level teams within the multinational IT companies, the dominant role in the whole management process is held by controlling and organizing management functions, although empirical research shows that none of them should be neglected. We note that the interdependent influence of the four management functions is positive and somewhat higher on the individual level co-workers’ performance than on the collective team-level performance, more likely because respondents answered from the perspective of their personal experiences within the team.
A complementary analysis additionally underpinned to the main aim of the paper shows that in the case of sampled mono-cultural and multicultural teams acting in the IT sector, the significant positive impact of individual and collective performance of the team members on the sustainable performance of the company were supported. For both subsample of team types, collective performance had a greater impact on the companies’ sustainable performance than the results manifested at personal level for the teammates. However, in the case of multicultural teams, the impact of co-workers’ individual performance is found in a greater extent in the company’s performance than in the case of mono-cultural teams. In contrast, in the case of mono-cultural teams, due to the non-existence of the cultural differentiation factor between the members, the common performance compared to the individual ones are found more in the development of sustainable competencies at company level. However, the obtained results must be taken into account with some restraint and precaution, given the significant difference in size between the two subsamples.

6.2. Implications

Regarding the available theoretical frameworks on the research topic, we can formulate several elements of approximation or differentiation of the conducted research compared to other studies, in order to emphasize a number of academic implications.
Following the literature review, we did not find any empirical study that would analyze the connection between diverse team management from the prism of management functions and their performance. As specified, extant research concentrates on the relations between leadership styles and team performance, with reference to decision-making and situational leadership to motivate team members. In contrast, our approach is more complete and integrative because it deals with all the activities composing the management process (planning, organizing, leading, and controlling), considered both independently and interdependently, and highlights the fact that leading positively influences performance only in interrelated with other managerial functions. Of course, the research results were validated in the context of IT teamwork, which involved the interdependence of tasks, a very specific definition of these tasks and of the expected performance, and it is likely that they cannot be extrapolated in the context of low-level task interdependency and specificity.
We appreciate that the conducted research differs from other studies in terms of how to approach the positive results generated by cultural diversity of teams on three levels, individual, team, and organizational tiers, demonstrating that good management of diverse teams stimulates the effectiveness of members and teams as an entity, and generate organizational effectiveness by developing sustainable strategic competences.
Alternatively, the assessment of hypotheses regarding the existence of differences in performance between mono- and multicultural teams under the impact of team management confirms the opinion of Stahl et al. [15] who argued that cultural differences may have a different positive impact than other sources of diversity on team results. We complete this idea, stating that in the case of multicultural teams, individual differences can have a greater impact on the development of company level sustainable competencies than in mono-cultural contexts, as empirically verified and validated.
Another original approach within the empirical study concerns the potential interdependence of the management functions, by considering their individual and four-way synergistic joint effects, an idea and technique borrowed from the strategic management field.
Complementarily, from data analysis perspective, as a differentiation feature, the technique of alternative additive models was included within the empirical section, in order to identify the best fit option with the highest coefficient of determination for the company-level sustainable performance.
From the perspective of practical implications, the study emphasizes the fact that within the team management process, managers should not ignore any of the managerial functions because they, only in interdependence and through their joint effect, allow for the achievement of the expected results. Given that the analyzed teams are placed at operational level within the organization, we deduce that first line IT managers must give more importance to the organizing and controlling functions in order to achieve the team objectives, without neglecting any of the other management functions. Also, it must be taken into account that leading has no direct effect on results, unless the actions of motivation, communication, and provided support are well correlated with the other activities involved in the management process.
From a strategic perspective, in the context of internationalization and multiplication of multicultural companies, the results obtained show the importance of an emerging strategic approach, the bottom-up version, in the development of sustainable strategic competence and in gaining competitive advantage.

6.3. Limitations and Future Research Directions

The current study has several limitations. One of them is the fact that we analyzed the answers globally and not separately on each and every team or on types of teams according to their size, an analysis that would have allowed us to obtain more nuanced results. We were forced to choose this approach because we could not get the full opinion of all members of the analyzed teams.
A limitation regarding the general validity of the obtained results also refers to the small sample of respondents from mono-cultural teams participating in the study, compared to the number of respondents from multicultural teams. In future studies, new techniques could be used to balance unequal sized subsamples, like fuzzy logic or creating multiple variable based configurative structures.
Another limitation of the empirical research is that we did not check statistical relations between team members’ individual performance and team-level performance, which would allow us to capture the transition from individual results to collective team results. We consider this analysis as a potential continuation of this topic.
The authors also suggest the replication of the study in other European countries or within other economic sectors, analogous to the stimulation of research interest on the topic and to increase results’ generalizability.
In addition to the previously mentioned research direction and based on the empirically proved interdependence between the management functions, we propose to identify which function conditions the others to a greater extent and plays the most important mediating role in obtaining performance within the IT sector. This research path is highly relevant because special combinations of management functions might be suitable for different types of teams or have superior impact on certain types of performance. We also consider that it would be interesting to compare teams whose members work in face-to-face and virtual settings from the perspective of obtained individual, collective, and organizational performance.

Author Contributions

Conceptualization, E.C., M.-D.M., and E.-S.F.; questionnaire development, E.C. and M.-D.M.; data collection, M.-D.M.; software, E.-S.F.; model design and validation, E.-S.F.; formal data analysis, E.-S.F.; writing—original draft preparation and review: Introduction, E.C., literature review: E.C., M.-D.M., and S.V.-A., methodology: E.-S.F., data analysis results: E.-S.F., discussion: E.C., M.-D.M., E.-S.F., and S.V.-A., conclusions, limitations, and future research directions: E.C.; writing—editing, M.-D.M.; supervision, E.C.; funding acquisition, M.-D.M. All authors have read and agreed to the published version of the manuscript.

Funding

This research was funded by the project: FDI-2020-0253 “Research excellence through the support of WUT Researchers”.

Acknowledgments

The authors are grateful to the editors and the three anonymous reviewers for their guidance and valuable recommendations that helped us to improve this paper.

Conflicts of Interest

The authors declare no conflict of interest.

Appendix A

Table A1. Summary of survey items and measurement scales.
SectionQuestionItem CodeMeasurement Scale
PlanningThere are clear goalsPLAN_11 = Strongly disagree
to
5 = Strongly agree
The goals of the team are established with the involvement of the membersPLAN_2
Team goals are shared and supported by each member PLAN_3
Team goals go beyond individual goalsPLAN_4
OrganizingThere are clear rules and proceduresORG_11 = Strongly disagree
to
5 = Strongly agree
The operating rules are accepted and respected by each member ORG_2
Each member knows and respects their role and responsibilitiesORG_3
Each member has the professional/technical skills necessary to assume his roleORG_4
Each member has the social and emotional intelligence needed for the relationship ORG_5
LeadingThe opinion of the team members is listened to and considered LEAD_11 = Strongly disagree
to
5 = Strongly agree
The leader supports his team members in solving problems LEAD_2
The leader adapts the motivational modalities according to the individual needs and cultural expectations of the members LEAD_3
Membership rewards are correlated with individual performance and team performanceLEAD_4
ControllingYour contributions to collective performance are evaluatedCTRL_11 = Strongly disagree
to
5 = Strongly agree
Your qualities of a good team player are evaluatedCTRL_2
Individual-level co-workers’ performanceIncreased member satisfactionPERF_IND_11 = Not at all
to
5 = To a very great extent
Professional skills development of the team members PERF_IND_2
Development of members’ language skillsPERF_IND_3
Development of members’ communication skills PERF_IND_4
Developing the empathy of the team membersPERF_IND_5
Development of tolerance and openness to other culturesPERF_IND_6
Team-level performanceIncreased team productivityPERF_TEAM_11 = Not at all
to
5 = To a very great extent
Analyzing problems from several cultural perspectives and making better decisionsPERF_TEAM_2
Increased ability to solve complex problemsPERF_TEAM_3
Company-level sustainable performanceIncreased company adaptability on the market as a result of the accumulated knowledge regarding the cultural practices and customs of its ownPERF_COMP_11 = Not at all
to
5 = To a very great extent
The manifestation of innovation within the companyPERF_COMP_2
Team demographicsIn what country is your company located?Self-reported
What position do you have within the team? (leader/member)
How long you have been working in the team? (below 6 months/between 6 months and 1 year/over 1 year)
How big is your team? (below 5 members/between 5 and 8 members/between 9 and 15 members/over 15 members)
In which category does the team fall? (face-to-face mono-cultural team/virtual mono-cultural team/face-to-face bicultural team/face-to-face multicultural team/virtual bi- or multicultural team)
Your team set-up is: (temporary/permanent)
Respondent specific informationWhat is your job title?Self-reported
The culture you come from
Figure A1. Measurement model specific to the research model.
Sustainability 12 07414 g0a1
Figure A2. Path diagram according to the main research model. Note: path diagram with standardized parameter estimations.
Sustainability 12 07414 g0a2
Figure A3. Cultural diversity moderated research model. (a) Mono-cultural team cluster; (b) Multicultural team cluster.
Sustainability 12 07414 g0a3

References

  1. Blanc, G.; Cremadez, M. Structure. In Strategor: Stratégie, Structure, Décision, Identité, 2nd ed.; InterEditions: Paris, France, 1997. [Google Scholar]
  2. Chevrier, S. Le Management des Équipes Interculturelles; Presses Universitaires de France: Paris, France, 2000. [Google Scholar]
  3. Sărătean, E. Comportament Organizational; Mirton: Timișoara, Romania, 2008. [Google Scholar]
  4. Waxin, M.-F.; Barmeyer, C. Gestion des Ressources Humaines Internationals; Les Editions de Liaisons: Paris, France, 2008. [Google Scholar]
  5. Tirmizi, S.A. Towards Understanding Multicultural Teams. In Effective Multicultural Teams: Theory and Practice. Advances in Group Decision and Negotiation; Halverson, C.B., Tirmizi, S.A., Eds.; Springer: Dordrecht, The Netherlands, 2008; Volume 3, pp. 1–20. [Google Scholar] [CrossRef]
  6. Williams, K.Y.; O’Reilly, C.A., III. Demography and Diversity in Organizations: A Review of 40 years of research. Res. Organ. Behav. 1998, 20, 77–140. [Google Scholar]
  7. Stahl, G.K.; Maznevski, M.L.; Voigt, A.; Jonsen, K. Unraveling the effects of cultural diversity in teams: A meta-analysis of research on multicultural work groups. J. Int. Bus. Stud. 2010, 41, 690–709. [Google Scholar] [CrossRef]
  8. Meckl, R.; Johanning, M. Leading Multicultural Teams in the PR China. Am. J. Ind. Bus. Manag. 2013, 3, 49–63. [Google Scholar] [CrossRef] [Green Version]
  9. Bowers, C.A.; Pharmer, J.A.; Salas, E. When member homogeneity is needed in work teams: A meta-analysis. Small Group Res. 2000, 31, 305–327. [Google Scholar] [CrossRef]
  10. Webber, S.S.; Donahue, L.M. Impact of highly and less job-related diversity on work group cohesion and performance: A meta-analysis. J. Manag. 2001, 27, 141–162. [Google Scholar] [CrossRef]
  11. Kozlowski, S.W.J.; Bell, B.S. Work groups and teams in organizations. In Handbook of Psychology: Industrial and Organizational Psychology; Borman, W.C., Illgen, D.R., Klimoski, R.J., Eds.; John Wiley & Sons Inc.: New York, NY, USA, 2003; Volume 12, pp. 333–375. [Google Scholar]
  12. Staples, D.S.; Zhao, L. The Effects of Cultural Diversity in Virtual Teams Versus Face-to-Face Teams. Group Decis. Negot. 2006, 15, 389–406. [Google Scholar] [CrossRef]
  13. Van Knippenberg, D.; De Dreu, C.K.W.; Homan, A.C. Work Group Diversity and Group Performance: An Integrative Model and Research Agenda. J. Appl. Psychol. 2004, 89, 1008–1022. [Google Scholar] [CrossRef]
  14. Jehn, K.A.; Northcraft, G.B.; Neale, M.A. Why Differences Make a Difference: A Field Study of Diversity, Conflict, and Performance in Workgroups. Adm. Sci. Q. 1999, 44, 741–763. [Google Scholar] [CrossRef] [Green Version]
  15. Stahl, G.K.; Mäkelä, K.; Zander, L.; Maznevski, M.L. A look at the bright side of multicultural team diversity. Scand. J. Manag. 2010, 26, 439–447. [Google Scholar] [CrossRef]
  16. Bui, H.; Chau, V.S.; Degl’Innocenti, M.; Leone, L.; Vicentini, F. The resilient organisation: A meta-analysis of the effect of communication on team diversity and team performance. Appl. Psychol. 2019, 68, 621–657. [Google Scholar] [CrossRef]
  17. Díaz-Fernández, M.C.; González-Rodríguez, M.R.; Simonetti, B. Top management team diversity and high performance: An integrative approach based on upper echelons and complexity theory. Eur. Manag. J. 2020, 38, 157–168. [Google Scholar] [CrossRef]
  18. Nouri, R.; Erez, M.; Rockstuhl, T.; Ang, S.; Leshem-Calif, L.; Rafaeli, A. Taking the bite out of culture: The impact of task structure and task type on overcoming impediments to cross-cultural team performance. J. Organ. Behav. 2013, 34, 739–763. [Google Scholar] [CrossRef]
  19. De Jong, B.A.; Elfring, T. How does trust affect the performance of ongoing teams? The mediating role of reflexivity, monitoring, and effort. Acad. Manag. J. 2010, 53, 535–549. [Google Scholar] [CrossRef]
  20. Schraeder, M.; Self, D.R.; Jordan, M.H.; Portis, R. The Functions of Management as Mechanisms for Fostering Interpersonal Trust. Adv. Bus. Res. 2014, 5, 50–62. [Google Scholar]
  21. Druskat, V.U.; Wolff, S.B. Building the Emotional Intelligence of Groups. Harv. Bus. Rev. 2001, 79, 80–90. [Google Scholar]
  22. Rezvani, A.; Barrett, R.; Khosravi, P. Investigating the relationships among team emotional intelligence, trust, conflict and team performance. Team Perform. Manag. Int. J. 2019, 25, 120–137. [Google Scholar] [CrossRef]
  23. Ceri-Booms, M.; Curşeu, P.L.; Oerlemans, L.A.G. Task and person-focused leadership behaviors and team performance: A meta-analysis. Hum. Resour. Manag. Rev. 2017, 27, 178–192. [Google Scholar] [CrossRef] [Green Version]
  24. Bebenova-Nikolova, D. Intercultural Competence—Key Competence of Multicultural Teams. J. Danub. Stud. Res. 2014, 4, 177–185. [Google Scholar]
  25. Thomas, D.C.; Ravlin, E.C.; Wallace, A.W. Effect of cultural diversity in work groups. Res. Sociol. Organ. 1996, 14, 1–33. [Google Scholar]
  26. Cheng, C.-Y.; Chua, R.Y.J.; Morris, M.W.; Lee, L. Finding the right mix: How the composition of self-managing multicultural teams’ cultural value orientation influences performance over time. J. Organ. Behav. 2012, 33, 389–411. [Google Scholar] [CrossRef]
  27. Lisak, A.; Erez, M. Leadership emergence in multicultural teams: The power of global characteristics. J. World Bus. 2015, 50, 3–14. [Google Scholar] [CrossRef]
  28. Hofstede, G. Cultures and Organizations: Software of the Mind; McGraw-Hill: London, UK, 1991. [Google Scholar]
  29. Hofstede, G. Dimensionalizing Cultures: The Hofstede Model in Context. Online Read. Psychol. Cult. 2011, 2, 1–26. [Google Scholar] [CrossRef]
  30. Hall, E.T. Beyond Culture; Anchor: Garden City, NY, USA, 1976. [Google Scholar]
  31. Paletta, F.C.; Dias Vieira, N., Jr. Information technology and communication and best practices in it lifecycle management. J. Technol. Manag. Innov. 2008, 3, 80–94. [Google Scholar] [CrossRef]
  32. Jang, S. Cultural Brokerage and Creative Performance in Multicultural Teams. Organ. Sci. 2017, 28, 993–1009. [Google Scholar] [CrossRef]
  33. Bantel, K.A. Strategic Planning Openness: The role of top team demography. Group Organ. Manag. 1994, 19, 406–424. [Google Scholar] [CrossRef]
  34. Ley, T.; Albert, D. Identifying employee competencies in dynamic work domains: Methodological considerations and a case study. J. Univers. Comput. Sci. 2003, 9, 1500–1518. [Google Scholar] [CrossRef]
  35. Robbins, P.S.; DeCenzo, D.A. Management. L’essentiel des Concepts et des Pratiques, 6th ed.; Pearson Education: Upper Saddle River, NJ, USA, 2008. [Google Scholar]
  36. Certo, S.C.; Certo, S.T. Modern Management: Concepts and Skills; Upper Prentice Hall: New York, NJ, USA, 2012. [Google Scholar]
  37. Fayol, H. Administration Générale et Industrielle; Dunod: Paris, France, 1916. [Google Scholar]
  38. Bibu, N.A.; Predișcan, M.; Sala, D. Managementul Organizațiilor; Mirton: Timișoara, Romania, 2008. [Google Scholar]
  39. Ilieș, L.; Lazar, I.; Mortan, M.; Popa, M.; Lungescu, D.; Veres, V. Management; Risoprint: Cluj-Napoca, Romania, 2008. [Google Scholar]
  40. Burciu, A.; Prelipceanu, G.; Bostan, I.; Hapenciuc, V.; Chasovschi, C.; Roman, C.; Popescu, M.; Vancea, R.; Dimbu, D.; Nastase, C. Introducere in Management; Editura Economică: Bucharest, Romania, 2008. [Google Scholar]
  41. Mihuţ, I.; Pop, I.S.; Lazăr, I.; Popa, M.; Mortan, M.; Lungescu, D. Management General; Carpatica: Cluj-Napoca, Romania, 2003. [Google Scholar]
  42. Burduș, E.; Căprărescu, G. Fundamentele Managementului Organizației; Editura Economică: Bucharest, Romania, 1999. [Google Scholar]
  43. McDonald, P. Teaching the concept of management: Perspectives from ‘six honest serving men’. J. Manag. Organ. 2010, 16, 626–640. [Google Scholar] [CrossRef]
  44. Ford, J.K.; Smith, E.M.; Weissbein, D.A.; Gully, S.M.; Salas, E. Relationships of goal orientation, metacognitive activity, and practice strategies with learning outcomes and transfer. J. Appl. Psychol. 1998, 83, 218–233. [Google Scholar] [CrossRef]
  45. DeShon, R.P.; Kozlowski, S.W.J.; Schmidt, A.M.; Milner, K.R.; Wiechmann, D. A Multiple-Goal, Multilevel Model of Feedback Effects on the Regulation of Individual and Team Performance. J. Appl. Psychol. 2004, 89, 1035–1056. [Google Scholar] [CrossRef] [Green Version]
  46. Khomutova, A. Basketball coaches’ experience in working with multicultural teams: Central and Northern European perspectives. Sport Soc. 2015, 19, 861–876. [Google Scholar] [CrossRef] [Green Version]
  47. Pazos, P. Conflict management and effectiveness in virtual teams. Team Perform. Manag. 2012, 18, 401–417. [Google Scholar] [CrossRef]
  48. Tang, F.; Mu, J.; Thomas, E. Who Knows What in NPD Teams: Communication Context, Mode, and Task Contingencies. J. Prod. Innov. Manag. 2015, 32, 404–423. [Google Scholar] [CrossRef]
  49. Wu, T.; Wu, Y.J.; Tsai, H.; Li, Y. Top Management Teams’ Characteristics and Strategic Decision-Making: A Mediation of Risk Perceptions and Mental Models. Sustainability 2017, 9, 2265. [Google Scholar] [CrossRef] [Green Version]
  50. Nicolaides, V.C.; LaPort, K.A.; Chen, T.R.; Tomassetti, A.J.; Weis, E.J.; Zaccaro, S.J.; Cortina, J.M. The shared leadership of teams: A meta-analysis of proximal, distal, and moderating relationships. Leadersh. Q. 2014, 25, 923–942. [Google Scholar] [CrossRef]
  51. Herbert, K.; Mockaitis, A.I.; Zander, L. An opportunity for east and west to share leadership: A multicultural analysis of shared leadership preferences in global teams. Asian Bus. Manag. 2014, 13, 257–282. [Google Scholar] [CrossRef]
  52. Kearney, E.; Gebert, D. Managing Diversity and Enhancing Team Outcomes: The Promise of Transformational Leadership. J. Appl. Psychol. 2009, 94, 77–89. [Google Scholar] [CrossRef]
  53. Rothacker, A.; Hauer, G. Leadership in multinational management—A behavior-set to motivate multicultural teams. Procedia-Soc. Behav. Sci. 2014, 130, 226–236. [Google Scholar] [CrossRef] [Green Version]
  54. Costa, A.C.; Bijlsma-Frankema, K. Trust and control interrelations: New perspectives on the trust-control nexus. Group Organ. Manag. 2007, 32, 392–406. [Google Scholar] [CrossRef] [Green Version]
  55. Piccoli, G.; Powell, A.; Ives, B. Virtual teams: Team control structure, work processes, and team effectiveness. Inf. Technol. People 2004, 17, 359–379. [Google Scholar] [CrossRef]
  56. Lai, C.J.; Yang, Y. The role of formal information sharing in key account team effectiveness: Does informal control matter and when. J. Pers. Sell. Sales Manag. 2017, 37, 313–331. [Google Scholar] [CrossRef]
  57. Lambovska, M.R. Control on teams: A model and empirical evidence from Bulgaria. Serbian J. Manag. 2018, 13, 311–322. [Google Scholar] [CrossRef] [Green Version]
  58. Courtright, S.H.; McCormick, B.W.; Mistry, S.; Wang, J. Quality charters or quality members? A control theory perspective on team charters and team performance. J. Appl. Psychol. 2017, 102, 1462–1470. [Google Scholar] [CrossRef] [PubMed]
  59. Amaram, D.I. Cultural Diversity: Implications for Workplace Management. J. Divers. Manag. 2007, 2, 1–6. [Google Scholar] [CrossRef] [Green Version]
  60. Meier, O. Management Intercultural, 5th ed.; Dunod: Paris, France, 2013. [Google Scholar]
  61. Cox, T.H.; Blake, S. Managing cultural diversity: Implications for organizational competitiveness. Acad. Manag. Perspect. 1991, 3, 45–56. [Google Scholar] [CrossRef]
  62. Trefry, M.; Vaillant, G. Harnessing cultural diversity to stimulate learning. In Current Topics in Management; Rahim, M.A., Golembiewski, R., Mackenzie, K., Eds.; Transaction: New Brunswick, NJ, USA, 2002; Volume 7, pp. 47–60. [Google Scholar]
  63. Barthorpe, S.; Duncan, R.; Miller, C. The pluralistic facets of culture and its impact on construction. Prop. Manag. 2000, 18, 335–351. [Google Scholar] [CrossRef]
  64. Tasa, K.; Taggar, S.; Seijts, G.H. The Development of Collective Efficacy in Teams: A Multilevel and Longitudinal Perspective. J. Appl. Psychol. 2007, 92, 17–27. [Google Scholar] [CrossRef]
  65. Yang, J. Thriving Organizational Sustainability through Innovation: Incivility Climate and Teamwork. Sustainability 2016, 8, 860. [Google Scholar] [CrossRef] [Green Version]
  66. Deglaine, J. Gestion des ressources humaines au croisement du projet stratégique de l’entreprise et du développement personnel. Cah. Manag. Technol. 2001, 11, 23–33. [Google Scholar]
  67. Pematin, D. Gérer par les Compétences ou Comment Réussir Autrement; Management et Société: Caen, France, 1999. [Google Scholar]
  68. Besson, P. Dedans-Dehors; Vuibert: Paris, France, 1997. [Google Scholar]
  69. Parlier, M. La compétence, nouveau modèle de gestion des ressources humaines. Personnel 1996, 335, 41–46. [Google Scholar]
  70. Sărătean, E. Managementul Resurselor Umane-Suport al Schimbării; Mirton: Timișoara, Romania, 2003. [Google Scholar]
  71. Bianco, F.; Venezia, M. Features of R&D Teams and innovation performances of sustainable firms: Evidence from the “sustainability pioneers” in the IT hardware industry. Sustainability 2019, 11, 4524. [Google Scholar] [CrossRef] [Green Version]
  72. Jiang, Q.; Liu, Z.; Liu, W.; Li, T.; Cong, W.; Zhang, H.; Shi, J. A principal component analysis based three-dimensional sustainability assessment model to evaluate corporate sustainable performance. J. Clean. Prod. 2018, 187, 625–637. [Google Scholar] [CrossRef]
  73. Székely, F.; Knirsch, M. Responsible leadership and corporate social responsibility: Metrics for sustainable performance. Eur. Manag. J. 2005, 23, 628–647. [Google Scholar] [CrossRef]
  74. Maletič, M.; Maletič, D.; Gomišček, B. An organizational sustainability performance measurement framework. In Recent Researches in Environment, Energy Systems and Sustainability; Ramos, R.A.R., Straupe, I., Panagopoulos, T., Eds.; WSEAS Press: Faro, Portugal, 2012; pp. 220–225. Available online: https://pdfs.semanticscholar.org/a3c7/c7c2962c5aad4c0f026f5d62c283fe05aff2.pdf/ (accessed on 30 August 2020)ISBN 978-1-61804-088-6.
  75. Latukha, M.; Lisina, P.; Panibratov, Y. Developing sustainable competitive advantage of a firm through human resource management practices: A competence-based approach. Glob. Bus. Econ. Rev. 2019, 21, 96–119. [Google Scholar] [CrossRef]
  76. Marhraoui, M.A.; El Manouar, A. IT Innovation and Firm’s Sustainable Performance: The Intermediary Role of Organizational Agility—An Empirical Study. Int. J. Inf. Eng. Electron. Bus. 2018, 10, 1–7. [Google Scholar] [CrossRef] [Green Version]
  77. Shahzad, M.; Qu, Y.; Zafar, A.U.; Rehman, S.U.; Islam, T. Exploring the influence of knowledge management process on corporate sustainable performance through green innovation. J. Knowl. Manag. 2020. [Google Scholar] [CrossRef]
  78. Mao, Y.; Quan, J. IT Enabled Organizational Agility and Firm Performance: Evidence from Chinese Firms. In Proceedings of the Wuhan International Conference on e-Business, Wuhan, China, 26–28 May 2017; Available online: http://aisel.aisnet.org/whiceb2017/59 (accessed on 29 August 2020).
  79. Novak, J.; Purta, M.; Marciniak, T.; Ignatowicz, K.; Rozenbaum, K.; Yearwood, K. The Rise of Digital Challengers How Digitization Can Become the Next Growth Engine for Central and Eastern Europe; Digital McKinsey: Bucharest, Romania, 2018. [Google Scholar]
  80. Prospective Insights in ICT R&D (PREDICT) 2020 Dataset. Available online: https://ec.europa.eu/jrc/en/predict (accessed on 29 August 2020).
  81. European Innovation Scoreboard 2020 Dataset. Available online: https://ec.europa.eu/growth/industry/policy/innovation/scoreboards_en (accessed on 28 August 2020).
  82. Eurostat Database. Available online: https://ec.europa.eu/eurostat/data/database (accessed on 28 August 2020).
  83. Hofstede Insights. Available online: https://www.hofstede-insights.com/product/compare-countries/ (accessed on 30 August 2020).
  84. Luca, A. Studiul Despre Valorile şi Comportamentul Românesc din Perspectiva Dimensiunilor Culturale După metoda lui Geert Hofstede. Available online: http://www.i-interact.ro (accessed on 28 August 2020).
  85. Hair, J.F.; Page, M.; Brunsveld, N. Essentials of Business Research Methods; Routledge/Taylor & Francis Group: New York, NY, USA, 2020. [Google Scholar] [CrossRef]
  86. Fornell, C.; Larcker, D.F. Structural equation models with unobservable variables and measurement error: Algebra and statistics. J. Mark. Res. 1981, 18, 382–388. [Google Scholar] [CrossRef]
  87. Podsakoff, P.M.; MacKenzie, S.B.; Podsakoff, N.P. Sources of Method Bias in Social Science Research and Recommendations on How to Control It. Annu. Rev. Psychol. 2012, 63, 539–569. [Google Scholar] [CrossRef] [Green Version]
  88. Lowry, P.B.; Gaskin, J. Partial least squares (PLS) structural equation modeling (SEM) for building and testing behavioral causal theory: When to choose it and how to use it. IEEE Trans. Prof. Commun. 2014, 57, 123–146. [Google Scholar] [CrossRef]
Figure 1. The proposed research model. Notes: PLAN = planning, ORG = organizing, LEAD = leading, CTRL = controlling, CULT_DIV = cultural diversity, PERF_IND = individual co-workers’ performance, PERF_TEAM = team-level performance, PERF_COMP = company-level sustainable performance.
Sustainability 12 07414 g001
Table 1. Item-level descriptive statistics, exploratory, and confirmatory factor analysis results.
Variable
(Code)
ITEM CODEMeanStandard DeviationEFA
Factor Loading
CFA Standard Regression Weight
Planning (PLAN)PLAN_14.1220.8390.8200.740
PLAN_24.0210.9220.8860.862
PLAN_33.9580.9040.8780.847
PLAN_43.9370.8970.8170.728
Organizing (ORG)ORG_13.9680.9160.7820.724
ORG_23.9840.9200.8780.864
ORG_34.0260.8720.8530.827
ORG_43.9100.9040.8330.767
ORG_53.9100.9150.7930.713
Leading (LEAD)LEAD_14.0790.7980.8830.846
LEAD_24.1320.8240.8750.835
LEAD_34.0000.9170.8710.836
LEAD_43.9890.8690.7110.591
Controlling (CTRL)CTRL_14.0630.8720.9030.404
CTRL_24.0950.9510.9030.397
Individual co-workers’ performance (PERF_IND)PERF_IND_13.6301.0620.7870.840
PERF_IND_23.6461.0030.8270.855
PERF_IND_33.7620.9950.8390.821
PERF_IND_43.7250.9270.8440.835
PERF_IND_53.5560.9470.8510.830
PERF_IND_63.7830.9340.7930.777
Team-level performance (PERF_TEAM)PERF_TEAM_13.5661.0880.8920.872
PERF_TEAM_23.6611.0010.8920.865
PERF_TEAM_33.6931.0110.8450.819
Company-level sustainable performance (PERF_COMP)PERF_COMP_13.5661.0680.8960.826
PERF_COMP_23.5870.9890.8960.811
Table 2. Descriptive statistics, reliability, and validity for modeled latent variables.
ConstructsDescriptiveReliability and ValidityCommon Method Bias
MeanStandard DeviationCronbach’s AlphaCRAVEVIF
PLAN4.0090.7580.8720.9510.8502.654
ORG3.9600.7490.8550.9520.8283.014
LEAD4.0500.7110.8540.9440.8353.314
CTRL4.0790.7190.7690.9440.9032.461
PERF_IND3.6880.8010.9040.9580.8244.487
PERF_TEAM3.6400.9060.8480.9490.8764.413
PERF_COMP3.5770.9210.7530.9390.896
Table 3. Validity statistics and correlations for modeled latent variables.
ConstructsPearson Correlations
PLANORGLEADCTRLPERF_ INDPERF_TEAMPERF_COMP
PLAN0.922
ORG0.738 **0.910
LEAD0.687 **0.743 **0.914
CTRL0.607 **0.637 **0.738 **0.950
PERF_IND0.151 *0.242 **0.154 *0.233 **0.908
PERF_TEAM0.235 **0.273 **0.178 *0.254 **0.872 **0.936
PERF_COMP0.232 **0.287 **0.222 **0.300 **0.845 **0.868 **0.947
Notes: ** Correlation significant at 0.01 level (2-tailed); * Correlation significant at 0.05 level (2-tailed); Square root of AVE on diagonal near the Person correlations.
Table 4. Main research model testing results.
HypothesisRelationEstimate (st.)S.E.C.R.Sig. (p)Result
H1aPLAN → PERF_IND0.0210.0700.3440.731Invalid
H1bORG → PERF_ IND0.2800.0714.550***Valid
H1cLEAD → PERF_ IND−0.0550.075−0.8870.375Invalid
H1dCTRL → PERF_ IND0.2630.0744.268***Valid
H2aPLAN → PERF_TEAM0.1470.0802.3240.020Valid
H2bORG → PERF_TEAM0.2410.0813.798***Valid
H2cLEAD → PERF_TEAM−0.1080.085−1.7020.089Invalid
H2dCTRL → PERF_TEAM0.2430.0843.823***Valid
H1ePLAN*ORG*LEAD*CTRL → PERF_IND0.3660.0065.944***Valid
H2ePLAN*ORG*LEAD*CTRL → PERF_TEAM0.3060.0064.818***Valid
H3PERF_IND → PERF_COMP0.4340.03711.266***Valid
H4PERF_TEAM→ PERF_COMP0.6400.03416.611***Valid
Total R20.739
Note: *** p < 0.001.
Table 5. Alternative research models.
Alternative Models:Direct Model (1)Interaction Model (2)Mediation Model (3)Complete Model (4)
RelationEstimateSig.EstimateSig.EstimateSig.EstimateSig.
PLAN → PERF_COMP0.0090.8970.0790.222−0.0740.273−0.0110.775
ORG → PERF_COMP0.2160.0020.225***0.269***−0.0150.717
LEAD → PERF_COMP−0.1310.054−0.0520.417−0.1600.0180.0320.401
CTRL → PERF_COMP0.251***0.286***0.2150.0010.0630.119
PLAN × ORG × LEAD × CTRL
→ PERF_COMP
0.278*** −0.0330.443
PLAN → PERF_IND 0.0730.2840.0210.731
ORG → PERF_ IND 0.231***0.280***
LEAD → PERF_ IND −0.1970.004−0.0550.375
CTRL → PERF_ IND 0.2020.0030.263***
PLAN → PERF_TEAM −0.0740.2730.1470.020
ORG → PERF_TEAM 0.269***0.241***
LEAD → PERF_TEAM −0.1600.018−0.1080.089
CTRL → PERF_TEAM 0.2150.0010.243***
PLAN × ORG × LEAD × CTRL
→ PERF_IND
0.366***
PLAN × ORG × LEAD × CTRL
→ PERF_ TEAM
0.306***
PERF_IND → PERF_COMP 0.444***0.447***
PERF_TEAM→ PERF_COMP 0.658***0.630***
Total R20.1270.2190.7070.739
Note: *** p < 0.001.
Table 6. Cultural diversity based moderated research model testing results.
Moderation Specific StatisticsSub-Samples:Mono-CulturalMulticulturalDifference
HypothesisRelationEstimate (st.)Sig. (p)Estimate (st.)Sig. (p)z-score (sig.)Result
H5aPERF_IND → PERF_COMP0.1990.0120.451***3.872 **Valid
H5bPERF_ TEAM → PERF_COMP0.842***0.606***−1.985 *Valid
Total R20.8280.727
Note: *** p <0.001, ** p <0.01, * p <0.05.

