1. Introduction
Energy is crucial for the well-being of society, serving as an important component for attaining good education, health, and good quality life in general. Access to modern energy is critical for economic development via its contribution to improved health conditions, reducing indoor air pollution, increasing production and productivity [
1]. Despite the massive contribution of energy to economic progress and the important role that it plays in the process of economic development, there are indicators that the global energy system will face various challenges that will question issues of sustainability and energy security in the future. Among the challenges are increasing risks of shortages of energy supply, especially non-renewable sources; the threat to the environment caused by fossil fuel energy production and use; and persistent energy poverty. These challenges can be remedied only through effective and coordinated government actions and public supports [
2]. Lack of physical and economic access to reliable energy hampers economic growth and reduce the welfare of citizens [
2].
Energy poverty study has been a recent poverty dimension. Pachauri and Spreng [
3] affirmed that both energy and poverty were addressed in many current policy documents of upfront organizations such as World Bank, United Nations Development Programme (UNDP) and World Energy Council. Energy poverty is referred to as the deficiency in adequate choice that would give access to adequate, affordable, effective, and environmentally sustainable energy services that could support economic and human development [
4].
Regardless of Africa being abundantly blessed with both renewable and nonrenewable energy sources, the populace is still plagued by energy poverty due to low real income and general economic underdevelopment [
4]. Access to modern energy in Africa is rare with ample ratio of the populace still depending on traditional sources of energy [
5]. However, in ensuring that access to clean and safe energy is achieved in Africa, government must ensure removal of subsidies on fossil fuels, increase the price of fuels with high carbon emission rate and endorse the development of international economic support of promoting policies for the growth of the utilization of renewable natural resources [
6]. Internationally, 92 percent of foreign financial aid to Sub-Saharan African’s clean energy source such as electrification originated from World Bank Group (WBG), the African Development Bank (AfDB) and the European Union (EU) [
7]. In Nigeria, over 66% of the population relied on firewood for cooking [
5]. About 1.4 billion people in developing countries lack access to electricity, while 3 billion people relied on inefficient and polluting fires for cooking and other household needs. Most of the electricity-deprived populations are in sub-Saharan Africa and South Asia. Further, about 80 per cent per cent of those without access to electricity live in rural areas [
5].
Physical and economic access to modern energy sources such as electricity, gas and kerosene [
8] has always been a major challenge for most rural poor households in developing countries having serious effects on their health and environment. However, access to modern sources of energy such as electricity are usually common among urban households. This present study seeks to investigate the incidence and extent of energy poverty across zones and sectors in Nigeria, while also examining the factors influencing energy poverty in the country. This is necessary in order to investigate the most important attributes for multidimensional energy poverty and examines the extent of energy poverty among households in rural and urban areas in Nigeria. This study will contribute to general literature on energy poverty and provides a concrete metric for Nigeria using a rich dataset of the household survey. This study is expected to deepen an understanding of the causes and extent of energy poverty. It further investigates the most important attributes for multidimensional energy poverty and examines the extent of energy poverty for different groups of households in rural and urban areas in Nigeria.
From policy perspective, the findings from this study will provide information for formulation policy instruments for the Sustainable Development Goal (SDG) 7 set out to bridge the exiting knowledge gap in the causes of energy poverty and indicate the way forward to a smooth transition to a modern energy system. The findings from this study will contribute to the policy instruments for the post-2020 sustainable development strategy, while also bridging the existing knowledge gap in the causes of energy poverty and also provide a pathway for smooth transition to a modern energy system, especially in developing and emerging economies. Furthermore, this study would contribute to concerted efforts aimed at formulating policies on how to develop strategies to curb rural and urban poverty energy in the country.
2. Literature Review
Various existing studies have examined the subject related to energy poverty, factors influencing energy consumption and sustainable economic development in the literature. The relationship between energy and economic growth is appropriately acknowledged in the literature and has been established to possess a bi-directional attribute. As pointed out in OECD [
9], the two greatest tasks bedeviling the energy sector are, ensuring the security of energy supply and lowering its impact on climate change if sustainable future is to be attained. Thus, the adverse contribution of the modern energy sources, which is ecologically amiable, will be greatly reduced in relation to that of the traditional energy sources if the former is promoted. Modern energy sources are regarded to be germane to the supply of basic infrastructural needs as well as drivers of economic development [
9]. Adequate access to modern energy sources promotes environmental sustainability and enhances the welfare status of the populace. On the contrary, use of traditional sources of energy such as firewood, coal, charcoal and animal waste result in high level of pollution and environmental degradation which brings about poor health status, low productivity and a substantial reduction in overall human welfare. According to World Summit on Sustainable Development (WSSD), energy services such as lighting, heating, cooking, mechanical power, motive power, transport and telecommunications are essential for socio-economic development, since they yield social benefits and support income and employment generation [
10]. Energy is vital to industrialization, and industrialization is a major prerequisite to economic development. To ensure peak production in a modern industrializing or industrialized world, there must be a sufficient supply of and access to energy. For sustainable development to be accomplished there should be satisfactory supply of and access to comparatively environmentally acceptable energy from modern energy sources.
Akinlo [
11] examined the causal relationship between energy consumption and economic growth for eleven Sub-Saharan African countries and submitted that there is a causal relationship between energy consumption and economic growth, although the path of causality is not similar across the different countries examined. In the study conducted by Nel and van Zyl [
12], it was established that energy security is key to social and economic wellbeing of households, which is relevant for improving quality of life of households. Pablo, et al. [
13] examined the energy poverty in Ecuador using a multidimensional energy poverty index (MEPI) and the results showed that the challenge of energy poverty persists in Ecuadorian households as well as at national level. The measure of multidimensional energy poverty index (MEPI) in this study was based on delays in the payment of electricity bills and disproportionate expenses.
A study conducted by Meszerics [
4], found that the three important factors affecting energy poverty include disposable income, unbearable cost of energy, and low thermal efficiency. Globally, about 18% of the population lack access to electricity [
14], with greater percentage dwelling in developing countries [
15]. Employing rural areas and urban areas in Latin America and the Caribbean as case study, Kozulj Vianello [
16] investigated energy poverty in these regions and found that energy deprivation existed mainly due to lack of access to essential public services such as energy, lack of income. The study concluded that differences in energy poverty between rural and urban areas indicated the impact of locational, inequality, cultural and climatic factors on energy poverty which is manifested through lack of income to meet up with energy demands and access to different public services as well as lack of access to household equipment and communities, which provides an indication of the limited access to energy needed for consumption. Sokołowski, et al. [
17] constructed multidimensional energy poverty index using five important subjective and objective indicators that accounts for energy deprivation in Poland. The indicators employed include low income, high costs, not warm enough home, housing faults, and bills difficulties. The results from this study showed that only 10% of the Polish households are energy poor. In addition, the study showed that households that are most vulnerable to multidimensional energy poverty in Poland include retired households and the disabled. Another important study that employed both objective and subjective indicators in construction of multidimensional energy poverty measure is Day, et al. [
18]. The study found that housing condition as well as affordability of energy services are key driving factors of energy poverty.
3. Methodology
The study area is Nigeria, comprising of the six geo-political zones and the rural and urban sectors. The dataset used for the study was obtained from the National Demographic Health Survey collected by National Bureau of Statistics (NBS) were used. The dataset comprises of 2766 rural and 1283 urban households. Descriptive statistics was used to profile the socio-economic characteristics of the households, while Multidimensional Energy Poverty Index (MEPI) was adopted to determine the incidence and extent of energy poverty among households in Nigeria.
The MEPI is a measure developed by scholars at the Oxford Poverty and Human Development Initiative (OPHI) [
3,
19,
20,
21]. The energy deprivation status of a household is constructed using four dimensions with four indicators. A household is said to be energy poor if the deprivation exceeds predefined cut-off points. Adopting the study of Nussbaumer, Bazilian and Modi [
19], four dimensions of Energy poverty were identified, with four indicators attached to the four dimensions. Energy poverty weight is attached to each of the four indicators. The weight attached shows the level of energy deprivation and it is used to estimate the energy poverty status of each household in Nigeria.
The four indicators and attached weight are stated as:
Type of energy sources used by household for cooking.
Use of traditional energy sources. (0.25)
Extent of indoor air pollution (two variables)
Kitchen (use of same residential house for cooking or no kitchen 0.15)
Traditional Stove/Firewood (0.15)
The type of energy used for lightning (no electricity; 0.25)
Ownership of Entertainment and Educational Assets.
No radio, tape, TV or satellite dish (0.20).
The multidimensional energy poverty line of 0.33 is adopted following the work of Bersisa [
21]. A household is energy poor if it is deprived of more than 33 per cent of the indicators. Hence, a household whose sum of weighted deprivation is greater than or equal to 0.33 is categorized as energy poor and a household whose sum of weighted deprivation is less than 0.33 is energy non-poor.
The multidimensional Poverty Index as a measure of energy deprivation is estimated as:
Energy Poverty Headcount: H
(1) H = ; where,
N = total number of respondents
Ci = population of households whose energy poverty score is higher than the cut-off mark
K = energy poverty threshold
The energy poverty head count (H) measures the incidence of energy poverty. It is the percentage of households whose deprivation score is above the cut-off point. Energy poverty intensity.
(2) A =
Where is the censored weighted deprivation score of the households. This measures the extent or intensity of energy deprivation among the households.
Finally, Multidimensional Energy Poverty Index (MEPI) is computed from both incidence and intensity of energy poverty as:
(3) MEPI = H * A
In other to examine the determinants of households’ energy poverty, Tobit regression model was adopted since the values of the endogenous variable lie between 0 and 1. The energy poverty threshold was put at 0.33. The model for the regression analysis is specified thus,
Yi * = Yi if 0.33 ≤ Yi ≤ 1 (poor)
Yi* = 0 if Yi < 0.33 (non-poor)
Y1 =α1 + β1X1 + β2 X2 + …….βnXn + ei
Y = Multidimensional Energy Poverty Index of each household
α= intercept term
βi = parameters of explanatory variables
Xi = explanatory variables
ei = disturbance term assumed to be independently and normally distributed with zero mean and constant variance.
The explanatory variables are as follows;
X1 = Age of household heads (years)
X2 = Gender (dummy) male 1, female 0
X3 = Household size
X4 = Household income (N)
X5 = Credit access (access = 1, Otherwise 0)
X6 = Land size (hectares)
Sector
X7 = (rural = 1, urban = 0)
Geopolitical zones
X8 = Southwest 1, 0 otherwise
X9 = South-South 1, 0 otherwise
X10 = South-East 1, 0 otherwise
X11 = North-East 1, 0 otherwise
X12 = North-Central 1, 0 otherwise
X13 = North-West 1, 0 otherwise
4. Results and Discussion
The socioeconomic characteristics of households in Nigeria as presented in
Table 1 indicate that almost 5 out of every 10 respondents are within the age range of 41–60 years. The mean age of 53 years suggests that majority of household heads in Nigeria are relatively old. Expectedly, male respondents also constitute 85% of the total, implying the gender as that that mostly take up the responsibility of caring for the households. Majority (80.86%) of the respondents are also married, while others are either single, divorced or widowed. The mean household size of seven confirms that average household in Nigeria is relatively large. However, this could have a significant effect on the types of energy households could be using. About one-third of the population are illiterates, while only 17% are educated up to the tertiary level. However, Thiam [
22] shows a positive correlation between literacy level and access to clean energy sources. Households with the annual income range of N100, 001(
$285.7)–N500, 000 (
$1428.57) constitute 41% of the total population, while an average household obtain N550, 572.9 (
$1573) as annual income. However, well over half of the total population does not have access to formal credit.
Table 2 relays the distribution of distribution of households based on the source(s) of energy used for lighting (chart of this distribution is presented in
Figure 1). Almost 10% of the households used energy sources that could be a threat to health and that of the environment. The sources include; firewood, generator and grass. However, about four out of every 10 households utilized electricity. This is an indication that there is a wide range of use of energy for lighting purpose.
The
Table 3 (chart of this distribution is presented in
Figure 2) illustrates that almost three-quarter of the entire population used firewood as energy source for cooking. The use of firewood for cooking is acknowledged to cause ill health among residents and contribute to greenhouse gases in the atmosphere. Less than five percent of the residents in Nigeria uses clean energy sources such as electricity and gas for cooking.
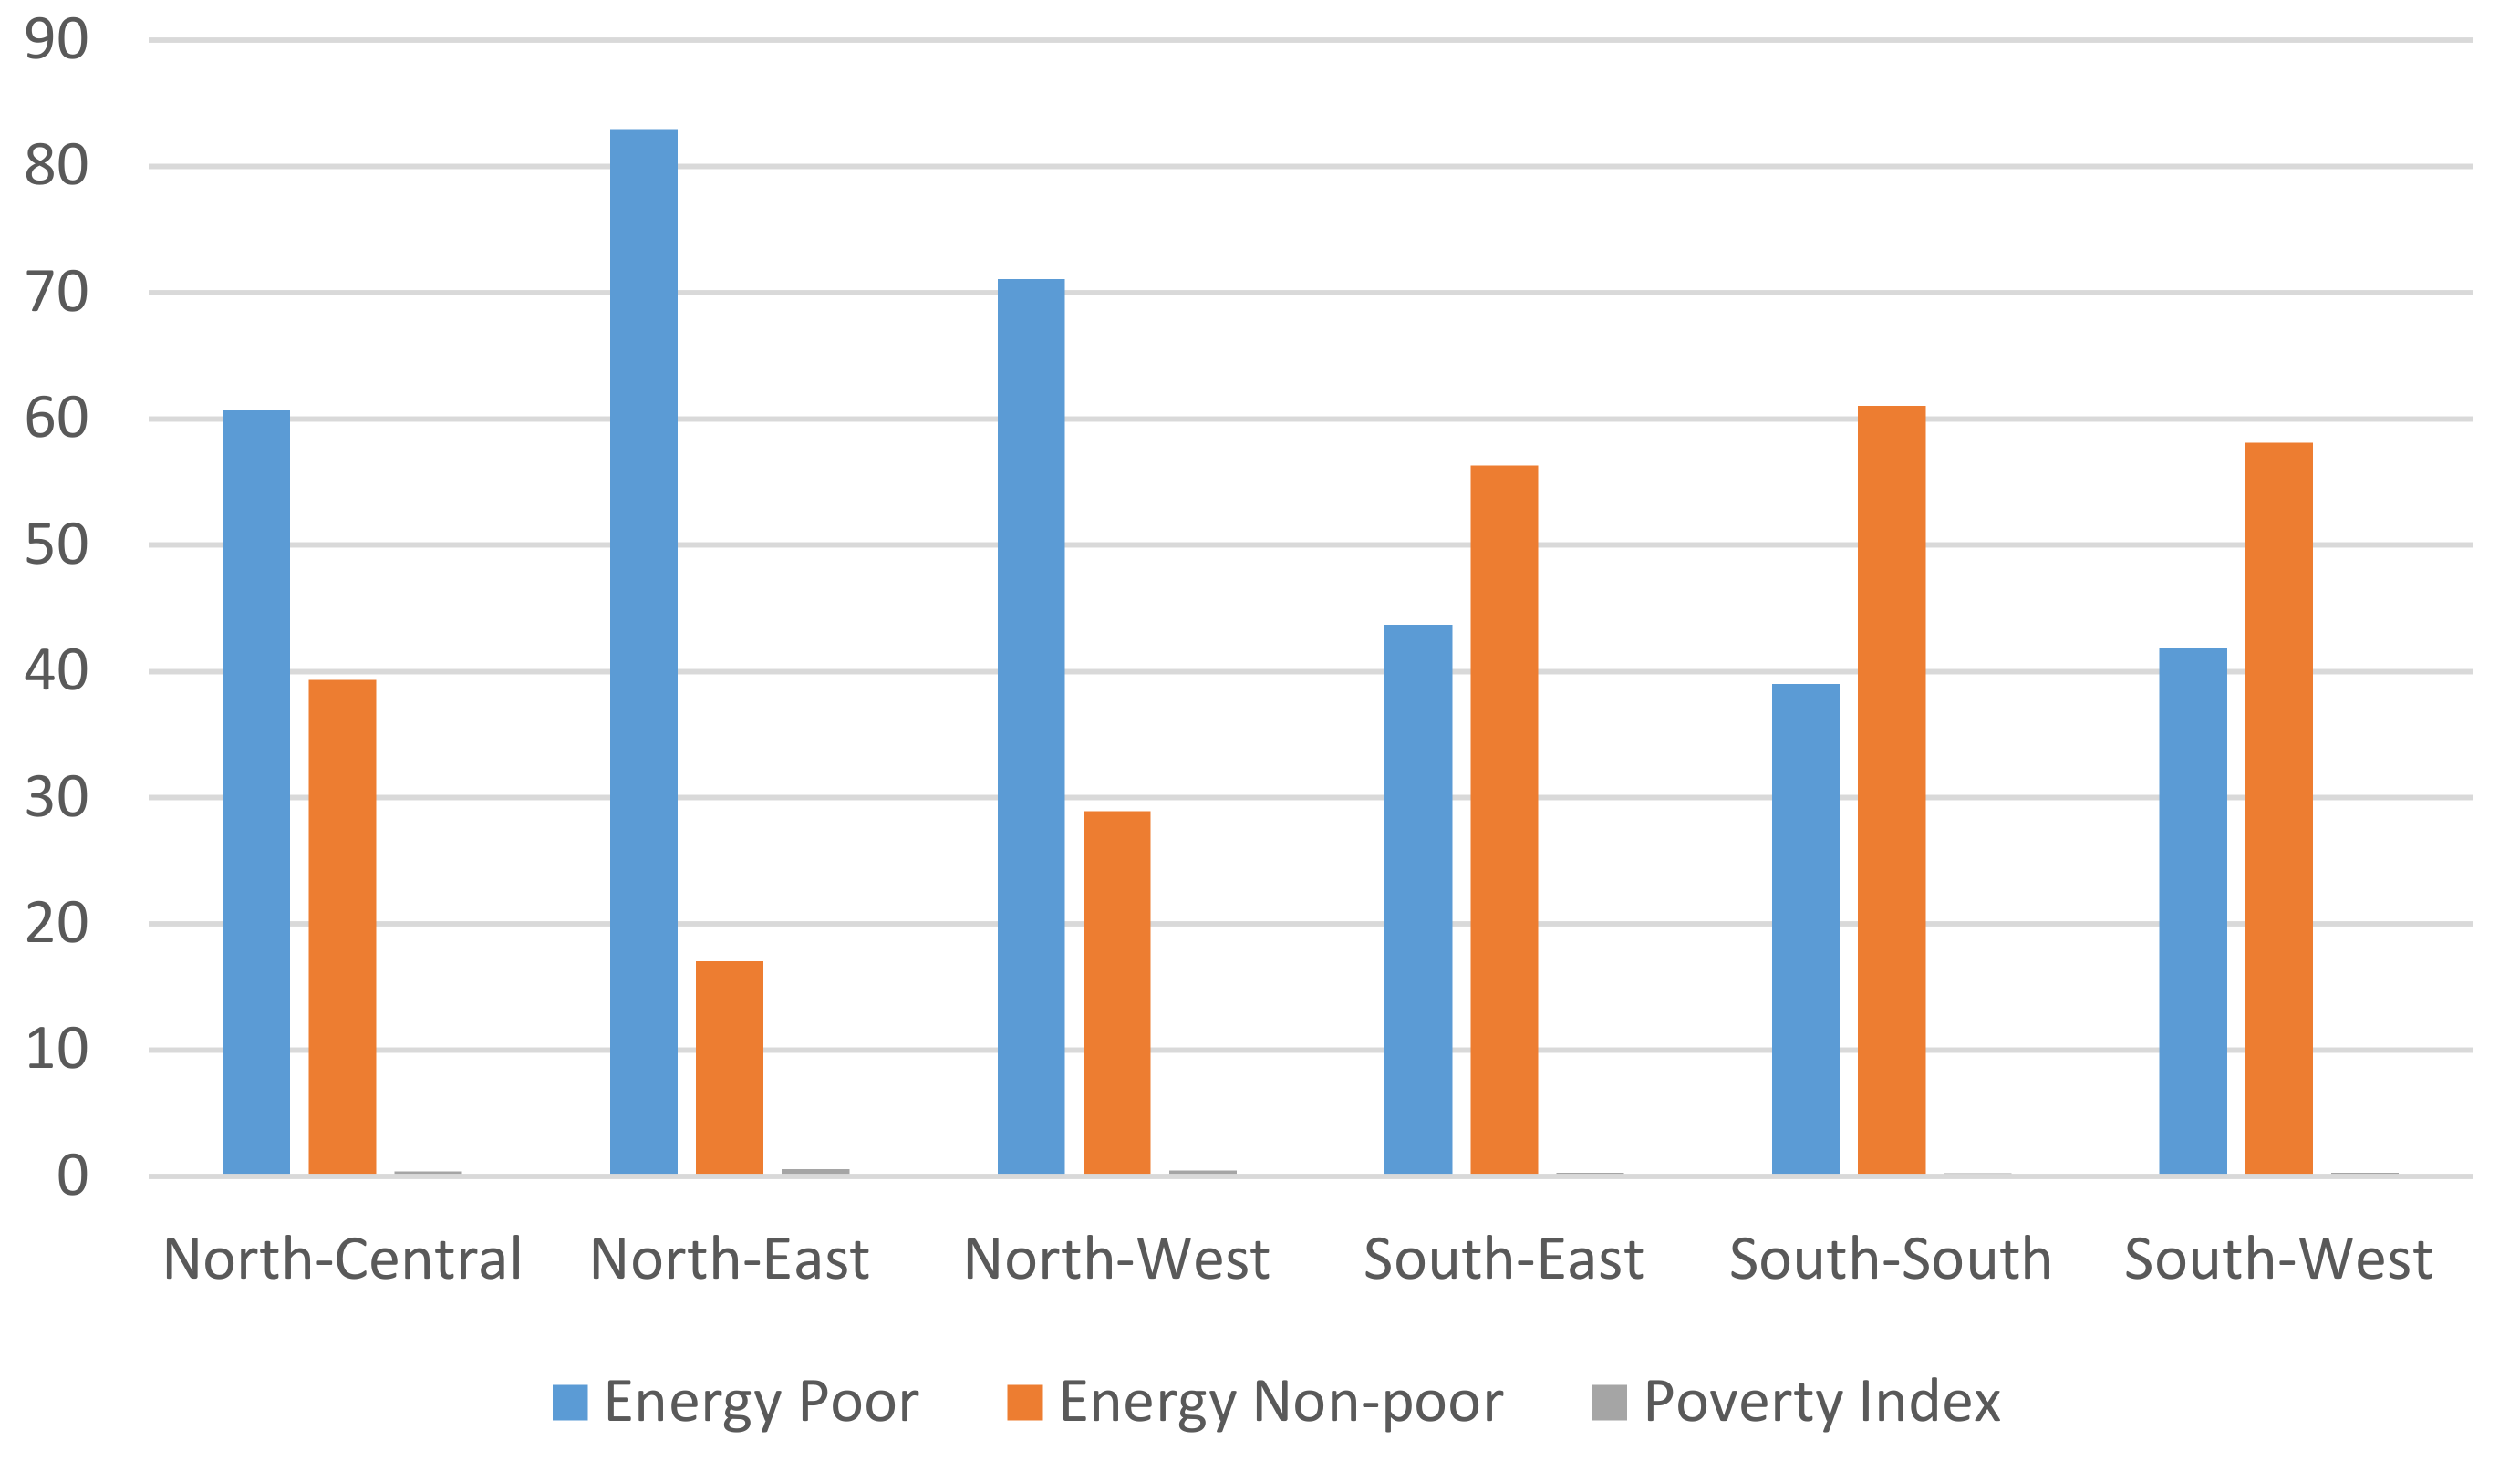
Table 4 (chart of this distribution is presented in
Figure 3 and
Figure 4) profiles households’ energy poverty across sectors, zones and in the country as a whole. There is a distinct disparity in the energy poverty of households resident in the northern and southern part of the country. The zonal Multi-dimensional Energy Poverty Index (MEPI) exhibits that the three Northern regions, Northwest, Northeast and Northcentral are more energy poor than the three Southern regions. The three Southern regions have combined MEPI average of 0.267 as opposed to the North’s 0.487. Again, when these are compared to the national average, all the Northern geo-political zones (North-Central, 0.41; Northwest, 0.48 and Northeast, 0.57) are worse off in terms of energy poverty than the national average of 0.38. On the other hand, all the three zones from the South have MEPI less than the national average (Southwest 0.27; Southeast, 0.28 and South South, 0.25). The implication of the regional performance is that the energy wellbeing of households in the south is better than the national value, with south-south zone having the least EPI (least energy deprived of households).
Furthermore, almost six out of every 10 Nigerians are energy poor. This indicates that the magnitude of energy problem is relatively high in the country. The South-South zone has the highest percentage of energy non-poor households (61.01%) followed by the South-West zone (58.09%) and the Southeast zone (56.29%). The Northeast (17.04%) however has the lowest percentage of residents that are energy non-poor. Thus, energy poverty is apparently more pronounced in northern Nigeria than in the south. The table further shows that energy poverty is far higher in the rural (70.39%) than in the urban sector (26.97%), with rural sector having 0.3 EPI value higher than that of the urban. The result of this study conforms to that of Ozughalu and Ogwumike [
23], who reported that 75.5% of Nigerians are energy poor and that the North and rural sector are worse hit.
Energy is the driving force of human development and modern societies. It promotes economic development and Industrialization, which in turn enhances the overall welfare of households [
24,
25]. Many healthcare facilities in developing countries are incapacitated due to lack of access to clean energy such as electricity, which is essential for storing vaccines and carrying out life-saving operations [
26]. Improved clean energy access will help to raise life expectancy by ensuring timely provision of services. The availability of clean energy and the efficiency with which it is used enable humans to live longer and improve their living standards [
26]. Attempt to understand the statistical relationship between the observed energy poverty level and some factors that could influence it is x-rayed in this sub-section. The regression analysis shows the relationship between energy poverty status of households in Nigeria and twelve causal variables.
Table 5 shows estimates of determinants of energy poverty in Nigeria. As can be seen from the table, the model is generally robust. All the regressors, on aggregate with the exception of household size, have significant effect on energy poverty of households. The likelihood ratio statistic, which is statistically significant at 1%, indicates that the model fits the data used. Virtually all parameter estimates are statistically significant at 1% having the expected a priori signs.
Sex of household head with respect to male headship, age of household head, residing in rural sector and land size are positively associated with energy poverty. They increase the odds in favour of households being energy poor. On the other hand, household income, credit access and other zones, relative to the northeast were negatively related to energy poverty. This implies that the variables reduce the tendency of households to be energy poor.
The energy poverty tends to increase among male-headed households relative to the female, implying the predominant use of traditional and/or unsafe energy sources among male-headed households. Likewise, access to land tends to increase energy poverty among households probably due to the high population of rural farming households who utilize land mainly for small-scale farming [
27,
28,
29,
30,
31,
32,
33].
The positive relationship between rural residents and energy poverty as submitted by Roberts, et al. [
34] is attributed to ‘low commercial clean energy consumption of rural populations due to low population, low densities and demand levels; peaky demand profiles as well as the tendency of high line losses’. The level of income affects choice of cooking fuels. Households with high levels of income use cleaner fuels, while those with lower socioeconomic profile use traditionally unsafe sources of energy [
19]. In this study, low income was observed to make rural households to depend on firewood for cooking, partly because most of the firewood is collected and not purchased. This finding is in agreement with that of Anker and Anker [
35] in Kenya. Hence, low income leads to dependence on biomass fuels, which is a measure of energy poverty Ashagidigbi and Agboola [
27].
The access to credit variable invested in profitable venture would lead to increased income, which in turn will enhance the ability of households to use clean energy. Residents in all other zones are less energy poor, compared to those in the northeast. This aligns with the findings of Ashagidigbi, et al. [
36] and Ashagidigbi and Dahunsi [
37], who established the highest prevalence of poverty among the residence of northeast zone. The implication of this is that northeast residents use environmentally unfriendly energy source the most. This may not be unconnected with the civil unrest encountered within the region for so many years.

 ,
, 


