Article

Evapotranspiration Estimation Based on Remote Sensing and the SEBAL Model in the Bosten Lake Basin of China

College of Grassland and Environment Sciences, Xinjiang Agricultural University, Urumqi, Xinjiang 830052, China
*
Author to whom correspondence should be addressed.
Sustainability 2020, 12(18), 7293; https://doi.org/10.3390/su12187293
Submission received: 20 July 2020 / Revised: 17 August 2020 / Accepted: 1 September 2020 / Published: 5 September 2020

Abstract

:
Evapotranspiration (ET) is an important part of both water balance and energy balance. Accordingly, the estimation of ET plays a key role in research related to regional water resources and energy balance. Using the largest inland freshwater lake in China—Bosten Lake Basin—as a target area, this study employs the SEBAL model combined with actual surface ET from the 2013 MODIS ET data to estimate ET in the Bosten Lake Basin from a time and space perspective. The findings include the following: (1) Evapotranspiration in the Bosten Lake Basin shows a unimodal distribution in terms of time distribution, with the highest ET occurring in July and August. In terms of spatial distribution, the overall trend is more apparent in the northwest portion of the basin than the southeast portion, as there are more mountains in the northwest as well as fewer desert areas. (2) Grassland and unused land were the main types of land cover, and ET exhibited a clear relationship to vegetation coverage and water supply. The distribution of land use types from northwest to southeast ET show a significant downward trend. (3) During the growing season, the average daily ET level of land use/cover type was the greatest over water bodies (5.61 mm/d), followed by grassland (4.6 mm/d) and snow/ice (4.29 mm/d), with unused land giving the smallest amounts of ET.

1. Introduction

Lack of potable, agricultural, and industrial water resources is one of the most important factors restricting economic development in arid areas [1]. Evapotranspiration (ET), which is a key contributor to the water cycle process, provides the primary route for water transport in terrestrial ecosystems [2,3]. Hence, ET is an important parameter for understanding and studying the water balance and heat balance process in ground and air interactions. ET is also an important indicator of vegetation growth and crop yield [4]. Because evapotranspiration reflects the strength of land-atmosphere in the land surface process, accurately estimating regional evapotranspiration is crucial for effectively managing basin water resources and monitoring agricultural drought [5]. To that end, evapotranspiration simulations should necessarily be included in hydrological process simulations [6]. The accurate estimation of evapotranspiration in a specific area could provide a reference value for the optimization of that area’s water resources [7].
The formula for calculating evaporation was first proposed by Dalton in 1802. Since then, the evapotranspiration theory has served as a basis for devising a number of well-known meteorological approaches, such as the Bowen ratio energy balance method [8], the aerodynamics method [9], and the Penman–Monteith formula [10]. Applied on a point scale, these theories have enjoyed relative success, but they still face several limitations when applied on a regional scale. A major limitation is the spatial heterogeneity of land surface, which makes it difficult for traditional observational methods to be expanded beyond point-to-point surface measurements. The recent application of remote sensing technology to the evapotranspiration field shows great promise in overcoming spatial heterogeneity barriers. The surface energy algorithm for land (SEBAL) model has already been verified in a broad range of locations. In South Africa, for instance, the SEBAL approach was used to investigate the applicability of dry season potential ET in modeling the depth of groundwater levels in the upper Molopo River Catchment [11]. In China, Li [12] employed the SEBAL to estimate the temporal evapotranspiration of grassland with moderate and high vegetation cover in the southern and northern parts of the Yellow River’s source area using Landsat TM (Thematic Mapping) data.
Bosten Lake is China’s largest inland freshwater lake. Located in Xinjiang, China’s arid northwest region, the lake is both the end-point of the Kaidu River and the source of the Kongqi River. These three water bodies—Bosten Lake and the Kaidu and Kongqi rivers—are collectively known as the Bosten Lake Basin. Over the past 50 years, the basin has experienced severe deterioration of its ecological environment due mainly to water resources exploitation and utilization [13]. The continuous expansion of cultivated land area in the upper reaches of the lake has drastically decreased the amount of water entering it. In recent years, the lake has sunk to the lowest critical water level, and the salinity of the water increased from 1 g/L in 2012 to about 1.5 g/L in 2013 [14]. The degradation of Bosten Lake is now seriously threatening the security of the basin’s ecosystem, including the desertification of land in the area.
This paper investigates changes in evapotranspiration in the Bosten Lake Basin as a point of context to clarify the process of water resources dissipation. The overall aim of this work is not only to scientifically assess actual and potential regional drought but also to promote the ecological restoration of the entire Bosten Lake Basin and play a decisive role in social, economic, and ecological sustainable development. This paper will combine data from actual surface evapotranspiration from the 2013 MODIS (Moderate-resolution Imaging Spectroradiometer) ET data with the application of the SEBAL model to estimate evapotranspiration in the Bosten Lake Basin from a time and space perspective [15]. The research results will have practical significance for the study of environmental evolution and sustainable development of arid oases in western China by providing a scientific basis for the development and protection of land resources in arid areas.

2. Data and Materials
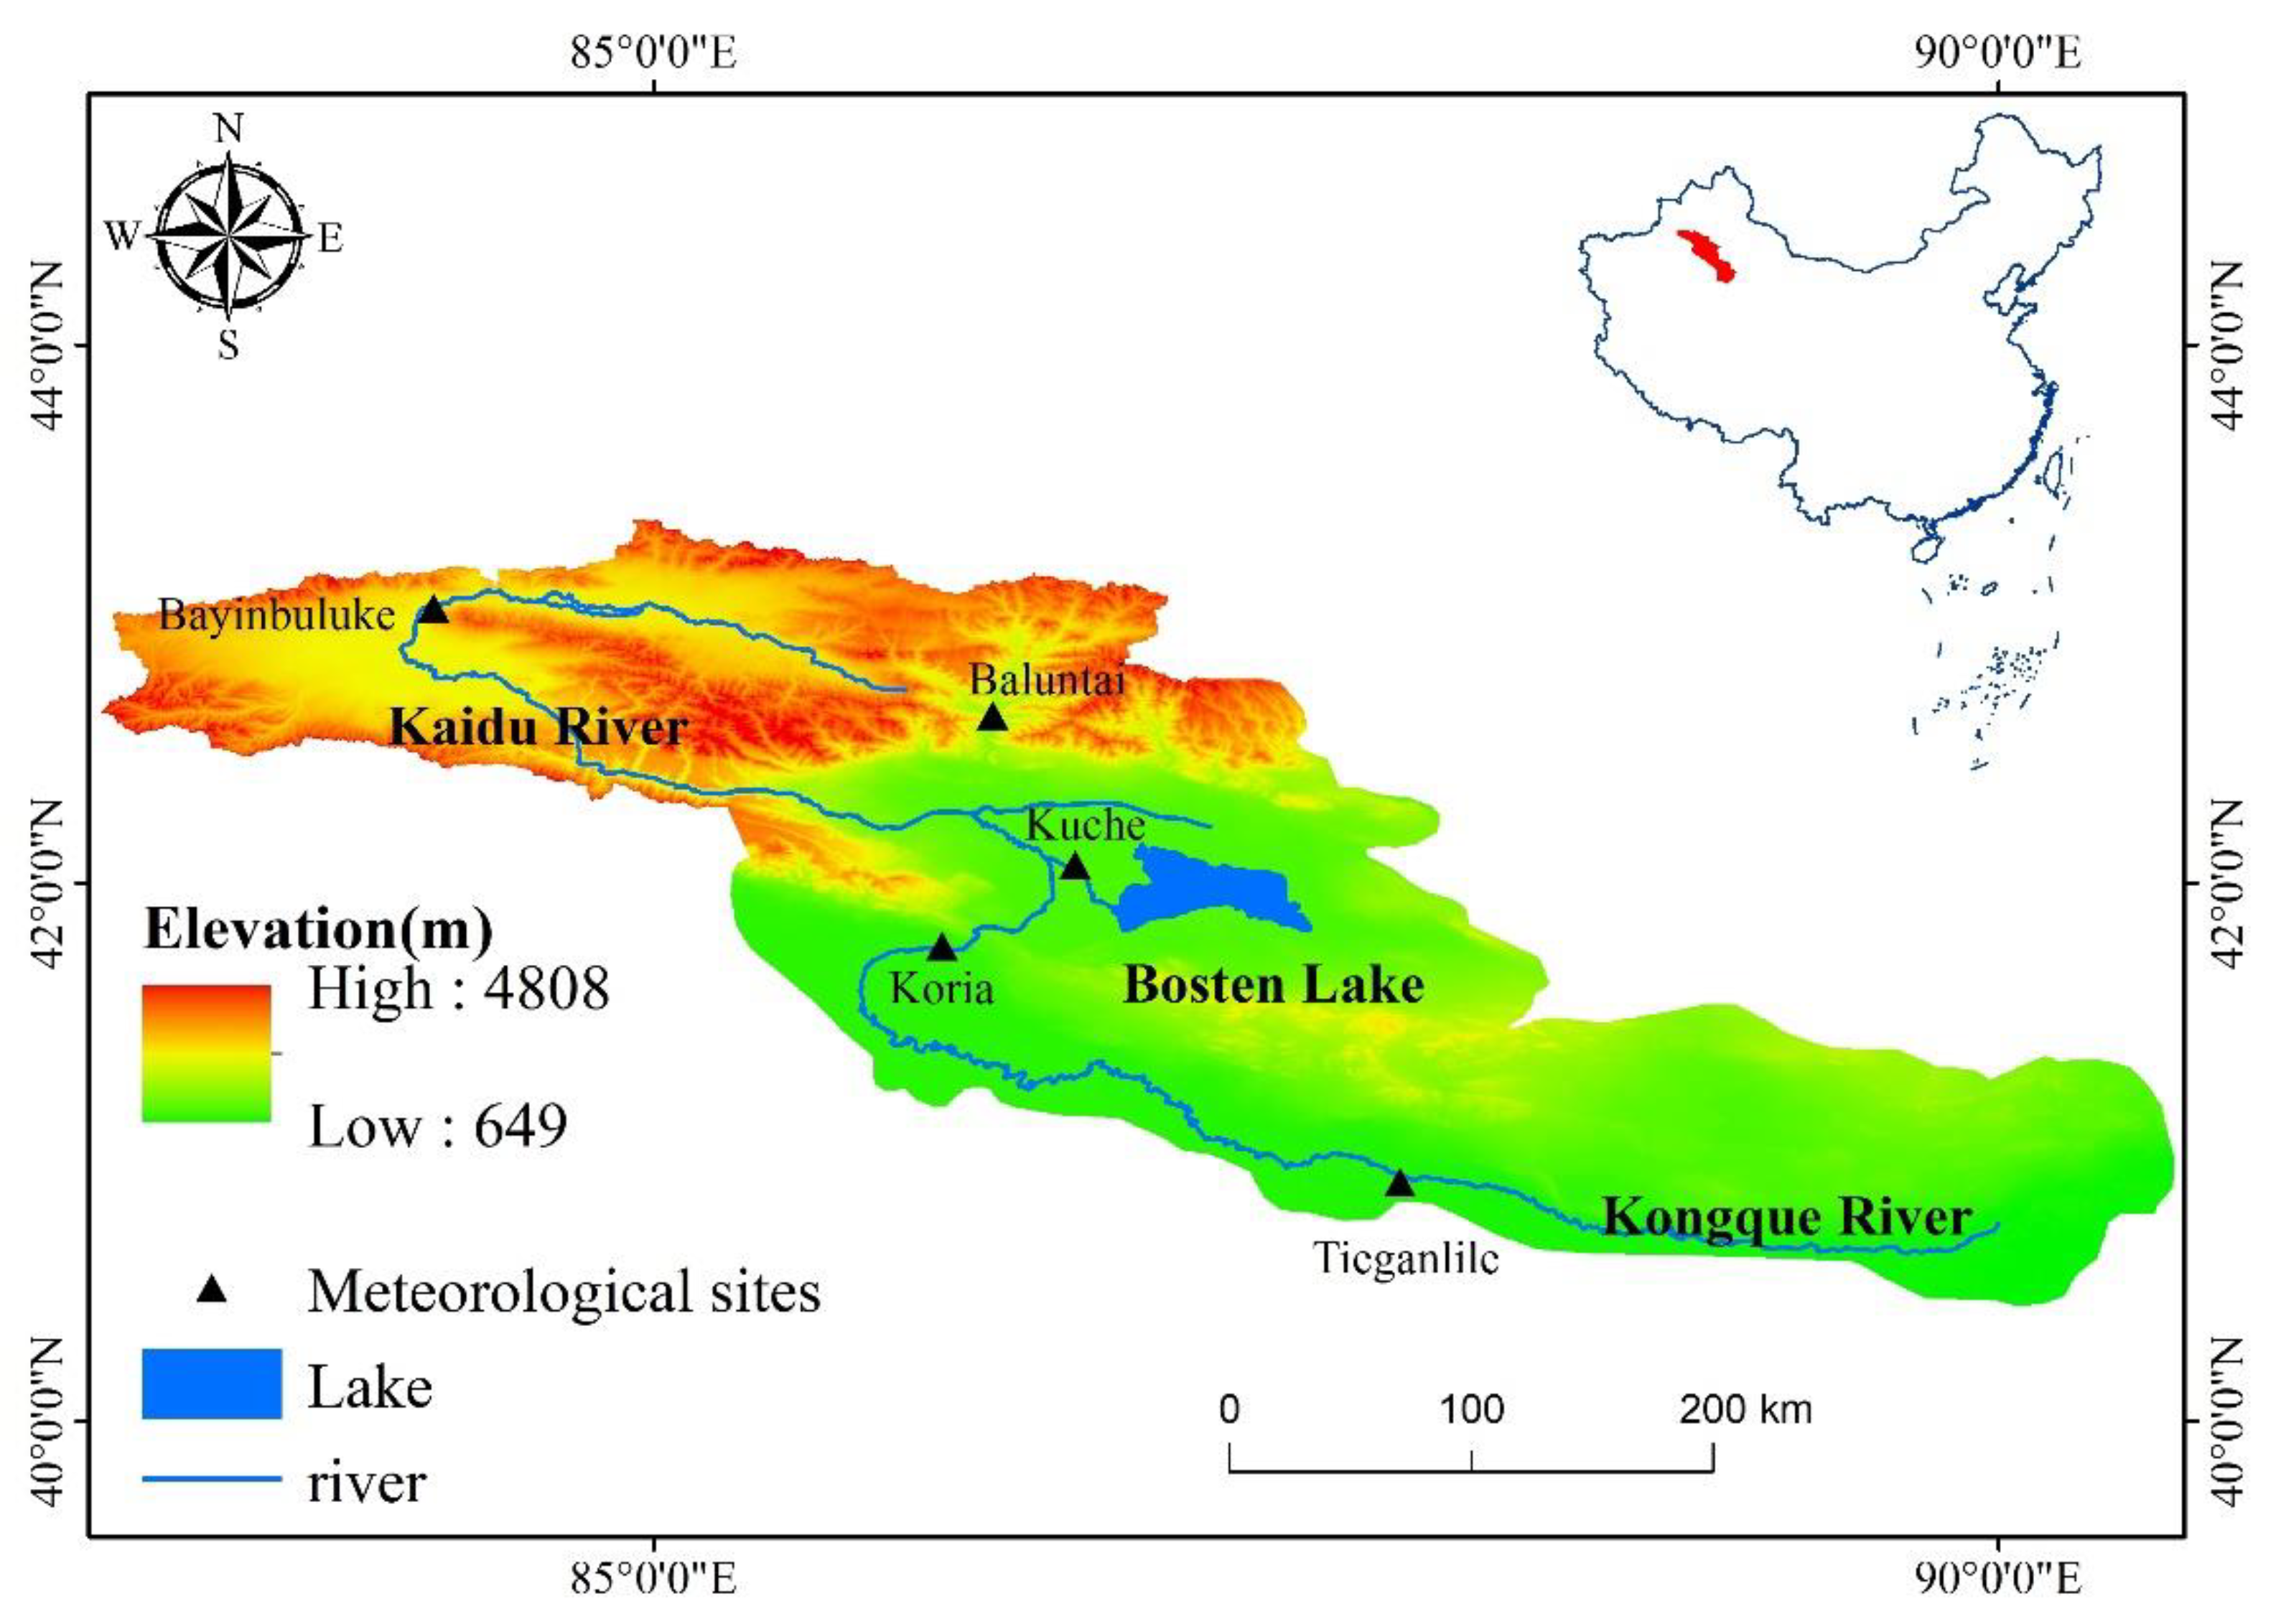
2.1. Study Area

The Bosten Lake Basin is a main tributary that discharges into the downstream of the largest inland river in China—the Tarim River. The basin is located in a fragile ecological environment in southern Xinjiang, situated at the northern fringes of the Taklimakan Desert and the southern slope of the Tianshan Mountains. The basin region includes the Kaidu River, Bosten Lake and the Kongqi River. Bosten Lake, which serves as both the end of the Kaidu River and the source of the Kongqi River, is a huge regulating reservoir that plays an important role in the water supply system (Figure 1) and the lowest water level was 1044.73 m(as measured in 1986). The Kongqi River Basin starts at Bosten Lake and flows through the downstream of Tarim River, ending at Lop Nur.
The Bosten Lake Basin is located in the hinterland of the Eurasian continent, which is characterized by a wide temperature range, scant precipitation, and low humidity. The climate is dominated by continental arid conditions due to the region’s remoteness from the nearest ocean. In the Kaidu River Basin, the average annual temperature is −4.26 °C, annual precipitation is less than 500 mm, and annual pan evaporation is between 1000 mm and 2000 mm. The region experiences a lengthy snowfall period from November to March, with the largest average annual snow depth reaching 12 cm.
Bosten Lake spans an area of 980 km2 and is China’s largest inland freshwater lake. It has an average annual temperature of 7.9 °C and diurnal temperature ranges that are smaller than those of the surrounding land. The Kongqi River Basin, which is adjacent to Bosten Lake, is characterized by long sunshine duration, average annual temperatures of around 10.5 °C, and annual precipitation amounts of less than 100 mm. The Kongqi is situated at the center of a desert, so annual precipitation is typically less than 50 mm, and pan evaporation ranges between 1700 mm and 3000 mm.

2.2. Data Collection

The data are mainly composed of MODIS products and meteorological and GIS data.

2.2.1. MODIS

In the SEBAL model, surface temperature, NDVI (Normalized Difference Vegetation Index), surface reflectance, and other parameters are used. All of these parameters are derived from MODIS products such as MOD11A1, MOD11A2, MOD13A2 and MOD43B3 (Table 1). The original MODIS products are HDF-EOS format and ISIN (Integerized Sinusoidal) projections. These need to be preprocessed by format conversion, orbit Mosaic, and reprojection, and finally converted to Geo Tiff format data under the WGS-1984 coordinate system.

2.2.2. Meteorological Data

This study applies several characteristics from the meteorological data of meteorological stations, including air pressure, average temperature, low temperature, high temperature, vapor pressure, relative humidity, wind speed, sunshine duration, maximum sunshine duration, solar radiation, and precipitation.

2.2.3. GIS Data

GIS data come from Chinese meteorological administration’s distribution of 1:250,000 geographic information data (Table 2). The boundary and DEM elevation information were extracted according to research requirements. Based on 1:250,000 national basic geographic information data, they were then stitched together and converted to form terrain and elevation data pertaining to 1 km × 1 km spatial resolution.

2.2.4. Landsat Data

This article obtained Landsat TM satellite remote sensing image data from the National Aeronautics and Space Administration (NASA, http://www.nasa.gov/) in the Bosten Lake Basin in 1990, 2000, and 2013. In order to ensure the comparison in the later stage of the study and according to the study area for vegetation characteristics, when selecting remote sensing images, try to select remote sensing image data in July, August, and September. At the same time, in order to ensure the clarity of the impact, when selecting images, try to avoid images with cloud coverage higher than 10% (Table 3).

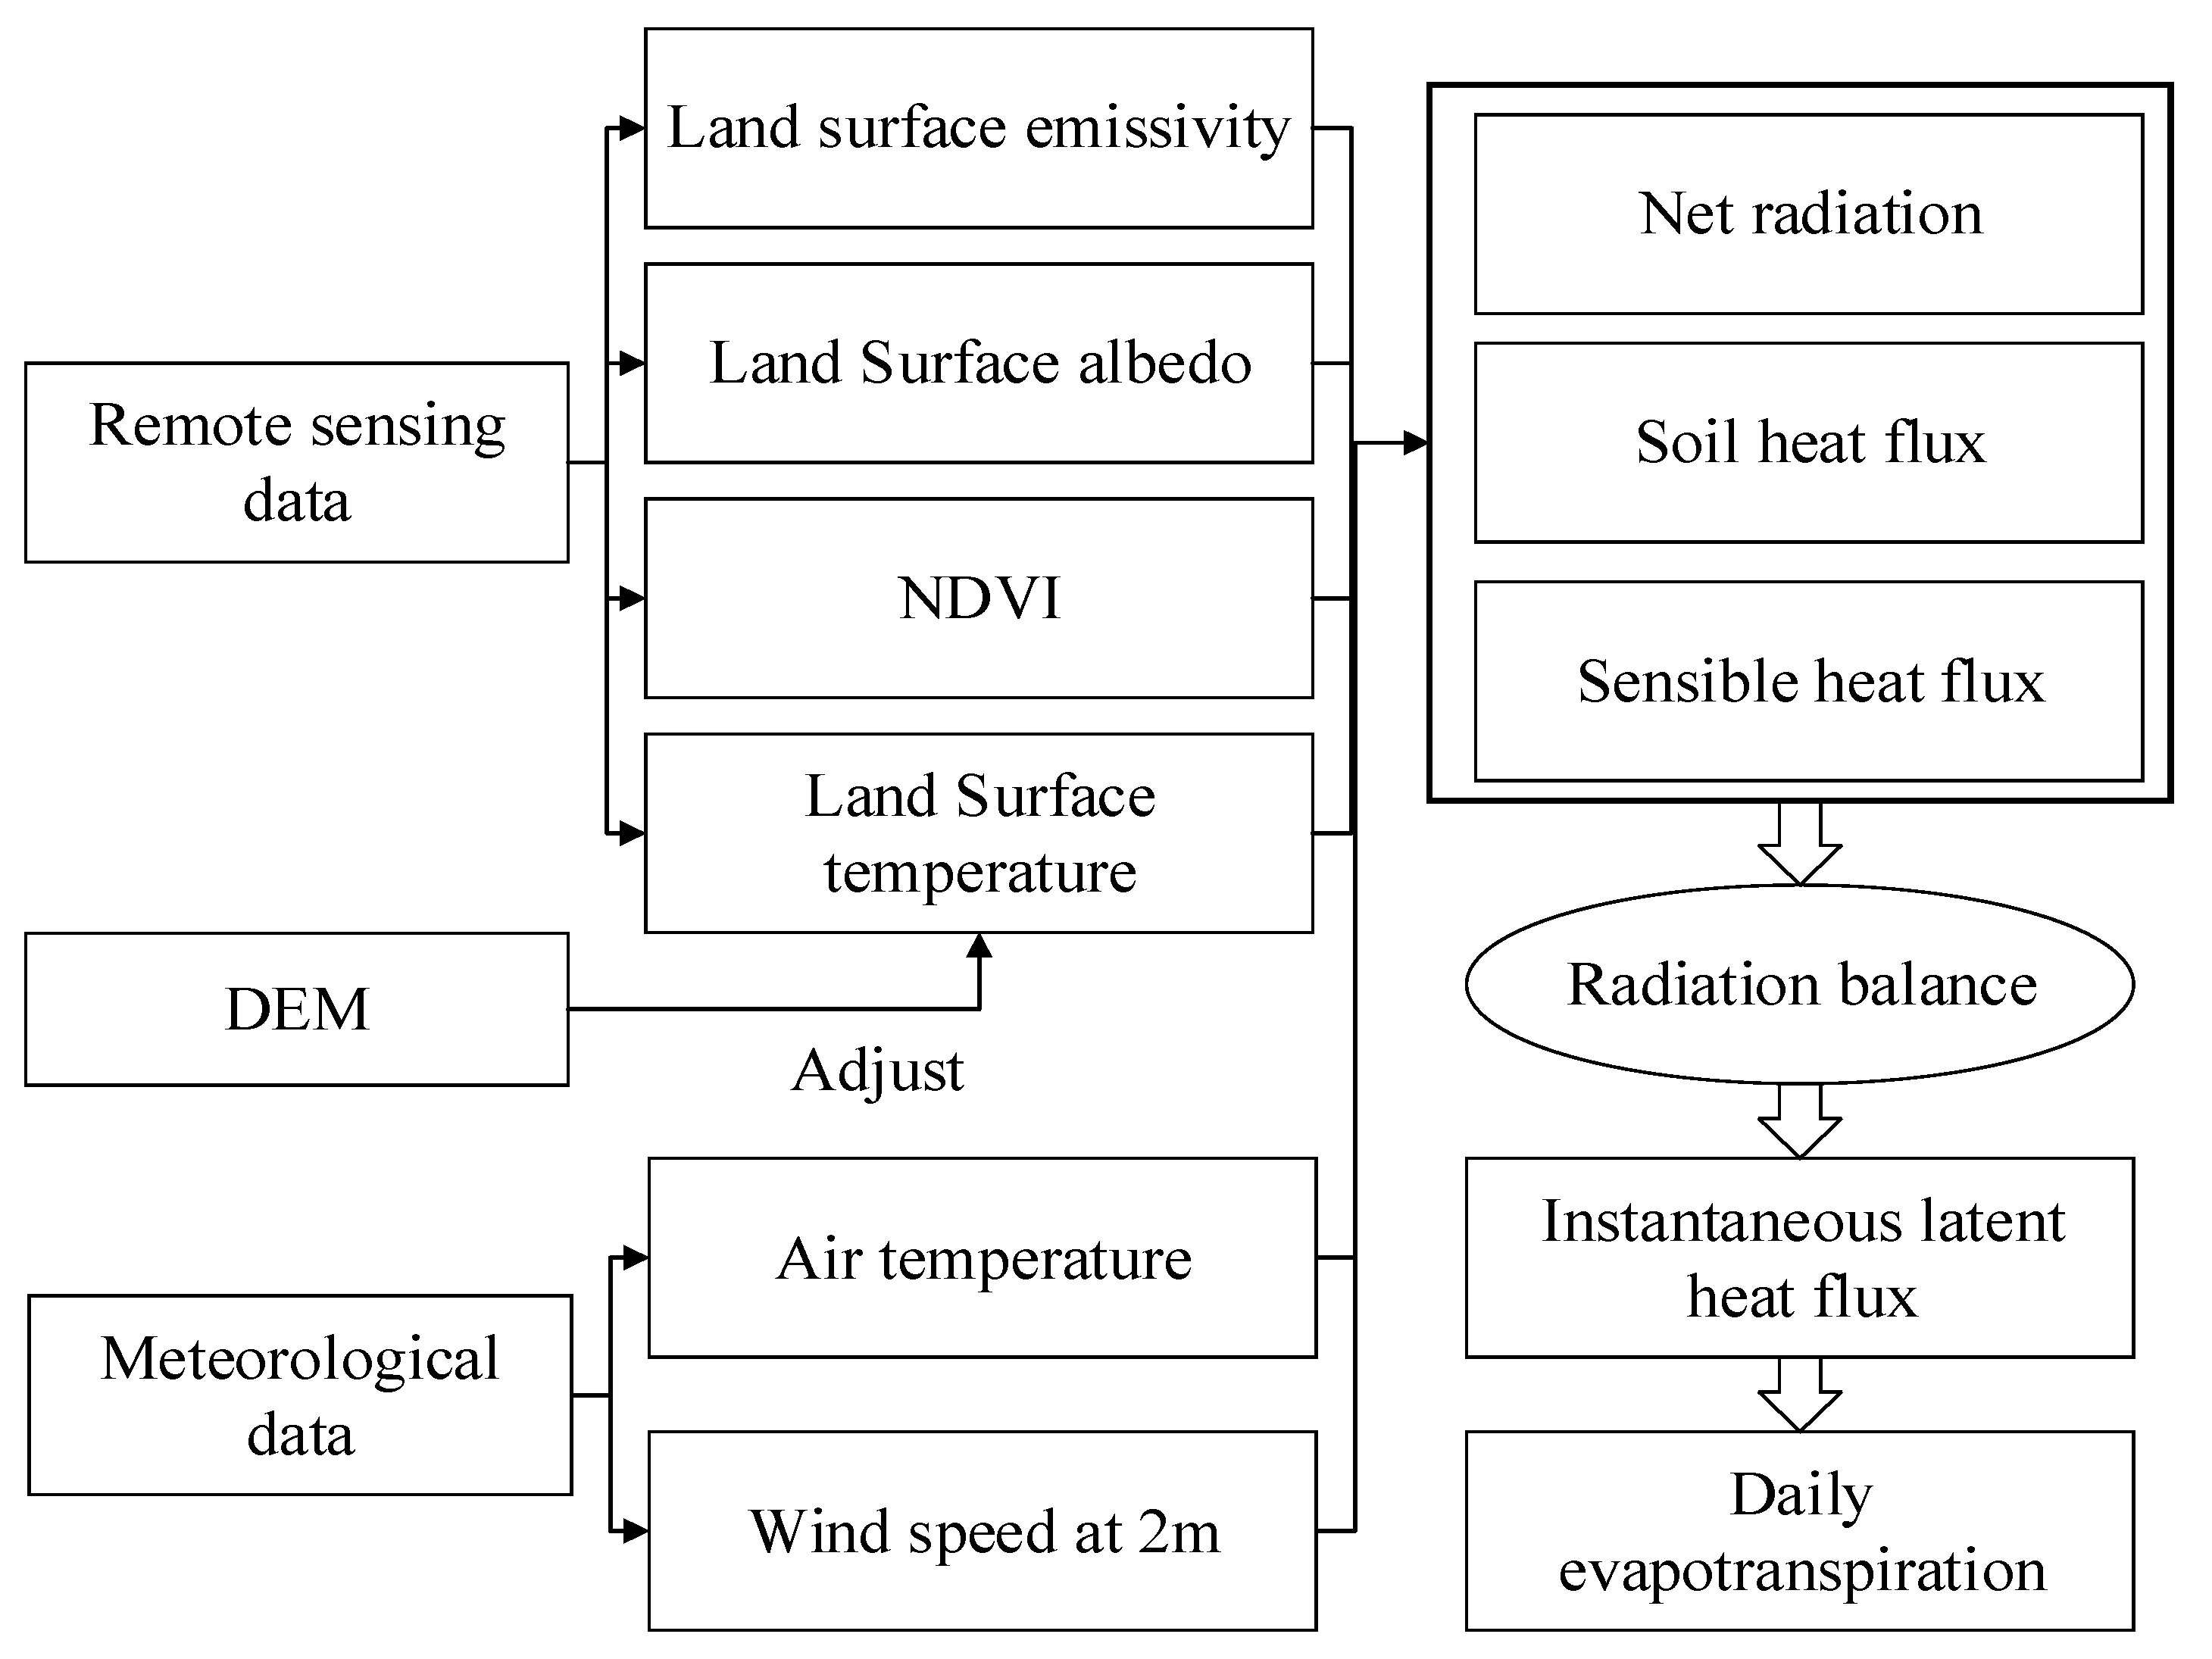
2.3. SEBAL Model and Parameter Determination

This paper will use MODIS remote sensing data to calculate the evapotranspiration of a typical basin (inland river) in the study area, based on the SEBAL model; as well, it will use the MODIS data to analyze the spatial distribution of evapotranspiration within the basin and the characteristics of changes in different periods of the year [16,17,18,19]. Typical basin runoff and precipitation data will be combined with the water balance formula to test the simulation results. The water balance formula is:
P = E + Q + Δ S
where P is precipitation, E is actual evapotranspiration, Q is runoff, and ΔS is the change of water storage in the closed river basin. The inter-decadal change of an inland river over a long period of time is approximately.
The SEBAL model, which contains multiple modules, employs remote sensing data to calculate evapotranspiration in large- and medium-scale regions, based on the pixel scale. Using the original remote sensing parameters and meteorological observation data, each energy component can be calculated and gradually derived to find the instantaneous evaporation as a scale. Through scale conversion, the actual evapotranspiration and monthly evapotranspiration can then be determined.
The SEBAL model is based on the land-surface energy balance principle. Using the remote sensing data and surface meteorological observation data, the area of surface net radiation, soil heat flux, sensible heat flux, and latent heat flux can be applied to calculate the instantaneous evaporation. The SEBAL model has a strong physical basis. By assuming that the evaporation ratio is constant on any given day (note that the evaporation ratio is the ratio of the latent heat flux to the available energy, or the difference between the net radiation flux and the soil heat flux), we can calculate evapotranspiration throughout the day, and then calculate monthly and seasonal evapotranspiration. According to the principle of energy balance, the calculation equation of the SEBAL model is:
L E = R n H G
where LE is latent heat flux (W/m2), Rn is surface net radiation (W/m2), H is sensible heat flux (W/m2), and G is soil heat flux (W/m2).
(1)
Soil Heat Flux (G)
According to Ma [20] and other research:
G = { T s α ( 0.0032 α + 0.0062 α 2 ) ( 1 0.978 N D V I 4 ) × R n ( v e g e t a t i o n ) 0.20 R n ( unused   land )
where Rn is surface net radiation flux (W/m2), Ts is surface temperature, α is surface reflectance, and NDVI is normal differential vegetation index.
The SEBAL model makes a simple estimation of the soil heat flux of the underlying surface of vegetation. However, for different seasons and due to the underlying surface of water and snow, the formula needs to be modified [21]:
G = 0.3 ( 1 0.98 N D V I 4 ) R n
(2)
Normal Differential Vegetation Index (NDVI)
N D V I = B a n d 4 B a n d 3 B a n d 4 + B a n d 3
where Band4 is the near-infrared band, which is mainly used to invert vegetation chlorophyll absorption; Band3 is the red light band, which mainly inverts cloud and vegetation cover changes.
(3)
Sensible Heat Flux (H)
H = ρ C p ( T 0 T a ) / r a
where ρ is air density, Cp is constant pressure specific heat, ρCp is volumetric capacity of air (the constant is 1205), T0 is surface temperature, and Ta is atmospheric temperature. The calculation of sensible heat flux is both the most crucial and most difficult step in following the SEBAL model. Not only is the calculation process complex, the accuracy of the calculation directly affects the accuracy of the evapotranspiration reading.
Assumption ΔT in the SEBAL model has a linear relationship with the surface temperature T0 [22]:
ΔT = aT0 + b
where ΔT is the temperature difference between the atmospheric temperature Ta and the surface temperature T0, a and b are calibration coefficients, calculated by defining “cold pixel” and “hot pixel”, which are 0.15 and −2.23, respectively. The “cold pixel” is usually selected from the water surface, and its sensible heat flux is assumed to be 0, so its ΔT = 0. The “thermal pixel” is taken from extremely dry bare soil. Assuming its ET = 0, the sensible heat flux Hhot can be calculated by the following formula:
H hot = R n _ h o t G hot
where Rn_hot is the Rn value (W/m2) of the “hot pixel”; Ghot is the G value (W/m2) of the “hot pixel”. After calculating the H value of the “thermal pixel”, ΔT can be obtained by formula (3). By selecting the “cold and hot pixels” multiple times, the calibration coefficients a and b can be determined, the robe obtains the pixel-based ΔT, and finally the pixel-based H value is obtained.
The temperature was tested using the observation data of the weather station, which accorded with the distribution characteristics of mountain-oasis-desert in the study area, and could be applied to this area. For the determination of the temperature gradient, referring to the research of the predecessor on the main stream area of the Tarim River [23], the temperature gradient coefficients of the “cold spot” and “hot spot” are determined to be 0.15 and −2.23, respectively. Since the Bosten Lake Basin in the study area in this paper is one of the important sources of the Tarim River and is similar to the ecological characteristics of the Tarim River, this coefficient is also applicable to this study area.
(4)
Aerodynamic Impedance (ra)
r a = 1 k 2 U | ln | z d z 0 h | ψ s h | | ln | z d z 0 m | ψ s m |
where k is the von Karman constant (0.41), z is reference height (2 m), and U is wind speed at the reference height.
(5)
Land Surface Emissivity (ε)
Land Surface Emissivity is the ratio of the radiant emission of an object to the radiant emission of a black body at the same temperature and wavelength. In the SEBAL model, land surface emissivity is derived from the empirical formula associated with NDVI [24]:
ε = 1.009 + 0.047 ln ( N D V I )
where NDVI > 0; otherwise, ε = 0.
(6)
Surface Roughnesszom (zom)
zom = exp ( 5.65 N D V I 6.32 )
(7)
Friction Velocity (Ur)
U r = U 2 × ln ( 67.8 × Z r 5.42 ) 4.87
where U2 is 2-meter-high wind speed, and Zr is Z-meter-high ground.
(8)
Surface Temperature (Ts)
B = s T 4
where B is energy emitted by the black body surface (W/m2); S is the Stefan—Boltzmann constant, which is 5.67 × 10⁻⁸(W/m2/K4); and T is the black body surface temperature (K).
(9)
Daily Evapotranspiration
E T 24 = 86400 W ( R n 24 G n 24 ) λ
where Rn24 is daily net radiant flux, Gn24 is daily soil heat flux, and the unit of ET24 is mm/d.
In the calculation of daily evapotranspiration, this paper adopts the improved evaporation ratio method based on the original evaporation ratio method, eliminating the soil heat flux (G) parameter in the original evaporation ratio method. Because the value of soil heat flux is often negligible in the actual study of evapotranspiration, removing it can reduce the uncertainty error it brings.
First, use MODIS products, meteorological data, and elevation data to obtain surface parameters such as vegetation index and surface temperature; then, use the above surface parameters to estimate net radiation, soil heat flux, and sensible heat flux; finally, calculate the evapotranspiration by the energy remaining method. The latent heat flux is expanded over the time scale to obtain daily evapotranspiration. Figure 2 depicts the structural chart of the SEBAL model [25]:

2.4. FAO Penman-Monteith Equation

In 1998, the Food and Agriculture Organization of the United Nations recommended the use of the FAO P-M method to calculate crop evapotranspiration, and encouraged people to stop using the previously recommended method and other methods for calculating evapotranspiration [26]. The basic principle is:
E T = K C 0.408 Δ ( R n G ) + γ 900 T + 273 u 2 ( e s e a ) Δ + γ ( 1 0.34 u 2 )
where ET is evapotranspiration(mm/d); Kc is Crop coefficient; Rn is Net radiation of crop surface(MJ/m·d); G is Soil heat flux(MJ/m2·d); γ is Dry wet table constant (kPa/°C); T is Daily average temperature (°C); u2 is Wind speed at 2 m height(m/s); Δ is Saturated vapor pressure curve slope(kPa/°C); es is Saturated vapor pressure(kPa); and ea is Actual water vapor pressure(kPa).

3. Results and Discussion

3.1. Analysis of Evapotranspiration during the Year in the Bosten Lake Basin in 2013

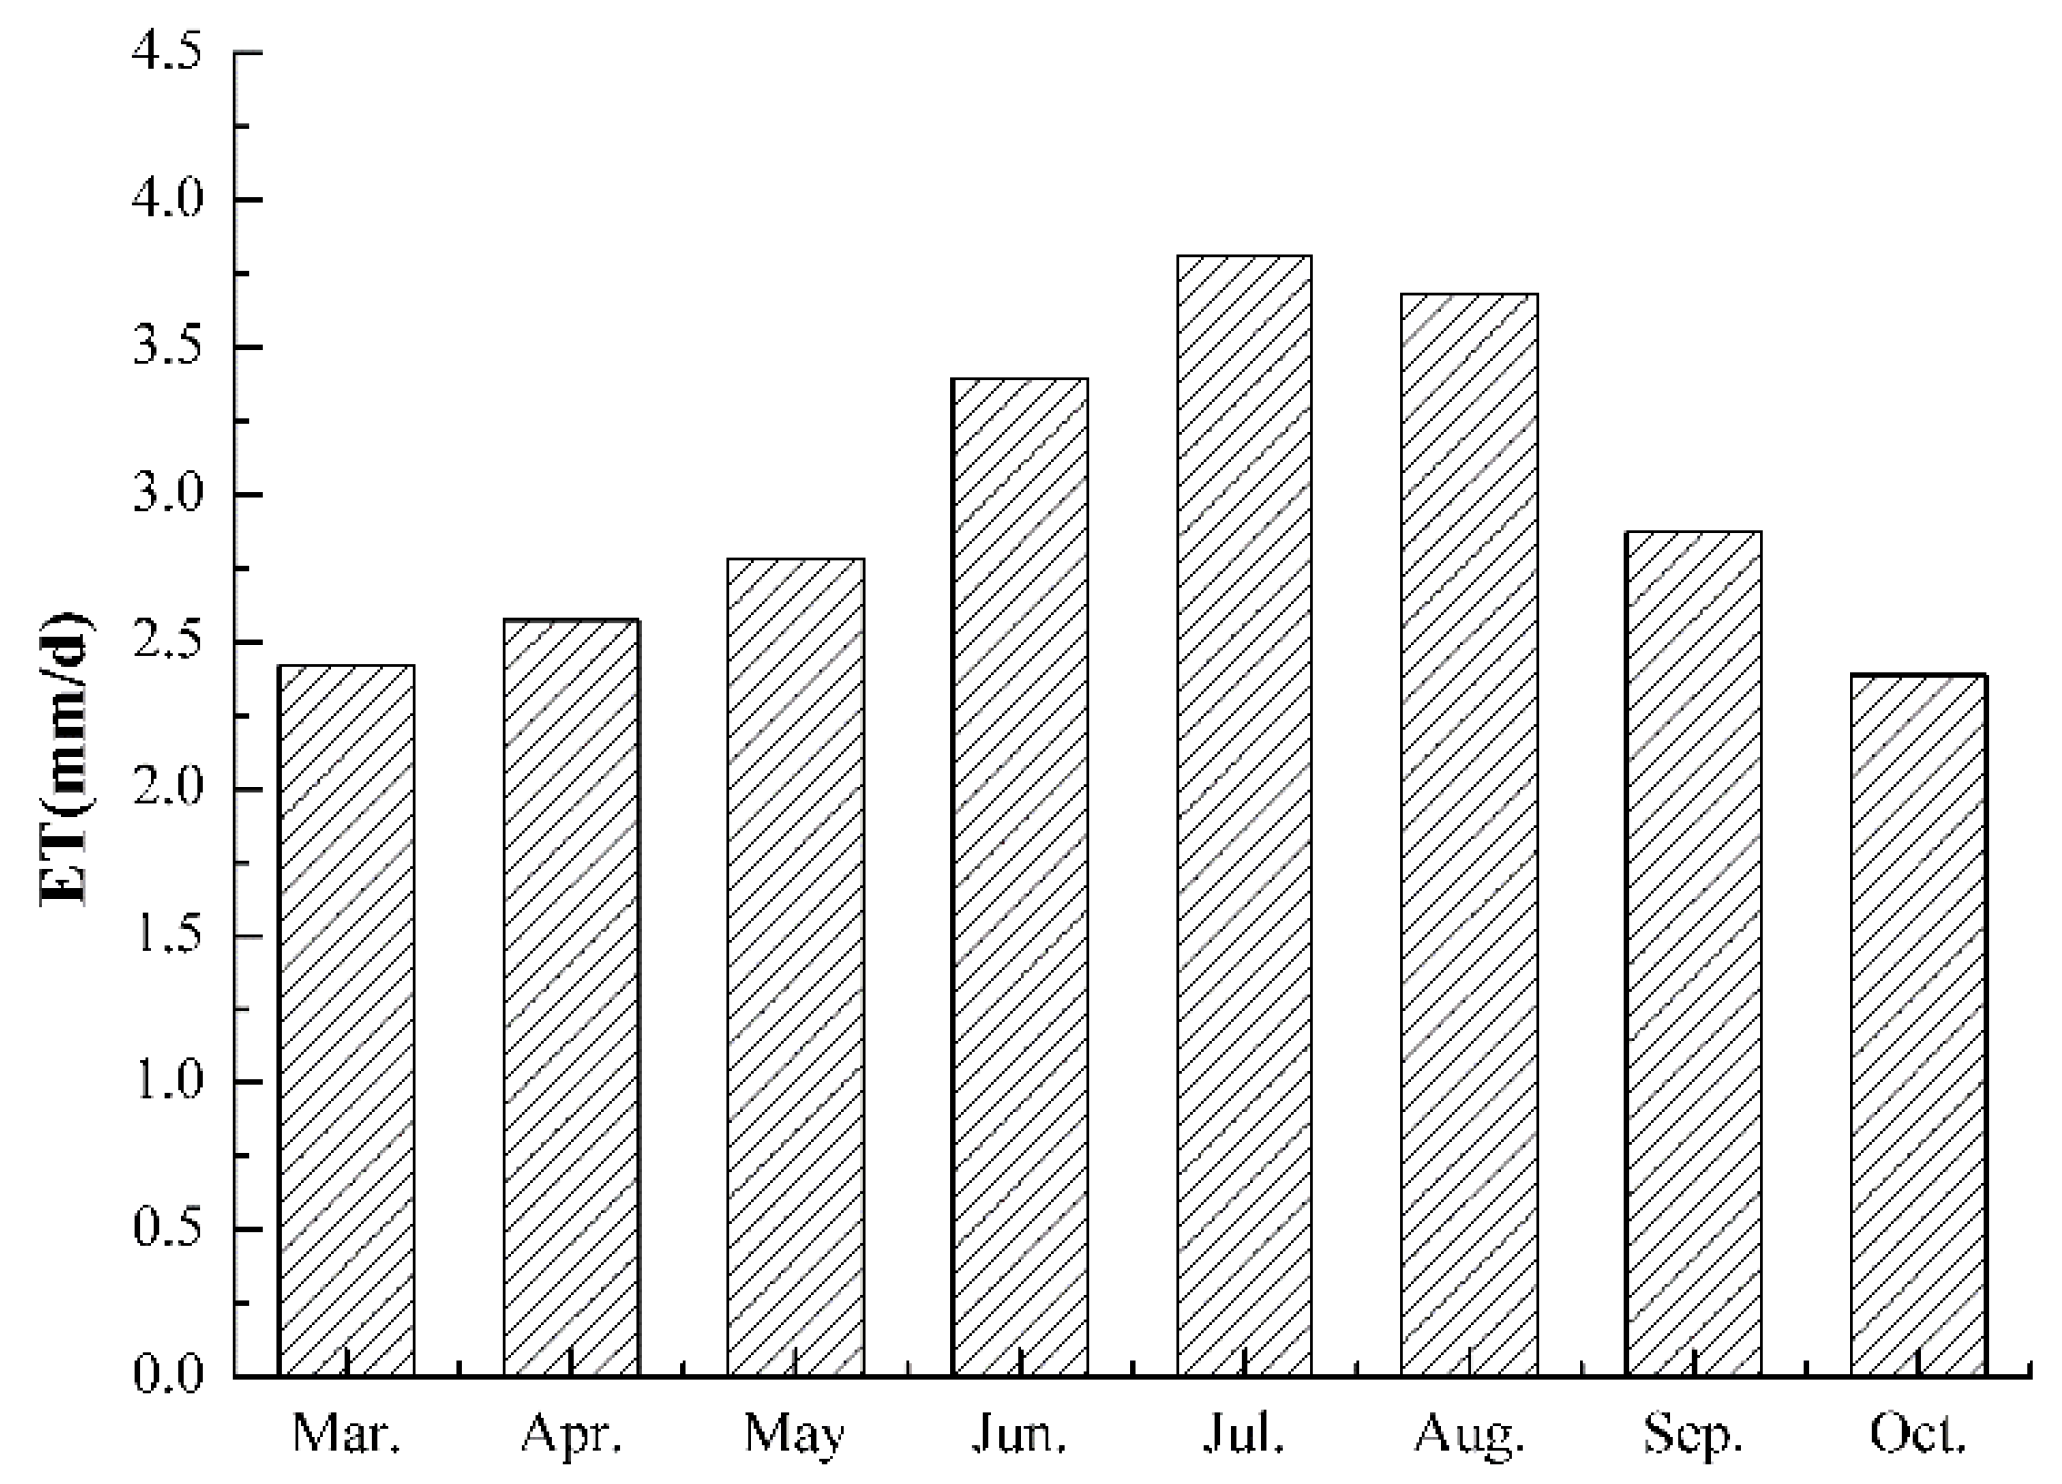
3.1.1. Analysis of Time Change Rule

This is based on the average daily evapotranspiration from March to October 2013 in the Bosten Lake Basin (Figure 3). March to October is the growing period of all kinds of vegetation in the study area, and the observed values of NDVI and ET are also credible. Overall, the distribution style is monomodal. As can be seen, the evapotranspiration was lowest in March (81st day) and October (289th day). Furthermore, it began in April (113th day) and shows a significant growth trend, reaching 2.783 mm/d in May (145 days). The region’s evapotranspiration continued to rise rapidly in June (169th day) and then peaked in July (185th day) and again in August (241st day). The largest amount of evapotranspiration in July measured 3.812 mm/d.
The reason for the analysis was that the temperature in the study area was extremely low in March and October, meaning that conditions were not conducive to surface evapotranspiration. However, at the beginning of April, the temperature started to rise and the evapotranspiration gradually increased. The temperatures continued to rise in May and June, leading to larger differences in air saturation and increased water consumption. Lower temperatures began to return in September, accompanied by plant senescence, loss of leaf function, and reduced evapotranspiration. October brought further decreases in temperature. With the metabolic activity of most plants sinking ever lower due to the approach of winter, the amount of transpiration was also reduced.

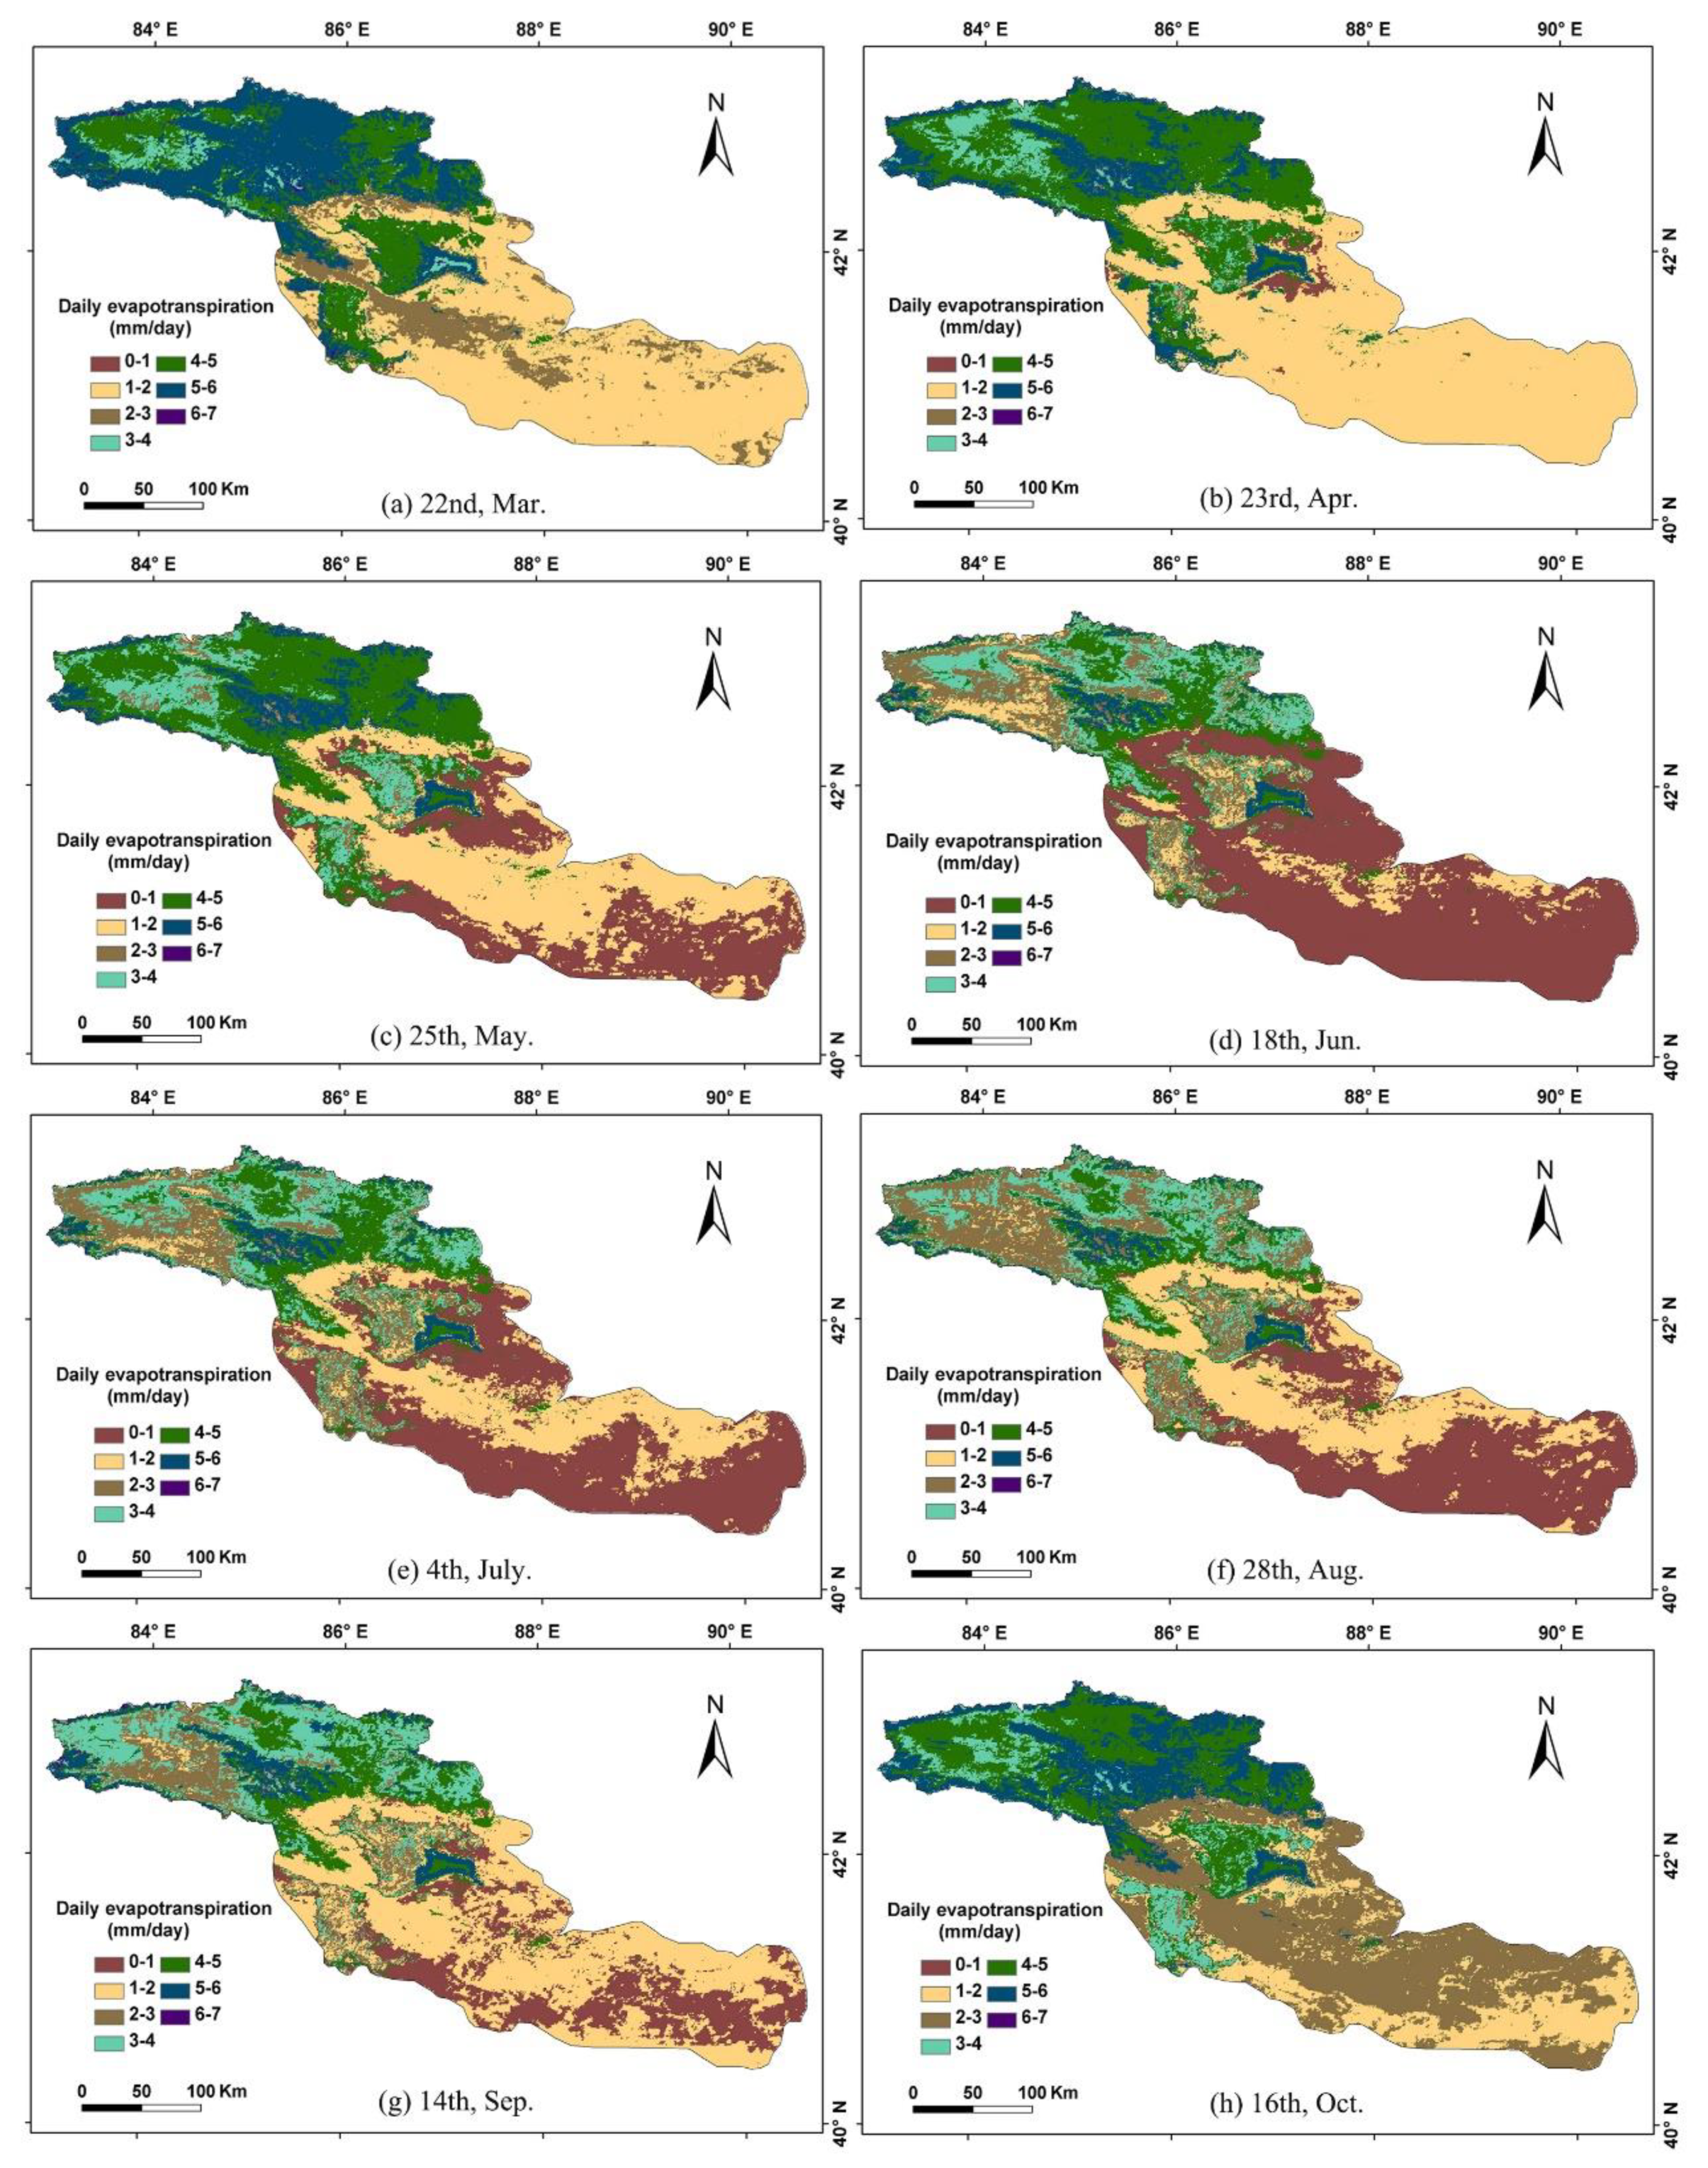
3.1.2. Analysis of Spatial Variation

To determine the spatial variations, we first extract the evapotranspiration dataset for 2013. Then, we analyze the spatial distribution characteristics of ET from March to October in the Bosten Lake Basin and divide the average ET value into seven levels for pixel statistical analysis (Figure 4). As can be seen, the high value areas for ET are mainly in the Kaidu River Basin, the Central Yanqi Basin, and the area surrounding Bosten Lake. The analysis also shows that actual evapotranspiration in the Bosten Lake Basin varies with the seasons and peaks in July and August. Spatial distribution is mainly influenced by land use types, with cultivated land and grassland evapotranspiration being more pronounced in March and April. However, evaporation for all vegetation types was highest in July and August.
It is also worth noting that, in the study area, the spatial distribution is characterized by a decrease from northwest to southeast, a transition from a mountainous region to a plain, and a decrease in the desert area of the downstream Peacock River Basin. This difference is due to the fact that the actual evapotranspiration in the arid area is mainly controlled by the local area’s water status (Precipitation). Precipitation directly affects the soil moisture content of the surface, thus affecting ET [27]. Hence, the spatial distribution of precipitation determines the characteristics of evapotranspiration in the study area: More in the northwest, less in the southeast, more in mountainous areas, and less in deserts.
Because of the differences in the melting time of snow/ice caused by temperature changes, there is also an unequal redistribution of water across the seasons. A good example of this can be seen in the Bayanbulak prairie ecosystem, which is situated in the upstream portion of the Kaidu River. The prairie region is surrounded by snow-capped mountains, which have the climatic features of alpine mountains; as a result, the prairie is subject to sudden changes in temperature and moisture stress [28]. On average, however, and despite the relatively large amount of precipitation that occurs at higher altitudes, precipitation in the plain area is generally quite scarce.

3.2. Spatial Distribution and Comparison of ET over Different Land Use/Cover Types

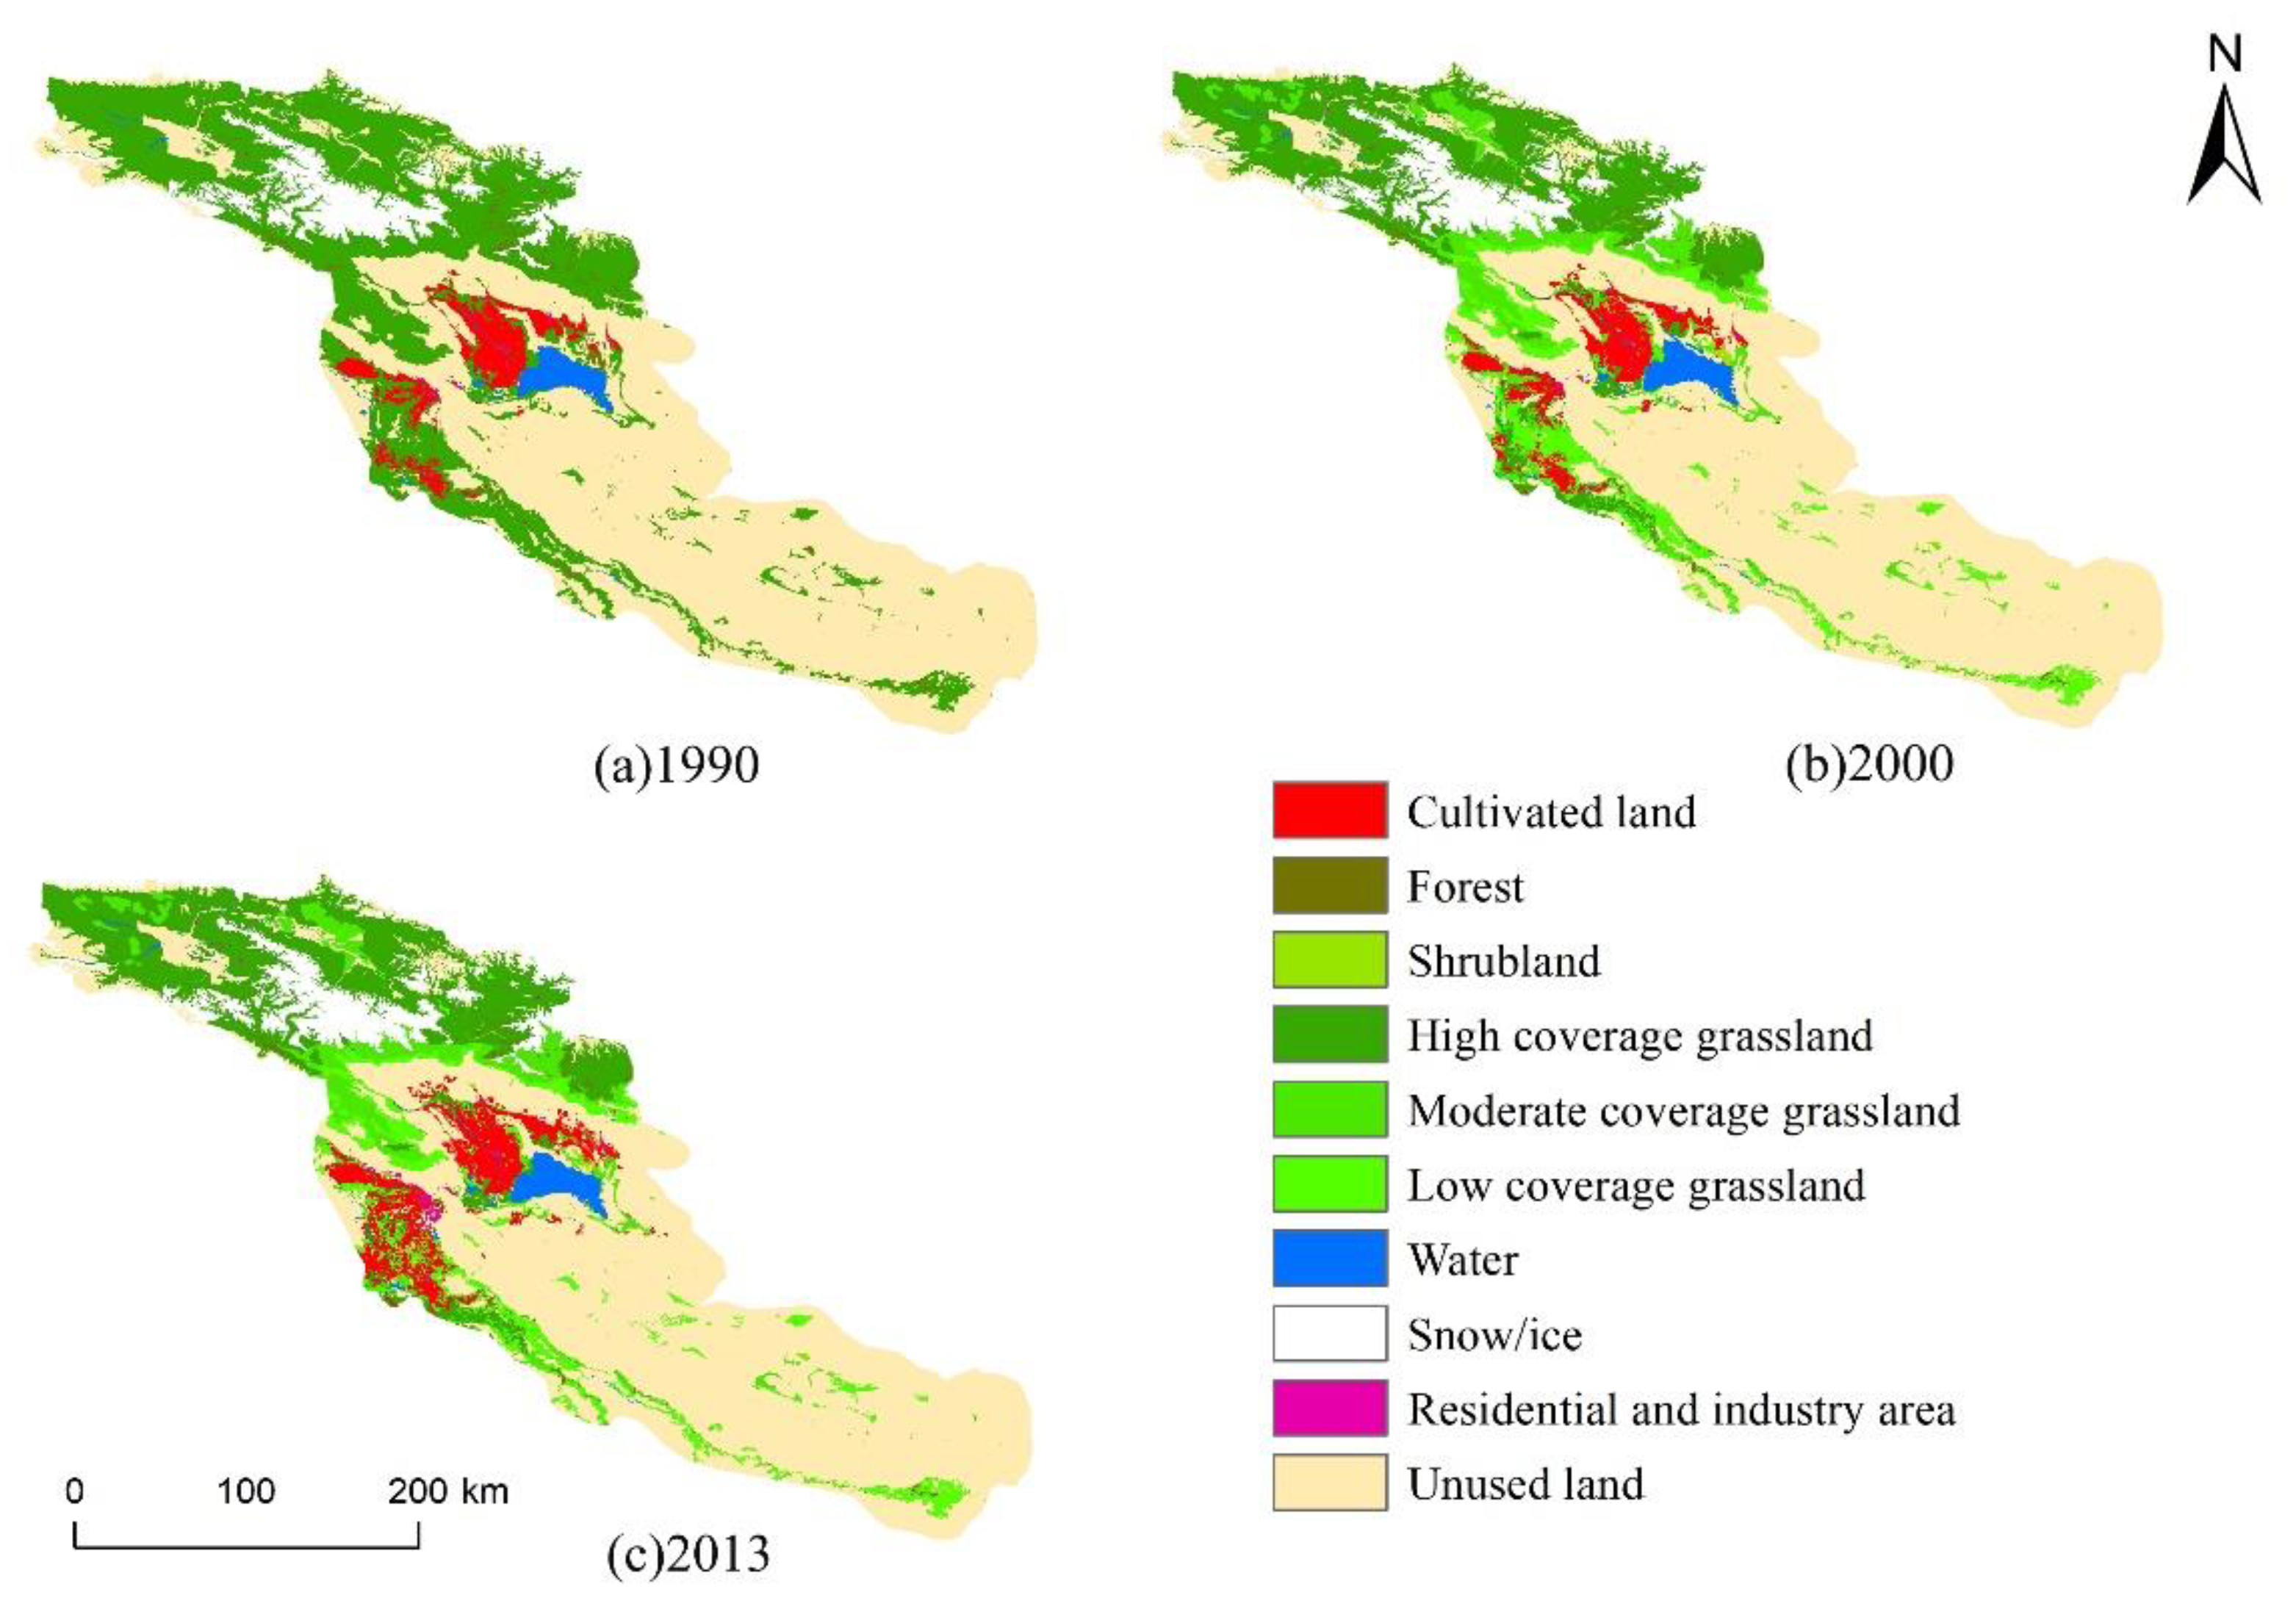
3.2.1. Status of Land Use/Cover Types in the Bosten Lake Basin

According to the results of remote sensing interpretation, land use types in the Bosten Lake Basin can be divided into q0 categories. The 2013 data have been integrated to calculate various land areas and land use structures, as shown in the tables below (Table 4). Of the land types covered in the 2013 data, grassland and unused land accounted for 36% and 54.37% of the total area, respectively, while cultivated land, forest, residential and industry area, and water together accounted for 9.63% of the total area. Overall, grassland and unused land are the main types of land cover in the study area.
Evapotranspiration in the basin is affected by the type of land use/cover. There is also a good correspondence of ET with vegetation cover. Grassland vegetation cover located in mountainous areas with relatively higher levels of precipitation showed a monthly reading exceeding 130 mm for July. During the same period, cultivated land was abundant due to sufficient water supplies, and the evaporation amount exceeded 120 mm. In shrubland, evaporation measured less than 80 mm in July. Since most of the shrubland in the study area are not irrigated, their only water source is rain. Thus, when precipitation levels are low in shrubland, evapotranspiration is likewise low.
The data also show that evapotranspiration in forest cover (102 mm), though slightly lower than ET in grassland and cultivated land, indicates a relationship between ET, vegetation coverage, and water supply. Looking at annual evapotranspiration from March to October under the distribution of land-use types, we can see that the evapotranspiration distribution from northwest to southeast reveals a significant downward trend.

3.2.2. Comparison of Daily Evapotranspiration in Different Land Types

Different land use types have different underlying surface physicochemical properties, such as absorption of radiant energy, soil moisture content, vegetation status, etc. Therefore, evapotranspiration abilities also differ. Table 5 illustrates the daily evapotranspiration means value histogram, which represents the overall level of evapotranspiration for all types of pixels as well as the growing season in the study area. As can be seen, the average daily ET for the largest body of water measured up to 5.61 mm/d, followed by grassland and snow/ice, with average daily ET of 4.6 mm/d and 4.3 mm/d, respectively. Unused land showed the lowest ET levels of less than 1.9 mm/d. Thus, the average daily evapotranspiration level in the growing season was water > grassland > snow/ice > forest > residential and industry area > shrubland > cultivated land > unused land.
In general, the evapotranspiration of water bodies and mountainous regions is greater than that of oases, and oases evapotranspiration is greater than of unused land. This indicates that evapotranspiration is mainly related to vegetation coverage and water supply.

3.2.3. Comparison of Evapotranspiration Water Consumption in Different Land Types

The total evapotranspiration water consumption of grassland in the study area was the largest (Table 6), measuring 1.43 × 10⁷ m3, followed by unused land, which measured 1.26 × 10⁷ m3. Grassland and unused land accounted for 46.04% of the entire area. Meanwhile, the total evapotranspiration of cultivated land and water was 3.67 × 10⁵ m3 and 2.41 × 10⁴ m3, respectively, and the total evapotranspiration in shrubland and forest was 1233.37 m3 and 2249.47 m3, respectively. The smallest total amount of evapotranspiration occurred in residential and industry area and snow/ice cover, measuring 1580.84 m3 and 447.18 m3, respectively. From these data, we can see that ET is mainly related to the area of land use types. Grassland and unused land area accounted for 36% and 54.37% of the region, respectively, whereas residential and industry area and snow/ice cover were relatively small, accounting for only 0.53% and 0.24% of the total area of the study area. The data also show that the Bosten Lake Basin is a typical arid desert region with desert and grassland forming the primary natural landscape.

3.3. Changes in Evapotranspiration in the Bosten Lake Basin

First, it is difficult to obtain large-area remote sensing images at the same time; second, it is the overlap of the difference in the cloudiness of images in different regions at the same time. The subdivided images of cloud cover must be replaced with images of a similar time to improve the accuracy of evapotranspiration migration; Therefore, the comparability of daily evapotranspiration in the same area in different years is low. This paper uses the average daily evapotranspiration of each land use type in the Bosten Lake basin in 2013 as the calculation standard to analyze the changes in daily evapotranspiration caused by land use/cover changes in the area in 1990, 2000, and 2013.

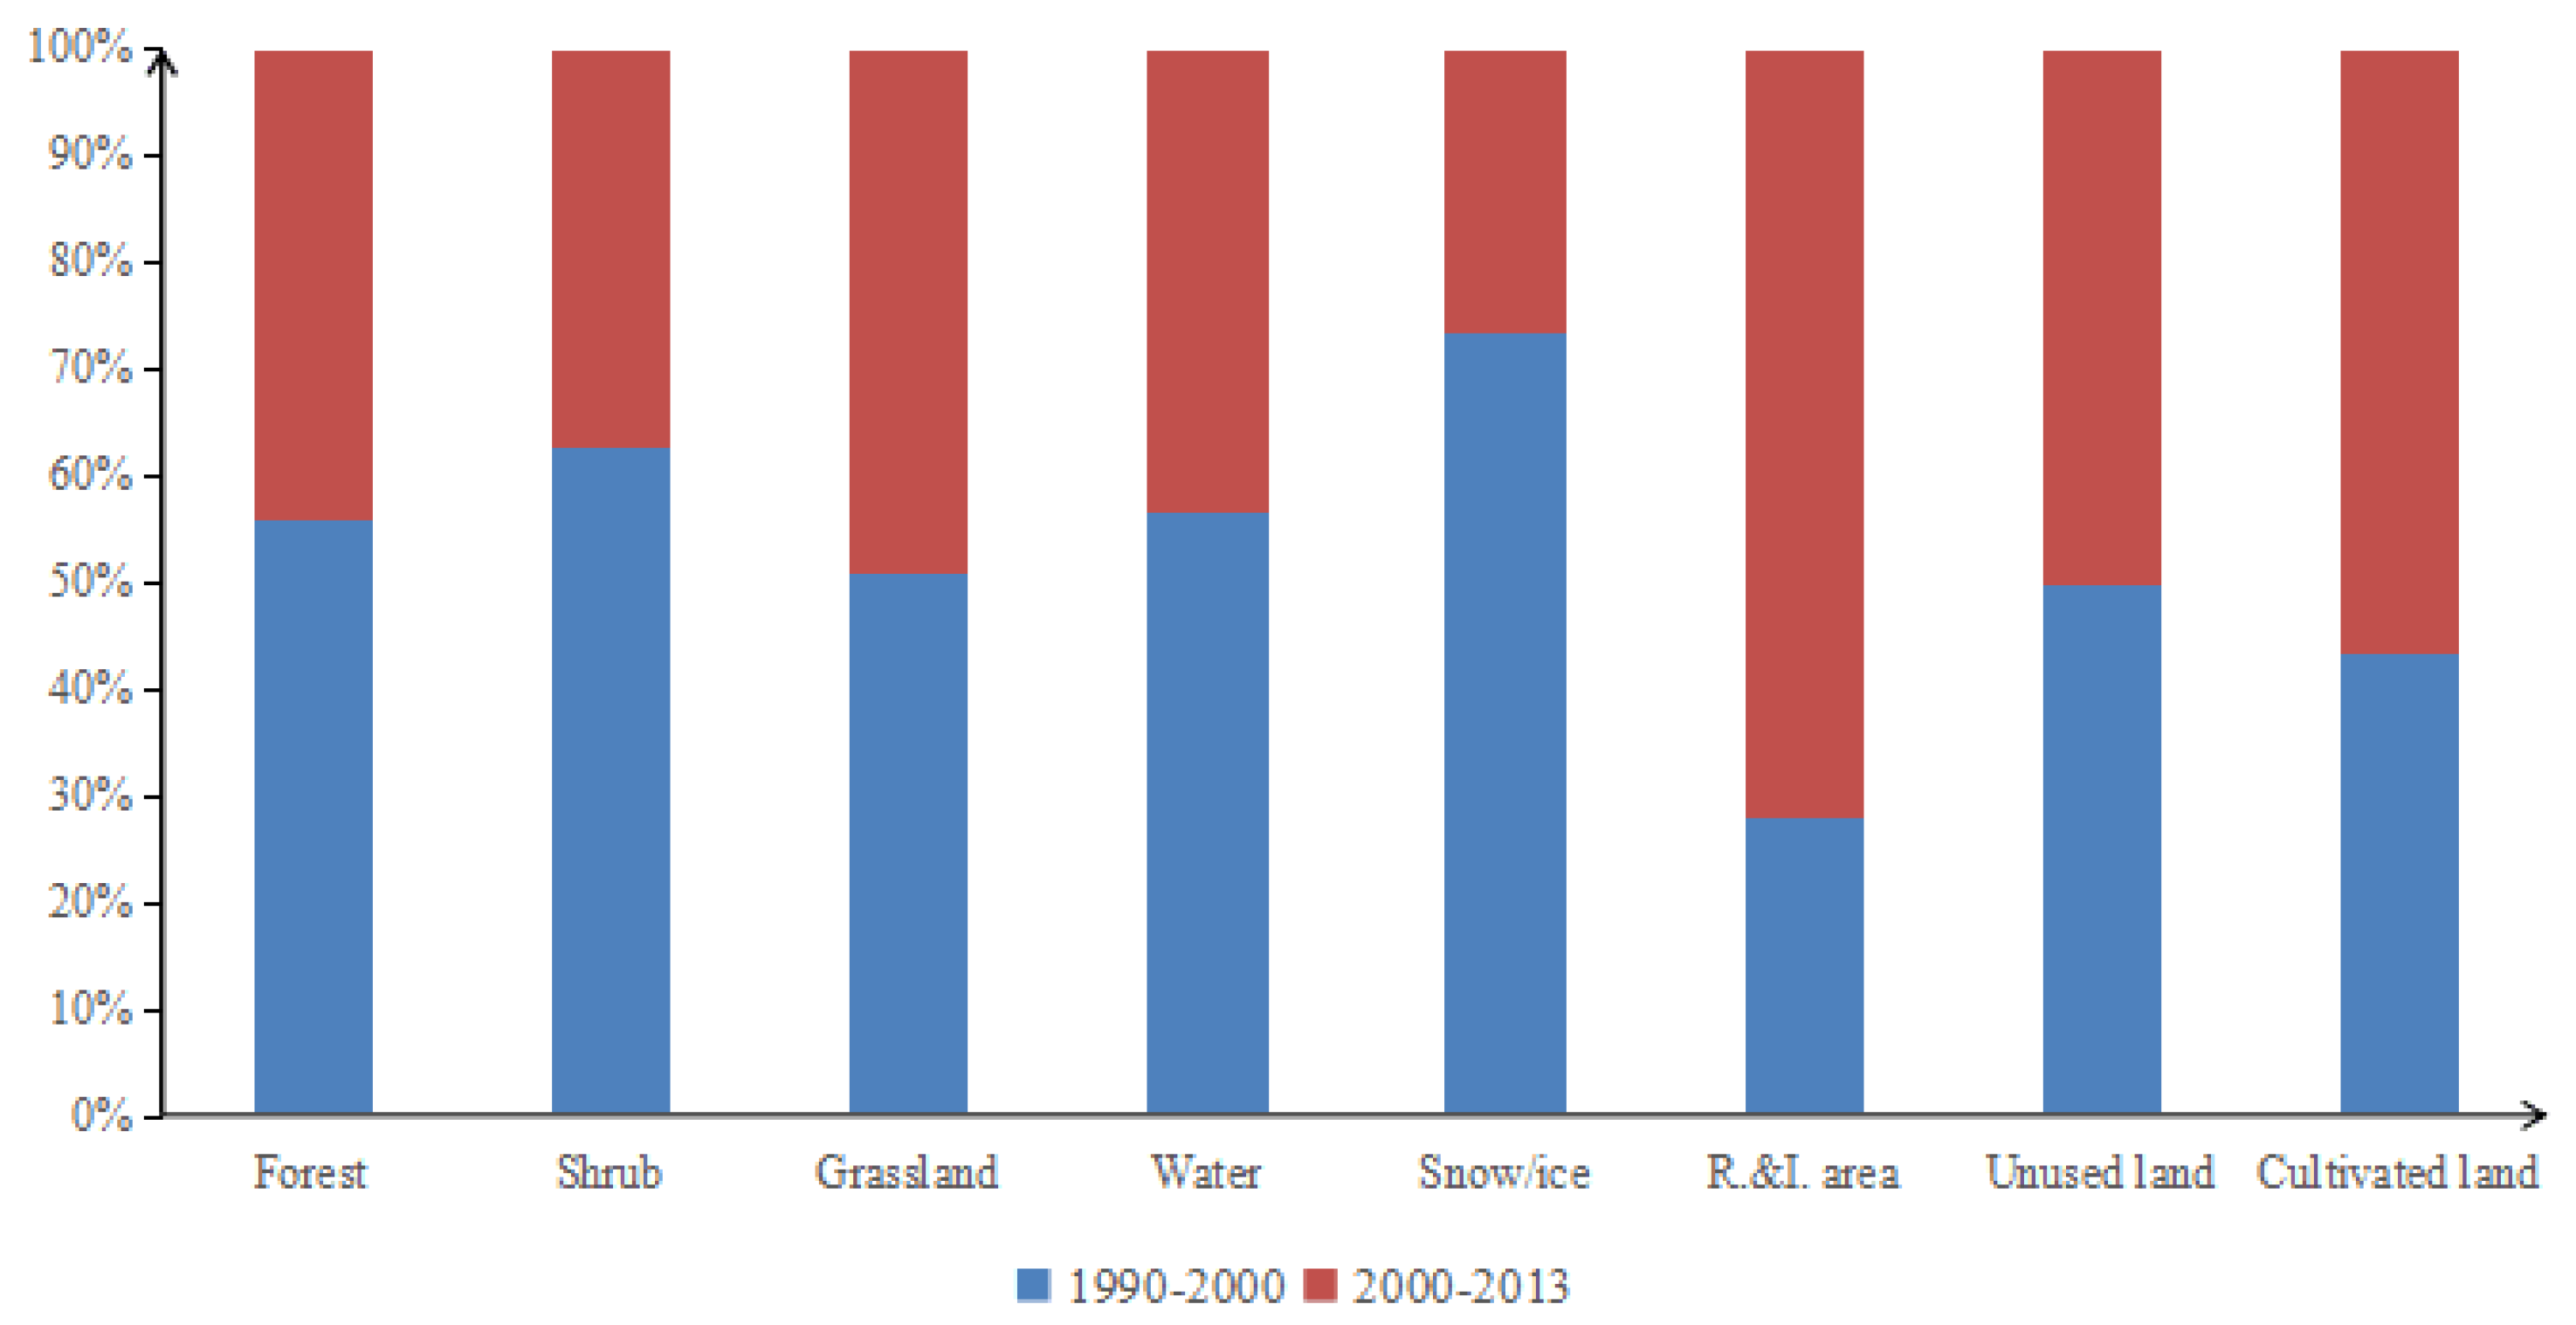
3.3.1. Changes in Land Use/Cover Types in Bosten Lake Basin

The land use/cover change in the Bosten Lake Basin from 1990 to 2013 was significant (Figure 5). From 1990 to 2000, cultivated land, shrubland, high coverage grassland, water, snow/ice, residential and industry area, and unused land all showed an increasing trend in the basin. Among them, residential and industry area increased the most, about 15.55 %, followed by shrubland. The increase rate is about 13.16%, and the increase rate of cultivated land, high coverage grassland, water area, snow/ice, and unused land is small, about 2.53%, 1.54%, 7.00%, 0.93%, and 0.38%, respectively. Forest, moderate coverage grassland, and low coverage grassland showed a decreasing trend; among them, forest has a significant decreasing trend, about 9.31%, followed by moderate coverage grassland, with a decrease of about 6.24%, and low coverage grassland with a decrease of about 2.80%. During this period, the areas of high, moderate, and low grassland, waters, and unused land changed significantly, reaching 218.59 km2, 355.98 km2, 248.80 km2, 121.20 km2, and 156.47 km2, respectively, while the area of snow/ice changed the least at 3.09 km2. After 2000, the degree of land use/cover change in the Bosten Lake Basin became more intense. Cultivated land, high coverage grassland, residential and industry area, and unused land continued to grow, and the growth rate was significantly higher than that in 1990–2000, which were 26.92%, 1.75%, 37.74%, and 0.94% respectively; other land-use types were realized as decreasing trends, forest, shrubland, water, and snow/ice showed a dramatic decrease, with a decrease of 13.53%, 47.34%, 32.34%, and 42.49%, respectively, followed by moderate and low coverage grassland, with a decrease of 2.34% and 9.31% respectively. Cultivated land and low coverage grassland have changed a lot, with 1046.07 km2 and 803.98 km2, respectively; the water area is the second, with a decrease of 599.42 km2. Forest, shrubland, high coverage grassland, moderate coverage grassland, snow/ice, residential and industry area, and the unused land is less, 68.88 km2, 80.51 km2, 252.28 km2, 126.49 km2, 141.70 km2, 113.65 km2, and 390.97 km2. The changes in the area of each land use type showed obvious changes compared with before 2000.

3.3.2. Changes in Total Daily Evapotranspiration of Different Land Use/Cover Types

From 1990 to 2000, the total daily evapotranspiration of different land use/cover types in the Bosten Lake Basin changed significantly (Figure 6). The daily increase in total evapotranspiration of unused land (4.71 × 10⁴ m3) is the largest, followed by cultivated land (7.12 × 10³ m3) and water (2.32 × 10³ m3), and the increase in residential and industry area is small (154.5 m3). The decrease in total daily evapotranspiration of grassland (2.02 × 10⁵ m3) is the largest, and that of forest is the smallest (267.01 m3). From 2000 to 2013, the daily increase in total evapotranspiration from unused land was as high as 1.18 × 10⁵ m3, and the increase in total daily evapotranspiration from cultivated land also reached 7.78 × 10⁴ m3, while the increase residential and industry area was only 814.22 m3. The total daily evapotranspiration of other land-use types decreased. Among them, the maximum daily total evapotranspiration reduction of grassland was 3.47 × 10⁵ m3, followed by water of 9.56 × 10³ m3, and the minimum reduction of forest was 352 m3. The main reason lies in the expansion of cultivated land in oasis areas, and the strong irrigation of cultivated land has made the soil–atmosphere interface water conditions sufficient, the degree of desertification of unused land in desert areas has increased, and the degradation of low-coverage vegetation has led to increased evapotranspiration. Grassland is seriously degraded, resulting in reduced evapotranspiration. This shows that the actual evapotranspiration is mainly related to vegetation coverage and water supply status.

3.4. Accuracy Verification

This paper selects data from three weather stations (Bayanbulak in the Kaidu River Basin, Kuche Station in the Yanqi Basin, and Tieganlike in the Kongqi River Basin) to use the evapotranspiration calculated by the FAO PM formula to calculate the results of the SEBAL model. Accuracy test results are shown in Table 7. The results show that the average error of the SEBAL model calculation results is 13.03%, which is similar to the simulation accuracy of other researchers [23], indicating that the model has good applicability in the study area.

4. Discussion

The spatial pattern of evapotranspiration in the Bosten Lake Basin is mainly affected by precipitation and land cover. Due in large part to its inland location, the basin experiences scant precipitation and low evapotranspiration. The mountainous portion of the study area has the most precipitation, leading to the highest levels of actual evapotranspiration, whereas the oasis and desert areas see very little precipitation and thus experience very low levels of evapotranspiration.
At the same time, the evapotranspiration of different land covers reveals significant differences, showing that water > grassland > cultivated land > forest > unused land. Li [23] used the SEBAL model to estimate evapotranspiration in the mainstream of the Tarim River, a typical inland river in China’s northwest arid region. Similar to the present study, Li’s work concluded that evapotranspiration of different land-use types in the Tarim River Basin was: water > cultivated land > forest > grassland > unused land. Therefore, the conclusions of this investigation contribute to better understanding the evapotranspiration patterns of different spatial dimensions in arid regions. Chen [21] used the arid area of the northwest as the research area and used the net surface radiation, soil heat flux, sensible heat flux, and coverage data to establish an evapotranspiration divergence model, and based on the comparison between the measured evapotranspiration and the calculation results of the model, the relative error of the Ruoqiang monitoring point is 17.1%, which is close to the actual situation, indicating that the model has good applicability. Li [29] used MODIS data products combined with observation data from surface weather stations to invert the surface evapotranspiration during the 2015 growing season (April-October) in the northwest agricultural and pastoral transition zone based on the SEBAL model. The Penman-Monteith formula combined with crop coefficients was used to compare the prediction results of the model. The results showed that the average absolute error between the SEBAL model conversion result and the P-M formula was 0.79 mm/d, and the root mean square error was 0.94 mm/d, R2 = 0.76, the overall inversion value is relatively high, but it can basically meet the research needs of the region.
Due to the combined effects of human activities and climate change, the evapotranspiration in the study area in 2013 did not fluctuate much with regard to the time and space scale. Factors such as land use changes and the expansion of the oasis area will cause fluctuations in evapotranspiration, given the oasis agriculture of the Bosten Lake basin. In addition to human activities, climate change can also have a profound impact on the differentiation of evapotranspiration. As global warming intensifies, the northwest will become increasingly arid. The temperature in the area has increased significantly since the 1970s, with a notable spike over the past 10 years. As well, there has been a decline in precipitation all across the arid area of the northwest, with about 45% of the stations showing a decreasing precipitation trend compared with the 1990s [30]. Moreover, the continuous expansion of cultivated land in the Bosten Lake basin over the past 30 years has led to an increase in evapotranspiration and water consumption in the plains and oases areas. This has severely lessened the amount of raw water flowing in the lower reaches of the Kongqi River, causing the area’s fragile vegetation to experience worsening ecological problems [31].
The response of land surface evapotranspiration under climate change conditions [32,33] and the time series changes of land evapotranspiration in China [34,35] have been rigorously discussed. Compared with the above-mentioned research, the advantage of the present investigation lies in the analysis of the temporal and spatial changes of evapotranspiration in the study area and the spatial distribution and comparison of evapotranspiration of different land use/cover types according to differences in physical geography. It is concluded that actual evapotranspiration is mainly related to vegetation coverage and water supply. Specifically, the mountainous areas receive the most precipitation and their actual evapotranspiration is also the greatest. Similarly, water bodies have higher actual evapotranspiration than oases, the latter of which have higher actual evapotranspiration than unused land.
It is worth noting that the evapotranspiration in the plains/oases areas accounts for 39% of the total evapotranspiration in the middle and lower reaches of the river, with the oasis area comprising around 12% of the plains area. It can be seen that the midstream oases, especially those in agricultural irrigation regions, form major water consumption areas. Therefore, more in-depth research is needed to determine an appropriate oasis scale for maintaining the sustainable use of water resources in the basin as well as downstream ecological security.
Overall, the natural elements of the “mountain-oasis-desert” system in the Bosten Lake basin have distinct characteristics of differentiation that are representative of China’s arid northwest. Therefore, the conclusions of this study provide a reference for understanding the heterogeneity of evapotranspiration under different dry and wet backgrounds in arid regions.

5. Conclusions

Evapotranspiration in the Bosten Lake Basin showed a unimodal distribution in terms of time distribution. Temporally, ET was lower in March but showed a distinct upward trend from April. ET continued to rise rapidly in May and June until reaching a peak in July and August. After that, it declined significantly. The monthly changes in ET were chiefly affected by rainfall, temperature, and vegetative growth.
Evapotranspiration in the Bosten Lake Basin was relatively high but also differentiated according to a number of key factors. In terms of spatial distribution, ET in the study area was mainly influenced by land use type, with the general trend being higher levels of ET in the northwest and mountains and lower levels in the southeast and desert areas. From 2000 to 2013, the daily increase in total evapotranspiration from unused land was as high as 1.18 × 10⁵ m3, and the increase in total daily evapotranspiration from cultivated land also reached 7.78 × 10⁴ m3, while the increase in residential construction sites was only 814.22 m3. The total daily evapotranspiration of other land-use types decreased.
From 1990 to 2013, the types of land use increased significantly in terms of residential and industry area and cultivated land (increased 59.16% and 30.13%, respectively), forest, shrubland, water, snow/ice were significantly decreased by 21.58%, 40.41%, 27.61%, and 41.96%, high coverage grassland, unused land increase by 3.32% and 1.32%, moderate and low coverage grassland decreased by 8.46% and 11.85%, respectively. In the land types in the study area in 2013, grassland and unused land were the most abundant land cover types, accounting for 36% and 54.37% of the total land area, respectively. The evapotranspiration of grassland was the highest in mid-July (over 130 mm), followed by cultivated land (120 mm) and forestland (102 mm). Under the distribution of land use types, annual ET decreased significantly from northwest to southeast.
In 2013, the greatest average diurnal evapotranspiration in the growing season of the study area occurred over bodies of water (5.61 mm/d), followed by grassland (4.6 mm/d) and snow/ice (4.29 mm/d). In contrast, ET over residential and unused land was the least, measuring less than 1.8 mm/d. The largest daily evapotranspiration occurred over grassland (1.43 × 10⁷ m3), followed by unused land, which accounted for 46.04% of the entire area. Total ET amounts over residential land and snow/ice cover were minimal.

Author Contributions

Y.W. conceived the study design, S.Z. and X.C. implemented the field research collected and analyzed the field data, Y.W. wrote the paper with the help of S.Z. and X.C. All authors have read and agreed to the published version of the manuscript.

Funding

This research was funded by the National Natural Science Foundation of China: “Dynamic evolution of desertification process based on the changes of bare desert boundary” (Grant No: 41661015).

Conflicts of Interest

The authors declare they have no conflict of interest.

References

  1. Li, B.F.; Chen, Y.N.; Li, W.H.; Chen, Z.S.; Zhang, B.H.; Guo, B. Spatial and temporal variations of temperature and precipitation in the arid region of northwest China from 1960–2010. Fresenius Environ. Bull. 2013, 22, 362–371. [Google Scholar]
  2. Li, Z.; Chen, Y.; Shen, Y.; Liu, Y.; Zhang, S. Analysis of changing pan evaporation in the arid region of Northwest China. Water Resour. Res. 2013, 49, 2205–2212. [Google Scholar] [CrossRef]
  3. Liu, Z.; Chen, H.; Huo, Z.; Wang, F.; Shock, C.C. Analysis of the contribution of groundwater to evapotranspiration in an arid irrigation district with shallow water table. Agric. Water Manag. 2016, 171, 131–141. [Google Scholar] [CrossRef]
  4. Lv, Y.P.; Xu, J.Z.; Yang, S.H.; Wang, Y.J. Inter-seasonal and cross-treatment variability in single-crop coefficients for rice evapotranspiration estimation and their validation under drying-wetting cycle conditions. Agric. Water Manag. 2018, 196, 154–161. [Google Scholar] [CrossRef]
  5. Jiang, X.-W.; Sun, Z.-C.; Zhao, K.-Y.; Shi, F.-S.; Wan, L.; Wang, X.-S.; Shi, Z. A method for simultaneous estimation of groundwater evapotranspiration and inflow rates in the discharge area using seasonal water table fluctuations. J. Hydrol. 2017, 548, 498–507. [Google Scholar] [CrossRef]
  6. Choudhury, B.J.; di Girolamo, N.E. A biophysical process-based estimate of global land surface evaporation using satellite and ancillary data I. Model description and comparison with observations. J. Hydrol. 1998, 205, 164–185. [Google Scholar] [CrossRef]
  7. Liu, Y.; Zhuang, Q.; Chen, M.; Pan, Z.; Tchebakova, N.; Sokolov, A.P.; Kicklighter, D.; Melillo, J.; Sirin, A.; Zhou, G.; et al. Response of evapotranspiration and water availability to changing climate and land cover on the Mongolian Plateau during the 21st century. Glob. Planet. Chang. 2013, 108, 85–99. [Google Scholar] [CrossRef]
  8. Bowen, I.S. The Ratio of Heat Losses by Conduction and by Evaporation from any Water Surface. Phys. Rev. 1926, 27, 779–787. [Google Scholar] [CrossRef] [Green Version]
  9. Swinbank, W.C. The measurement of vertical transfer of heat and water vapor by eddies in the lower atmosphere. J. Meteorol. 1951, 8, 135–145. [Google Scholar] [CrossRef] [Green Version]
  10. Penman, H.L. Natural evaporation from open water, bare soil and grass. Proc. Royal Soc. Ser. A 1948, 193, 120–145. [Google Scholar]
  11. Naledzani, N.; Lobina, G.; Abel, R. Modelling depth to groundwater level using SEBAL-based dry season potential evapotranspiration in the upper Molopo River Catchment, South Africa. Egypt. J. Remote Sens. Space Sci. 2017, 8, 3. [Google Scholar]
  12. Li, Z.-Y.; Liu, X.; Ma, T.; Kejia, D.; Zhou, Q.; Yao, B.; Niu, T. Retrieval of the surface evapotranspiration patterns in the alpine grassland–wetland ecosystem applying SEBAL model in the source region of the Yellow River, China. Ecol. Model. 2013, 270, 64–75. [Google Scholar] [CrossRef]
  13. Guo, B.; Li, W.; Guo, J.; Chen, C. Risk Assessment of Regional Irrigation Water Demand and Supply in an Arid Inland River Basin of Northwestern China. Sustainability 2015, 7, 12958–12973. [Google Scholar] [CrossRef] [Green Version]
  14. Chen, Y.N. Sustainable Utilization of Water Resources in the Bosten Lake Basin; Science Press: Beijing, China, 2013; pp. 88–89. [Google Scholar]
  15. Li, Z.; Chen, Y.; Fang, G.; Li, Y. Multivariate assessment and attribution of droughts in Central Asia. Sci. Rep. 2017, 7, 1316. [Google Scholar] [CrossRef] [PubMed]
  16. Bastiaanssen, W.G.M.; Noordman, E.; Pelgrum, H.; Davids, G.; Thoreson, B.P.; Allen, R.G. SEBAL model with remotely sensed data to improve water-resources man-agement under actual field conditions. J. Irrig. Drain. Eng. 2005, 131, 85–93. [Google Scholar] [CrossRef]
  17. Bastiaanssen, W. SEBAL-based sensible and latent heat fluxes in the irrigated Gediz Basin, Turkey. J. Hydrol. 2000, 229, 87–100. [Google Scholar] [CrossRef]
  18. Sun, Z.; Wei, B.; Su, W.; Shen, W.; Wang, C.; You, D.; Liu, Z. Evapotranspiration estimation based on the SEBAL model in the Nansi Lake Wetland of China. Math. Comput. Model. 2011, 54, 1086–1092. [Google Scholar] [CrossRef]
  19. Zhou, Y.; Li, X.; Yang, K.; Zhou, J. Assessing the impacts of an ecological water diversion project on water consumption through high-resolution estimations of actual evapotranspiration in the downstream regions of the Heihe River Basin, China. Agric. For. Meteorol. 2018, 249, 210–227. [Google Scholar] [CrossRef]
  20. Ma, Y.M.; Wang, Y.M. A Survey in the Study of Area Evaporation (Evapotranspiration) Over the Heterogeneous Landscape. Plateau Meteorol. 1997, 4, 111–117. [Google Scholar]
  21. Chen, Y.H.; Li, X.B.; Shi, P.J. Regional Evapotranspiration Estimation over Northwest China Using Remote Sensing. Acta Geogr. Sin. 2001, 6, 261–268. [Google Scholar]
  22. Li, S.; Zhao, W. Satellite-based actual evapotranspiration estimation in the middle reach of the Heihe River Basin using the SEBAL method. Hydrol. Process. 2010, 24, 3337–3344. [Google Scholar] [CrossRef]
  23. Li, B.F.; Chen, Y.N.; Li, W.H.; Cao, Z.C. Remote Sensing and the SEBAL Model for Estimating Evapotranspiration in the Tarim River. Acta Geogr. Sin. 2011, 66, 1230–1238. [Google Scholar]
  24. Du, J.; Zhang, B.; Song, K.S.; Wang, Z.M.; Zeng, L.H. Estimation of Evapotranspiration for Typical Ecosystems in the Bielahong River Basin Based on SEBAL. Res. Sci. 2009, 31, 1755–1763. [Google Scholar]
  25. Yang, X.L.; Reng, L.L.; Yang, F.; Yong, B.; Jiang, S.H. Study on Evapotranspiration in the Shalamulun River Basin Using SEBAL Model and MODIS Data. Arid Zone Ress. 2010, 27, 507–514. [Google Scholar]
  26. Monteith, J.L. Evaporation and Environment; The State and Movement of Water in Living Organisms, 19th Symposia of the Society for Experimental Biology; Cambridge University Press: London, UK, 1965; pp. 205–234. [Google Scholar]
  27. Roderick, M.L.; Hobbins, M.T.; Farquhar, G.D. Pan evaporation trends and the terrestrial water balance. II. Energy balance and interpretation. Geogr. Compass 2009, 3, 761–780. [Google Scholar] [CrossRef]
  28. Liu, Y.; Shu, H.; Li, Y.; Cai, X.B. Relationship between dynamic change of vegetation cover climate factors in Bayinbuluk grassland of the Tianshan Mountains. Adv. Climate Change Res. 2006, 2, 173–176. [Google Scholar]
  29. Li, X.L.; Yang, L.X.; Xu, X.F.; Tian, W.; He, C.S. Analysis of evapotranspiration pattern by SEBAL model during the growing season in the agro-pastoral ecotone in Northwest China. Acta Ecol. Sin. 2020, 40, 2175–2185. [Google Scholar]
  30. Wang, Y.; Chen, Y.N.; Li, Z. The spatial coupling of land use change and its environmental effects on Bosten Lake Basin, Xinjiang. Fresenius Environ. Bull. 2014, 23, 2627–2635. [Google Scholar]
  31. Chen, Y.N.; Li, Z.; Fan, Y.T.; Wang, H.J.; Fang, G.H. Research progress on the impact of climate change on water resources in the arid region of Northwest China. Acta Geogr. Sin. 2014, 69, 1295–1304. [Google Scholar]
  32. Yuan, X.; Bai, J. Future Projected Changes in Local Evapotranspiration Coupled with Temperature and Precipitation Variation. Sustainability 2018, 10, 3281. [Google Scholar] [CrossRef] [Green Version]
  33. Zhang, R.; Chen, T.; Chi, D. Global Sensitivity Analysis of the Standardized Precipitation Evapotranspiration Index at Different Time Scales in Jilin Province, China. Sustainability 2020, 12, 1713. [Google Scholar] [CrossRef] [Green Version]
  34. Wang, Y.; Gao, F.; Yang, J.; Zhao, J.; Wang, X.; Gao, G.; Zhang, R.; Jia, Z. Spatio-Temporal Variation in Dryland Wheat Yield in Northern Chinese Areas: Relationship with Precipitation, Temperature and Evapotranspiration. Sustainability 2018, 10, 4470. [Google Scholar] [CrossRef] [Green Version]
  35. Tian, L.; Jin, J.; Wu, P.; Niu, G.-Y. Assessment of the Effects of Climate Change on Evapotranspiration with an Improved Elasticity Method in a Nonhumid Area. Sustainability 2018, 10, 4589. [Google Scholar] [CrossRef] [Green Version]
Figure 1. Map of study area and meteorological stations.
Sustainability 12 07293 g001
Figure 2. Structural chart of surface energy algorithm for land (SEBAL) model.
Sustainability 12 07293 g002
Figure 3. Average daily evapotranspiration from March to October.
Sustainability 12 07293 g003
Figure 4. Spatial distribution of average evapotranspiration in the Bosten Lake Basin from March to October. (a) the spatial distribution of evapotranspiration in the Bosten Lake Basin on 22nd, Mar.; (b) the spatial distribution of evapotranspiration in the Bosten Lake Basin on 23rd, Apr.; (c) the spatial distribution of evapotranspiration in the Bosten Lake Basin on 25th, May.; (d) the spatial distribution of evapotranspiration in the Bosten Lake Basin on 18th, Jun.; (e) the spatial distribution of evapotranspiration in the Bosten Lake Basin on 4th, Jul.; (f) the spatial distribution of evapotranspiration in the Bosten Lake Basin on 28th, Aug.; (g) the spatial distribution of evapotranspiration in the Bosten Lake Basin on 14th Sept.; (h) the spatial distribution of evapotranspiration in the Bosten Lake Basin on 16th Oct.
Sustainability 12 07293 g004
Figure 5. Land uses in the Bosten Lake River Basin in 1990, 2000, and 2013; (a) the distribution of land use types in the Bosten Lake Basin in 1990; (b) the distribution of land use types in the Bosten Lake Basin in 2000; (c) the distribution of land use types in the Bosten Lake Basin in 2013.
Sustainability 12 07293 g005
Figure 6. The changes of total daily ET of different land use types in the Bosten Lake Basin.
Sustainability 12 07293 g006
Table 1. Detailed Information on MODIS Products.
Product NameSurface Characteristic ParameterTime ResolutionSpatial Resolution
MOD11A1Surface temperature, emissivity1d1000 m
MOD11A2Surface temperature, emissivity8d synthesis1000 m
MOD13A2NDVI16d synthesis1000 m
MOD43B3Surface albedo16d synthesis1000 m
Table 2. Detailed Information on geospatial data.
DataSPATIAL ResolutionOriginate
DEM data1:250,000geographic information data of China Meteorological Administration
Topographic data1:250,000geographic information data of China Meteorological Administration
Boundary data of study area1:250,000national basic geographic information data
Table 3. Remote sensing data information.
Imaging TimeSatelliteAvailable BandSpatial Resolution (m)Cloudiness
9 August 1990LANDSAT-5TM 1–7306%
4 August 2000LANDSAT-5TM 1–730Null
16 August 2013LANDSAT-8TM 1–9304%
Table 4. Land cover structure of the Bosten Lake Basin in 2013.
Land-Use TypesArea(km2)%Land-Use TypesArea(km2)%
Forest440.210.57Water1254.021.63
shrubland89.570.12Snow/ice191.760.25
H. grassland14671.3319.05R.&I. area414.810.54
M. grassland5220.796.78Unused land41868.154.37
L. grassland7832.6910.17Cultivated land5016.726.52
Table 5. The daily evapotranspiration (ET) of land-cover in the Bosten Lake Basin.
WaterForestShrublandGrasslandCultivated LandR.&I. AreaSnow/IceUnused Land
ET(mm/d)5.614.063.594.603.513.784.291.83
Table 6. The total daily ET of land-cover in the Bosten Lake Basin.
WaterForestShrublandGrasslandCultivated LandR.&I. AreaSnow/IceUnused Land
ET(mm/d)2.4 × 1042.25 × 1031.23 × 1031.43 × 1073.67 × 1051580.84447.181.26 × 107
Table 7. The results of precision test.
SiteLongitudeLatitudeSEBAL
(mm)
FAO P-M
(mm)
Relative Error(%)
Bayanbulak84.09°43.02°4.635.129.57
Kuche86.34°42.05°4.434.919.76
Tieganlike87.42°40.38°1.952.4319.75
Mean 13.03

