Article

FIViz: Forensics Investigation through Visualization for Malware in Internet of Things

1
Department of Computing and Information Systems, Sunway University, Subang Jaya 47500, Malaysia
2
Department of Computer Science, COMSATS University Islamabad, Islamabad 45000, Pakistan
3
Department of Computing, School of Electrical Engineering and Computer Science (SEECS), National University of Science and Technology (NUST), Islamabad 45000, Pakistan
4
Department of Physics, Shaheed Benazir Bhutto Women University Peshawar, Peshawar 25000, Pakistan
5
School of Computer Science and Engineering, Kyungpook National University, Daegu 41566, Korea
*
Author to whom correspondence should be addressed.
Sustainability 2020, 12(18), 7262; https://doi.org/10.3390/su12187262
Submission received: 30 June 2020 / Revised: 19 August 2020 / Accepted: 31 August 2020 / Published: 4 September 2020
(This article belongs to the Special Issue Urban Planning and Smart City Decision Management)

Abstract

:
Adoption of the Internet of Things for the realization of smart cities in various domains has been pushed by the advancements in Information Communication and Technology. Transportation, power delivery, environmental monitoring, and medical applications are among the front runners when it comes to leveraging the benefits of IoT for improving services through modern decision support systems. Though with the enormous usage of the Internet of Medical Things, security and privacy become intrinsic issues, thus adversaries can exploit these devices or information on these devices for malicious intents. These devices generate and log large and complex raw data which are used by decision support systems to provide better care to patients. Investigation of these enormous and complicated data from a victim’s device is a daunting and time-consuming task for an investigator. Different feature-based frameworks have been proposed to resolve this problem to detect early and effectively the access logs to better assess the event. But the problem with the existing approaches is that it forces the investigator to manually comb through collected data which can contain a huge amount of irrelevant data. These data are provided normally in textual form to the investigators which are too time-consuming for the investigations even if they can utilize machine learning or natural language processing techniques. In this paper, we proposed a visualization-based approach to tackle the problem of investigating large and complex raw data sets from the Internet of Medical Things. Our contribution in this work is twofold. Firstly, we create a data set through a dynamic behavioral analysis of 400 malware samples. Secondly, the resultant and reduced data set were then visualized most feasibly. This is to investigate an incident easily. The experimental results show that an investigator can investigate large amounts of data in an easy and time-efficient manner through the effective use of visualization techniques.

1. Introduction

The Internet of Things (IoT) helps form a sustainable ecosystem for realizing the smart cities vision. With the help of sensors and connected devices, most often ubiquitous, IoT offers seamless capabilities in continuous monitoring of various environments [1]. Healthcare is one of the domains where a huge increase in IoT has been witnessed. From remote patient monitoring to timely delivery of healthcare services Internet of Medical Things (IoMT) has occupied a large chunk of the IoT ecosystem [2]. Driven by the capabilities of Artificial Intelligence, IoMT can leverage the full potential of high-performance computing to provide better assessment through decision support systems [3]. Wireless Sensor Networks, mobile devices, wearable computing nodes, and Big Data enabled future internet architectures to provide IoMT the rapid enhancements for efficiency in seamless patient monitoring, early disease diagnosis, and effective treatment [4].
With the increase in the number of internet-connected medical devices, a corresponding spike has been observed in cyber-attacks (theft of critical information, theft of identities, credit cards, etc.) regardless of security measures in place. An alarming increase has been observed especially in IoMT infrastructures due to the sensitive nature of sensitive healthcare patient data [5]. Attackers use novel yet sophisticated methods and techniques to carry out their malicious intentions which often result in financial harm to the service. Attacks may be in the form of malware or others but usually they manipulate system services and resources to achieve their intended goals [6]. The attack scenario is shown in Figure 1.
For investigators, these manipulated services provide useful forensic evidence to analyze the whole incident. This fact emphasizes the need for various digital forensics tools, methods, and techniques to investigate such destructive cyber attacks and their whole kill chain. Kill chain is a complete set of attack steps to achieve their goal [8]. These methods and techniques help in making threat intelligence, intrusion detection systems (IDS), and other security applications to cope with such cyber attacks. Digital forensics is the branch of forensic sciences that deals with the investigation and recovery of evidence from digital devices victimized in criminal activities. Forensics investigation is always carried out in four main steps, i.e., collection, examination, analysis, and reporting [9], as shown in Figure 2.
It is becoming too difficult for an investigator to gather evidence from these devices because of the large volume of variable and complex data that need to be analyzed. Different researchers, scholars, and scientists are seeking solutions to handle this enormous data and extract meaningful information from it. They proposed different digital forensics frameworks [10,11], machine learning techniques [12], artificial intelligence [13], and visualization [14,15], etc., to better detect and investigate such attacks (malware) and to present them in a court of law. This kind of technique is also important to feed already existing mechanisms and security applications.
As it is said quotes, a picture is worth a thousand words. Visualization plays an important role in the easy and effective identification of crucial information regarding security, forensics (incident response), big data, business productivity and human perception [16]. Visualization allows non-technical personnel i.e., police, and lawmakers etc. to grasp the severity of an attack without having the required technical expertise [17].
According to Lowman et. al [18] and Nordbø et. al [19], the investigators should make sense of large volumes of data and find what they are looking for, and then visualize the resultant data timely. The existing work are lack of considering feature and information i.e., Dynamic-Link Library (DLL), handles, session ID etc., that are useful to reveal certain kind of attacks which are, ransoms, root kits, spy-wares and remote access tools (RATs). These attacks stimulates/exploits specific files of windows i.e., DLL, handles, session ID etc., to accomplish their work. Considering such scenarios we propose and create data set of 400 malwares/ransomes/spywares belong to different families. Then visualize the data set (specific artifacts/features/informations) that reveals the kind of attack or give an insight to the investigator [20].
In this paper, we propose to build the data set with ample information which can be well perceive and understand. The visualization of such data set, make it easy to distinguish between normal and abnormal activity of a malware, instead of traditional inadequate data sets [21]. The advance and latest malware samples (e.g., fund transfer, Korplug, CTB locker, etc.) are executed in clean virtual environment to create the data set. The samples are gathered from the Threat intelligence based honey pots placed by the honeypots we placed in the Application Security Research Lab at COMSATS University Islamabad Campus. Different forensics tools i.e., Log2timeline, sysinternal and cuckoo etc., are used to capture and logged the malware activities. The useful features are extracted and considered for the visualization (e.g., DLL manipulation is considered as a useful artifact for separating benign and malicious processes).
Distinct steps are performed in our proposed framework. Controlled clean virtual environment is created using open source virtualization tool, Virtual Box [7], dynamic behavioral analysis activities are monitored where we have considered the usage of dynamically linked libraries (DLL) as the identification mechanism. Finally, the details captured into the dataset are logged through forensic tools such as Cuckoo for sandboxing, Python Pandas for data cleaning and IDA Pro for analysis of DLL manipulation. After logging raw data are retrieved. Features extraction and selection are performed. weights and labels are also assigned to create concise data set. In the end, the resultant concise data are visualized in away that investigator can easily analyze different processes to distinguish benign and malicious ones [22].
The rest of the paper is sorted as follows: Section 2 Literature Review presents the state of the art in forensic visualization. Next we proposed the fiviz framework in Section 3, which is presented in Proposed Framework and Working, Section 4. Similarly, next Section 4.2 explains and discusses the implementation and results. Then, Section 5 Experimental Analysis presents validation of our experimental results in Results and Discussion section and lastly, Section 6, Conclusion concludes the paper.

2. Literature Review

Silpa et al. [23] and Akbal et al. [24] explain different potential locations to investigate evidences of a user’s activity on the web. The web browser is used for many activities, such as emails, searches, online banking, blogging and social interaction, etc. They discussed how, where and what type of information web browsers log that could help the investigators to investigate browser-related malicious activities. They used digital forensics tools to retrieve useful information from the specified locations.
Fletcher [25] performed analysis of time-line data through a network analyzer tool called Wireshark. The time-line was created through a forensics investigation tool called Log2timeline which extracts time stamps from different sources. This time-line was then converted to Wireshark supported format packet capture (Pcap). This particular time-line was then analyzed with the built-in features of Wireshark, i.e., analysis profile, filtering, colorization, marking and annotation. Time stamp values, i.e., modification, accessed, creation, birth (MACB) were considered from the time-line for analyzing an activity.
Shafqat et al. [23], investigate activities on a very popular browser Google Chrome, in three different modes i.e., regular mode, private mode and portable mode. Chrome logs rich information about user activity on the web. Tools were used to retrieve different kinds of activities such as websites visited, visit count, visit time, bookmarks, searched words and downloads etc. Berggren [26] presents a self-developed forensics analysis tool called Time Sketch. Time Sketch is a collaborative tool with GUI. It adds meaning to raw data with rich annotations, comments, tags, and stars.
Khatik et al. [27] proposed a Server Timeline Tool for analyzing web servers on the basis of log files visualization for forensics analysis. The proposed algorithm named “forensic digger algorithm” takes log files of a web server and analyzes it in seven steps, as follows:
  • Analyze the date and day based on the occurrence of an activity
  • Integrate log files as per need.
  • Identify the desired parameters for the analysis that assist in the collection of evidence for a malicious activity.
  • Search for frequent users activity in integrated log files with their IP addresses, file access, bytes transferred.
  • For the confirmation of maliciousness, analyze the behavior of their activity and IP address etc.
  • Reconstruct the whole event timeline hypothesis by analyzing log files and evidence.
  • Generate report.
Nordbø et al. [19], explain why visualizations are effective and important in digital forensics. They discuss different methods and techniques, used for visualizing large volumes of data. It also reported some challenges regarding forensics visualization. Hargreaves et al. [10], proposed a framework for low-level event extraction. These low-level events and some regular expression, which authors called test events are used to generate high-level events. On matching of one or multiple low-level events with these test events Python, digital forensics tool (PyDFT) creates high-level events, which are then used for investigation purposes. Kalber et al. [28], propose a novel approach which automatically reconstructs events that previously occurred on the system. These events provide initial information for further investigation. The main idea is to extract timestamps and the paths of different sources and then cluster them. These events are labeled on the basis of applications used and MACB values of files. Visualization of events is applied to support investigators. Inglot et al. [29], propose an improved version of a timeline analysis tool, Zeitline. These improvements are to be made in existing features such as filtering, searching, visualization (GUI), grouping. They also added some new features like plugins, reporting, improved designing, and interactivity. Esposito [30], in his research, developed reusable queries. His research objective is divided into two parts.
  • Chronological artifacts collection.
  • Timeline artifacts analysis.
Super timeline creation was carried out through existing tool, log2timeline. Then this super timeline was imported into Microsoft Access Database. Here, reusable queries were developed in Structured Query Language (SQL) language to make a concise listing from that log2timeline data set. These queries were used to narrow down large data sets from thousands of records to hundreds. Searches were carried out for user program activities, user web history and recent document accessed.The main purpose of this approach was to shorten investigation time.
Osborne et al. [31] discussed the development process and complexities of forensic software for information visualization. This work is mainly split into three main phases.
  • Exploratory phase
  • Investigative phase
  • Correlation phase
Edwards [32], in his work proposes an approach for data reduction and summarization. Data collection through log2timeline provides a large amount of data to an investigator for investigation. Analysis of big data is a time consuming and complex issue for digital forensics investigators. To reduce and manage such large data sets, the author used Tapestry. It provides many features like filtering, grouping and searching through these large data sets on the basis of specific attributes. It has a GUI which facilitates investigators with some visualization.
Schrenk et al. [33], review some state of the art data visualization tools for manipulation of frequency, timelines, emails and logged data. The effectiveness of visualization in digital forensics and Comparison between these visualization techniques were also studied.
Gudjonsson [34] proposed and developed a Log2timeline named framework, which took traditional timeline to the super timeline analysis. Log2timeline parses different log files and artifacts deeper in an automatic fashion and produce a super timeline to assist investigators in their timeline analysis.
Olsson et al. [35] create a novel prototype of a tool named Cyber Forensics TimeLab (CFTL). This tool could index evidence by their time variables and produce a timeline. This timeline is then visualized to find coherent evidence faster and with accuracy.
Zeitline is a cross-platform forensics timeline editor by Florian Buchholz et al. [36], for digital investigation. It has a GUI to generate and locate specific events from arbitrary data sources. Its visualization also provides the ability for filtering, search and group together events recursively. 4n6time no ported to Log2Timeline [26], is an excellent visualizing tool by David Nides for searching and sorting of a super timeline. It does a great job of filtering and shows results(frequency) in different bar graphs.
Xie et al. [37] authors proposed monitoring of the execution states of DLLs. This work just focused on certain parameters rather than complete DLL file contents. In this way, it is useful to detect malware in a light and more feasible way. They have carried out their methodology step-wise. Firstly, they collect data through memory introspection of a clean virtual machine from hypervisor level, outside of the virtual environment. Secondly, they analyzed the benign behavior of the applications and extracted information to use it in detection phase. And lastly, in the online detection phase, they compare these execution states to detect DLL’s malicious manipulation.
Ahmadi et al. [38] propose a novel approach for the classification of a large malware data set from Microsoft to their actual family groups. They proposed a learning-based system that would classify malware to their actual family by their different characteristics. This technique was carried out on obfuscated and unpacked malware to extract content and structural based features and achieved 99.77% accuracy.
Veeramani et al. [39] propose automated malware detection framework based on relevant API calls. Samples were deobfuscated through famous disassembler called IDA Pro to extract API calls. These API calls were stored in MySQL database and another technique known as Document Class-Wise Frequency Feature Selection (DCFS) was applied to get relevant API calls. SVM classifier was trained on this data set and achieved the average result of 95%.
Mosli et al. [40] discuss various features selection and their importance in classification. Mosli et al. selected three features i.e., registry activity, imported DLL and called API functions. Different tools were used to extract and select features. In the end, they trained different machine learning models on all three features to classify files. The Support Vector Machine (SVM) model achieved the highest accuracy rate of 96% on registry activity data. Case et al. [41] develop a novel approach to detect objective-c malware. They deeply analyze objective-c language which provides a wide range of facilities to users that are misused by malware developers to carry out their malicious intents. Plugins were also created to detect popular activities i.e., keystroke logging, swizzling and named ports.
Somarriba et al. [14] propose a framework for monitoring of Android applications to detect malicious activities at runtime. They monitor traces related to function calls and visualize them through a tree structure called a dendrogram. A dendrogram shows relationship from root to parent and then to child nodes. When applications are executed, they call a different set of APIs, so in this paper, they monitor this function calling and hooking of functions through this framework. They first logged these calls in a database, applied some rules and visualized these calls from root application execution to their last activity of function calls.
Fraud et al. [42] present API call patterns to detect malware. They log and collect relevant API calls data of executables through a tool called WINAPIOverride32. This tool monitor API calls and internal called functions. Selected features are based on the iterative pattern in these APIs. These iterative patterns are discriminative feature between benign and malicious processes. They applied classifiers on these features to classify normal and malicious processes.
Grégio et al. [17], display malware dynamic behavior in a simple way through activity graph to identify and classify malicious files. They monitored high level system and other activities i.e., system calls through slight modified version of behEMOT. Cluster graph which have vertices and edges were showed with respect to labels from different antiviruses. These clusters have same malware binaries from similar families. Monitored high level time series activities were visualized through activity graph where x-axis is labeled as time and y-axis is as different activities. They also distinguish these samples on basis of different system calls called during execution, which is not that successful. Trinius et al. [43], present behavior based malware analysis through visualization graphs. System level activity reports from CWsandbox were analyzed. Abstraction level technique is applied to these reports to transform it into more condense form.
  • Level 1: Display individual activity in sections i.e., accessed registry of a process to get overview of what a process is doing.
  • Level 2: Extends level 1 and shows related API calls names executed in each section.
  • Level 3: Extends level 2 and add most significant argument of each API call.
  • Level 4: This level considering even more argument for each API call.
Two types of visualization techniques were created i.e., tree maps and thread graph Tree maps present summarized overview of activities with their frequency while thread graph shows behavior of the individual thread of a process.

Critical Analysis of Existing Work

Table 1 shows that we have critically analyzed existing approaches considering methodology, the data set used, data set features, features and limitations. Lots of researchers have concluded that visualization is very effective in analyzing a large volume of data. Data visualization is important to find relevant information. After a critical analysis of existing approaches about malware analysis and forensics techniques, we concluded that there is space for some well-defined data set, according to that we could create a more effective visualization that could reveal a better picture of benign and malicious activities.

3. Proposed Framework and Working

After reviewing many existing works on malware investigation, visualization, and computer forensics, we concluded that there is a lack of more interactive, informative visualizations and creation of data set regarding forensic investigation. This work focuses on malware data set creation and effective visualization which is explained step-wise in Figure 3. We used different tools and methods at different stages of our proposed methodology.

3.1. System Assumptions and Design Goal

First, we assume that an attacker has installed a malware on the system being investigated, which could access any resource and has full privileges to carry out their malicious intents. Secondly, this malware is unaware about monitoring or logging of their activities. We also assume that attacker has full access to the internet that if he wants to download another malware from the internet or wanted to communicate to an external server or command and control (c & c), etc.
The design goal is to separate normal and abnormal (malicious) activities based on some features, i.e., imported libraries (DLLs). By running every individual malware in a clean virtual environment with full privileges, monitored its activity through different forensics tools and data is collected. These tools collect base level activities and interaction with the operating system (file system activity, registry activities and threads etc.), hard wares, soft wares and online internet communications.

3.2. Phase 1: Data Collection

3.2.1. Malware Samples Collection

There are many online sources to get malware samples but to analyze and study modern and most recent samples, these were collected from T-Eye honeypots installed in cyber security lab COMSATS. Collected samples belonged to different families and from the same family with different characteristics.

3.2.2. Controlled Virtual Environment Creation

Executing these samples on a real system is dangerous and not feasible. It is necessary to provide the simulated system with all facilities in place like internet access, administrator privileges etc. so to execute and log dynamic behaviors virtual environment was created through VMware. Windows 7 was installed with other components in place like internet connection, software to execute malware with different kind of extensions, and disabled default Windows security techniques such firewall, Windows Defender etc.

3.2.3. Monitoring and Logging Activity

To monitor and log malware activity, we executed each and every malware and logged their dynamic activity through different forensics tools which is described below. To get a clean environment each and every time, we took snapshots of a clean environment and then execute malware and then reversed it back to its original state and repeated it each time.
To log and monitor their runtime interaction with the operating system and system resources, Microsoft Sysinternal tools were used that log different kind of activities such as registry, filesystem, process, DLLs and threads etc.

Process Explorer

This tool in Figure 4 from Microsoft Sysinternals toolkit lines up all running processes and handles and which DLLs are opened and accessed by these processes. It has the fast searching capability to show which processes are active with handles and DLLs opened [44].

Process Monitor

Process monitor is an advanced monitoring and logging tool which combines capabilities from two legacy tools known as Filemon and Regmon. It shows real-time file system, registry and threads stacks etc. it has many powerful features like rich and non-destructive filtering, comprehensive event properties such as session ID’s and user names, reliable processes information, simultaneous logging to a file and much more. It is the best and easily usable tool for troubleshooting and malware hunting [44].

Portable Executable Explorer (PE Explorer)

PE Explorer is a good tool for static analysis. It shows inner structure and data of a file or software. It is a kind of disassembler which shows file headers and other instructions needed to run that file such as, DLL, API, and other program accesses [44].

TCP View

It lists all TCP and UDP connections including local and remote addresses and the state of TCP connections. On starting, it enumerates all active TCP and UDP endpoints on a system, resolving all IP addresses to their domain name versions [44].

Wireshark

Wireshark is a widely used network protocol analyzer. It allows users to analyze network traffic and protocols at the microscopic levels. It is a de facto and de jure standard among industry and academia [45].

3.3. Cuckoo Sandbox

Cuckoo sandbox is an open source automatic malware analysis system. It executes malware in a controlled environment and provides detailed information regarding that malware. This is beneficial for threat intelligence to cope with future threats and attacks because it allows analysts to understand the context, motivation and the goals of a breach [46].
In the end, a large amount of raw data was collected from these three sources with almost 400 malware samples from different families and 100 benign samples which were cleaned using a thorough process as defined in Figure 5. We wrote our code in Python and used the following libraries:
  • To manipulate the data we used Pandas.
  • Numpy was used to create the data array.
  • For splitting data into training and test set Skicit-learn was used.
  • We needed to separate year, month and date, for this purpose Datetime library was used.
  • Matplotlib to plot the results.
  • Seaborn library to find and remove the missing values
With the help of this chronologically ordered data, we came up with high-level execution states/activities such as process/thread activities, network connections, file system (opened, accessed, modified and created) and registry activities.

3.4. Phase 2: Features Extraction and Selection

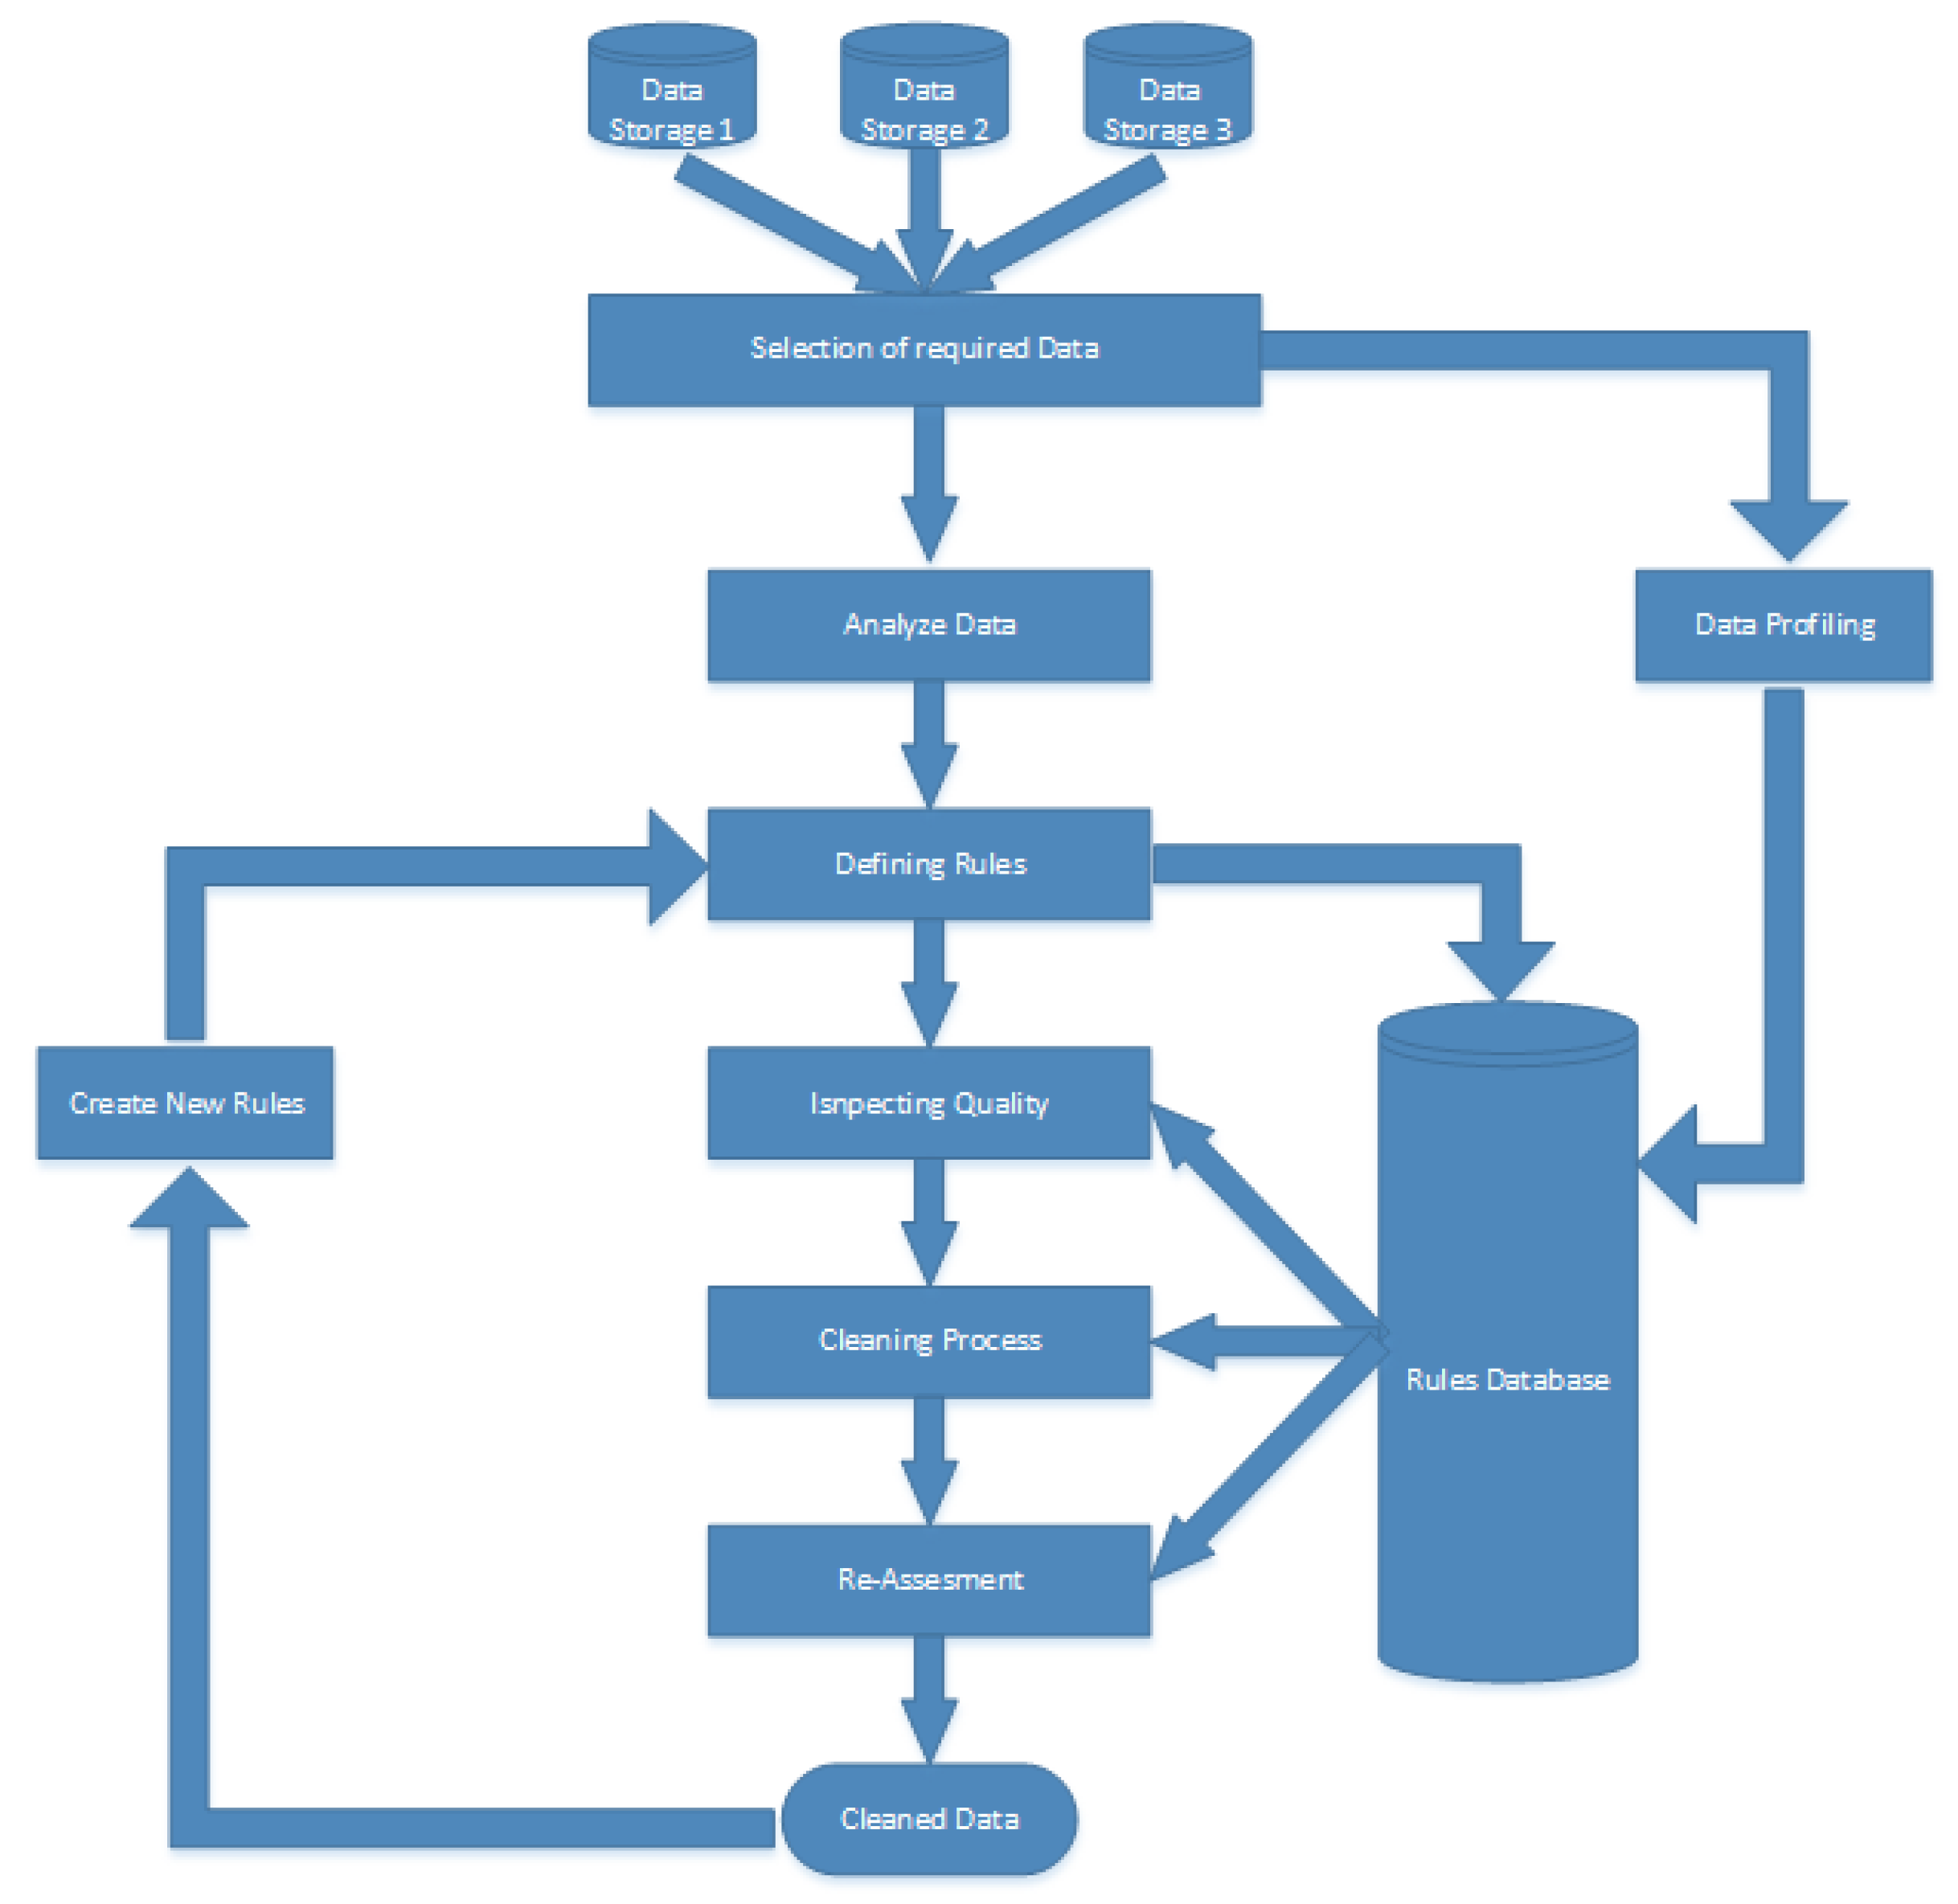
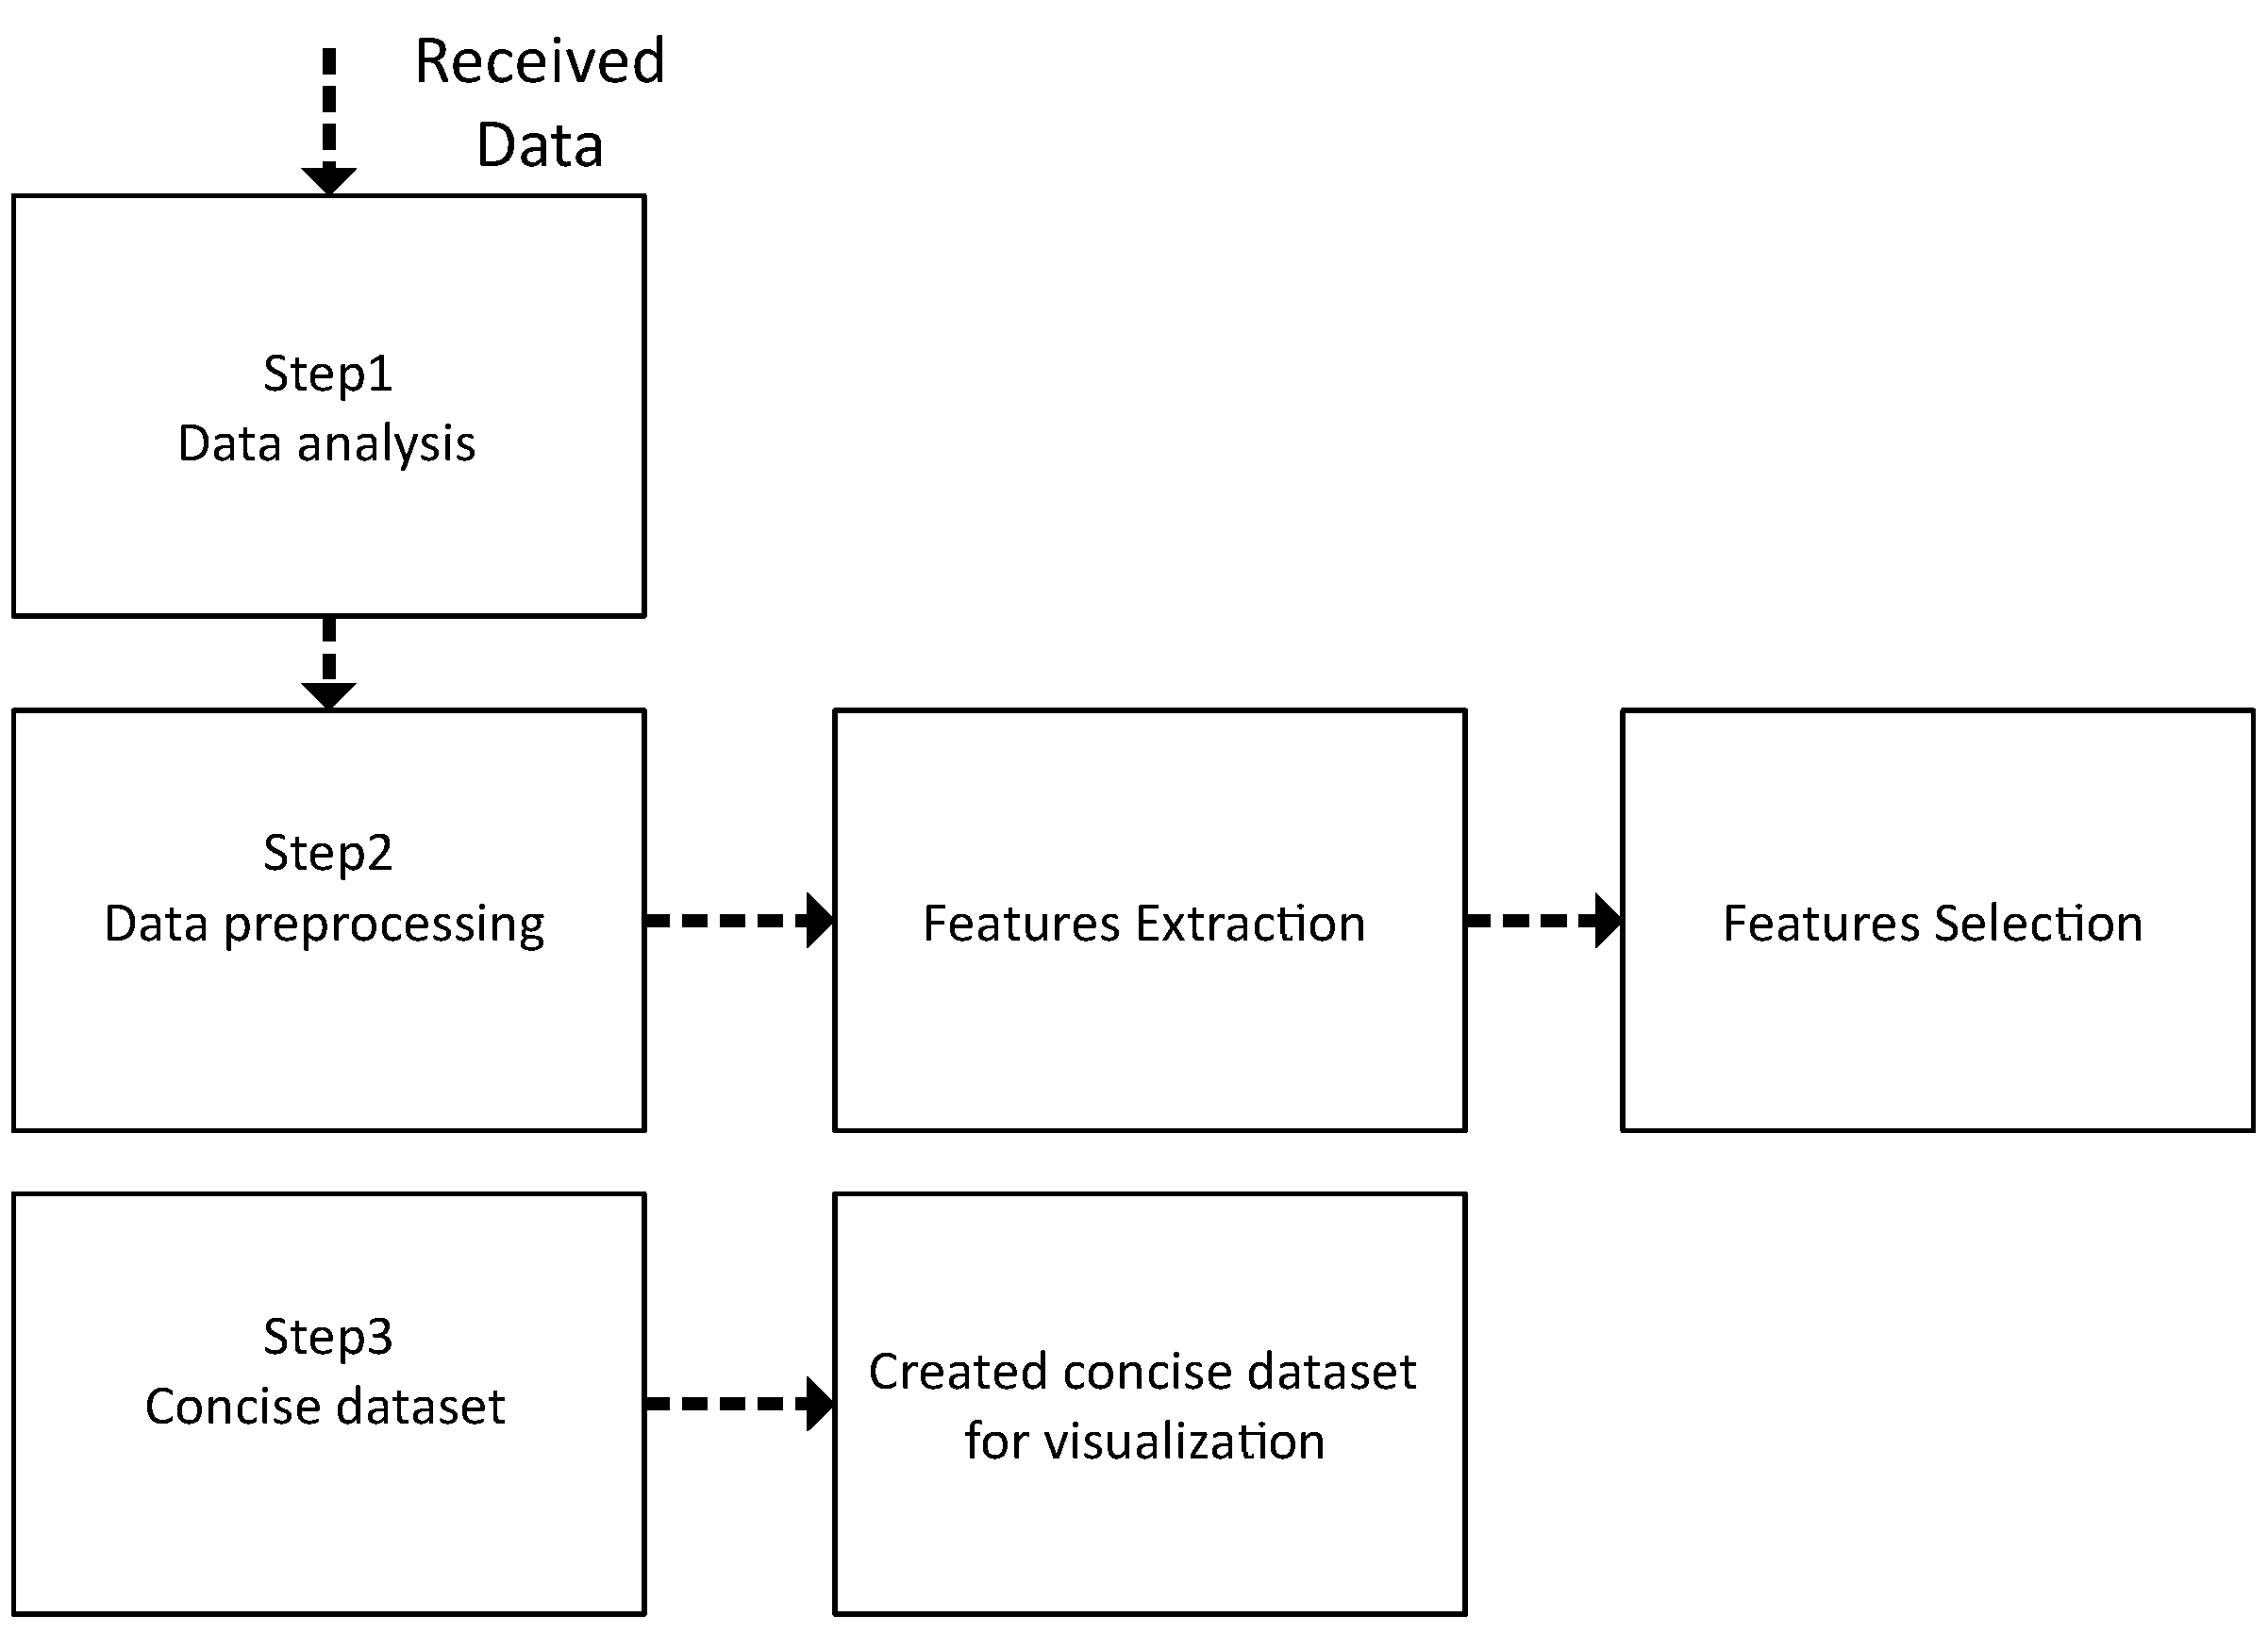
3.4.1. Data Analysis

Data Analysis Goals

Malwares make up around 70% [47], of cyber-attacks today and if a security analyst needs to investigate an incident, there is a high probability that they will need to perform malware analysis.

3.4.2. Types of Malware Analysis

Static Analysis

Basically static analysis [38,48] constitutes analyzing files, executables etc., without actually executing them. It is usually performed through bisecting and disassembling files through different tools such as IDA Pro [49], etc. It is analyzing file internal structure, header, dependencies, strings, and instructions, etc.

Dynamic Analysis

This method involves the actual execution of files to observe their real-time activities. Files are executed in a virtual environment to monitor their behavior and how they interact with the operating system and other resource and services. It is normally carried out on clean virtual machine providing all resource and services to interact with and log their activities with tools like Sysinternals (process explorer, process monitor, process hacker, tcp view etc.), in real time [48].
Dynamic data analysis is a complex task but it yields fruitful results. Analyzing around 400 samples dynamically is very complex and time-consuming job. Each and every file is executed in a clean virtual environment and logged their behaviors with above-mentioned methods and tools. Then the malware activity is analyzed for further process.

3.4.3. Features Extraction and Selection

The malware analysis provides detailed information about malware behavior, yet raw reports are not suitable for data classification [50]. Raw data is collected through above different forensics tools given in Figure 6. Our raw data contains artifacts of registry files, file system activities, paths, network connections, processes and threads, DLLs, and time-stamps etc.
The features are critically extracted, selected and analyzed to better classify normal and abnormal files or activities. The features is related to maliciousness or malware behavior that occurs during their different activities [38] So before applying effective visualization, we sorted and transformed our data into the more meaningful form. Labels and weights were assigned to the data to differentiate between benign and malicious activities. Furthermore, the assigned labels and weights are cross-validated from reputed third party sources [40].
Scripts were written to automatically categorize the data for further processing. Data is categorized into six different attributes which contains time, path, operation, result, weight, and classifier.

DLL (Dynamic-Link Library)
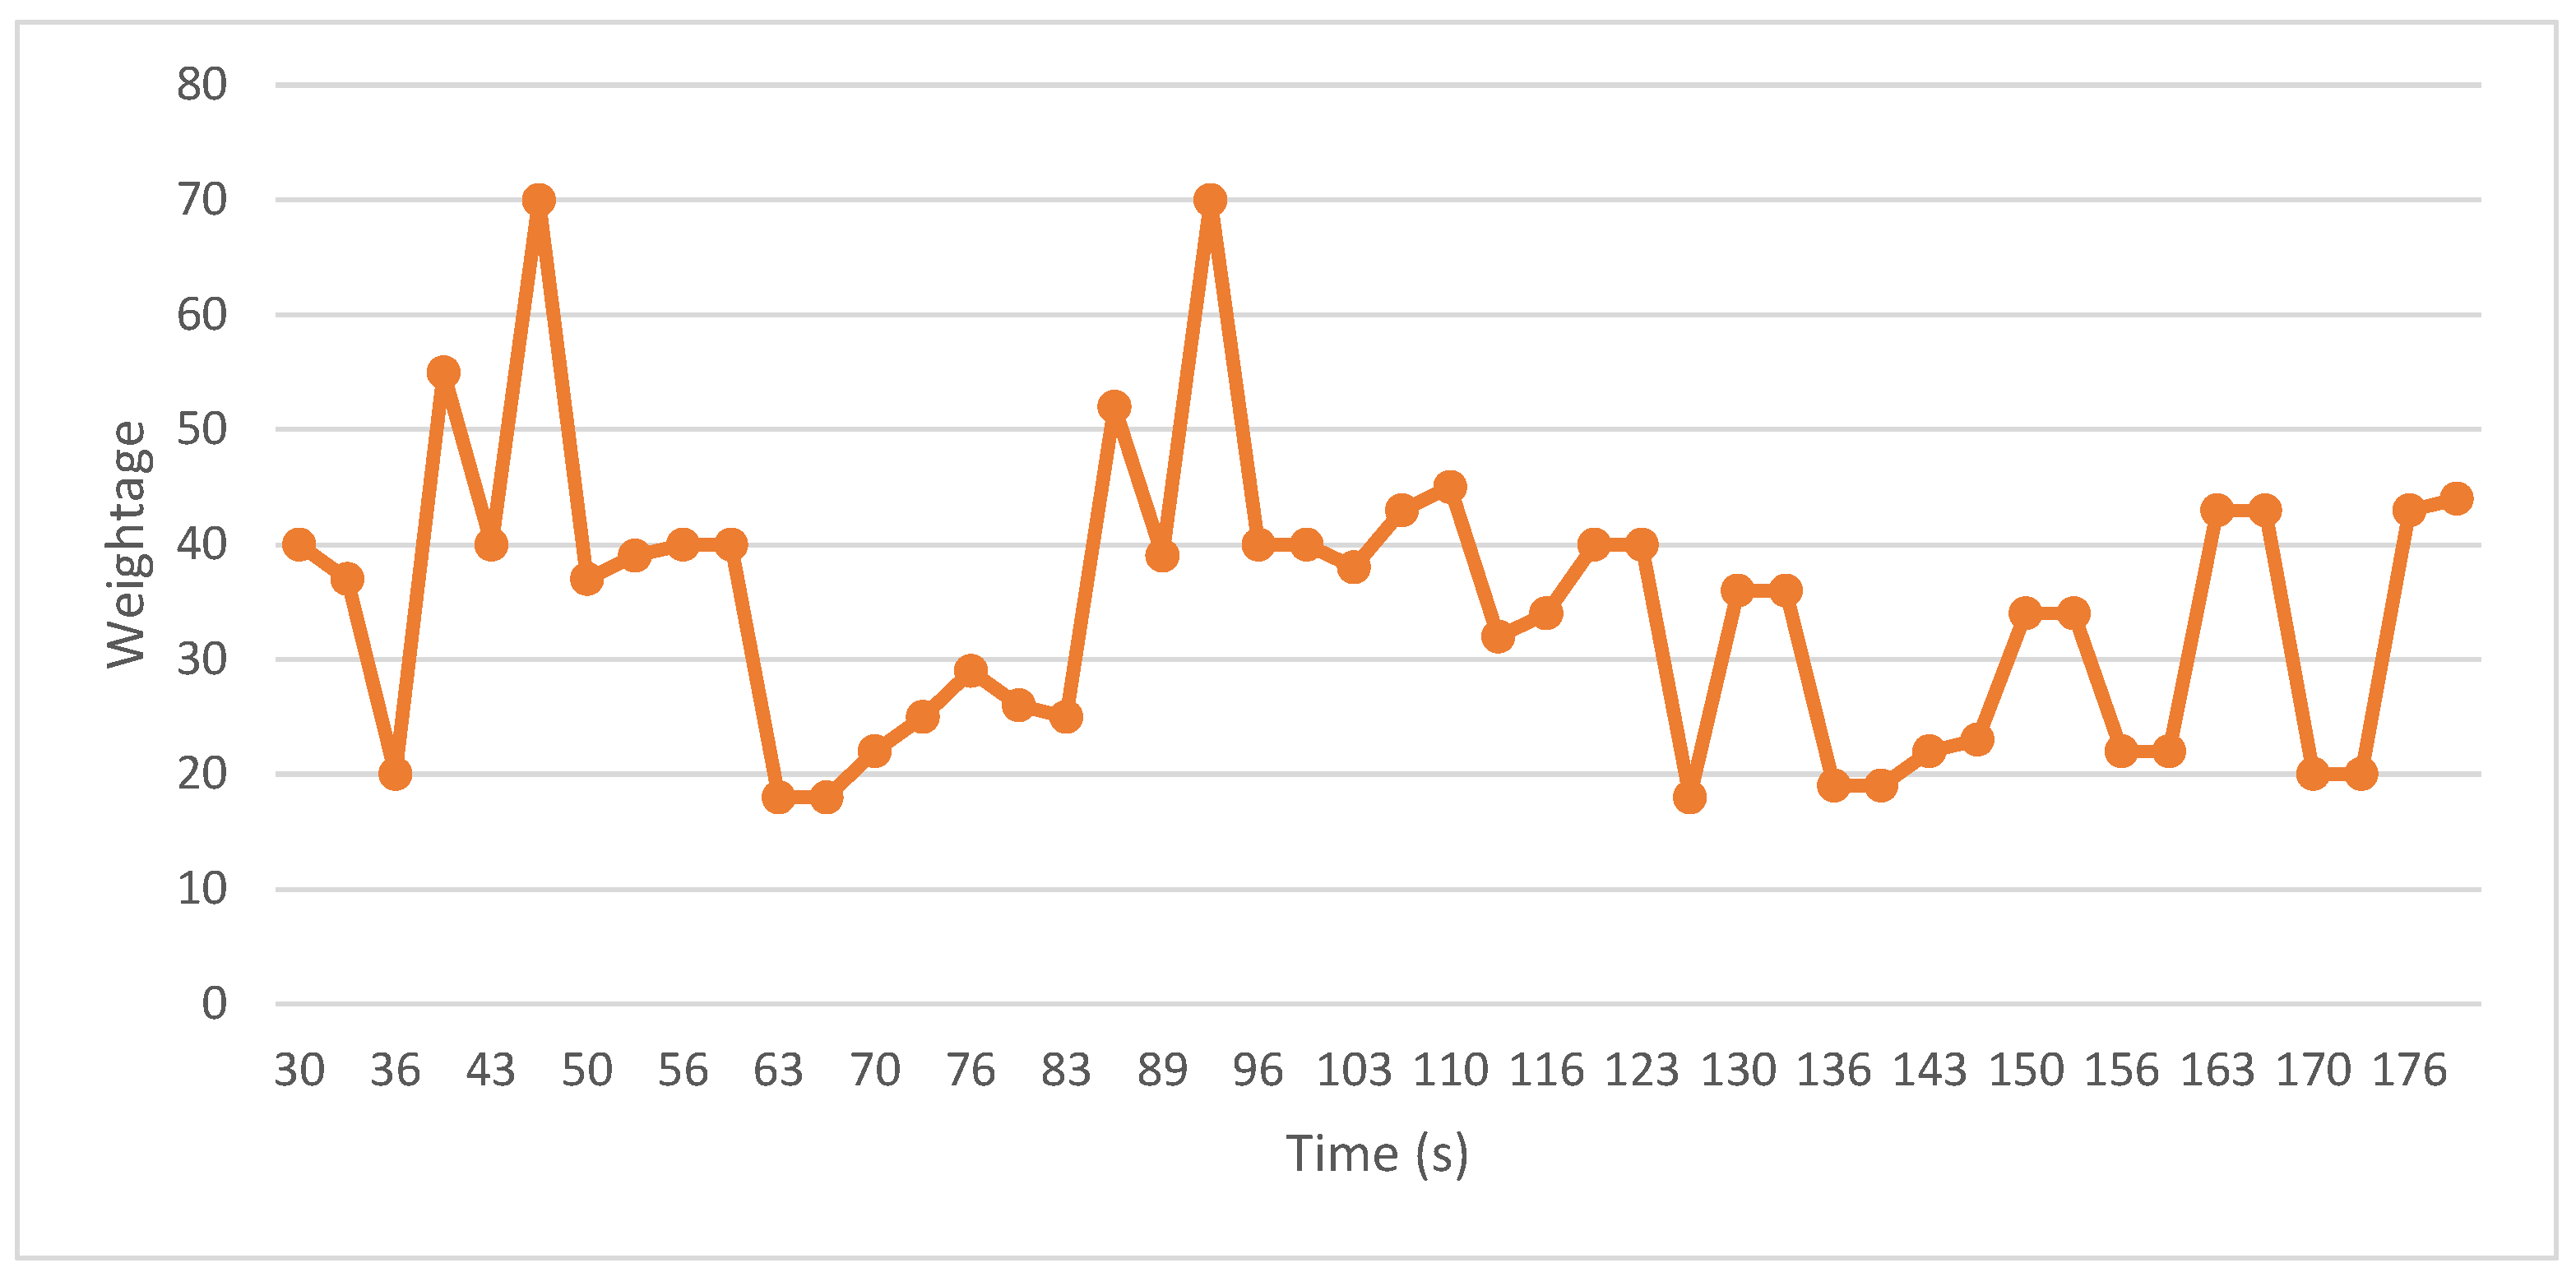
Dynamic-Link Libraries are shared libraries in Microsoft operating systems. They consist of code, data, and resources and are similar to EXE files with a different extension. It is used to carry out almost all kind of jobs in the computer system and different processes access it simultaneously according to their need. Different DLLs are for different purposes and are used at different times i.e., kernel32. DLL is involved in memory management and is loaded into a protected memory space normally at Windows start up [51].

Time-Stamp

Time-stamp means the exact time of event occurrence and it retrieved and stored in different formats. Chronological data are very important to reconstruct or find related artifacts of an incident.

Weight-Age

Weight-age is a security rate which is assigned on the basis of analyzing approximately 400 malware samples and hundred benign files. These were also validated by a reputed third party. Weights play an important role in distinguishing normal and abnormal behavior [47].

3.5. Phase 2: Data Set Creation

Data set creation is our first contribution, the most complex and time-consuming task. Data collection is performed at run-time through forensic tools. We used DLLs as a artifact for separating malicious and benign processes.Term Frequency (TF) and Term Frequency-Inverse Document Frequency (TF-IDF) are used to extract and select features. Removes irrelevant data, weights and labels were assigned to the data, which is the requirement of the data set.
Data set creation steps are describe briefly as follows: After receiving data from forensics tools in raw form, data analysis was performed firstly.

3.5.1. Data Analysis

When we executed each and every malware sample, their dynamic activities were logged through forensics tools which produces large volume of sophisticated raw data. To make it useful and informative, we deeply analyzed that large amount of data.

3.5.2. Feature Extraction

After collection of data, it contains different kind of artifacts i.e., DLLs, registry, file system, networking and process thread etc. Our model mainly based on manipulation of DLLs to distinguish between benign and malicious processes. Before going to visualize our data, we need to preprocess it because it contains large amount of irrelevant data. So we first need to transform our data and extract features. To do so, we used Term Frequency (TF) approach, which calculate occurrence of term in a document. This occurrence of terms are considered as a feature and feature is obtain for the DLL.

3.5.3. Feature Selection

In this section, irrelevant data were removed. Features that provide more information and features with less were discarded. Terms that occurred more frequent in each document provided less information and it was better to remove them. This process is carried out through Term Frequency-Inverse Document Frequency (TF-IDF). Inverse Document Frequency (IDF) for term t was calculated as follows:
i d f t = log N i d f t
where in the above formula, df t is the number of samples contains term t and N is the total number of samples. Weights were calculated by multiplying TF with IDF calculated values. These updated weights were then assigned to each DLLs. After assigning weights to these DLLs, all the selected DLLs were tagged as normal and abnormal. Conclusive median was calculated to separate normal and abnormal DLLs, which had a value of 50. Above 50 weight was considered abnormal and below was normal.

3.5.4. Concise Data Set

Scripts are created to transform above data into concise data set. After extracting and selecting features, it needs to be transform into proper format. This resultant data set was formatted properly for visualization.

3.5.5. Data Preprocessing

In this step, we removed irrelevant data, sorted data and gave it some proper shape to process it further. The simple but yet effective formula was deduced to add missing data i.e., weights and labels etc., and performed sampling for implementing our proposed scheme. Formula:
  • DLL that is present only in malicious file, then assign weight is equal and above 50.
  • DLL that is present only in benign file, then assign weight below fifty (50).
  • If DLL is present in both malicious and benign, then check count and if count is greater than 10, assign weight according to formula which is greater or equal to 50 but if this count is less than 10, assign weight less than 50.
W C ( D L L )
Consider W = weightage and C = counts;
W = k ( C ) where , k = 1 10
If no. of counts ≥ 10, then value of k ≥ 0.5 and, If no. of counts < 10, then value of k < 0.5.

3.5.6. Data Transformation

The important attributes were converted into meaningful sorting and data labeling was performed. Figure 7, depicts the step-wise creation of data set, from the environment setup to resultant concise data set creation.
Table 2 shows comparison of our data set with existing approaches. Different features were compared like date-time, labeling, weights, DLL’s, and applications etc. Our data set was better than other existing approaches in terms of taking less time to distinguish malicious and normal processes.

3.6. Phase 3: Visualization Creation

Visualization of the resultant data was the last component of our framework. To better visual textual data graph selection was the most important aspect. Graph selection depends on dimensions of data, data types and what kind of data you actually want to visualize. The timeline graph from D3.js (Data-Driven Documents) a popular JavaScript library available on (https://d3js.org/) is exploited for some of the visualization. D3 is an interactive and a browser based data visualizations library to create simple line chart to more complex info graphics. In this case, it stored and deployed graph oriented data on a time wise line chart. This chart consisted of time in seconds on the x-axis and weights on the y-axis. Other dimensions of data were presented on the tool-tip and median was calculated to discriminate two kind of labeled data, i.e., normal and abnormal DLLs.
The charts show the process behavior simple yet in an illustrative manner. The graphs are build according to the schema shown in Figure 8. The central name shows unique process name and line proceeds with weights and time of each DLL manipulated. Normally above the median shows malicious space with an abnormal label and below shows benign with a normal label. The tooltip presents the DLL name, their operation, results and assigned label. Spikes also shows DLL severity with the assigned weight.

4. Experimental Analysis

4.1. Experimental Setup

For the proof of concept of our proposed methodology, we have acquired malware samples belonging to a different malware family. The malware collection process was carried out through threat intelligence platform T-Eye which is a prominent program by Applied Security Engineering and Research Group COMSATS University and Trillium information security systems [52]. A total of 400 malware and 100 benign including executables were executed in a clean virtualized environment to create data sets [53]. The environment was mainly created in Virtual Box, every executed file (malware) activity being monitored and logged through forensic tools which included Microsoft sysinternal tools, Cuckoo, and Log2timeline. Feature selection and data categorization are the most daunting task which was done by analyzing every single malware sample.

4.2. Normal vs Abnormal Activity Visualization

The benign and malicious executable programs were executed. Once the execution process was complete and they start consuming resources, the test-bed started logging the resources utilized. These can be both the physical resources as well as network connectivity. This log was monitored in order to better assess the programs activities. These activities were analyzed and useful features were determined. Below are the visualization of the some of the malware activities which distinguished normal and malicious activity. Among other criteria, we chose the Dynamic Linked Library (DLL) access and manipulation as a metric for classification of benign or malicious activities in programs
Figure 9, presents DLLs manipulation by fund transfer malware. In this figure the x-axis shows time in seconds and the y-axis shows weight-age that were assigned during data-set creation. Calculated mean discriminated between normal and abnormal DLLs and tool-tip showed other features like operation, results, and class etc. So through this time-line visualization investigator can easily distinguish between benign and malicious processes to forward it for further investigation.
Figure 10 shows normal file iso-to-usb activity. The visualization clearly show time wise manipulation of DLLs, in which most of the DLLs’ activity was below the mean point. It depicts that DLLs which were labeled normal were largely manipulated by this benign process.

5. Results and Discussion

This section provides details about results and validation of the proposed approach. Given that our methodology is based on data set creation and visualization of data in a way that investigator can clearly distinguish between normal and malicious processes. The questionnaire was performed on the basis of our visualization that we have created according to our data set. In this survey, the academia and industry experts were asked about our approach and results. The reactions were pretty positive with respect to approach knowing the complexity of the problem. The summary of our survey is given below.

5.1. Visual Benign vs Malicious Process Analysis Evaluation

 Name:_______  Gender:_______
Age:_______  Experience:_______ Years
 Visualization Evaluation:
1. Are selected feature (DLL) seen useful?
a. Yes  b. No
2. Are the visualization understandable?
a. Yes  b. No
3. Can you identify normal and malicious files from proposed graph?
a. Yes  b. No
4. Is visualization a good mean for malicious and benign activities classification?
a. Yes  b. No
 User Experience:
1. The visualizations are information appealing?
a. Yes  b. No
2. Is the visualization is user-friendly?
a. Yes  b. No
3. Is the representation style of data is good?
a. Yes  b. No

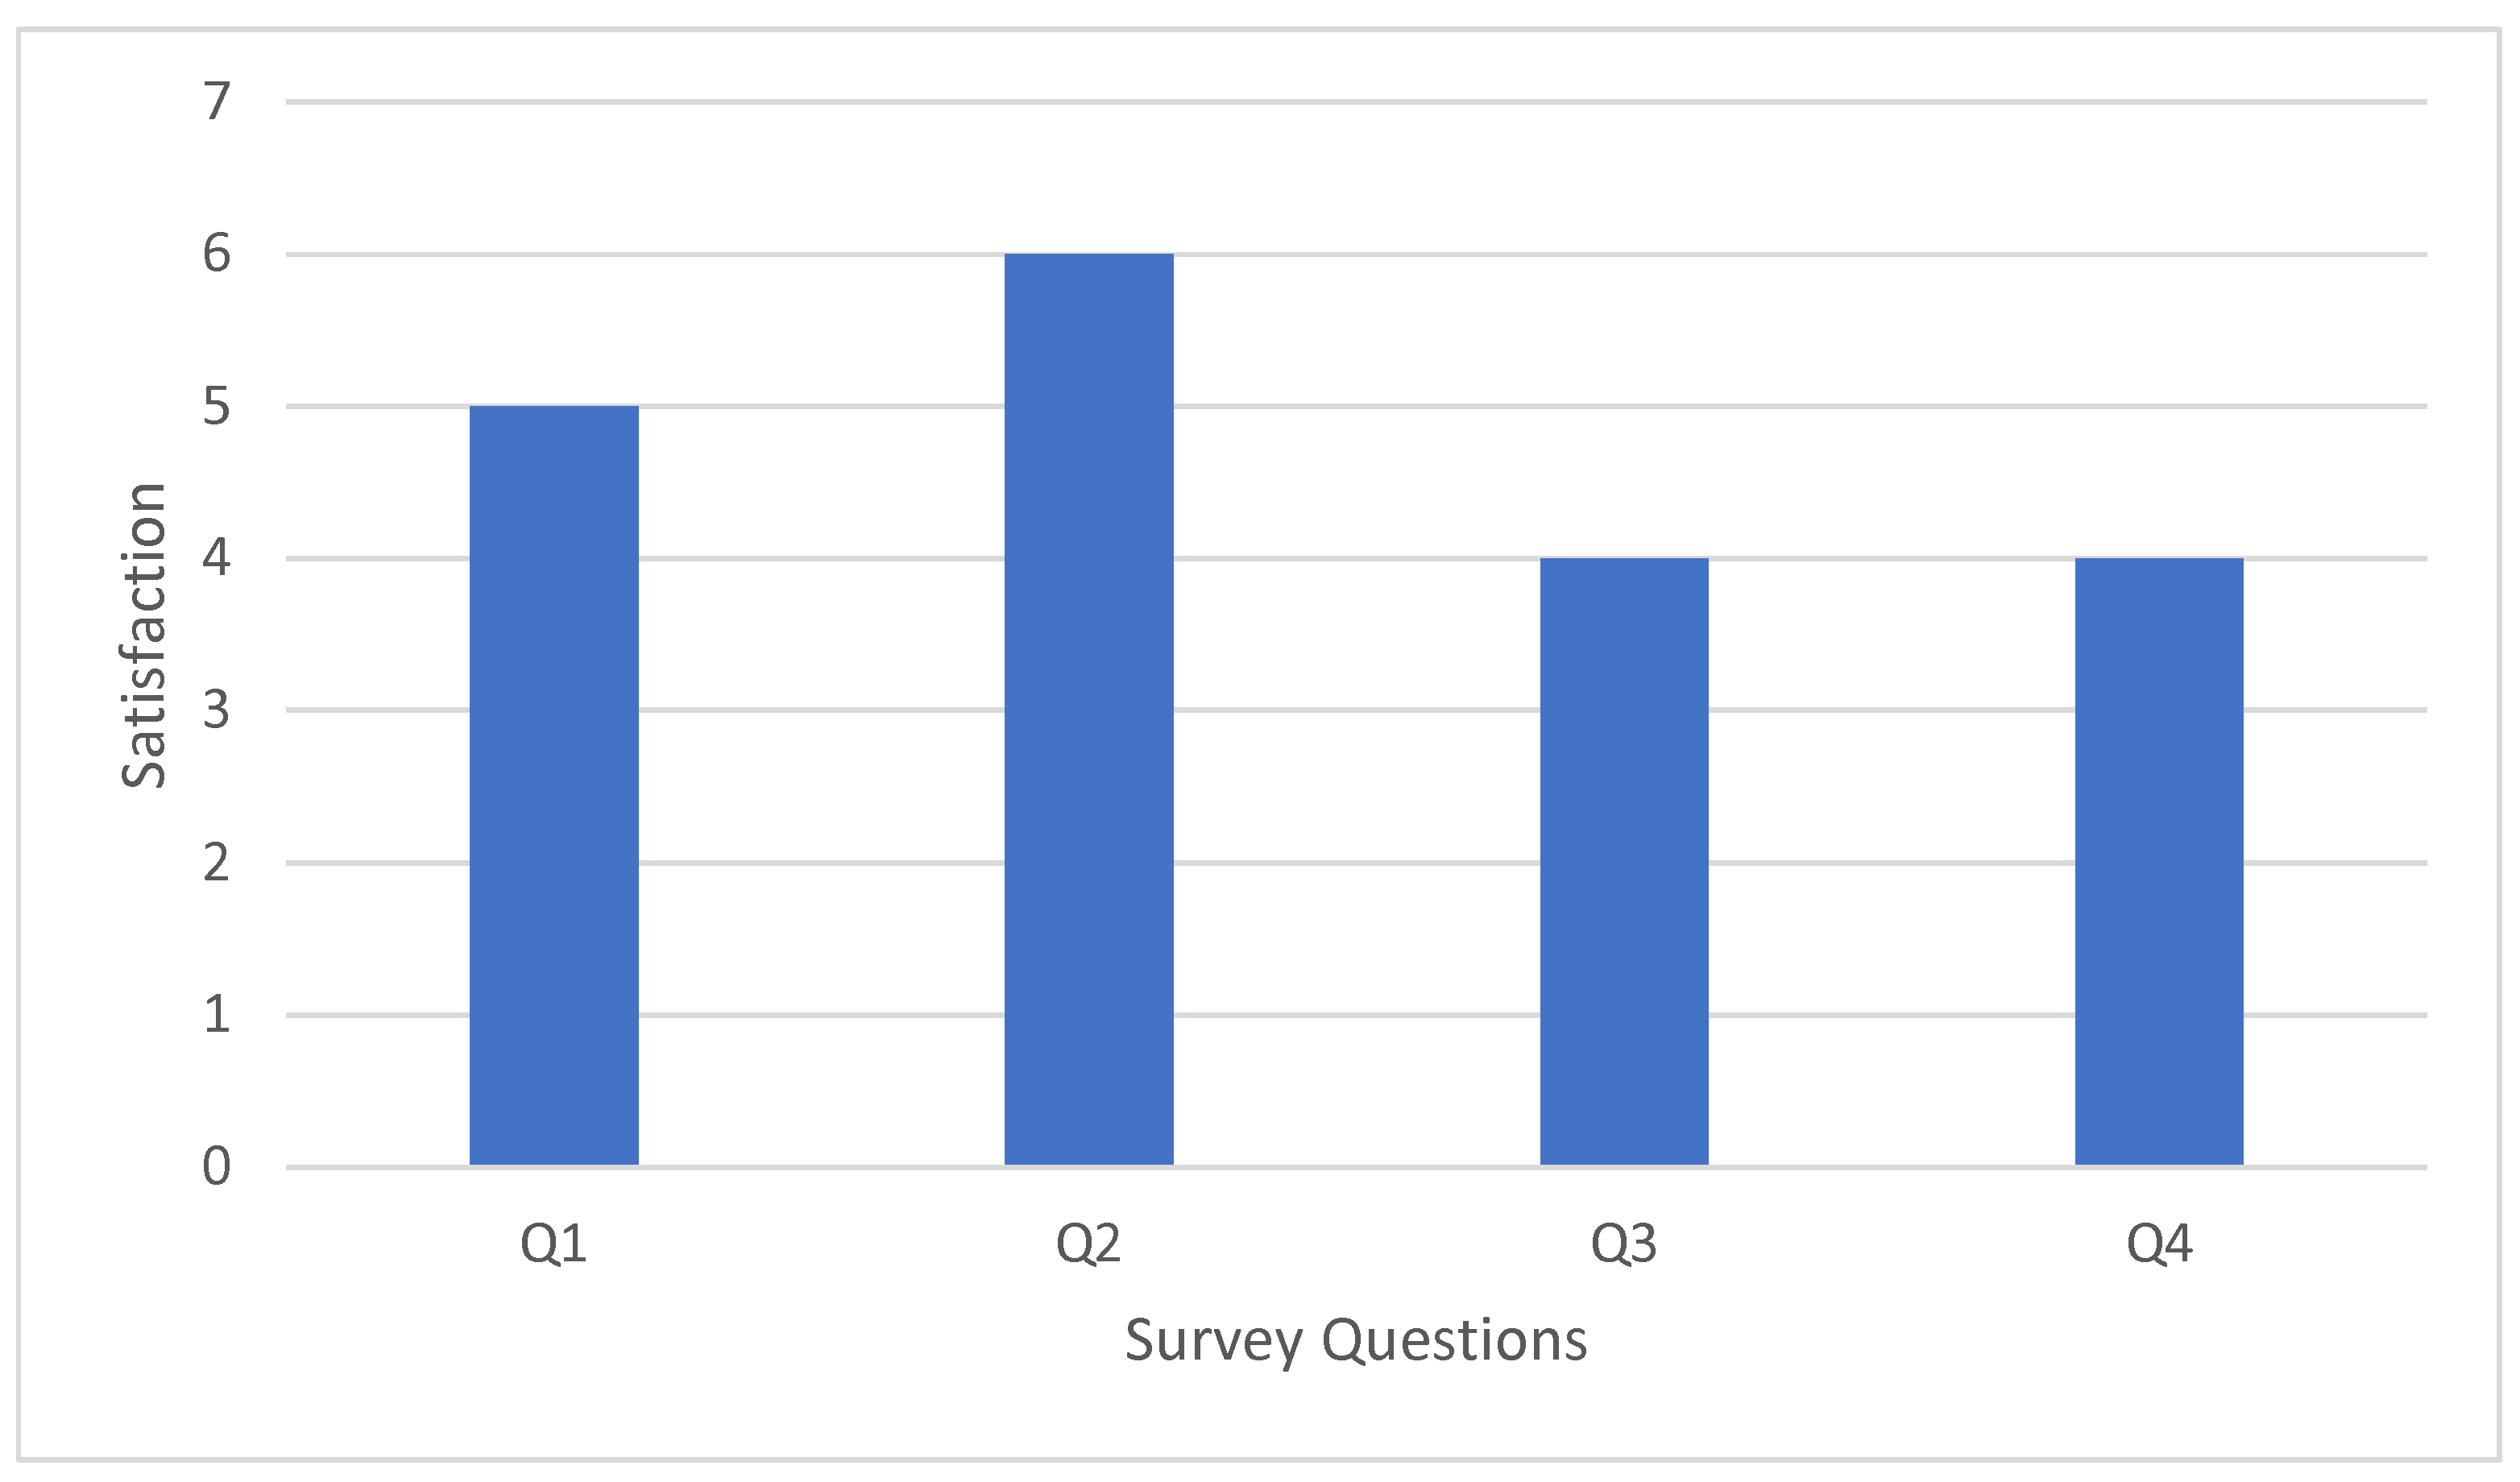
5.2. Response Collection and Analysis

Figure 11 and Figure 12 provide detail survey results and responses from different domain experts. Detailed analysis was performed on these responses. Most of the responses were positive and found our approach useful.

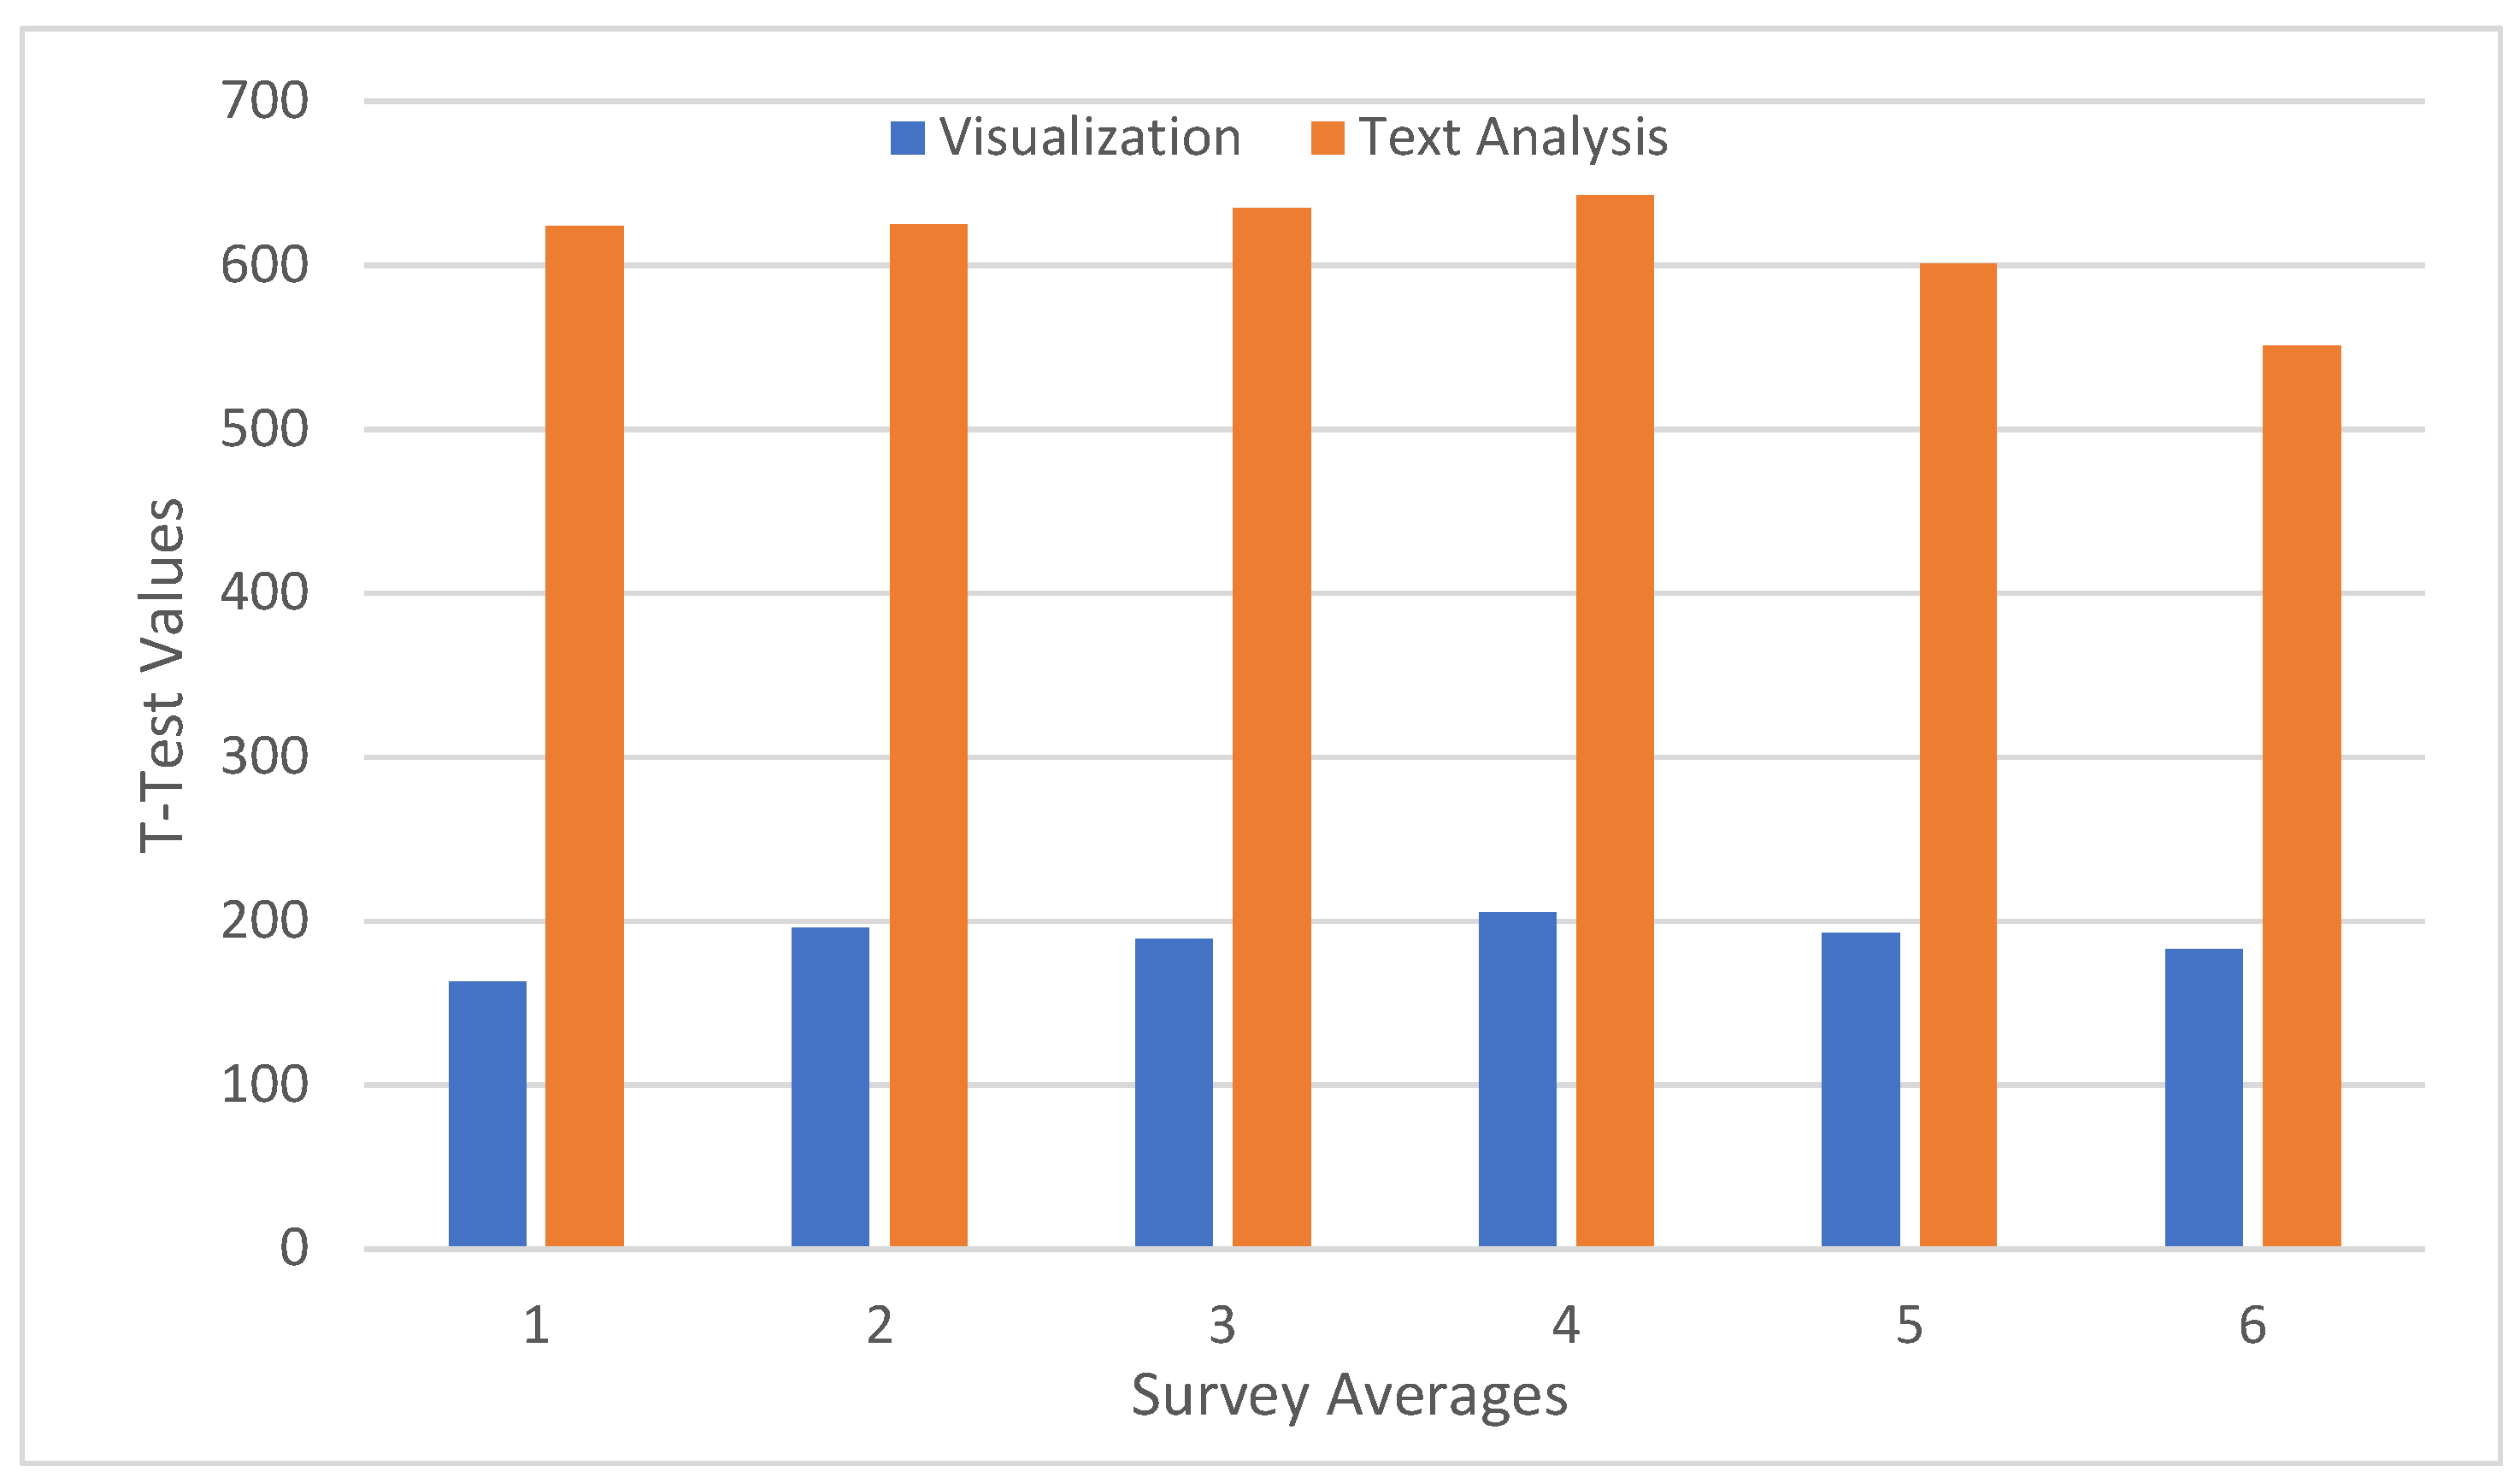
5.3. Visualization vs Textual methods Analysis Evaluation from Laymen w.r.t Time

 Name:_______  Gender:_______
 Age:_________  Experience:_______ Years
 Visualization and textual data evaluation:
  • Can you identify any malicious DLL?
  • What type of operation was performed on DLLs and their result?
  • On the basis of different activity, can we distinguish between benign and malicious files?
  • According to assigned weights which DLL got maximum weight and what was his operation?
  • According to assigned weights which DLL got minimum weight and what was his operation?
Figure 13 provides detailed survey from laymen with respect to visualization and textual representation.

5.4. T-Test

T test applies in statistics to two samples to demonstrate that whether there is a significant difference between those samples over a population. Such evaluation should proceed with an argument or hypothesis.

5.5. Hypothesis

Visualization allows user to analyze malwares in less time than user without visualization. Table 3 depicts the T-Test for performance evaluation.
Table 4 shows comparison of our approach with existing visualization techniques. This comparison was carried out in terms of functionality and information they provide. Existing work does not provide that much information that feasibly distinguish between normal and abnormal activities.

6. Conclusions and Future Works

In this modern era, there is much need of security mechanisms in place for big businesses and national defense organizations i.e., banks, federated identity management and security and intelligence agencies etc. Adversaries always look for new methods and techniques to carry out their illegitimate intentions. According to survey, malware attacks are always on the top. From the literature, it was concluded that much work has been already been performed on malware analysis. This paper presents a forensic investigation mechanism to better distinguish between normal and malicious processes through effective visualization. The main purpose of this research is to cope with future malicious disastrous attacks that ends up with financial loss, reputation damage and loss of useful information etc. This work also aims to feed already existing approaches to enrich their rules and policies. Making use of large amount of data from victimized devices is important for investigation of attack incidents. Our research also aims to remove irrelevant data and put intelligence to the large amount of data. Feature extraction and selection is one of the important and daunting aspect in creating data set from enormous and sophisticated data that has been achieved in this work in most feasible manner. The data set is rendered and visualized in such a way that investigator could easily differentiate malicious and normal activity or consider it for further investigation and processing.

Author Contributions

Conceptualization, H.A.K.; formal analysis, M.K.; funding acquisition, K.H.; investigation, I.A.; methodology, M.A.S. and H.A.K.; project administration, H.A.K., M.K. and K.H.; resources, K.H.; supervision, M.A.S. and H.A.K.; validation, Z.A. and K.H.; writing—original draft, H.A.K. and Z.A. All authors have read and agreed to the published version of the manuscript.

Funding

National Research Foundation of Korea: 2019R1F1A1042721; SW Human Resource Development Program for Supporting Smart Life: 21A20131600005; Korea Research Fellowship: 2019H1D3A1A01102987.

Acknowledgments

This work was supported by the National Research Foundation of Korea (NRF) grant funded by the Korea government (MSIT) (No. 2019R1F1A1042721). This study was also supported by the BK21 Plus project (SW Human Resource Development Program for Supporting Smart Life) funded by the Ministry of Education, School of Computer Science and Engineering, Kyungpook National University, Korea (21A20131600005). Also, this research was supported by the Korea Research Fellowship program funded by the Ministry of Science and ICT through the National Research Foundation of Korea (2019H1D3A1A01102987).

Conflicts of Interest

The authors declare no conflict of interest.

References

  1. Shafiq, M.; Yu, X.; Bashir, A.K.; Chaudhry, H.N.; Wang, D. A machine learning approach for feature selection traffic classification using security analysis. J. Supercomput. 2018, 74, 4867–4892. [Google Scholar] [CrossRef]
  2. Zhao, W.; Wang, C.; Nakahira, Y. Medical Application on Internet of Things. In Proceedings of the IET International Conference on Communication Technology and Application (ICCTA 2011), Beijing, China, 14–16 October 2011; pp. 660–665. [Google Scholar]
  3. Philip, V.; Suman, V.K.; Menon, V.G.; Dhanya, K. A review on latest internet of things based healthcare applications. Int. J. Comput. Sci. Inf. Secur. 2017, 15, 248. [Google Scholar]
  4. Deshkar, S.; Thanseeh, R.; Menon, V.G. A review on IoT based m-Health systems for diabetes. Int. J. Comput. Sci. Telecommun. 2017, 8, 13–18. [Google Scholar]
  5. Bhuyan, S.S.; Kabir, U.Y.; Escareno, J.M.; Ector, K.; Palakodeti, S.; Wyant, D.; Kumar, S.; Levy, M.; Kedia, S.; Dasgupta, D.; et al. Transforming Healthcare Cybersecurity from Reactive to Proactive: Current Status and Future Recommendations. J. Med. Syst. 2020, 44, 1–9. [Google Scholar] [CrossRef]
  6. Qiu, H.; Qiu, M.; Memmi, G.; Liu, M. Secure Health Data Sharing for Medical Cyber-Physical Systems for the Healthcare 4.0. IEEE J. Biomed. Health Inform. 2020. [Google Scholar] [CrossRef]
  7. Freet, D.; Agrawal, R. A virtual machine platform and methodology for network data analysis with IDS and security visualization. In Proceedings of the SoutheastCon 2017, Charlotte, NC, USA, 30 March–2 April 2017; pp. 1–8. [Google Scholar]
  8. Chen, L.; Takabi, H.; Le-Khac, N.A. Security, Privacy, and Digital Forensics in the Cloud; John Wiley & Sons: Hoboken, NJ, USA, 2019. [Google Scholar]
  9. Petroni, N.L., Jr.; Walters, A.; Fraser, T.; Arbaugh, W.A. FATKit: A framework for the extraction and analysis of digital forensic data from volatile system memory. Digit. Investig. 2006, 3, 197–210. [Google Scholar] [CrossRef] [Green Version]
  10. Hargreaves, C.; Patterson, J. An automated timeline reconstruction approach for digital forensic investigations. Digit. Investig. 2012, 9, S69–S79. [Google Scholar] [CrossRef] [Green Version]
  11. Studiawan, H.; Sohel, F.; Payne, C. A survey on forensic investigation of operating system logs. Digit. Investig. 2019, 29, 1–20. [Google Scholar] [CrossRef]
  12. Butler, J.; Murdock, J. Physical Memory Forensics for Files and Cache. 2011. Available online: https://paper.bobylive.com/Meeting_Papers/BlackHat/USA-2011/BH_US_11_ButlerMurdock_Physical_Memory_Forensics-WP.pdf (accessed on 3 September 2020).
  13. Pfeffer, A.; Ruttenberg, B.; Kellogg, L.; Howard, M.; Call, C.; O’Connor, A.; Takata, G.; Reilly, S.N.; Patten, T.; Taylor, J.; et al. Artificial intelligence based malware analysis. arXiv 2017, arXiv:1704.08716. [Google Scholar]
  14. Somarriba, O.; Zurutuza, U.; Uribeetxeberria, R.; Delosières, L.; Nadjm-Tehrani, S. Detection and visualization of android malware behavior. J. Electr. Comput. Eng. 2016, 2016, 8034967. [Google Scholar] [CrossRef] [Green Version]
  15. Koven, J.; Bertini, E.; Dubois, L.; Memon, N. InVEST: Intelligent visual email search and triage. Digit. Investig. 2016, 18, S138–S148. [Google Scholar] [CrossRef] [Green Version]
  16. Teelink, S.; Erbacher, R.F. Improving the computer forensic analysis process through visualization. Commun. ACM 2006, 49, 71–75. [Google Scholar] [CrossRef]
  17. Grégio, A.R.; Santos, R.D. Visualization techniques for malware behavior analysis. In Sensors, and Command, Control, Communications, and Intelligence (C3I) Technologies for Homeland Security and Homeland Defense X; International Society for Optics and Photonics: Bellingham, WA, USA, 2011; Volume 8019, p. 801905. [Google Scholar]
  18. Lowman, S.; Ferguson, I. Web History Visualisation for Forensic Investigations. Master’s Thesis, Department of Computer and Information Sciences, University of Strathclyde, Glasgow, Scotland, 2010. [Google Scholar]
  19. Nordbø, A. Data Visualization for Discovery of Digital Evidence in Email. Master’s Thesis, Faculty of Computer Science and Media Technology, Gjøvik University, Gjøvik, Norway, 2014. [Google Scholar]
  20. Gupchup, N.; Mishra, N. A Systematic Survey on Mobile Forensic Tools Used for Forensic Analysis of Android-Based Social Networking Applications. In Data, Engineering and Applications; Springer: Berlin, Germany, 2019; pp. 205–215. [Google Scholar]
  21. Ali, A.; Ahmed, M.; Imran, M.; Khattak, H.A. Security and Privacy Issues in Fog Computing. In Fog Computing: Theory and Practice; John Wiley & Sons: Hoboken, NJ, USA, 2020; Volume 1, pp. 105–138. [Google Scholar]
  22. Manzoor, A.; Shah, M.A.; Khattak, H.A.; Din, I.U.; Khan, M.K. Multi-tier authentication schemes for fog computing: Architecture, security perspective, and challenges. Int. J. Commun. Syst. 2019, e4033. [Google Scholar] [CrossRef]
  23. Shafqat, N. Forensic investigation of user’s web activity on Google Chrome using various forensic tools. IJCSNS Int. J. Comput. Sci. Netw. Secur 2016, 16, 123–132. [Google Scholar]
  24. Akbal, E.; Günes, F.; Akbal, A. Digital Forensic Analyses of Web Browser Records. JSW 2016, 11, 631–637. [Google Scholar] [CrossRef]
  25. Fletcher, D. Forensic timeline analysis using Wireshark. SANS 2015, 14, 2015. [Google Scholar]
  26. Debinski, M.; Breitinger, F.; Mohan, P. Timeline2GUI: A Log2timeline CSV parser and training scenarios. Digit. Investig. 2019, 28, 34–43. [Google Scholar] [CrossRef]
  27. Khatik, P.; Choudhary, P. An implementation of time line events visualization tool using forensic Digger algorithm. JCSE Int. J. Comput. Sci. Eng. 2014, 2, 216–220. [Google Scholar]
  28. Kälber, S.; Dewald, A.; Idler, S. Forensic zero-knowledge event reconstruction on filesystem metadata. In Proceedings of the GI Sicherheit 2014, Vienna, Austria, 19–21 March 2014. [Google Scholar]
  29. Inglot, B.; Liu, L.; Antonopoulos, N. A framework for enhanced timeline analysis in digital forensics. In Proceedings of the 2012 IEEE International Conference on Green Computing and Communications, Besancon, France, 20–23 November 2012; pp. 253–256. [Google Scholar]
  30. Esposito, S.J. Analysis of Forensic Super Timelines; Air Force Institute of Technology, Wright-Patterson Air Force Base: Dayton, OH, USA, 2012. [Google Scholar]
  31. Osborne, G.; Turnbull, B.; Slay, J. Development of InfoVis software for digital forensics. In Proceedings of the 2012 IEEE 36th Annual Computer Software and Applications Conference Workshops, Izmir, Turkey, 16–20 July 2012; pp. 213–217. [Google Scholar]
  32. Edwards, D. Computer Forensic Timeline Analysis with Tapestry; SANS Institute: Rockville, MD, USA, 2011. [Google Scholar]
  33. Schrenk, G.; Poisel, R. A discussion of visualization techniques for the analysis of digital evidence. In Proceedings of the 2011 Sixth International Conference on Availability, Reliability and Security, Vienna, Austria, 22–26 August 2011; pp. 758–763. [Google Scholar]
  34. Guðjónsson, K. Mastering the Super Timeline with Log2timeline; SANS Institute: Rockville, MD, USA, 2010. [Google Scholar]
  35. Olsson, J.; Boldt, M. Computer forensic timeline visualization tool. Digit. Investig. 2009, 6, S78–S87. [Google Scholar] [CrossRef]
  36. Buchholz, F.P.; Falk, C. Design and Implementation of Zeitline: A Forensic Timeline Editor. In Proceedings of the Digital Forensic Research Workshop (DFRWS), New Orleans, LA, USA, 17–19 August 2005; pp. 1–8. [Google Scholar]
  37. Xie, X.; Wang, W. Lightweight examination of dll environments in virtual machines to detect malware. In Proceedings of the 4th ACM International Workshop on Security in Cloud Computing, Xi’an, China, 30 May–3 June 2016; pp. 10–16. [Google Scholar]
  38. Ahmadi, M.; Ulyanov, D.; Semenov, S.; Trofimov, M.; Giacinto, G. Novel feature extraction, selection and fusion for effective malware family classification. In Proceedings of the Sixth ACM Conference on Data and Application Security and Privacy, New Orleans, LA, USA, 9–11 March 2016; pp. 183–194. [Google Scholar]
  39. Veeramani, R.; Rai, N. Windows api based malware detection and framework analysis. In Proceedings of the International Conference on Networks and Cyber Security, Alexandria, Virginia, 14–16 December 2012; Volume 3, pp. 1–6. [Google Scholar]
  40. Mosli, R.; Li, R.; Yuan, B.; Pan, Y. Automated malware detection using artifacts in forensic memory images. In Proceedings of the 2016 IEEE Symposium on Technologies for Homeland Security (HST), Waltham, MA, USA, 10–11 May 2016; pp. 1–6. [Google Scholar]
  41. Case, A.; Richard III, G.G. Detecting objective-C malware through memory forensics. Digit. Investig. 2016, 18, S3–S10. [Google Scholar] [CrossRef] [Green Version]
  42. Ahmadi, M.; Sami, A.; Rahimi, H.; Yadegari, B. Malware detection by behavioural sequential patterns. Comput. Fraud Secur. 2013, 2013, 11–19. [Google Scholar] [CrossRef]
  43. Trinius, P.; Holz, T.; Göbel, J.; Freiling, F.C. Visual analysis of malware behavior using treemaps and thread graphs. In Proceedings of the 2009 6th International Workshop on Visualization for Cyber Security, Atlantic City, NJ, USA, 11 October 2009; pp. 33–38. [Google Scholar]
  44. Margosis, A.; Russinovich, M.E. Windows Sysinternals Administrator’s Reference; Pearson Education: London, UK, 2011. [Google Scholar]
  45. Orebaugh, A.; Ramirez, G.; Beale, J. Wireshark & Ethereal Network Protocol Analyzer Toolkit; Elsevier: Amsterdam, The Netherlands, 2006. [Google Scholar]
  46. Guarnieri, C.; Tanasi, A.; Bremer, J.; Schloesser, M. The Cuckoo Sandbox. 2012. Available online: https://www.cuckoosandbox.org (accessed on 3 September 2020).
  47. Symantec, I. 2019 Internet Security Threat Report; Symantec Corporation: Mountain View, CA, USA, 2019. [Google Scholar]
  48. Norouzi, M.; Souri, A.; Samad Zamini, M. A data mining classification approach for behavioral malware detection. J. Comput. Netw. Commun. 2016, 2016, 8069672. [Google Scholar] [CrossRef] [Green Version]
  49. Guilfanov, I. The IDA Pro disassembler and debugger. DataRescue; Version 6; Prosoft Engineering, Inc.: Livermore, CA, USA, 2011. [Google Scholar]
  50. Rieck, K.; Holz, T.; Willems, C.; Düssel, P.; Laskov, P. Learning and classification of malware behavior. In Detection of Intrusions and Malware, and Vulnerability Assessment, Proceedings of the DIMVA 2008, Paris, France, 10–11 July 2008; Springer: Berlin, Germany, 2008; pp. 108–125. [Google Scholar]
  51. Jang, M.S.; Kim, H.C.; Yun, Y.T. Apparatus and Method for Detecting Dll Inserted by Malicious Code. U.S. Patent US20090133126A1, 21 May 2009. [Google Scholar]
  52. Khan, T.; Alam, M.; Akhunzada, A.; Hur, A.; Asif, M.; Khan, K. Towards augmented proactive cyber threat intelligence. J. Parallel Distrib. Comput. 2018, 124, 47–59. [Google Scholar] [CrossRef]
  53. Watson, J. Virtualbox: Bits and bytes masquerading as machines. Linux J. 2008, 2008, 1. [Google Scholar]
Figure 1. Malware attack scenario Financial Technology (FinTech) [7].
Sustainability 12 07262 g001
Figure 2. Forensics process.
Sustainability 12 07262 g002
Figure 3. Three significant phases of our proposed framework.
Sustainability 12 07262 g003
Figure 4. Process explorer.
Sustainability 12 07262 g004
Figure 5. Flowchart of our data cleaning model.
Sustainability 12 07262 g005
Figure 6. Raw Data from different Tools.
Sustainability 12 07262 g006
Figure 7. Data Set Creation Process.
Sustainability 12 07262 g007
Figure 8. Visualization schema.
Sustainability 12 07262 g008
Figure 9. Fund transfer malware activity.
Sustainability 12 07262 g009
Figure 10. Iso-to-Usb normal activity.
Sustainability 12 07262 g010
Figure 11. Response by the domain experts.
Sustainability 12 07262 g011
Figure 12. User experience as recorded by the questionnaire.
Sustainability 12 07262 g012
Figure 13. Summarized laymen survey output for the surveys conducted.
Sustainability 12 07262 g013
Table 1. Critical Literature Review Table.
Ref.Data SetMethodologyData FeaturesApproach Used FeaturesLimitations
[33]Web Logged Data setWeb Forensics analysisCookies, History, Downloads, Restore Points, Hiber File, Page FilePotential Locations To Search For A Specific Activity On WebNo Visualization, No Auto-correlation, Used Existing Forensics Tools
[15]Existing Enron E-mail data setIntelligent Emails VisualizationSource, Destination, Location, Datetime, Content, Organizationdata set Cleansing, Filtering Related Artifacts, Visualization Based On Relationships Between Entities, Keywords, And CorrespondentsEmail Specific i.e., No Relationships Between Information From Different Sources Of System, False Positives
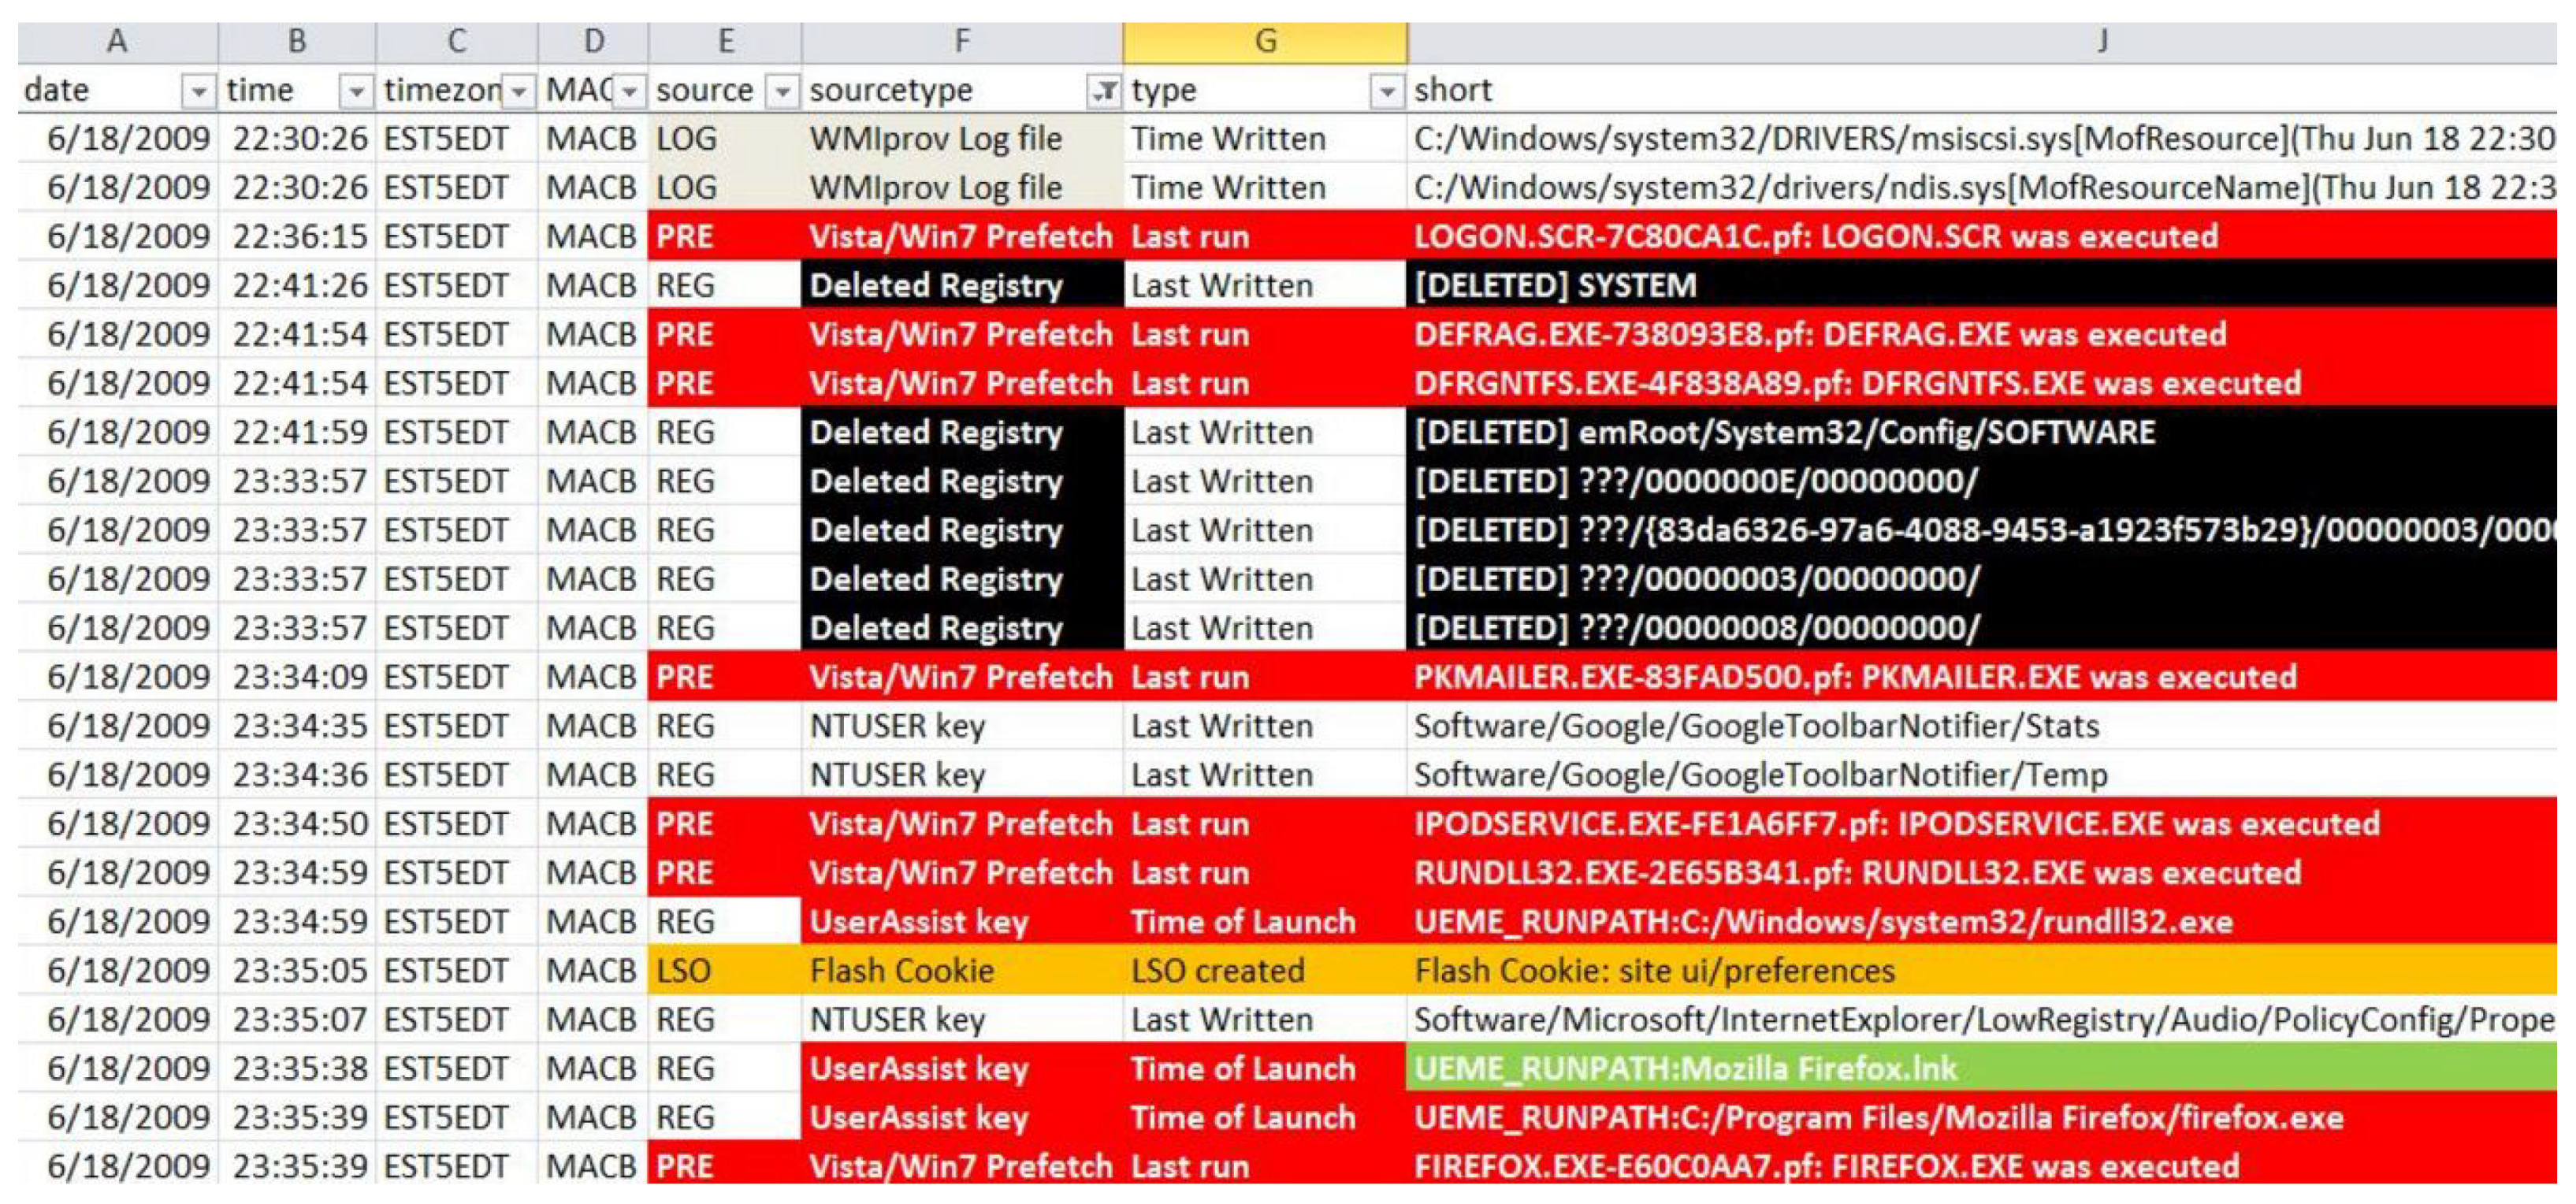
[25]Super Timeline data set of a SystemForensics timeline AnalysisTime, Source, User, MACB, FilenamesAnalysis Profile, Filtering, Colorization, Marking And Annotation Of EventsNo Correlation, Lack Of advanced Visualization
[27]Web Server data setForensics Digger AlgorithmIP Address, Datetime, Mac Address, URLsWeb URLs Connections, VisualizationNo Advanced Visualization, Algorithm is Specific to Web Server Logfile Investigation
[29]System Logging data setTimeline analysis through VisualizationFiltering, Searching, Grouping, Reporting.Lack Of Autocorrelation & Advance Visualization
[30]Super Timeline data setForensics analysis Microsoft Access DatabaseDate time, Mac, Source, Source type, Type, User, Host, Short, Desc, Version, Filename, Inode, Notes, Format, ExtraQueries for Some Specific Type Of Activity LocationsNo Visualization, No Correlation among these Locations
[32]Super Timeline data setTimeline analysis with databaseDate time, Mac, Source, Source type, Type, User, Host, Short, Desc, Version, Filename, Inode, Notes, Format, ExtraGrouping Of Data According to Log2timeline Output Attributes and Visualization Features Like Filtering, Highlighting and Word Search, etc.No Correlation, Lack Of Advanced Visualization
[20]Super Timeline data setAutomatic Timeline creationDate time, Mac, Source, Source type, Type, User, Host, Short, Desc, Version, DFilename, Inode, Notes, Format, ExtraAutomatic Construction of a Super TimelineAuto-Analysis, Correlation and Visualization
[35]System Timestamps data setTimeline visualization toolTime, Source type, Event type, InformationVisualize Timeline On The Basis Of Time to find Coherent EvidenceNo Correlation among Sources
[37]dynamic execution states of DLL’smonitoring and comparison of dynamic execution statesDLL path, loading order of DLLs and RVAs (relative virtual addresses)Light weight non-intrusive virtual environment examinationNo visualization, computational over-head
[38]malware data set from googlecontent and structure based feature extraction and fusionn-gram, opcode, APIs, Metadata, Entropy etcobfuscated malware classification, hybrid approach (features from Hex based and disassembled files)No visualization and high computa-tion
[39]Static API calls data setAPI calls extraction and selectionAPI calls, Relevant API callsStatic data set creation and training classifierNo visualization, less features
[40]Dynamic Registry, DLLs, and APIs calledFeatures extraction and selectionRegistry keys, DLLs and called APIsDynamic data set creation and training model to check accuracyNo visualization, computational over-head
[14]Dynamic function callsMonitoring and VisualizationAPI callsRules applied, VisualizationLess features, No interactive visualization
[42]API calls sequence data setFeatures extraction and training classi-fierAPI calls sequenceHooking, preprocessing and training classifierNo visualization and computational overhead
Table 2. FIViz data set comparison with existing techniques.
TechniquesDatetimeLabelingWeightsDLLsFile ActivityRegistryThreat Intelligence (TI)
Rule Generation
VisualizationSample Set
FIViz🗸🗸🗸🗸00🗸🗸🗸400
Behavioral signature based000🗸🗸0🗸🗸0100
Analysis through Wireshark features🗸🗸00🗸🗸00🗸0
Training classifier0🗸🗸🗸0🗸🗸🗸0400
Training classifier000🗸00🗸🗸0data set1 = 838
data set2 = 1082
Table 3. T-Test performance evaluation.
DescriptionHypothesis
H 0 μ v i s u a l i z a t i o n μ t e x t u a l
H 1 μ v i s u a l i z a t i o n < μ t e x t u a l
critical value-
α 0.05
df14
visualization125.90
textual646.80
t-value−29.681
p-value0.000
ResultSignificant—Reject null hypothesis
Table 4. FIViz comparison with existing visual approaches.
Visual TechniquesPlatformAPI CallsFile ActivityDLLKey ActivityMalware Analysis
Dendrogram or Tree [14]Platform Independent🗸🗸00🗸
Link graph Time series [17]Windows x64000🗸🗸
Tree map Thread graph [43]Windows x64000🗸🗸
Timeline graph FIVizWindows x64🗸🗸🗸0🗸

