Article

Determinant Factors Influencing Thai Tourists’ Intentions to Use Social Media for Travel Planning

by
Ekkapong Cheunkamon
1,
Sajjakaj Jomnonkwao
2,* and
Vatanavongs Ratanavaraha
2
1
Program in Energy and Logistics Management Engineering, School of Mechanical Engineering, Institute of Engineering, Suranaree University of Technology, Nakhon Ratchasima 30000, Thailand
2
School of Transportation Engineering, Institute of Engineering, Suranaree University of Technology, Nakhon Ratchasima 30000, Thailand
*
Author to whom correspondence should be addressed.
Sustainability 2020, 12(18), 7252; https://doi.org/10.3390/su12187252
Submission received: 12 July 2020 / Revised: 20 August 2020 / Accepted: 1 September 2020 / Published: 4 September 2020
(This article belongs to the Special Issue Web 2.0 in Tourism and Hospitality Industries)

Abstract

:
Currently, information technology plays an important role in the tourism industry. Tourists like to use social media more widely for their travel planning, which affects the high competition between entrepreneurs while facing the challenge of improving the quality of data services provided through social media. This study developed a model of the relationships between structure factors that affect intentions to use social media for travel planning. The said model integrates the technology acceptance model (TAM) theory, the theory of planned behavior (TPB), and trust and satisfaction factors. In reference to a survey of 1333 samples from domestic tourists who used social media through their smartphone, it was found that satisfaction, attitudes, subjective norms, and perception can be used to control behavior, with a positively direct effect on intentions of use. In addition, we examined the indirect effect on intentions of use. Perceived ease of use, perceived usefulness, and subjective norms had a positively significant indirect effect on intentions of use. These research results allow tourism entrepreneurs to precisely understand the stimulating factors of tourists’ intentions to use social media for travel-planning decisions, which will help lead to the development of tourism-marketing strategies and the support of sustainable competition.

1. Introduction

The Internet and information technology are rapidly changing the tourism industry [1]. Tourism technology is important as an infrastructure that combines hardware, software, and networking, in order to provide real-time information to support tourists’ decision-making [2]. Therefore, the technology used in tourism and hospitality needs improvement [3]. In addition, tourism technology is relevant to social media because such media can collect information, opinions, and participation; it is also an essential tool for promotion [4].
Currently, there is strong competition to offer increasing amounts of tourism data through social media as a channel of public relations, as well as customer communication, which is an economic cost in a highly competitive environment under the influence of information technology development. Social media platforms are widely mentioned on the Internet and through the usage of smartphone applications, particularly regarding their main point of data exchanges created by users, consisting of videos, pictures, and messages, including specific or all of the mentioned activities [5,6]. Moreover, social media platforms influence the usage and intention to share useful data with customers. By contrast, service providers can perform a survey to gather customer opinions or needs regarding service selection [7]. The factors that we should consider are tourist perceptions, traveler participation, expressing opinions on social networks using photo or video uploads, and travel reviews [8]. Therefore, tourism entrepreneurs can perceive the intention or acceptance of social media usage from tourist usage, and can then use this knowledge as guidelines to design data content, interesting presentation formats, and social media operations to increase the efficiency of website visits and operation.
A survey of Thailand’s population trends regarding information technology use found that 41 million smartphones were being used in 2012, and 51 million smartphones in 2018, which was an 80.39% increase [9]. Such an expansion increased the popularity of social media use in tourism businesses. A survey of Thai tourists’ travel behaviors in 2019 found that the most popular topics searched through social media before departing on a trip were: (1) travel routes (57.5%); (2) tourist attractions (49.4%); and (3) accommodation (33.3%) [10]. Such statistics indicate that Thai tourists increasingly like to use smartphone technology, and they also use social media more to plan their trip in advance. Thus, social media platforms are one of the fastest-growing channels of tourism communication [11]. Therefore, social media platforms are important channels in the tourism industry for marketing communication [12].
Currently, the intention to travel is driven by multiple components: the reliability of travel information, satisfaction, social media information, attitudes in travel, information sharing between tourists, etc. Social media content produced by entrepreneurs and consumers has a huge impact on the tourism and hospitality industry. By assessing feedback, criticisms, suggestions, and assessment scores through many channels, a previous study [7] found that sharing travel experiences influences the decision to visit, where the accessibility and distribution of information are important aspects of social media [13]. Tourism service providers use social media tools on websites or smartphone applications to attract new tourists [14], improve service quality, and enhance information services, resulting in increased income [15,16].
For the past few years, the theory of human behavior that researchers have applied for studying and modeling is the technology acceptance model (TAM). TAM is a theory developed for explaining the factors that affect the recognition of and intention to use technology [17]. It is a model for predicting the attitudes and loyalty of tourists with regard to the benefits and uses of information [18]. Moreover, there is a model of actual behavior of technology use in online travel; the theory of planned behavior (TPB) [11,19]. This model has mostly been used to investigate self-tourism behavior and the personal values of tourists in social behavior, in order to better understand the process of personal values and the factors that influence travel behavior [20]. Most tourists tend to choose tourist attractions based on recommendations and comments from close friends and relatives online [21]. In the technology acceptance model (TAM) developed from the theory of rational action (TRA) [22], the integration of these two theories can explain the intention to use social media. It is also a guideline to predict the intention of using social media, which increases cognitive processes by integrating social identity theory [23]. Previous studies about the intention to use online services for tourist travel confirmed that the reliability of online services that affect intention in the behavior of tourists towards the final destination [16,24] and tourist satisfaction when using online services are the important components that influence purchase intention behavior, which produces good results and long-lasting relationships with consumers [25,26]. The current study is a relationship assessment covering the factors above, which were limited and overlooked in previous studies. Therefore, in this study, we seek to examine how the use of social media affects tourist behavior in travel planning in developing countries that are famous for tourism. The results of this study and evaluation of social media use will provide valuable in-depth data for tourism marketers and other relevant parties.
Studies related to relationships and social media use intention discussed the factors that have a significant direct impact [16]; for example, in a study of social media contexts using TPB theory to demonstrate the direct effect of social factors that affect intention, the factors were enjoyment perception that influences a positive attitude towards the social media pages of activities, information, and content presented in a fun and easy-to-use way. However, surveys on the factors of knowledge and enjoyment indirectly affecting intention to use social media are still lacking [11], which is a gap that should be addressed. An investigation of indirect effects is a study of informal relationships, which provides important support when the causal model is examined [27,28].
In experimental research and relationship investigations, we may specify a mediator variable to explain the type and effect of the relationship between the independent and dependent variables to accurately identify the function of the variable. A mediator variable is a variable that forms a relationship between the outcome variable and the causal variable [29]. The main reason for testing a mediator variable is for the researcher to understand the phenomena that arise from this complex relationship. Few previous studies have used mediator variables to examine the factors that indirectly affect technology acceptance in tourism [24,30]. Hence, there is a gap to drive this study. This study’s aim is to test the factors indirectly affecting intention to use social media in travel planning by studying indirect influences, so as to extend the explanation of those factors to the beginning or cause of the intention to accept technology through mediator factors or mediator variables—where the indirect influencing factors may or may not have a direct effect—in order to gain a more in-depth understanding.
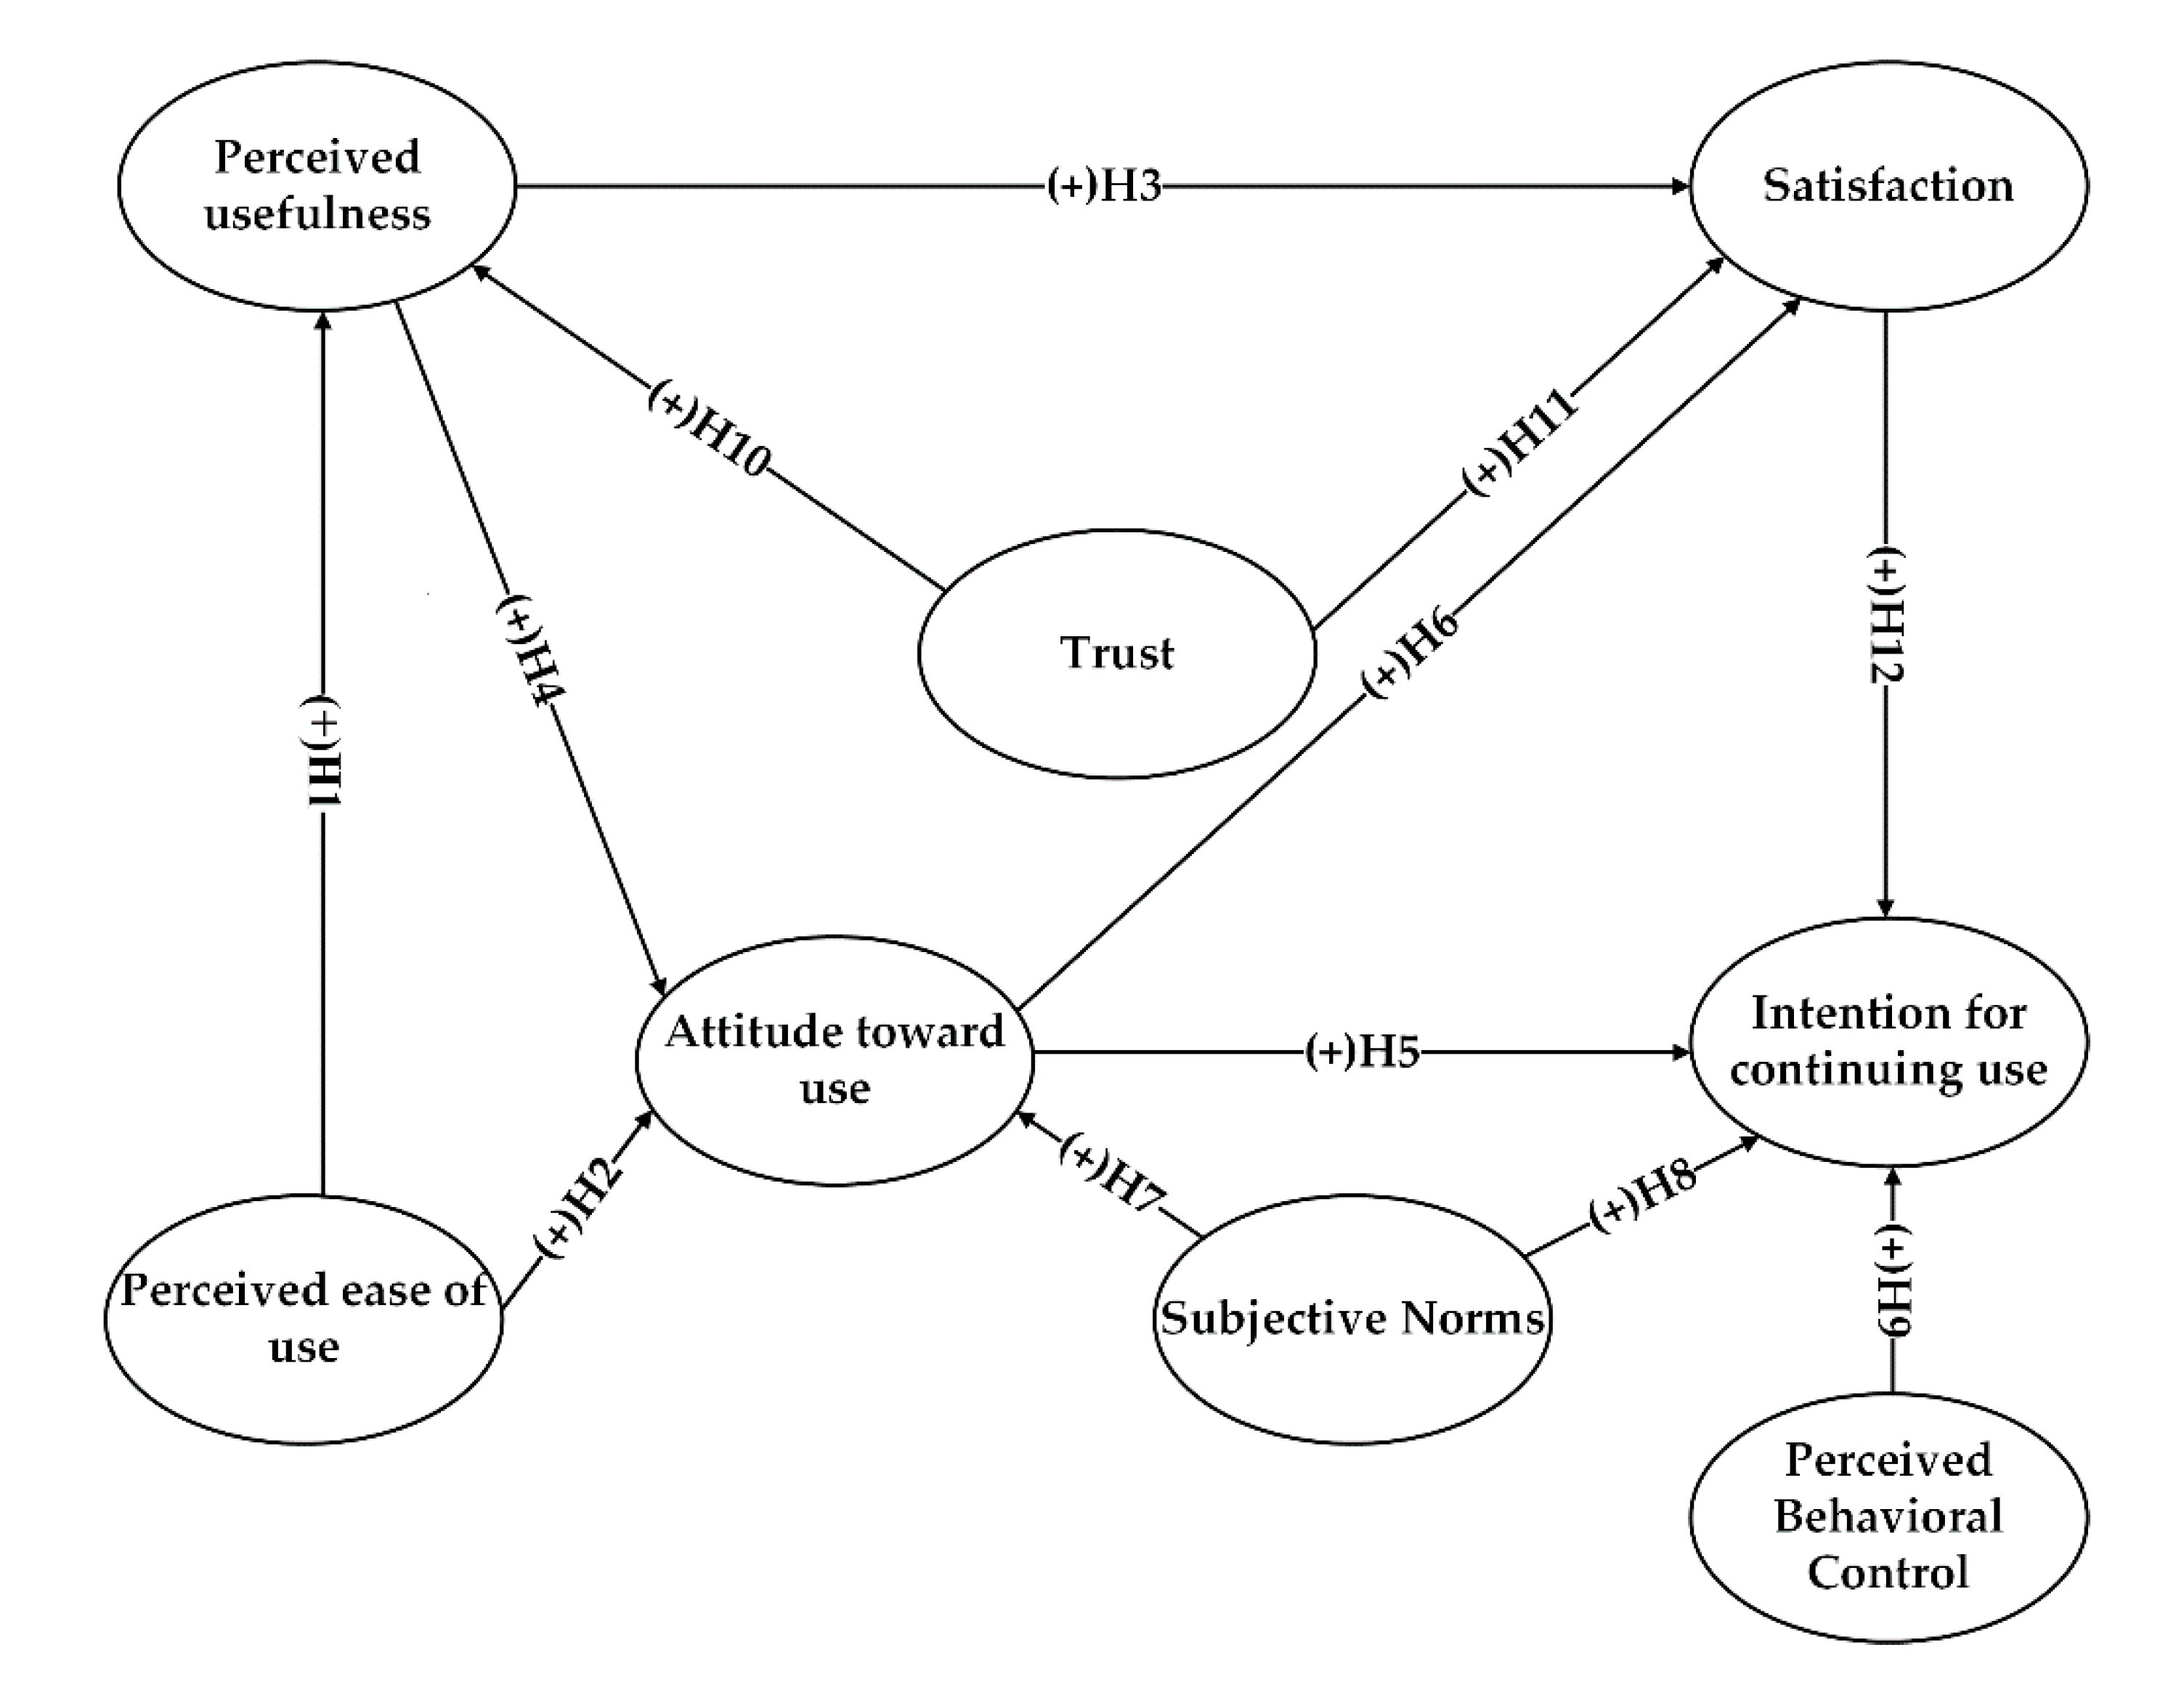
Results explaining the intention to use social media effectively in travel planning, from an entrepreneur’s perspective, can be used to develop marketing strategies to attract potential tourists and, from an academician’s perspective, can be used as a guideline for the current state of research into tourists’ social media use and for use in future further study. Thus, the aim of this study was to develop a structural equation model that affects the intention to use social media for travel planning, comprising the factors of perceived ease of use, perceived usefulness, attitudes, subjective norms, perceived behavioral control, intention to continue use, trust, and satisfaction, and to study the factors indirectly affecting intention to use social media for travel planning. The article is divided into five parts, as follows: (1) Introduction; (2) Literature Review; (3) Methodology; (4) Results; and (5) Conclusions and Discussion.

2. Literature Review

2.1. Technology Acceptance Model (TAM) Theory

Information and communication technology (ICT) plays an important role in every sector. However, consumers accept newly created technologies to fulfill their needs [31]. The TAM theory, which is an acknowledged theory regarding the acceptance of the use of technology, is a famous theory that has recently been used by researchers to explain intentions to use technology. Its structure consists of perceived usefulness, affecting thoughts that influence attitudes of technology usage [17]. In previous studies, the TAM theory was used to examine digital technology services provided on tourism communication and distribution channels [32,33,34,35], data searches by tourists on travel experiences [36,37], the acceptance in online opinions of travelers and how those opinions affect travel-planning decisions [38,39], and application usage for traveling [40]. Thus, the TAM theory is a determining factor of individual perceptions that information technology supports operation efficiency development, and it is the factor that directly affects the intention to continuously engage in technology usage. The TAM theory can help us understand the methods of accepting the use of tourism information technology, and the subsequent benefits of such usage.

2.2. Theory of Planned Behavior (TPB)

Ajzen [41] explained that the theory of reasoned action (TRA) represents whichever behavior or intention must come from such causes as (1) attitude toward behaviors, which is an attitude toward behaviors affecting whichever good or bad result; (2) subjective norms, which is a belief that the majority agrees with such behavior, creating the beliefs of individuals toward social needs; and (3) perceived behavioral control, which is the intended behavioral control of individuals. TPB is appropriate for constructing a structural equation model that focuses on the motivations of individuals that express specific behaviors [42,43]. In empirical studies, TPB was used to assess consumers’ intentions to share information effectively in purchase channels of goods and services [44]. In previous studies, the TPB was used to examine the intentions to use information technology, such as through an examination of intentions based on social media data with regard to tourism and services [11,19,45].

2.3. Trust

Trust has been mentioned as a major factor in the context of information technology usage [46], referring to complicated trust that is influenced by various aspects [47,48], or an intention to accept mistakes in accordance with positive expectations of others’ behavior [49]. Trust is usually a medium of the relations, concerns, and privacy of social media users [50]. Therefore, trust in social media is not between individuals, but between groups of people who participate in the network, or people who want to find interesting data that are accurate, useful, and similar to the knowledge received from other users or data creators.

2.4. Satisfaction

Satisfaction is the perceived difference between an individual’s expectations before receiving a service and their perception of the efficiency of said service after receiving it [51]. The satisfaction factor was previously used to seek the influence behind the social media usage demands of a company [52]. According to previous studies, satisfaction can be measured in various dimensions related to social media usage, such as satisfaction of social media usage, correspondence, on-demand content, and pleasure while using social media [53,54,55]. Thus, the expectations that tourists receive from different satisfaction levels of data-searching activities while using tourism social media platforms should be considered, rather than the overall image of satisfaction.
Table 1 and Table 2 present the literature review of the examinations of the structural relationships between the relevant factors for intentions to accept information technology in the tourism industry, as well as that of other relevant studies, from 2011 to 2020. Most articles focused on the intention to use information technology in the tourism industry. The results of related studies revealed the limitations of these studies in terms of the sample size, as well as the study of influencing factors that affect intentions using TAM theory (the study of relationships among the factors of perceived ease of use, perceived usefulness, intention to continue use, which is often overlooked, and attitude), for example [39,56,57]. The integration of TAM and TPB theories in order to study the intention to use tourism technology uses some factors to seek relationships; these include perceived usefulness, subjective norms, and intention to continue use [58]. These factors can be found in other studies, such as, for example, a study of intention among Chinese tourists to use a medical tourism application [59]. Among the limited previous studies, none used the factors of these two mentioned theories for study in the full term. Besides these factors, satisfaction and trust are factors that influence intention to use social media and can provide a more comprehensive understanding in tourism research. Therefore, we reviewed the literature for investigations of these factors’ relationship using a structural equation model that showed a positive correlation consisting of perceived ease of use, perceived usefulness, attitude, subjective norms, perceived behavioral control, intention to continue use, satisfaction, and trust.
The research aims of this study were to determine the following: (1) which indicator has the greatest effect in the structural equation model of intention to use social media for travel planning; (2) which factors, directly and indirectly, affect intention to use social media for travel planning; and (3) which factors are mediator variables of intention to use social media for travel planning.

2.5. Hypothesis Formulation

First, the relationship between the TAM theory and the TPB has been widely accepted and used to study intentions to accept information technology in the tourism industry [23]. Moreover, the TPB has a similar meaning to that of attitude toward use in the TAM theory, which is about the meaning of individual expectations regarding behavior and perception, reflecting that the behavior of an individual can result in either positive or negative outcomes [78]. It originated from the TRA, which explains the intentions of tourists to accept information technology. In addition, a study of the relationship between perceived usefulness and satisfaction in the TAM theory found that application developers have to focus on useful characteristics to improve the operation efficiency of social media platforms with regard to user needs, which positively affects user satisfaction [18,68]. Furthermore, attitude and satisfaction factors affect the intention to use tourism social media [74].
In reference to the literature reviews, most relationships have a positive effect. Our proposed hypotheses are below.
Hypothesis 1 (H1).
Perceived ease of use significantly influences perceived usefulness of social media usage for travel planning.
Hypothesis 2 (H2).
Perceived ease of use significantly influences attitude toward using social media for travel planning.
Hypothesis 3 (H3).
Perceived usefulness significantly influences satisfaction of social media usage for travel planning.
Hypothesis 4 (H4).
Perceived usefulness significantly influences attitude toward using social media for travel planning.
Hypothesis 5 (H5).
Attitude toward using significantly influences intention to continue use of social media for travel planning.
Hypothesis 6 (H6).
Attitude toward using significantly influences satisfaction of social media usage for travel planning.
Hypothesis 7 (H7).
Subjective norms significantly influence attitude toward using social media for travel planning.
Hypothesis 8 (H8).
Subjective norms significantly influence intention to continue use of social media for travel planning.
Hypothesis 9 (H9).
Perceived behavioral control significantly influences intention to continue use of social media for travel planning.
Second, the relationship between trust and the intention to accept tourism information technology has been studied using the TAM theory [24]. Trust is a key variable affecting the perception of benefits, which is a result of the trust and ease of use in tourism technology [60]. A further study was conducted on the relationship between trust and satisfaction of trading business technology perceptions. The results highlighted that trust can engage customer satisfaction, affecting intentions to purchase a product through online services [77]. Furthermore, an effect of the intention to use social media for education was found, where there was no relationship between trust and satisfaction in a study of the intention to use social media for travel planning. Therefore, according to these reasons, we present the following research hypotheses.
Hypothesis 10 (H10).
Trust significantly influences perceived usefulness of social media usage for travel planning.
Hypothesis 11 (H11).
Trust significantly influences satisfaction of social media usage for travel planning.
Lastly, when examining the relationship between satisfaction and intention to accept tourism information technology, it was found that satisfaction directly affects the intention to repeatedly purchase through Airbnb [79]. Furthermore, a study on the examination of technology acceptance where there were changes in tourism social media found that satisfaction continuously affects usage [69]. The above-mentioned studies have positive relationship characteristics; however, satisfaction and intention to use social media for travel planning were overlooked in said previous studies. Thus, we determined the following hypothesis.
Hypothesis 12 (H12).
Satisfaction influences the intention to continue use of social media for travel planning.
According to hypotheses H1–H12, we built a conceptual framework of the related study on factors that affect intention to use social media for travel planning, as shown in Figure 1.

3. Methodology

3.1. Measures and Data Collection

The questionnaire used in this research was designed to assess intentions to use social media for tourist travel planning. The questions were selected from previous studies that had passed accuracy and trust testing through the IOC method. Each indicator represents its source in Table 3. There were two parts to the questionnaire: Part 1 included the general data of responders, such as gender, age, career, education level, and travel data source; and Part 2 included the influential factors of intentions to use social media for travel planning. The eight factors (the number of indicators presented in parentheses) were perceived usefulness (3), perceived ease of use (3), attitude toward use (3), intention to continue use (4), subjective norms (3), perceived behavioral control (3), trust (3), and satisfaction (3). The assessment type used was a 5-point Likert scale, with five levels for all measurement lists, ranging from 1 (lowest) to 5 (highest). An acceptable sample size is 1:10 relative to the number of question items based on the suggestion in a previous report [80]. The participants in this survey were 20 years old. Screening questions were used to ensure that participants’ answers met the target requirements, such as “How old are you?”, “Where do you go to find information about a trip?”, and “Can you use an application to find travel information?”. Before this survey, the questionnaire was used in a pilot study with 60 tourists who came to visit Bangkok, and the questionnaire was then revised.
Responders to the questionnaire were domestic tourists who were on a trip, aged ≥ 20 years and could access social media applications on smartphones for travel planning. At the beginning of the survey, before the responders answered the questionnaire, there were suggestions and explanations of the research objectives. The survey was conducted from December 2019 to February 2020 in the tourist attractions of five regions of Thailand, namely the northern, central, northeastern, eastern, and southern regions. The total sample size was 1400, which was divided among the five regions; in each region, we collected 280 responses. Only the fully completed questionnaires were used in this study. The total number of complete questionnaires was 1333 sets that could be used for further analysis.

3.2. Data Analysis

In reference to the data analysis used in the study of structural equation modeling (SEM) in M-plus 7 software, we used the maximum likelihood estimating method. We examined the reliability of the indicator structure of each factor by examining the reliability coefficient value (Cronbach’s α), which had to be higher than 0.60, in accordance with [85,86]. Then, this was confirmed by the construct reliability (CR) and average variance extracted (AVE) values.
Confirmatory factor analysis was used to examine the accuracy of the structure in relation to the indicators in the model. We examined the structural model and tested its offered hypotheses. Statistical values were used to test the goodness-of-fit index, consisting of the chi-squared statistic ( χ 2 ) per degrees of freedom (df), which had to be less than 5 [87]; the root mean square error of approximation (RMSEA), which had to be less than 0.07 [88]; the standardized root mean square residual (SRMR), which had to be ≤ 0.08; the Tucker–Lewis coefficient (TLI), which had to be > 0.90; and the comparative fit index (CFI), which had to be > 0.90 [89].
Analysis of the mediating effects is a variable acting as a mediator of independent variables to dependent variables. It allows researchers to understand more about the effects that occur through complex relationships between the independent and dependent variables, both directly and indirectly. The calculation criteria included bootstrap sample values at 10,000 with a 95% reliability level and p-values less than 0.05 [90,91]. In cases where the mediating effect resulted in only direct influence, p-values represented no significance in the result.

4. Results

4.1. Sample Characteristics

An analysis of the respondents’ results is presented in Table 4. The distribution of responders was as follows: 651 males (48.8%) and 682 females (51.2%); age: most responders were 31–40 years old (470; 35.3%) followed by 20–30 years old (396; 29.7%); career: most responders were supporting staff (912; 68.4%), followed by business owners (181; 13.6%); education level: most responders had a Bachelor’s degree (949; 71.3%), followed by those with a vocational certificate (125; 9.4%). In terms of social media usage for travel planning, the primary platform used was Facebook (553; 41.5%), followed by YouTube (380; 28.5%). The most frequent travel objective was travel for tourism (1008, 75.6%), followed by worship/meditation (158, 11.9%).

4.2. Reliability and Validity

Examination of the reliability and accuracy of the measurement model found that the coefficient values (Cronbach’s α) of each factor were in the range of 0.710–0.818, which was higher than 0.60, identifying that they met the internal consistency criteria. The statistical testing results of the indicators highlighted that the average ( X ¯ ) was 3.60–3.84, and the standard deviation (SD) was between 0.97 and 1.15. Analysis of the measurement model for the Kaiser-Meyer-Olkin (KMO) statistic was equal to 0.861, identifying that there was a parameter pattern that could be used to create reliable factors. Convergent validity examination of the measurement model was assured by CR, where all factor values were in the range of 0.710–0.820, which was higher than 0.70 [80]. The AVE value had to be higher than 0.5 [92], and we found its value to be in the range of 0.670–0.750, which was thus in accordance with all criteria for construct reliability. We concluded that the data were accurate and proper enough.

4.3. Measurement Model

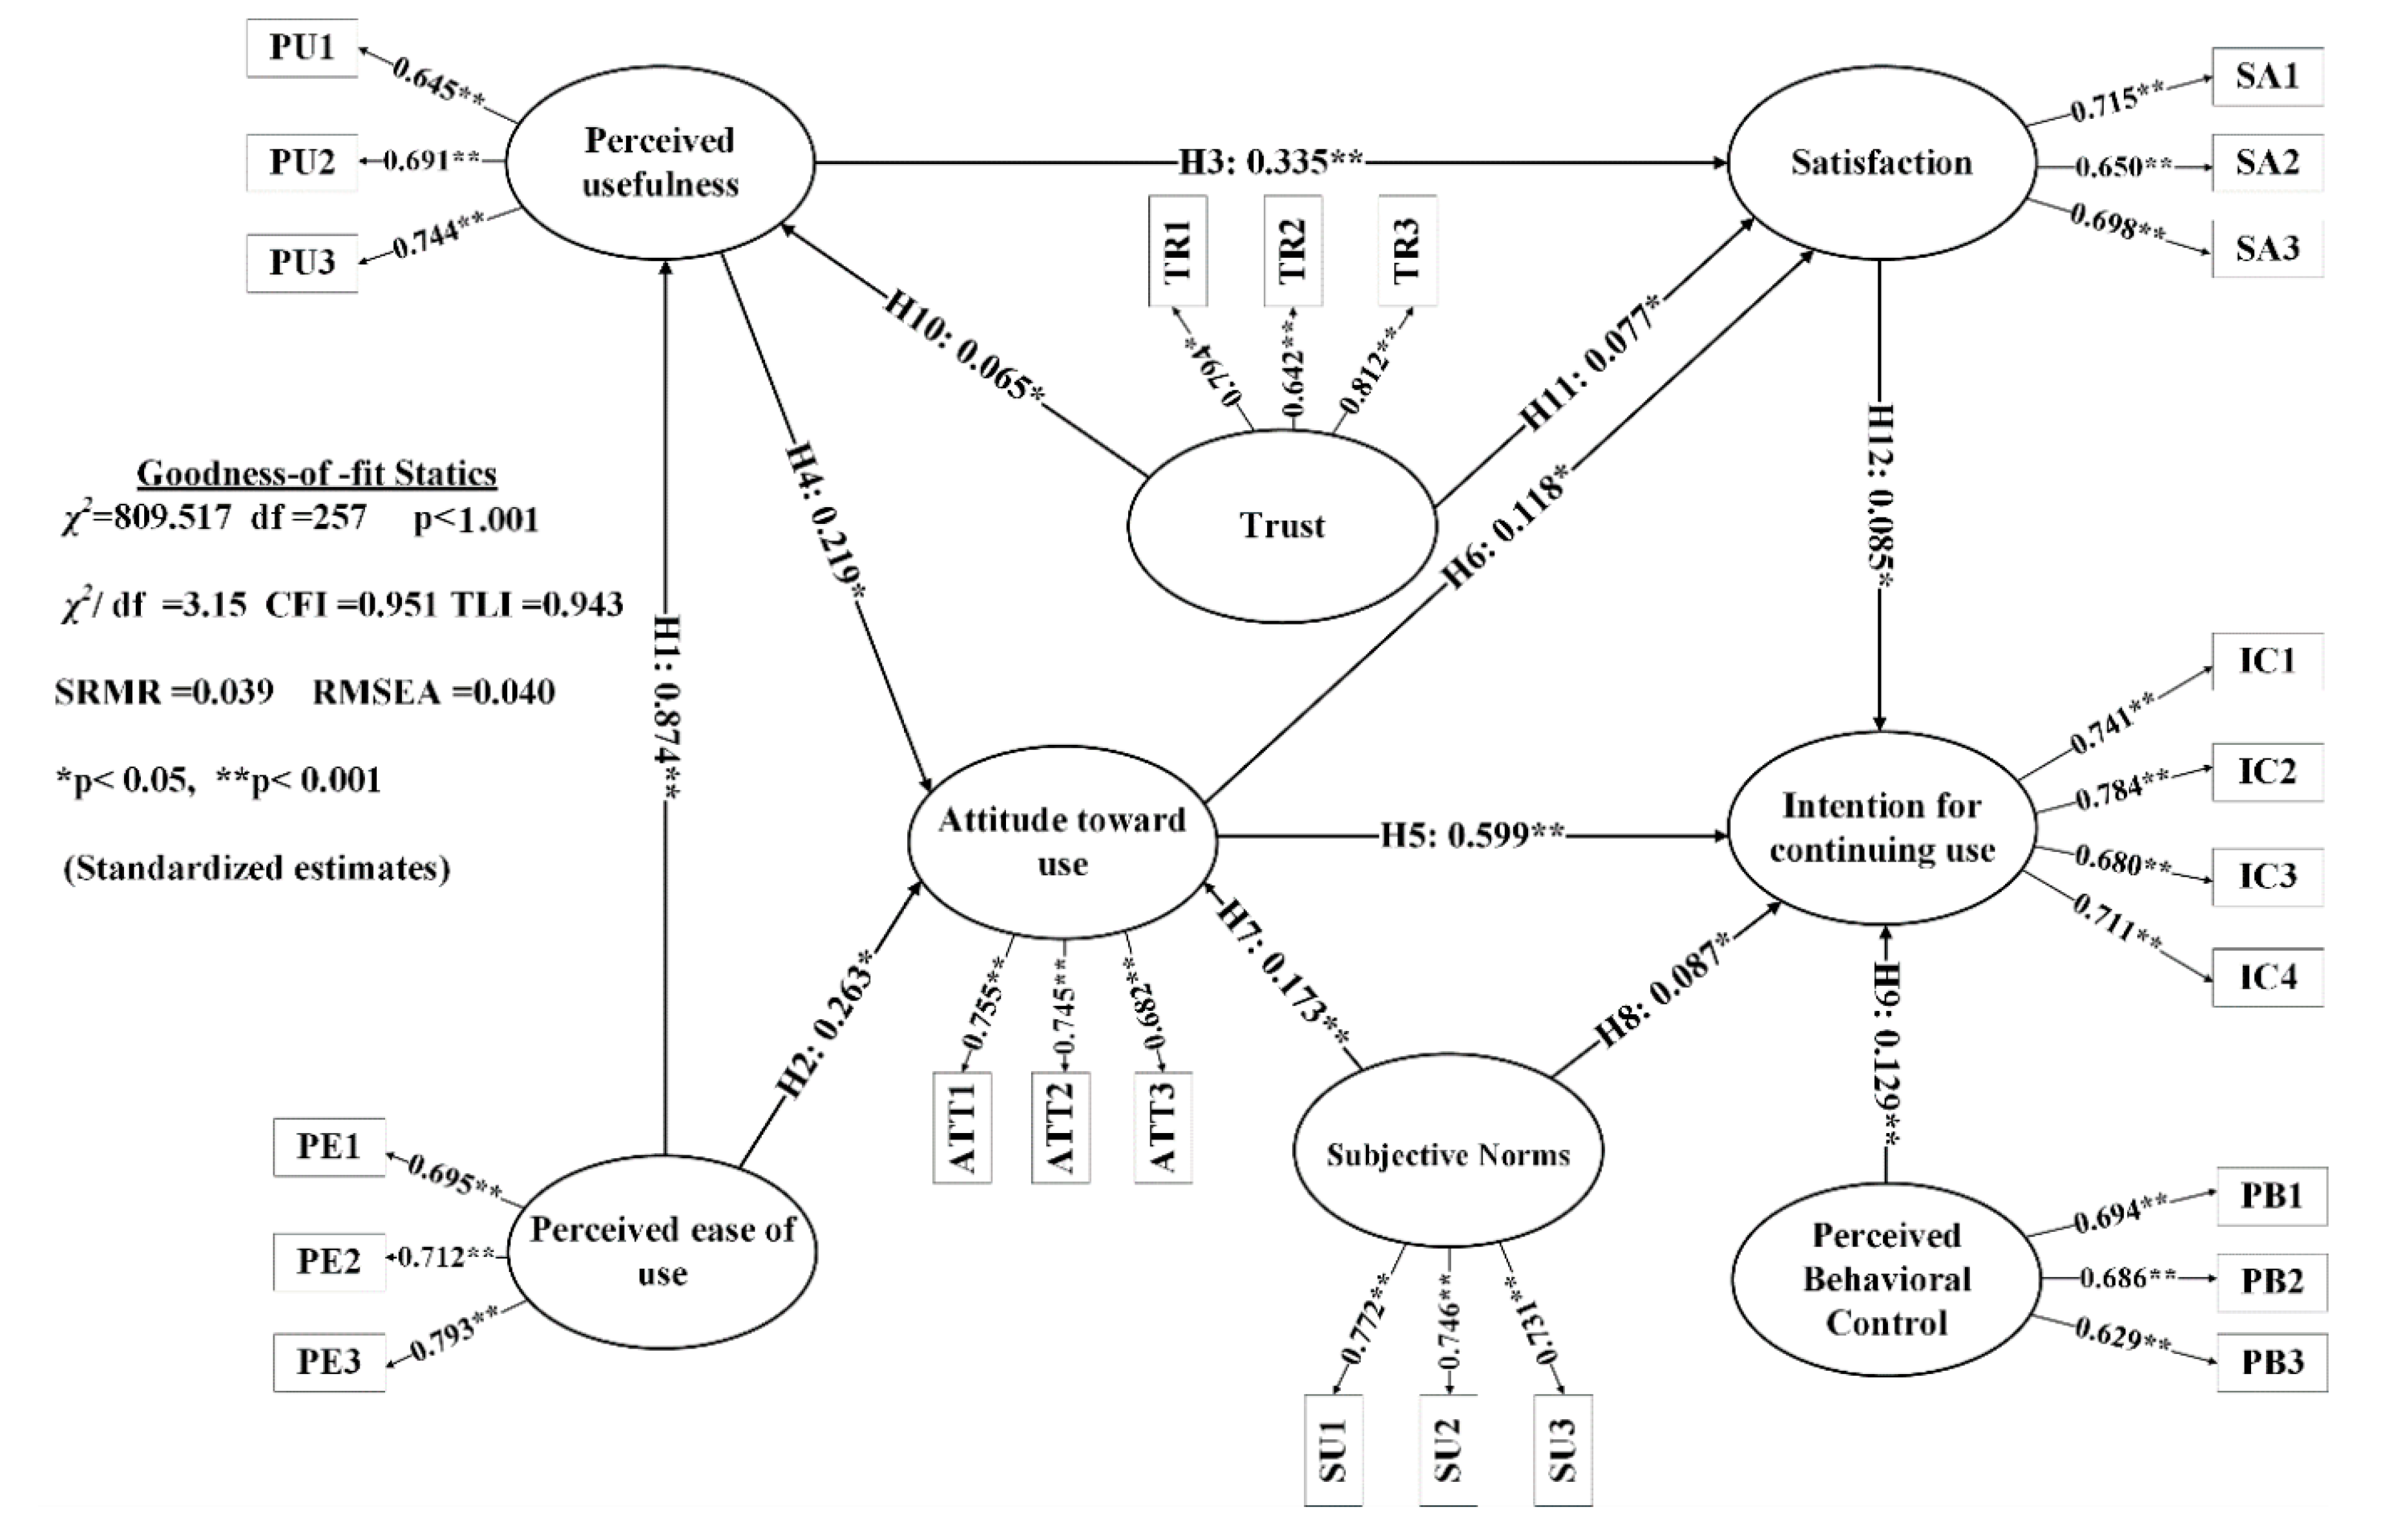
The CFA estimation results show that the structural equation model of the intention to use social media for tourist travel planning produced consistently measured index values: χ 2 = 809.517, df = 257, p < 0.001, χ 2 /df = 3.14, RMSEA = 0.040, CFI = 0.951, TLI = 0.943, and SRMR = 0.039. Such values were in accordance with the empirical data, overall consisting of eight latent factors and 25 indicators. While considering standardized loading, we found that its value was in the range of 0.629–0.812, which met the criterion of being more than 0.4, in accordance with [93]. Thus, it can be concluded that this model was composited in a statistically significant way (p < 0.001), and the standardized loading values of each list are as follows.
Perceived ease of use: From three indicators, the highest statistical standardized factor loading was PE3 (γ = 0.793, t = 54.227), the second was PE2 (γ = 0.712, t = 41.827), and the lowest was PE1 (γ = 0.695, t = 39.554).
Perceived usefulness: There were three indicators; the highest statistical standardized factor loading was PU3 (γ = 0.744, t = 44.594), the second was PU2 (γ = 0.691, t = 37.455), and the lowest was PU1 (γ = 0.642, t = 32.386).
Attitude toward use: There were three measured indicators; the highest standardized factor loading was ATT1 (γ = 0.755, t = 44.844), the second was ATT2 (γ = 0.745, t = 43.628), and the lowest was ATT3 (γ = 0.682, t = 36.231).
Subjective norms: There were three measured indicators; the highest standardized factor loading was SN1 (γ = 0.772, t = 45.778), the second was SN2 (γ = 0.746, t = 42.907), and the lowest was SN3 (γ = 0.731, t = 40.693).
Perceived behavioral control: There were three measured indicators; the highest standardized factor loading was PB1 (γ = 0.694, t = 29.962), the second was PB2 (γ = 0.686, t = 29.086), and the lowest was PB3 (γ = 0.629, t = 26.773).
Intention to continue use: From four indicators, the highest standardized factor loading was IC2 (γ = 0.784, t = 53.744), the second was IC1 (γ = 0.741, t = 46.514), the third was IC4 (γ = 0.711, t = 41.794), and the lowest was IC 3 (γ = 0.680, t = 38.119).
Trust: There were three measured indicators; and the highest standardized factor loading was TR3 (γ = 0.812, t = 47.188), the second was TR1 (γ = 0.794, t = 45.611), and the lowest was TR2 (γ = 0.642, t = 31.963).
Satisfaction: There were three measured indicators; the highest standardized factor loading was SA1 (γ = 0.715, t = 32.567), the second was SA3 (γ = 0.698, t = 31.925), and the lowest was SA2 (γ = 0.650, t = 28.642).
According to the above data, TR3 had the highest standardized loading (γ = 0.812, t = 47.188); the second was TR1 (γ = 0.794, t = 45.611), and the lowest was PB3 (PB3 (γ = 0.629, t = 26.773). As represented in Table 5, all indicators can ensure the composition in each factor structure.

4.4. Structural Model and Hypothesis Testing

The structural equation model was estimated by using the maximum likelihood value. The research results show that the levels of the measured consistency index values were:   χ 2 = 809.517, df = 257, p < 0.001, χ 2 /df = 3.14, RMSEA = 0.040, CFI = 0.951, TLI = 0.943, and SRMR = 0.039. Such consistency index values indicate that they were proper enough. Thus, it can be concluded that the structural equation model was in accordance with the empirical data. In addition, when we examined it with the 12 offered hypotheses, presented in Table 6, we found that they affected social media usage for travel planning in the following ways.
First, perceived ease of use influenced perceived usefulness, with a statistically significant standardized path coefficient: γ = 0.874, t = 49.043. Thus, H1 is supported. Similarly, perceived ease of use influenced attitude toward use, with a statistically significant standardized path coefficient: γ = 0.263, t = 2.563. Thus, H2 is supported.
Second, perceived usefulness influenced satisfaction, with a statistically significant standardized path coefficient: γ = 0.335, t = 8.209. Thus, H3 is supported. Moreover, perceived usefulness influenced attitude toward use, with a statistically significant standardized path coefficient: γ = 0.065, t = 2.358. Thus, H4 is supported.
Third, attitude toward use influenced intention to continue use, with a statistically significant standardized path coefficient: γ = 0.599, t = 21.645. Thus, H5 is supported. Furthermore, attitude toward use influenced satisfaction, with a statistically significant standardized path coefficient: γ = 0.118, t = 2.742. Thus, H6 is supported.
Fourth, subjective norms influenced attitude toward use, with a statistically significant standardized path coefficient: γ = 0.173, t = 5.302. Thus, H7 is supported. Similarly, subjective norms influenced intention to continue use, with a statistically significant standardized path coefficient: γ = 0.087, t = 2.461. So, H8 is supported.
Fifth, perceived behavioral control influenced intention to continue use, with a statistically significant standardized path coefficient: γ = 0.129, t = 3.674. Thus, H9 is supported.
Sixth, trust influenced perceived usefulness, with a statistically significant standardized path coefficient: γ = 0.065, t = 2.358. Thus, H10 is supported. In addition, trust influenced satisfaction, with a statistically significant standardized path coefficient: γ = 0.077, t = 2.273. Thus, H11 is supported.
Seventh, satisfaction influenced intention to continue use, with a statistically significant standardized path coefficient: γ = 0.085, t = 2.683. Thus, H12 is supported.
Lastly, the mediator variable effect was used to seek the standardized path coefficient, standard errors, and t-values in relation to the indirect influence of the mediator variables. This analysis identified bootstrapping at 10,000 resamples, with 95% reliability. The results of the affecting factors toward intention to use social media for travel planning are presented in Table 7.
Perceived ease of use (PE) indirectly influenced intention to continue use (IC) in a significantly positive way, with indirect-effect values of PE → attitude toward use (ATT) → IC (γ = 0.158, t = 2.070, confidence interval (CI) = 0.032 to 0.2.83, p < 0.05) and PE → perceived usefulness (PU) → satisfaction (SA) → IC (γ = 0.025, t = 2.196, CI = 0.06 to 0.044, p < 0.05).
PU indirectly influenced IC in a significantly positive way, with indirect-effect values of PU → SA → IC (γ = 0.028, t = 2.213, CI = 0.007 to 0.0050, p < 0.05).
Subjective norms (SN) indirectly influenced IC in a significantly positive way, with SN → ATT → IC (γ = 0.104, t = 5.014, CI = 0.070 to 0.138, p < 0.05).
A summarized examination in accordance with the offered research hypotheses (H1–H12) found that the hypotheses significantly affected relationships, as identified and presented in Figure 2. Moreover, the results of the mediator variable analysis found that the perceived ease of use, perceived usefulness, and subjective norm factors indirectly influenced intention to continue use of social media for travel planning in a significantly positive way.

5. Conclusions and Discussion

The main objective of this research was to develop a structural equation model to examine the structural relationships of social media usage for travel planning. The studied factors in the TAM theory consisted of perceived ease of use, perceived usefulness, attitude toward use, and intention to continue use. For the TPB, factors included subjective norms and perceived behavioral control. Furthermore, this study offered two more factors, namely, trust and satisfaction. The study method used was the confirmatory factor analysis index. There were 12 hypotheses for the structural equation analysis, which examined the relationships between the factors and the mediator variable analysis to determine the indirect influence affecting the intention to use social media for travel planning. The CFA estimation results found that we could ensure the composition of such a model in a statistically significant way. In addition, while analyzing the equation model, we found that the model’s consistency index was well-harmonized. All of the studied factors were significantly relevant to the hypotheses, which can be explained as follows.
According to the structural equation model, there were directly influenced factors of intention to use social media for travel planning, namely, attitude toward using, subjective norms, perceived behavioral control, and satisfaction. While examining the standardized path coefficient, we found that attitude toward use influenced intention to continue use the most, with γ = 0.610 meaning that tourists have a good attitude toward social-media usage and tend to use social media to search for tourism data and products for their next trip such results are in accordance with [16,23,81]. attitude toward use of for social media being driven by the perceived ease of use and perceived usefulness factors with a positive effect, in accordance with the research of [61,62,64]; and perceived behavioral control, which influenced intention to continue use, with γ = 0.140, meaning that tourists themselves intend to use social media for travel planning such study results are in accordance with [16,23]. Third was satisfaction, which influenced intention to continue use, with γ = 0.112, meaning that tourists’ satisfaction of using social media to search for traveling and activities affects their intention to use them again in the future, in accordance with [94]. Moreover, the effect of the perceived usefulness factor of social media for tourism is beneficial for easier travel decisions, and it increases efficiency, as it is a mechanism of satisfaction of social media usage, in accordance with [66,95].
The study results of the mediator variable analysis, used to examine the indirect influence of the intention to use social media, showed that perceived ease of use and perceived usefulness are often the initial factors of social media usage toward the mechanism that indirectly influences the intention to use social media in a positive way, in accordance with [23,24,36,66,68].
In addition, the study results highlighted the mediator variables that are transferred to the intention to continue use, consisting of two factors: satisfaction, driven by the perceived ease of use and perceived usefulness factors, in accordance with [6,18]. Attitude toward use is a mediator variable with two transferred factors, namely, subjective norms, in accordance with [96], and perceived ease of use, in accordance with [60]. However, trust has no direct effect, which corresponds to the work of [61], and no indirect effect, in accordance with [24], toward intention to continue use.
In summary, the results identified that all factors affected the intention to use social media, except for trust. Furthermore, attitude toward use and satisfaction play a key role, acting as a mediator between factors that affect intention to use social media for travel planning.

5.1. Theoretical Implications

Another part of the value of this study is in explaining the acceptance and intention of using social media and including individual motivational factors, which express specific behaviors, and other related factors. The findings can provide an overview of the tourists that use Thailand’s social media. This study allows the government, entrepreneurs, and system and data developers to understand tourists’ behavior from the questionnaire that was constructed based on a literature review, and which can be used in the Thai context. Hypotheses H1–H12 were significantly supported and could also build confidence in integrating TAM and TPB with the satisfaction factors that affect intention to use social media [23,30,66]. The results of this study showed that using social media can improve the accessibility of tourism information, and that the accessibility of information affects the use of social media for travel planning. Hence, the benefits of using social media in travel planning can be applied to other countries, similarly to previous research results [97].
Moreover, among the findings of this study on the intention to use social media for travel planning, indirect factors, such as perceived ease of use and perceived usefulness, were proven to have an indirect influence on intention to use social media. This evidence shows that intention to use social media does not only arise from direct factors, such as attitude, subjective norms, perceived behavioral control, or satisfaction. When we acknowledge the initial factors, which were perceived ease of use and perceived usefulness, we should give them priority, since they are a cause of intention. The study of tourism technology, especially social media, is becoming more complex [98]. Therefore, further studies of indirect factors should be considered in the future.

5.2. Managerial Implications

Social media usage rapidly grows [6] alongside communication tools for large numbers of people. Social media platforms can also be more useful in fields where traditional communication cannot do what social media can. The results of this study demonstrate the effects of using social media, as follows:
(1)
Effects can be observed on social media users by increasing information accessibility, for example, via convenient communicative interactions and ease of use to search for information. Social media is useful and allows a tourist to make a decision on travel planning in a simple and easy way. The result of our analysis also showed that users understand and perceive the benefits of using social media when planning their trips, so the number of users is increased. However, it also revealed that people and individuals, such as self, family, and close friends, influence decision-making on the use of social media for travel planning; for example, when a friend or close relative shares a post related to a tourist attraction and travel experiences through social media, it draws the attention and interest of a group of fellow social media members to the said tourist attraction. What follows is searching for information, communicating interactively, and using the information they gain to make a travel plan in the future.
(2)
Effects observed on government showed that the government should pay attention to improving communication infrastructure and wireless Internet network systems, in terms of signal coverage, signal strength, and speed, supervising and controlling reasonable service fees, in order to allow tourists accessibility to social media for travel planning, similar to the results of a previous study [99].
(3)
Effects were observed on tourism entrepreneurs and operators in the designing and building of a social media platform: the entrepreneurs and operators acknowledged the factors that should be improved. The use of social media platforms or presentation patterns, publishing tourism information and tourism activities on social media, should be easier in order to make users perceive the benefits of using social media—that it is easier to use and more convenient than other search engines. This will directly affect the satisfaction and positive attitudes of tourists [100] and indirectly affect the intention to use social media.
Therefore, social media is an ideal tool to search for information for travel planning. The variety of factors studied allows the relevant people to see and understand the complex factors that affect intention to use social media, leading to an increasing number of users. Government, entrepreneurs, and system developers should work together to develop social media for travel planning as a channel to promote domestic tourism.

5.3. Limitations and Future Research

A limitation of this research is that the intention to use social media for travel planning was only studied from the perspective of domestic tourists in Thailand. There should be a comparative study of male and female groups, or comparative social media groups on travel planning that are created by tourist and entrepreneur groups, to allow government sectors, entrepreneurs, or stakeholders to develop their presentation of tourism data to better suit their target groups.

Author Contributions

Conceptualization, E.C. and S.J.; methodology, E.C. and S.J.; formal analysis, E.C. and S.J.; data curation, E.C.; writing—original draft preparation, E.C.; writing—review and editing, V.R. and S.J.; supervision, V.R.; project administration, S.J.; funding acquisition, S.J. All authors have read and agree to the published version of the manuscript.

Funding

This research was funded by Suranaree University of Technology, grant number RU7-706-59-03 and the APC was funded by Suranaree University of Technology.

Conflicts of Interest

The authors declare no conflict of interest.

References

  1. Quaglione, D.; Crociata, A.; Agovino, M.; Iaia, L. Cultural capital and online purchase of tourism services. Ann. Tour. Res. 2020, 80, 102797. [Google Scholar] [CrossRef]
  2. Dorcic, J.; Komsic, J.; Markovic, S. Mobile technologies and applications towards smart tourism—State of the art. Tour. Rev. 2019, 74, 82–103. [Google Scholar] [CrossRef]
  3. Cai, W.; Richter, S.; McKenna, B. Progress on technology use in tourism. J. Hosp. Tour. Technol. 2019, 10, 651–672. [Google Scholar] [CrossRef]
  4. Berhanu, K.; Raj, S. The trustworthiness of travel and tourism information sources of social media: Perspectives of international tourists visiting Ethiopia. Heliyon 2020, 6, e03439. [Google Scholar] [CrossRef] [PubMed]
  5. Kaplan, A.M.; Haenlein, M. Users of the world, unite! The challenges and opportunities of Social Media. Bus. Horiz. 2010, 53, 59–68. [Google Scholar] [CrossRef]
  6. Lim, J.-S.; Al-Aali, A.; Heinrichs, J.H.; Lim, K.-S. Testing alternative models of individuals’ social media involvement and satisfaction. Comput. Hum. Behav. 2013, 29, 2816–2828. [Google Scholar] [CrossRef]
  7. Hur, K.; Kim, T.T.; Karatepe, O.M.; Lee, G. An exploration of the factors influencing social media continuance usage and information sharing intentions among Korean travellers. Tour. Manag. 2017, 63, 170–178. [Google Scholar] [CrossRef]
  8. Parra-López, E.; Bulchand-Gidumal, J.; Gutiérrez-Taño, D.; Díaz-Armas, R. Intentions to use social media in organizing and taking vacation trips. Comput. Hum. Behav. 2011, 27, 640–654. [Google Scholar] [CrossRef]
  9. National Statistical Office Thailand. The 2018 Household Survey on the Use of Information and Communication Technology. 2018. Available online: http://www.nso.go.th/sites/2014en/Pages/Statistical%20Themes/ICT.aspx (accessed on 1 May 2020).
  10. Tourism Authority of Thailand. Behavior Survey Thai Travel Trips. 2019. Available online: https://www.tat.or.th/en (accessed on 1 May 2020).
  11. Harb Ayman, A.; Fowler, D.; Chang Hyo, J.; Blum Shane, C.; Alakaleek, W. Social media as a marketing tool for events. J. Hosp. Tour. Technol. 2019, 10, 28–44. [Google Scholar] [CrossRef]
  12. Gulbahar, M.O.; Yildirim, F. Marketing Efforts Related to Social Media Channels and Mobile Application Usage in Tourism: Case Study in Istanbul. Procedia Soc. Behav. Sci. 2015, 195, 453–462. [Google Scholar] [CrossRef] [Green Version]
  13. Hays, S.; Page, S.J.; Buhalis, D. Social media as a destination marketing tool: Its use by national tourism organisations. Curr. Issues Tour. 2013, 16, 211–239. [Google Scholar] [CrossRef]
  14. Mariani, M.M.; Buhalis, D.; Longhi, C.; Vitouladiti, O. Managing change in tourism destinations: Key issues and current trends. J. Destin. Mark. Manag. 2014, 2, 269–272. [Google Scholar] [CrossRef]
  15. Sharma, A.; Sharma, S.; Chaudhary, M. Are small travel agencies ready for digital marketing? Views of travel agency managers. Tour. Manag. 2020, 79, 104078. [Google Scholar] [CrossRef]
  16. Amaro, S.; Duarte, P. An integrative model of consumers’ intentions to purchase travel online. Tour. Manag. 2015, 46, 64–79. [Google Scholar] [CrossRef]
  17. Davis, F.D. Perceived Usefulness, Perceived Ease of Use, and User Acceptance of Information Technology. MIS Q. 1989, 13, 319–340. [Google Scholar] [CrossRef] [Green Version]
  18. Zhao, Q.; Chen, C.-D.; Wang, J.-L. The effects of psychological ownership and TAM on social media loyalty: An integrated model. Telemat. Inform. 2016, 33, 959–972. [Google Scholar] [CrossRef]
  19. Leung Xi, Y.; Jiang, L. How do destination Facebook pages work? An extended TPB model of fans’ visit intention. J. Hosp. Tour. Technol. 2018, 9, 397–416. [Google Scholar] [CrossRef]
  20. Ahmad, W.; Kim, W.G.; Anwer, Z.; Zhuang, W. Schwartz personal values, theory of planned behavior and environmental consciousness: How tourists’ visiting intentions towards eco-friendly destinations are shaped? J. Bus. Res. 2020, 110, 228–236. [Google Scholar] [CrossRef]
  21. Senecal, S.; Nantel, J. The influence of online product recommendations on consumers’ online choices. J. Retail. 2004, 80, 159–169. [Google Scholar] [CrossRef]
  22. Rahman, M.M.; Lesch, M.F.; Horrey, W.J.; Strawderman, L. Assessing the utility of TAM, TPB, and UTAUT for advanced driver assistance systems. Accid. Anal. Prev. 2017, 108, 361–373. [Google Scholar] [CrossRef]
  23. Casaló, L.V.; Flavián, C.; Guinalíu, M. Determinants of the intention to participate in firm-hosted online travel communities and effects on consumer behavioral intentions. Tour. Manag. 2010, 31, 898–911. [Google Scholar] [CrossRef]
  24. Agag, G.; El-Masry, A.A. Understanding consumer intention to participate in online travel community and effects on consumer intention to purchase travel online and WOM: An integration of innovation diffusion theory and TAM with trust. Comput. Hum. Behav. 2016, 60, 97–111. [Google Scholar] [CrossRef] [Green Version]
  25. Valkonen, J. Acting in Nature: Service Events and Agency in Wilderness Guiding. Tour. Stud. 2009, 9, 164–180. [Google Scholar] [CrossRef]
  26. Alcántara-Pilar, J.M.; Blanco-Encomienda, F.J.; Armenski, T.; Del Barrio-García, S. The antecedent role of online satisfaction, perceived risk online, and perceived website usability on the affect towards travel destinations. J. Destin. Mark. Manag. 2018, 9, 20–35. [Google Scholar] [CrossRef]
  27. Kenny, D.A.; Judd, C.M. Power Anomalies in Testing Mediation. Psychol. Sci. 2013, 25, 334–339. [Google Scholar] [CrossRef]
  28. Jajja, M.S.S.; Asif, M.; Montabon, F.; Chatha, K.A. The indirect effect of social responsibility standards on organizational performance in apparel supply chains: A developing country perspective. Transp. Res. Part E Logist. Transp. Rev. 2020, 139, 101968. [Google Scholar] [CrossRef]
  29. Namazi, M.; Namazi, N.-R. Conceptual Analysis of Moderator and Mediator Variables in Business Research. Procedia Econ. Financ. 2016, 36, 540–554. [Google Scholar] [CrossRef] [Green Version]
  30. Sun, S.; Law, R.; Schuckert, M. Mediating effects of attitude, subjective norms and perceived behavioural control for mobile payment-based hotel reservations. Int. J. Hosp. Manag. 2020, 84, 102331. [Google Scholar] [CrossRef]
  31. Ukpabi, D.C.; Karjaluoto, H. Consumers’ acceptance of information and communications technology in tourism: A review. Telemat. Inform. 2017, 34, 618–644. [Google Scholar] [CrossRef] [Green Version]
  32. Kamarulzaman, Y. Adoption of travel e-shopping in the UK. Int. J. Retail Distrib. Manag. 2007, 35, 703–719. [Google Scholar] [CrossRef] [Green Version]
  33. Kucukusta, D.; Law, R.; Besbes, A.; Legohérel, P. Re-examining perceived usefulness and ease of use in online booking: The case of Hong Kong online users. Int. J. Contemp. Hosp. Manag. 2015, 27, 185–198. [Google Scholar] [CrossRef]
  34. Lin, C.T. Examining e-travel sites: An empirical study in Taiwan. Online Inf. Rev. 2010, 34, 205–228. [Google Scholar] [CrossRef] [Green Version]
  35. Peres, R.; Correia, A.; Moital, M. The indicators of intention to adopt mobile electronic tourist guides. J. Hosp. Tour. Technol. 2011, 2, 120–138. [Google Scholar] [CrossRef]
  36. Muñoz-Leiva, F.; Hernández-Méndez, J.; Sánchez-Fernández, J. Generalising user behaviour in online travel sites through the Travel 2.0 website acceptance model. Online Inf. Rev. 2012, 36, 879–902. [Google Scholar] [CrossRef]
  37. Wang, W. The influence of perceived technological congruence of smartphone application and air travel experience on consumers’ attitudes toward price change and adoption. J. Hosp. Tour. Technol. 2019, 10, 122–135. [Google Scholar] [CrossRef]
  38. Balouchi, M.; Aziz Yuhanis, A.; Hasangholipour, T.; Khanlari, A.; Abd Rahman, A.; Raja-Yusof Raja, N. Explaining and predicting online tourists’ behavioural intention in accepting consumer generated contents. J. Hosp. Tour. Technol. 2017, 8, 168–189. [Google Scholar] [CrossRef]
  39. Chong Alain Yee, L.; Khong Kok, W.; Ma, T.; McCabe, S.; Wang, Y. Analyzing key influences of tourists’ acceptance of online reviews in travel decisions. Internet Res. 2018, 28, 564–586. [Google Scholar] [CrossRef]
  40. Young Im, J.; Hancer, M. Shaping travelers’ attitude toward travel mobile applications. J. Hosp. Tour. Technol. 2014, 5, 177–193. [Google Scholar] [CrossRef]
  41. Ajzen, I. The theory of planned behavior. Organ. Behav. Hum. Decis. Process. 1991, 50, 179–211. [Google Scholar] [CrossRef]
  42. Montano, D.; Kasprzyk, D.; Glanz, K.; Rimer, B.; Viswanath, K. Theory of Reasoned Action, Theory of Planned Behavior, and the Integrated Behavior Model; Jossey-Bass: San Francisco, CA, USA, 2008; pp. 67–96. [Google Scholar]
  43. Rana, N.P.; Slade, E.; Kitching, S.; Dwivedi, Y.K. The IT way of loafing in class: Extending the theory of planned behavior (TPB) to understand students’ cyberslacking intentions. Comput. Hum. Behav. 2019, 101, 114–123. [Google Scholar] [CrossRef]
  44. Kim, Y.G.; Woo, E.; Nam, J. Sharing economy perspective on an integrative framework of the NAM and TPB. Int. J. Hosp. Manag. 2018, 72, 109–117. [Google Scholar] [CrossRef]
  45. Reza Jalilvand, M.; Samiei, N. The impact of electronic word of mouth on a tourism destination choice: Testing the theory of planned behavior (TPB). Internet Res. 2012, 22, 591–612. [Google Scholar] [CrossRef]
  46. Pavlou, P.A. Consumer Acceptance of Electronic Commerce: Integrating Trust and Risk with the Technology Acceptance Model. Int. J. Electron. Commer. 2003, 7, 101–134. [Google Scholar]
  47. Haciyakupoglu, G.; Zhang, W. Social Media and Trust during the Gezi Protests in Turkey. J. Comput. -Mediat. Commun. 2015, 20, 450–466. [Google Scholar] [CrossRef] [Green Version]
  48. Shareef, M.A.; Kapoor, K.K.; Mukerji, B.; Dwivedi, R.; Dwivedi, Y.K. Group behavior in social media: Antecedents of initial trust formation. Comput. Hum. Behav. 2020, 105, 106225. [Google Scholar] [CrossRef]
  49. Rousseau, D.; Sitkin, S.; Burt, R.; Camerer, C. Not So Different After All: A Cross-discipline View of Trust. Acad. Manag. Rev. 1998, 23. [Google Scholar] [CrossRef] [Green Version]
  50. Ayaburi, E.W.; Treku, D.N. Effect of penitence on social media trust and privacy concerns: The case of Facebook. Int. J. Inf. Manag. 2020, 50, 171–181. [Google Scholar] [CrossRef]
  51. Oliver, R.L. A Cognitive Model of the Antecedents and Consequences of Satisfaction Decisions. J. Mark. Res. 1980, 17, 460–469. [Google Scholar] [CrossRef]
  52. Istanbulluoglu, D. Complaint handling on social media: The impact of multiple response times on consumer satisfaction. Comput. Hum. Behav. 2017, 74, 72–82. [Google Scholar] [CrossRef] [Green Version]
  53. Abosag, I.; Ramadan, Z.B.; Baker, T.; Jin, Z. Customers’ need for uniqueness theory versus brand congruence theory: The impact on satisfaction with social network sites. J. Bus. Res. 2019. [Google Scholar] [CrossRef]
  54. Krishen, A.S.; Berezan, O.; Agarwal, S.; Kachroo, P. The generation of virtual needs: Recipes for satisfaction in social media networking. J. Bus. Res. 2016, 69, 5248–5254. [Google Scholar] [CrossRef]
  55. Alalwan, A.A. Mobile food ordering apps: An empirical study of the factors affecting customer e-satisfaction and continued intention to reuse. Int. J. Inf. Manag. 2020, 50, 28–44. [Google Scholar] [CrossRef]
  56. Hew, J.-J.; Leong, L.-Y.; Tan, G.W.-H.; Lee, V.-H.; Ooi, K.-B. Mobile social tourism shopping: A dual-stage analysis of a multi-mediation model. Tour. Manag. 2018, 66, 121–139. [Google Scholar] [CrossRef]
  57. Boley, B.B.; Jordan, E.J.; Kline, C.; Knollenberg, W. Social return and intent to travel. Tour. Manag. 2018, 64, 119–128. [Google Scholar] [CrossRef]
  58. Bilgihan, A.; Barreda, A.; Okumus, F.; Nusair, K. Consumer perception of knowledge-sharing in travel-related Online Social Networks. Tour. Manag. 2016, 52, 287–296. [Google Scholar] [CrossRef]
  59. Chang, I.C.; Chou, P.-C.; Yeh, R.K.-J.; Tseng, H.-T. Factors influencing Chinese tourists’ intentions to use the Taiwan Medical Travel App. Telemat. Inform. 2016, 33, 401–409. [Google Scholar] [CrossRef]
  60. Kaushik, A.K.; Agrawal, A.K.; Rahman, Z. Tourist behaviour towards self-service hotel technology adoption: Trust and subjective norm as key antecedents. Tour. Manag. Perspect. 2015, 16, 278–289. [Google Scholar] [CrossRef]
  61. Ayeh, J.K. Travellers’ acceptance of consumer-generated media: An integrated model of technology acceptance and source credibility theories. Comput. Hum. Behav. 2015, 48, 173–180. [Google Scholar] [CrossRef]
  62. Mariani, M.; Ek Styven, M.; Ayeh Julian, K. Using Facebook for travel decision-making: An international study of antecedents. Int. J. Contemp. Hosp. Manag. 2019, 31, 1021–1044. [Google Scholar] [CrossRef]
  63. Sarmah, B.; Kamboj, S.; Kandampully, J. Social media and co-creative service innovation: An empirical study. Online Inf. Rev. 2018, 42, 1146–1179. [Google Scholar] [CrossRef]
  64. Hua, L.Y.; Ramayah, T.; Ping, T.A.; Jun-Hwa, C. Social Media as a Tool to Help Select Tourism Destinations: The Case of Malaysia. Inf. Syst. Manag. 2017, 34, 265–279. [Google Scholar] [CrossRef]
  65. Xia, M.; Zhang, Y.; Zhang, C. A TAM-based approach to explore the effect of online experience on destination image: A smartphone user’s perspective. J. Destin. Mark. Manag. 2018, 8, 259–270. [Google Scholar] [CrossRef]
  66. Ayeh, J.K.; Au, N.; Law, R. Predicting the intention to use consumer-generated media for travel planning. Tour. Manag. 2013, 35, 132–143. [Google Scholar] [CrossRef]
  67. Gao, B.; Huang, L. Understanding interactive user behavior in smart media content service: An integration of TAM and smart service belief factors. Heliyon 2019, 5, e02983. [Google Scholar] [CrossRef] [PubMed] [Green Version]
  68. Hsiao, C.-H.; Chang, J.-J.; Tang, K.-Y. Exploring the influential factors in continuance usage of mobile social Apps: Satisfaction, habit, and customer value perspectives. Telemat. Inform. 2016, 33, 342–355. [Google Scholar] [CrossRef]
  69. tom Dieck, M.C.; Jung Timothy, H.; Kim Woo, G.; Moon, Y. Hotel guests’ social media acceptance in luxury hotels. Int. J. Contemp. Hosp. Manag. 2017, 29, 530–550. [Google Scholar] [CrossRef]
  70. Kaewkitipong, L.; Chen, C.C.; Ractham, P. Using social media to enrich information systems field trip experiences: Students’ satisfaction and continuance intentions. Comput. Hum. Behav. 2016, 63, 256–263. [Google Scholar] [CrossRef]
  71. Jan, A.U.; Contreras, V. Technology acceptance model for the use of information technology in universities. Comput. Hum. Behav. 2011, 27, 845–851. [Google Scholar] [CrossRef]
  72. Cheung, M.F.Y.; To, W.M. Service co-creation in social media: An extension of the theory of planned behavior. Comput. Hum. Behav. 2016, 65, 260–266. [Google Scholar] [CrossRef]
  73. Kim, E.; Lee, J.-A.; Sung, Y.; Choi, S.M. Predicting selfie-posting behavior on social networking sites: An extension of theory of planned behavior. Comput. Hum. Behav. 2016, 62, 116–123. [Google Scholar] [CrossRef]
  74. French, A.M.; Luo, X.; Bose, R. Toward a holistic understanding of continued use of social networking tourism: A mixed-methods approach. Inf. Manag. 2017, 54, 802–813. [Google Scholar] [CrossRef]
  75. Giannakis, M. Conceptualizing and managing service supply chains. Serv. Ind. J. 2011, 31, 1809–1823. [Google Scholar] [CrossRef]
  76. Dutot, V. Factors influencing Near Field Communication (NFC) adoption: An extended TAM approach. J. High Technol. Manag. Res. 2015, 26, 45–57. [Google Scholar] [CrossRef]
  77. Wu, I.-L. The antecedents of customer satisfaction and its link to complaint intentions in online shopping: An integration of justice, technology, and trust. Int. J. Inf. Manag. 2013, 33, 166–176. [Google Scholar] [CrossRef]
  78. Wu, I.-L.; Chen, J.-L. An extension of Trust and TAM model with TPB in the initial adoption of on-line tax: An empirical study. Int. J. Hum.-Comput. Stud. 2005, 62, 784–808. [Google Scholar] [CrossRef]
  79. Liang, L.J.; Choi, H.C.; Joppe, M. Exploring the relationship between satisfaction, trust and switching intention, repurchase intention in the context of Airbnb. Int. J. Hosp. Manag. 2018, 69, 41–48. [Google Scholar] [CrossRef]
  80. Hair, J.F.; Black, W.C.; Babin, B.J.; Anderson, R. Multivariate Data Analysis: Pearson New International Edition; Pearson: London, UK, 2014. [Google Scholar]
  81. Tan, G.W.-H.; Lee, V.-H.; Hew, J.-J.; Ooi, K.-B.; Wong, L.-W. The interactive mobile social media advertising: An imminent approach to advertise tourism products and services? Telemat. Inform. 2018, 35, 2270–2288. [Google Scholar] [CrossRef]
  82. Bhatiasevi, V.; Yoopetch, C. The determinants of intention to use electronic booking among young users in Thailand. J. Hosp. Tour. Manag. 2015, 23, 1–11. [Google Scholar] [CrossRef]
  83. Sullivan, Y.W.; Koh, C.E. Social media enablers and inhibitors: Understanding their relationships in a social networking site context. Int. J. Inf. Manag. 2019, 49, 170–189. [Google Scholar] [CrossRef]
  84. Lee, W.; Xiong, L.; Hu, C. The effect of Facebook users’ arousal and valence on intention to go to the festival: Applying an extension of the technology acceptance model. Int. J. Hosp. Manag. 2012, 31, 819–827. [Google Scholar] [CrossRef]
  85. Lyberg, L.; Biemer, P.; Collins, M.; De Leeuw, E.; Dippo, C.; Schwarz, N.; Trewin, D. Survey Measurement and Process Quality; Wiley: New York, NY, USA, 1997. [Google Scholar]
  86. Wang, B.; Shao, C.; Li, J.; Weng, J.; Ji, X. Holiday travel behavior analysis and empirical study under integrated multimodal travel information service. Transp. Policy 2015, 39, 21–36. [Google Scholar] [CrossRef]
  87. Wheaton, B.; Muthen, B.; Alwin, D.F.; Summers, G.F. Assessing reliability and stability in panel models. Sociol. Methodol. 1977, 8, 84–136. [Google Scholar] [CrossRef]
  88. Steiger, J.H. Understanding the limitations of global fit assessment in structural equation modeling. Personal. Individ. Differ. 2007, 42, 893–898. [Google Scholar] [CrossRef]
  89. Hu, L.t.; Bentler, P.M. Cutoff criteria for fit indexes in covariance structure analysis: Conventional criteria versus new alternatives. Struct. Equ. Model. A Multidiscip. J. 1999, 6, 1–55. [Google Scholar] [CrossRef]
  90. Sanchez, H.; Angus Clark, D.; Fields, S.A. The relationship between impulsivity and shame and guilt proneness on the prediction of internalizing and externalizing behaviors. Heliyon 2019, 5, e02746. [Google Scholar] [CrossRef] [PubMed]
  91. Yuan, Y.; Chu, Z.; Lai, F.; Wu, H. The impact of transaction attributes on logistics outsourcing success: A moderated mediation model. Int. J. Prod. Econ. 2020, 219, 54–65. [Google Scholar] [CrossRef]
  92. Urbach, N.; Ahlemann, F. Structural equation modeling in information systems research using Partial Least Squares. J. Inf. Technol. Theory Appl. 2010, 11, 2. [Google Scholar]
  93. Ertz, M.; Karakas, F.; Sarigollu, E. Exploring pro-environmental behaviors of consumers: An analysis of contextual factors, attitude, and behaviors. J. Bus. Res. 2016, 60, 3971–3980. [Google Scholar] [CrossRef]
  94. Chen Jengchung, V.; Nguyen, T.; Oncheunjit, M. Understanding continuance intention in traffic-related social media: Comparing a multi-channel information community and a community-based application. Internet Res. 2019, 30, 539–573. [Google Scholar] [CrossRef]
  95. Milewicz, C.; Saxby, C. Leaders’ social media usage intentions for in-bound customer communications. Manag. Res. Rev. 2013, 36, 849–867. [Google Scholar] [CrossRef]
  96. Zhao, L.; Yin, J.; Song, Y. An exploration of rumor combating behavior on social media in the context of social crises. Comput. Hum. Behav. 2016, 58, 25–36. [Google Scholar] [CrossRef]
  97. Ei Ei, M.; Jomnonkwao, S.; Khampirat, B.; Ratanavaraha, V. Myanmar motorbike riders’ willingness to pay for fatality risk reduction. Suranaree J. Sci. Technol. 2018, 25, 131–142. [Google Scholar]
  98. Laukkanen, T.; Sinkkonen, S.; Marke, K.; Laukkanen, P. Innovation resistance among mature consumers. J. Consum. Mark. 2007, 24. [Google Scholar] [CrossRef]
  99. Kavota, J.K.; Kamdjoug, J.R.K.; Wamba, S.F. Social media and disaster management: Case of the north and south Kivu regions in the Democratic Republic of the Congo. Int. J. Inf. Manag. 2020, 52, 102068. [Google Scholar] [CrossRef]
  100. Singh, S.; Srivastava, P. Social media for outbound leisure travel: A framework based on technology acceptance model (TAM). J. Tour. Futures 2019, 5, 43–61. [Google Scholar] [CrossRef]
Figure 1. The conceptual framework.
Sustainability 12 07252 g001
Figure 2. Results of main-test research model.
Sustainability 12 07252 g002
Table 1. Types of relationships found in studies of the technology acceptance model (TAM) theory, the theory of planned behavior (TPB), and other related topics.
Study (Year)MethodPerceived Ease of UsePerceived UsefulnessAttitudeSubjective NormsPerceived Behavioral ControlIntention to Continue UseSatisfactionTrust
Kaushik, Agrawal [60]SEM--
Sun, Law [30]SEM, testing for mediator---
Agag and El-Masry [24]SEM, testing for mediator---
Ayeh [61]SEM---
Bilgihan, Barreda [58]SEM-----
Chang, Chou [59]SEM---
Hew, Leong [56]SEM, ANN analysis-----
Boley, Jordan [57]SEM-----
Mariani, Ek Styven [62]SEM, multigroup analysis---
Balouchi, Aziz Yuhanis [38]SEM----
Chong Alain Yee, Khong Kok [39]SEM-----
Sarmah, Kamboj [63]SEM----
Hua, Ramayah [64]SEM, moderator effect----
Xia, Zhang [65]SEM------
This researchSEM, testing for mediator
ANN, artificial neural network; SEM, structural equation modeling.
Table 2. Hypothesis summaries and supporting research.
HypothesisRelationshipPrevious Studies
H1Perceived ease of use → perceived usefulnessCasaló, Flavián [23], Kaushik, Agrawal [60], Ayeh [61], Xia, Zhang [65], Ayeh, Au [66], Gao and Huang [67].
H2Perceived ease of use → attitude toward useCasaló, Flavián [23], Chang, Chou [59], Kaushik, Agrawal [60], Ayeh [61], Ayeh, Au [66], Gao and Huang [67].
H3Perceived usefulness → satisfactionHsiao, Chang [68], tom Dieck, Jung Timothy [69], Kaewkitipong, Chen [70].
H4Perceived usefulness → attitude toward usingCasaló, Flavián [23], Chang, Chou [59], Kaushik, Agrawal [60], Ayeh [61], Gao and Huang [67], Jan and Contreras [71], Cheung and To [72].
H5Attitude toward using → intention to continue useAgag and El-Masry [24], Kaushik, Agrawal [60], Ayeh, Au [66], Kim, Lee [73].
H6Attitude toward using → satisfactionFrench, Luo [74]
H7Subjective norm → attitude toward usingJan and Contreras [71], Giannakis [75].
H8Subjective norm → intention to continue useCasaló, Flavián [23], Boley, Jordan [57], Kaushik, Agrawal [60], Cheung and To [72], Kim, Lee [73].
H9Perceived behavioral control → intention to continue useAmaro and Duarte [16], Casaló, Flavián [23], Cheung and To [72], Kim, Lee [73].
H10Trust → perceived usefulnessAyeh [61], Mariani, Ek Styven [62], Ayeh, Au [66], Dutot [76], Wu [77].
H11Trust → satisfactionKaewkitipong, Chen [70], Wu [77].
H12Satisfaction → intention to continue useAlalwan [55], Hsiao, Chang [68], tom Dieck, Jung Timothy [69], Kaewkitipong, Chen [70].
Table 3. Questionnaire items.
ConstructsCodeQuestionnaire ItemsAdapted From
Perceived ease of usePE1It is easy to learn how to use social media for tourism.[81]
PE2It is easy to use social media websites to search for tourism data.[81]
PE3It is easy and convenient to correspond through social media for tourism.[56]
Perceived usefulnessPU1Using social media to search for tourism data aids in travel planning.[66]
PU2Using social media for tourism data searches helps to discover tourism products and services faster.[66]
PU3Using social media for tourism is useful and supports your decisions in travel planning more easily and efficiently.[66]
AttitudeATT1Social media usage for tourism is a good idea.[23]
ATT2Social media usage for tourism benefits you.[23]
ATT3Overall, you have a good attitude toward social media usage for tourism.[23]
Subjective normsSN1Your family think that you should use social media for travel planning.[23]
SN2Your close friends or co-workers suggest that you use social media for travel planning.[82]
SN3You use social media for travel planning because of your lover or partner.[83]
Perceived behavioral controlPB1Social media usage for travel planning based on your own demands.[23]
PB2You can join social media groups.[23]
PB3You use social media to post pictures of different travel attractions.[23]
Intention to continue useIC1You regularly use social media to search for trips and travel activities.[81]
IC2You use social media to search for tourism product and service data (before traveling).[81]
IC3You regularly add new travel activity data to social media, e.g., sharing travel experiences, tourism photos, and activity schedules with others.[8,84]
IC4You present traveling, i.e., travel activities, through social media.[59]
SatisfactionSA1The experience of social media usage to search for trips and travel activities is satisfying.[68]
SA2You find it enjoyable to use social media to search for trips and travel activities.[55]
SA3You are satisfied with your social media usage to search for tourism data and activities.[55]
TrustTR1Opinions about tourism on social media are true.[16]
TR2Photographs about tourism on social media are matched up to real situations.[60]
TR3You feel assured that the data quality of the tourism data on social media is reliable.[16]
Table 4. Sample characteristics (N = 1333).
DemographicsPersonal DataQuantity (Percentage)
GenderMale651 (48.8)
Female682 (51.2)
Age (years)20–30396 (29.7)
31–40470 (35.3)
41–50293 (22.1)
≥51174 (13.1)
OccupationOfficialdom122 (9.2)
Business owners181 (13.6)
Student62 (4.7)
Supporting staff912 (68.4)
Other56 (4.2)
EducationPrimary school13 (1.0)
Junior high school53 (4.0)
High school117 (8.8)
Vocational125 (9.4)
Bachelor’s degree949 (71.3)
Master’s degree/PhD 76 (5.7)
Social Media PlatformFacebook553 (41.5)
YouTube380 (28.5)
Instagram119 (8.9)
Twitter170 (12.8)
Other111 (8.3)
Travel purposeVisit family/relatives/friends3 (0.2)
Tourism1008 (75.6)
Business9 (0.7)
Shopping65 (4.9)
Culinary tourism90 (6.8)
Worship/meditation158 (11.9)
Table 5. Measurement model results.
ConstructVariables x ¯ SDStandardized Loadingst-ValueR2CRAVECronbach’s Alpha
Perceived ease of usePE13.811.050.69539.554 **0.4830.7780.7330.778
PE23.741.090.71241.827 **0.506
PE33.771.050.79354.227 **0.629
Perceived usefulnessPU13.741.020.64532.572 **0.4160.7360.6930.743
PU23.711.060.69137.455 **0.478
PU33.831.010.74444.594 **0.553
AttitudeATT13.740.980.75544.844 **0.5700.7720.7270.773
ATT23.671.010.74543.628 **0.555
ATT33.771.010.68236.231 **0.463
Subjective normsSN13.811.010.77245.778 **0.5960.7940.7500.793
SN23.820.990.74642.907 **0.557
SN33.791.030.73140.693 **0.535
Perceived behavioral controlPB13.681.000.69429.962 **0.4820.7100.6700.710
PB23.740.970.68629.086 **0.470
PB33.621.000.62926.773 **0.396
Intention to continue useIC13.691.010.74146.514 **0.5500.8200.7290.818
IC23.601.030.78453.744 **0.615
IC33.641.060.68038.119 **0.463
IC43.771.040.71141.794 **0.506
TrustTR13.731.140.79445.611 **0.6300.7960.7490.722
TR23.841.060.64231.963 **0.412
TR33.731.150.81247.188 **0.660
SatisfactionSA13.611.060.71532.567 **0.5120.7290.6880.793
SA23.661.020.65028.642 **0.423
SA33.671.040.69831.925 **0.487
Note: Kaiser-Meyer-Olkin (KMO) measure of sampling adequacy = 0.861, Bartlett’s test of sphericity = 11,594.863, degrees of freedom (df) = 300, p < 0.001, ** significant at α = 0.001; χ 2 = 809.517, df = 257, p < 0.001, χ 2 /df = 3.15, root mean square error of approximation (RMSEA) = 0.040, comparative fit index (CFI) = 0.951, Tucker–Lewis coefficient (TLI) = 0.943, standardized root mean square residual (SRMR) = 0.039. SD, standard deviation; x ¯ , mean.
Table 6. Standardized path coefficients and t-values for the structural model.
HypothesesParameter Estimate Structural PathsStandardized Path Coefficientt-ValueResult
H1Perceived ease of use → perceived usefulness0.87449.043 **Supported
H2Perceived ease of use → attitude toward use0.2632.563 *Supported
H3Perceived usefulness → satisfaction0.3358.209 *Supported
H4Perceived usefulness → attitude toward use0.0652.358 *Supported
H5Attitude toward use → intention to continue use0.59921.645 *Supported
H6Attitude toward use → satisfaction0.1182.742 *Supported
H7Subjective norms → attitude toward use0.1735.302 **Supported
H8Subjective norms → intention to continue use0.0872.461 *Supported
H9Perceived behavioral control → intention to continue use0.1293.674 **Supported
H10Trust → perceived usefulness0.0652.358 *Supported
H11Trust → satisfaction0.0772.273 *Supported
H12Satisfaction → intention to continue use0.0852.683 *Supported
Note: → regression on; * significant at α = 0.05; ** significant at α = 0.001.
Table 7. Results of the mediating effect analysis.
Indirect-Effect PathIndirect-Effect ValueSEt-Valuep-Value95% CIResult
PE → ATT → IC0.1580.0762.0700.038[0.032 to 0.283]Supported
PE → PU → ATT → IC0.1150.0681.6760.094[0.002 to 0.227]Not supported
PE → PU →SA → IC0.0250.0112.1960.028[0.006 to 0.044]Supported
PE → ATT → SA → IC0.0030.0021.1950.232[−0.001 to 0.006]Not supported
PE → PU → ATT → SA → IC0.0020.0011.2970.195[−0.001 to 0.004]Not supported
PU → ATT → IC0.1310.0771.7010.089[0.004 to 0.258]Not supported
PU → SA → IC0.0280.0132.2130.027[0.007 to 0.050]Supported
PU → ATT → SA → IC 0.0020.0021.3070.191[−0.001 to 0.005]Not supported
ATT → SA → IC0.0100.0061.8060.071[0.001 to 0.019]Not supported
SN → ATT → IC0.1040.0215.0140.000[0.070 to 0.138]Supported
SN → ATT → SA → IC0.0020.0011.6400.101[0.000 to 0.002]Not supported
TR → SA → IC0.0070.0041.6550.098[0.000 to 0.013]Not supported
TR → PU → ATT → IC0.0090.0081.1260.260[−0.004 to 0.021]Not supported
TR → PU → SA → IC0.0020.0011.3940.163[0.000 to 0.0002]Not supported
TR → PU → ATT → SA → IC0.0000.0000.9190.358[0.000 to 0.000]Not supported
Note: → regression on; bootstrap resample = 10,000. PE, perceived ease of use; ATT, attitude toward use; IC, intention to continue use; PU, perceived usefulness; SA, satisfaction; SN, subjective norms; TR, trust; CI, confidence interval.

