Article

Management Financial Incentives and Firm Performance in a Sustainable Development Framework: Empirical Evidence from European Companies

by
Gratiela Georgiana Noja
1,
Mirela Cristea
2,*,
Cecilia Nicoleta Jurcut
3,
Alexandru Buglea
3 and
Ion Lala Popa
3
1
Department of Marketing and International Economic Relations, Faculty of Economics and Business Administration, West University of Timisoara, 16 Pestalozzi Street, 300115 Timisoara, Romania
2
Department of Finance, Banking and Economic Analysis, Faculty of Economics and Business Administration, University of Craiova, Center for Banking and Financial Research, 13 A I Cuza Street, 200585 Craiova, Romania
3
Department of Management, Faculty of Economics and Business Administration, West University of Timisoara, 16 Pestalozzi Street, 300115 Timisoara, Romania
*
Author to whom correspondence should be addressed.
Sustainability 2020, 12(18), 7247; https://doi.org/10.3390/su12187247
Submission received: 2 August 2020 / Revised: 27 August 2020 / Accepted: 2 September 2020 / Published: 4 September 2020
(This article belongs to the Section Economic and Business Aspects of Sustainability)

Abstract

:
Management financial incentives are an effective way to attract, retain and stimulate managers with beneficial spillover effects on firm performance. This paper explores the relationship between board and executive management compensation and remunerations and the financial performance of European companies from various industries in a sustainable development framework. The sample covers 1594 firms with data extracted from Thomson Reuters Eikon (Refinitiv, New York, NY, USA) databases from 2019 and a selection of specific indicators. The complex methodological endeavor encompassed by our research embeds several robust and two-stage least squares (2SLS/IV) regression models, structural equation modelling, including latent class analysis and network analysis through Gaussian Graphical Models. Main results bring to the fore that management financial incentives/packages reverberate positively and significantly on the performance of European firms, leading to important upwards in enterprise value and company earnings. Moreover, the sustainability indicators (committee, policy, energy use, renewable energies) also have positive effects on the financial performance of analyzed companies, being discussed extensively within the paper.

1. Introduction

Plenty of prior studies examined the effects of management financial incentives, as a significant component of the corporate governance mechanisms [1,2,3], on firms’ performance [4,5,6,7], with inconclusive results, mainly based on the institutional discrepancies in applying the principles of corporate governance [8].
Corporate governance (CG) encloses multiple mechanisms (internal and external) that aim to adhere to the interests of all firms’ responsible parties, namely management board and shareholders [9,10]. Within these mechanisms, the compensation and remunerations of the management board represents an underlying engine driving its motivation to increase the companies’ outcomes [3,8].
On the pathway of sustainability performance of companies, established throughout the Sustainable Development Goals (SGDs) by the United Nations (UN) in 2015, in order to be achieved by 2030, the enterprises are expected to ensure significant tasks through sustainable practices [11,12]. These practices require focusing on sustainable practices of the board compensation and compositions, within CG and Corporate Social Responsibility (CSR) framework [13].
There is a large body of literature tackling the subject of financial incentives for the management and companies’ performances with inconclusive results due to CG and CSR mechanisms applied by the companies. Nevertheless, this paper aims to emphasize an ongoing provocative issue for ensuring the sustainable development of companies. The general objective of our research is to explore the relationship between board and executive management compensation and remunerations, board characteristics and the financial performance of European companies from various industries in a sustainable development framework. The sample with data from 2019 was provided by the Thomson Reuters Eikon [14], including updates in the first months of 2020 for a number of 1594 firms. The extracted data are clustered in several categories, namely, management financial incentives (including board management and senior executives’ compensations, with distinctive focus on the highest remuneration packages), board characteristics (size, background, skills and gender diversity), corporate governance dimension, firm performance indicators (companies’ value and earnings) and sustainable development credentials (including Environmental, Social and Governance (ESG), reporting scope, CSR sustainability committee, the use of energy and renewable energy, policy packaging and compensation incentives). The methodological endeavor embeds complex and advanced econometric techniques, namely, multifactorial regression models (with robust and IV estimations), structural equation modelling, including latent class analysis, and network analysis through Gaussian Graphical Models. We note that coefficients are consistent and robust in sign and statistical significance throughout different procedures and econometric techniques applied.
Therefore, given the results obtained and debatable underpinnings on this subject, our paper contributes with several components to the literature. First, it brings new insights on the board compensation and structure, on one hand, and companies’ performances, on the other hand, in synergy with CG and CSR for various European industries (most of previous research being focused either on a specific industry, like tourism [15] banking [4,5,16], textile [17] or on specific European countries, like, Portugal [18], Germany [7], Norway and Sweden [19], the United Kingdom [20] or Italy [21], while fewer papers have focused on a panel comprising many countries in Europe [12,22]). Second, based on updated data provided by the Thomson Reuters Eikon for 2019 and the first months of 2020 [14] from different countries, we will ensure the heterogeneity of variables included in the econometric analysis (especially, dependent variables) and the robustness of our findings. Third, by applying three complex econometric techniques, we will check the reliability of our findings from different perspectives (direct and global). Idem, the results of our research push forward the understanding of this subject and may be valuable for managers, policymakers and other researchers for further advanced investigations. Because of the on-going pandemic crisis, caused by infections with SARS-CoV-2 virus, many companies face difficulties such as layoffs, technical unemployment actions or even the collapse of their activity and other financial issues, and thus the need for reinforced CSR mechanisms (especially, the environmental and social pillars) [23,24] and reassessed CG policies is paramount.
Current study undertakes these important issues and configures an ambitious empirical research to strengthen the knowledge in this scientific field.
After a concise introduction regarding the continuous challenging of the subject, the paper is structured as follows: the theoretical framework of the analysis carried out on two directions, namely, the board compensation and remunerations, as relevant mechanism of corporate governance, and the relationship between board compensation, corporate sustainability and companies’ performances. These are followed by the research hypotheses, on one hand, and the data and research methodology applied, on the other hand. The results are introduced and discussed further with reference to previous findings in the literature. The concluding remarks and recommendations are detailed in the final part of the paper along with the relevant data enclosed in the Appendix A that support our empirical analysis.

2. Theoretical Framework

2.1. Board Compensation and Remunerations as a Relevant Mechanism of Corporate Governance

Nowadays, board compensation is a widely used concept brought to the fore by scientists in the field of corporate governance, a concept that is relying mostly on the agency theory principles. The essential principle of the agency theory is “the development of a compensation package that makes it possible to attract, retain and motivate managers” [1] (p. 26).
Corporate governance can be defined as “the procedures and processes according to which organizations are directed and controlled by their CEO, board of directors and senior management” [2] (p. 2). The specific management literature emphasizes that the management board is a relevant device of corporate governance and is mainly responsible for two essential functions in companies: “supervision of executive management in representation of the shareholders and providing business resources and assessment” [2] (p. 2).
The agency theory represents a powerful bond between the principals (shareholders) and the agents (executives and managers) of the companies [9,25], being supported by a contract between the shareholders and the managers, according to which the shareholder appoints the manager to provide relevant benefits for the company [26]. The shareholders basically expect that the appointed agent will perform relevant services, but due to typical time-serving behavior, the agents “may involve in actions that could rather improve their own personal wealth at the expense of the principals” [8] (p. 250). The agency matter “arises when (a) the desires or goals of the principal and agent conflict and (b) it is difficult or expensive for the principal to verify what the agent is actually doing” [27] in [8] (p. 250).
The researchers have identified two relevant steps to minimize agency problems: the risk-taking mechanism of the principal must be efficiently developed; and the contract between the principals and the agents must be supervised using the connections of the company [28]. In order to manage the aforementioned agency matter, arising as a consequence of the segregation between ownership and control, the scientists have identified several mechanisms through which companies can organize their corporate governance.
One of these mechanisms highlights that “the agency problem can be controlled efficiently by a company through internal devices that have been established to respond to competition from other firms” [29] in [8] (p. 250). Therefore, “individual managers within the firm are controlled by the market’s discipline and opportunities for their services both within and outside the firm” [29] in [8] (p. 250).
Another mechanism that improves the corporate governance of a company is based on the establishment and compensation of the board. Thus, if an executive manager performs his duties and achieves his goals proficiently, the shareholders may provide incentives (e.g., stock grants, options etc.), in order to correlate the benefits of the agents and shareholders [3]. Hence, “the agency theory provides an integrative analytical framework that can be used in analyzing how corporate governance systems can successfully reduce opportunistic managerial behavior and in the process secure a fair return on investment for the suppliers of finance” [8] (p. 250).
For all that, the board remuneration systems had difficulties to settle the agency problems by not being able to efficiently avoid the opportunistic behavior of the executive management. The compensation programs should be developed in order to motivate board directors and, at the same time, to implement programs defined to increment the wealth and performance of the company [9]. Therein, “board compensation should be high enough in order to attract competent and experienced directors and to reward their duties” [30] (p. 28). Board compensation has to be established in an objective way taking into consideration the talent of the executive management and the corporate governance’s principles of the company. The compensation program should not be developed on short-term objectives, as it may encourage opportunistic behaviors, which may be opposed to the long-term goals of the company [2].
Following the research of Pfeffer and Salancik [31], the boards of directors sustain companies to increment their performances by decreasing the influence of the external factors. In order to increase company performance, the theory of Pfeffer and Salancik [31] mentions, as a growth vector, the efficiency of the corporate governance system, which, in return, generates an increased credibility of the company and scales up investment attractiveness [2]. As sustained by Aslam et al. [32] (p. 188), “even though the board remuneration framework is relevant, the design of an efficient remuneration system is challenging, because the endeavors of managers are hard to quantify and also their choices influencing the performance of the company cannot generally be precisely examined.”
There have been some limitations, also highlighted, concerning board compensation programs. These limitations have focused especially on board capacity in attempting to reveal the elements that impact the board compensation decision [33,34,35]. The reason is that “CEOs are in the position to determine their own compensation, based on their ability to influence board behavior” [19] (p. 61). Other researches point to some driving factors which are related to the power of the CEOs: “CEO tenure, CEO ownership, board size, firm size and board ownership” [35] in [19] (p. 61).
The studies on corporate governance with highlight on board compensations emphasized the need to move beyond a simple examination of the effects of board composition (board size, board independence, gender diversity) on the company performance, the interests should be more and more focused on board processes and behavioral aspects pertaining the corporate governance processes [36,37,38].

2.2. The Relationship between Board Compensation, Corporate Sustainability and Company Performances

Over the last two decades, the researches focusing on the relationship between board compensation and company financial performance in the context of corporate sustainability displayed rich progressive findings within the management literature [4].
Following the agency theory principles, the connection between board compensation and company performances should ensure an essential incentive mechanism, developed to increment the wealth and performance of the company. Therefore, many approaches have investigated this linkage between the board compensation and the performances of the company [4,5,6,7].
In this regard, using a database from Kenyan banks, Molonko [5] underlined that board compensation is favorable linked with the performance of the company. Same results are sustained by the findings of Watson and Wilson [20], showing that board compensation is positively associated with the company performances, sustaining also the alignment role performed between managers and owners, as suggested by the agency theory. Moreover, Conyon and He [6], Barbu and Ponea [39] and Crăciun et al. [40] highlight that an increment of the board compensation is positively connected with the wealth growth of the shareholders.
As professed by Andreas et al. [7] and Nitescu and Cristea [16], board remuneration and structure represent significant instruments for corporate governance process, particularly for companies where other corporate governance mechanisms are inadequate, with a positive influence on the performance of the company. Consistent with these results, Müller [41] tried to determine the results of corporate governance tools related to board remuneration on the financial performance (calculated as ROA and ROE). The findings highlight that well-rewarded board members perform better by enhancing the company’s performance. Following the research of Perry and Zenner [42], the changes in the board remuneration pattern significantly influenced performance of the companies. Using a database of firms from Australia, the research of Merhebi et al. [43] underlines a strong and positive linkage between the board remuneration and company performance.
In a different research, Barontini and Bozzi [21] investigated the relationship between corporate ownership, board remuneration and financial performance. The results of their research attested a strong connection between board remuneration and financial performance, although exorbitant compensation was, on the other hand, not linked to the future performance of the company. The research asserted that “transparency and control mechanisms are very important in providing governance and oversight over board compensation in order to ensure future performance” [8] (p. 249), ensured by CSR mechanisms.
The findings of the study of Miyienda et al. [44] (p. 15) that explored the linkage between board remuneration and company’s performance prove a positive connection between “board remuneration and financial performance, using three financial KPIs: return on equity (ROE), earnings after taxes (EBIT), and Tobin’s Q, with a weak relationship with ROE and Tobin’s Q, but a moderately strong relationship with earnings after taxes (EBIT).” This dissimilarity implies that manager’s remuneration is interlinked to raw financial performance measures (earnings after taxes); this can be considered a sign of an agency problem, where managers benefit from raw returns, but do not work to the aim of improving the performance of the company [8].
Using a database from Malaysia for one financial year, Yatim [45] studied board remuneration and corporate governance. The results showed that manager’s remuneration is favorable interlinked to financial performance and growth opportunities. In contrast, the study showed that the director’s remuneration was, in a significant manner, negatively linked to the independence of the board. There is an important limit of this research, namely the study only used financial performance indicators during a one-year period of time.
In most research papers, the board compensation has been linked to the company’s performance, but, on the other hand, it should be noted there has been also a strong scale up in the manager’s compensation, regardless of their performances [46]. There can be emphasized several possible explanations for the conflicting results shown by different studies:
  • the institutional discrepancies across countries in which these studies were conducted [8]. For example, there are differences in studies which have been carried out in the European context [47,48] and studies that have been developed in Asian countries [49,50,51,52] and in the Middle East [53,54];
  • the institutional discrepancies between countries partially explain the inconclusive results for the linkage between corporate governance and performance and, at the same time, “raise concern about whether the principles of corporate governance which originated from developed countries are applicable in other countries” [8] (p. 249).
However, research on the compensation-performance linkage has generated also inconclusive outcomes. According to the research of Attaway [55], it can be concluded that there is a poor linkage between profitability and board remuneration, while Madura et al. [56] could not detect any bond between board compensation and company’s performance. Moreover, Fernandes [18] provided evidence of an insignificant relationship between board remuneration and company’s performance within Portuguese firms.
The findings of Gregg et al. [57] established a weak linkage between remuneration and company’s performance. Consistent with this study, Brick et al. [58] and Haron [59] identified a poor positive connection between the board remuneration and performance. Brick et al. [58] and Akter et al. [17] also sustained that an excess in board remuneration generated underperforming outcomes of the companies due to weak or lack of corporate governance control.
If we also take into consideration the vector of corporate sustainability defined as “a wide range of business processes that voluntarily deal with triple bottom line performance (profit, people, planet) in order to remain fundamentally sustainable in long-term value creation” [4] (p. 4), many studies partly support the linkage between board compensation, corporate sustainability and financial performance, which are in line with the agency theory. Some of the findings highlight that the direct linkage between the indicators is a positive one [4,60,61,62,63], whilst other studies have generated negative outcomes of these relationship [64,65,66].
Summarizing, we have noticed that: the implications of board compensation on company’s financial performance is, mostly, a favorable one, but this remuneration has to be done with caution, in the context of corporate sustainability and corporate social responsibility; a redundancy of board remuneration may engender low performances of the companies due to weak governance control sustainability.

3. Research Hypotheses, Data and Methodology

3.1. Research Hypotheses

In the light of our general research objective and the most relevant literature findings, we have established to assess the following research Hypotheses (H) for the companies with the headquarters in Europe:
Hypothesis 1.
There are significant direct influences induced through the management financial incentives, corporate governance, board characteristics and sustainable development dimensions on the financial performance of the European companies.
Hypothesis 2.
There are significant overall influences of the management financial incentives, corporate governance, board characteristics and sustainable development dimensions on the financial performance of the European companies.

3.2. Data and Indicators

Our sample covers 1594 companies from various industries (Thomson Reuters Business Classification) having the headquarters in Europe, namely, Austria (34), Belgium (49), Cyprus (3), the Czech Republic (3), Denmark (41), Finland (37), France (149), Germany (169), Greece (10), Guernsey (20), Hungary (4), Ireland (44), Italy (52), Luxembourg (16), Malta (4), the Netherlands (68), Norway (52), Poland (42), Portugal (12), Russia (32), Slovenia (1), Spain (49), Sweden (131), Switzerland (131), Ukraine (1) and the United Kingdom (440). The data were extracted from Thomson Reuters Eikon database from 2019 [14] including updates in the first months of 2020. Summary statistics of all indicators used in the econometric analysis for the entire sample of 1594 firms are presented in Table A1. We have selected several indicators linked to our main research objective, clustered in four categories:
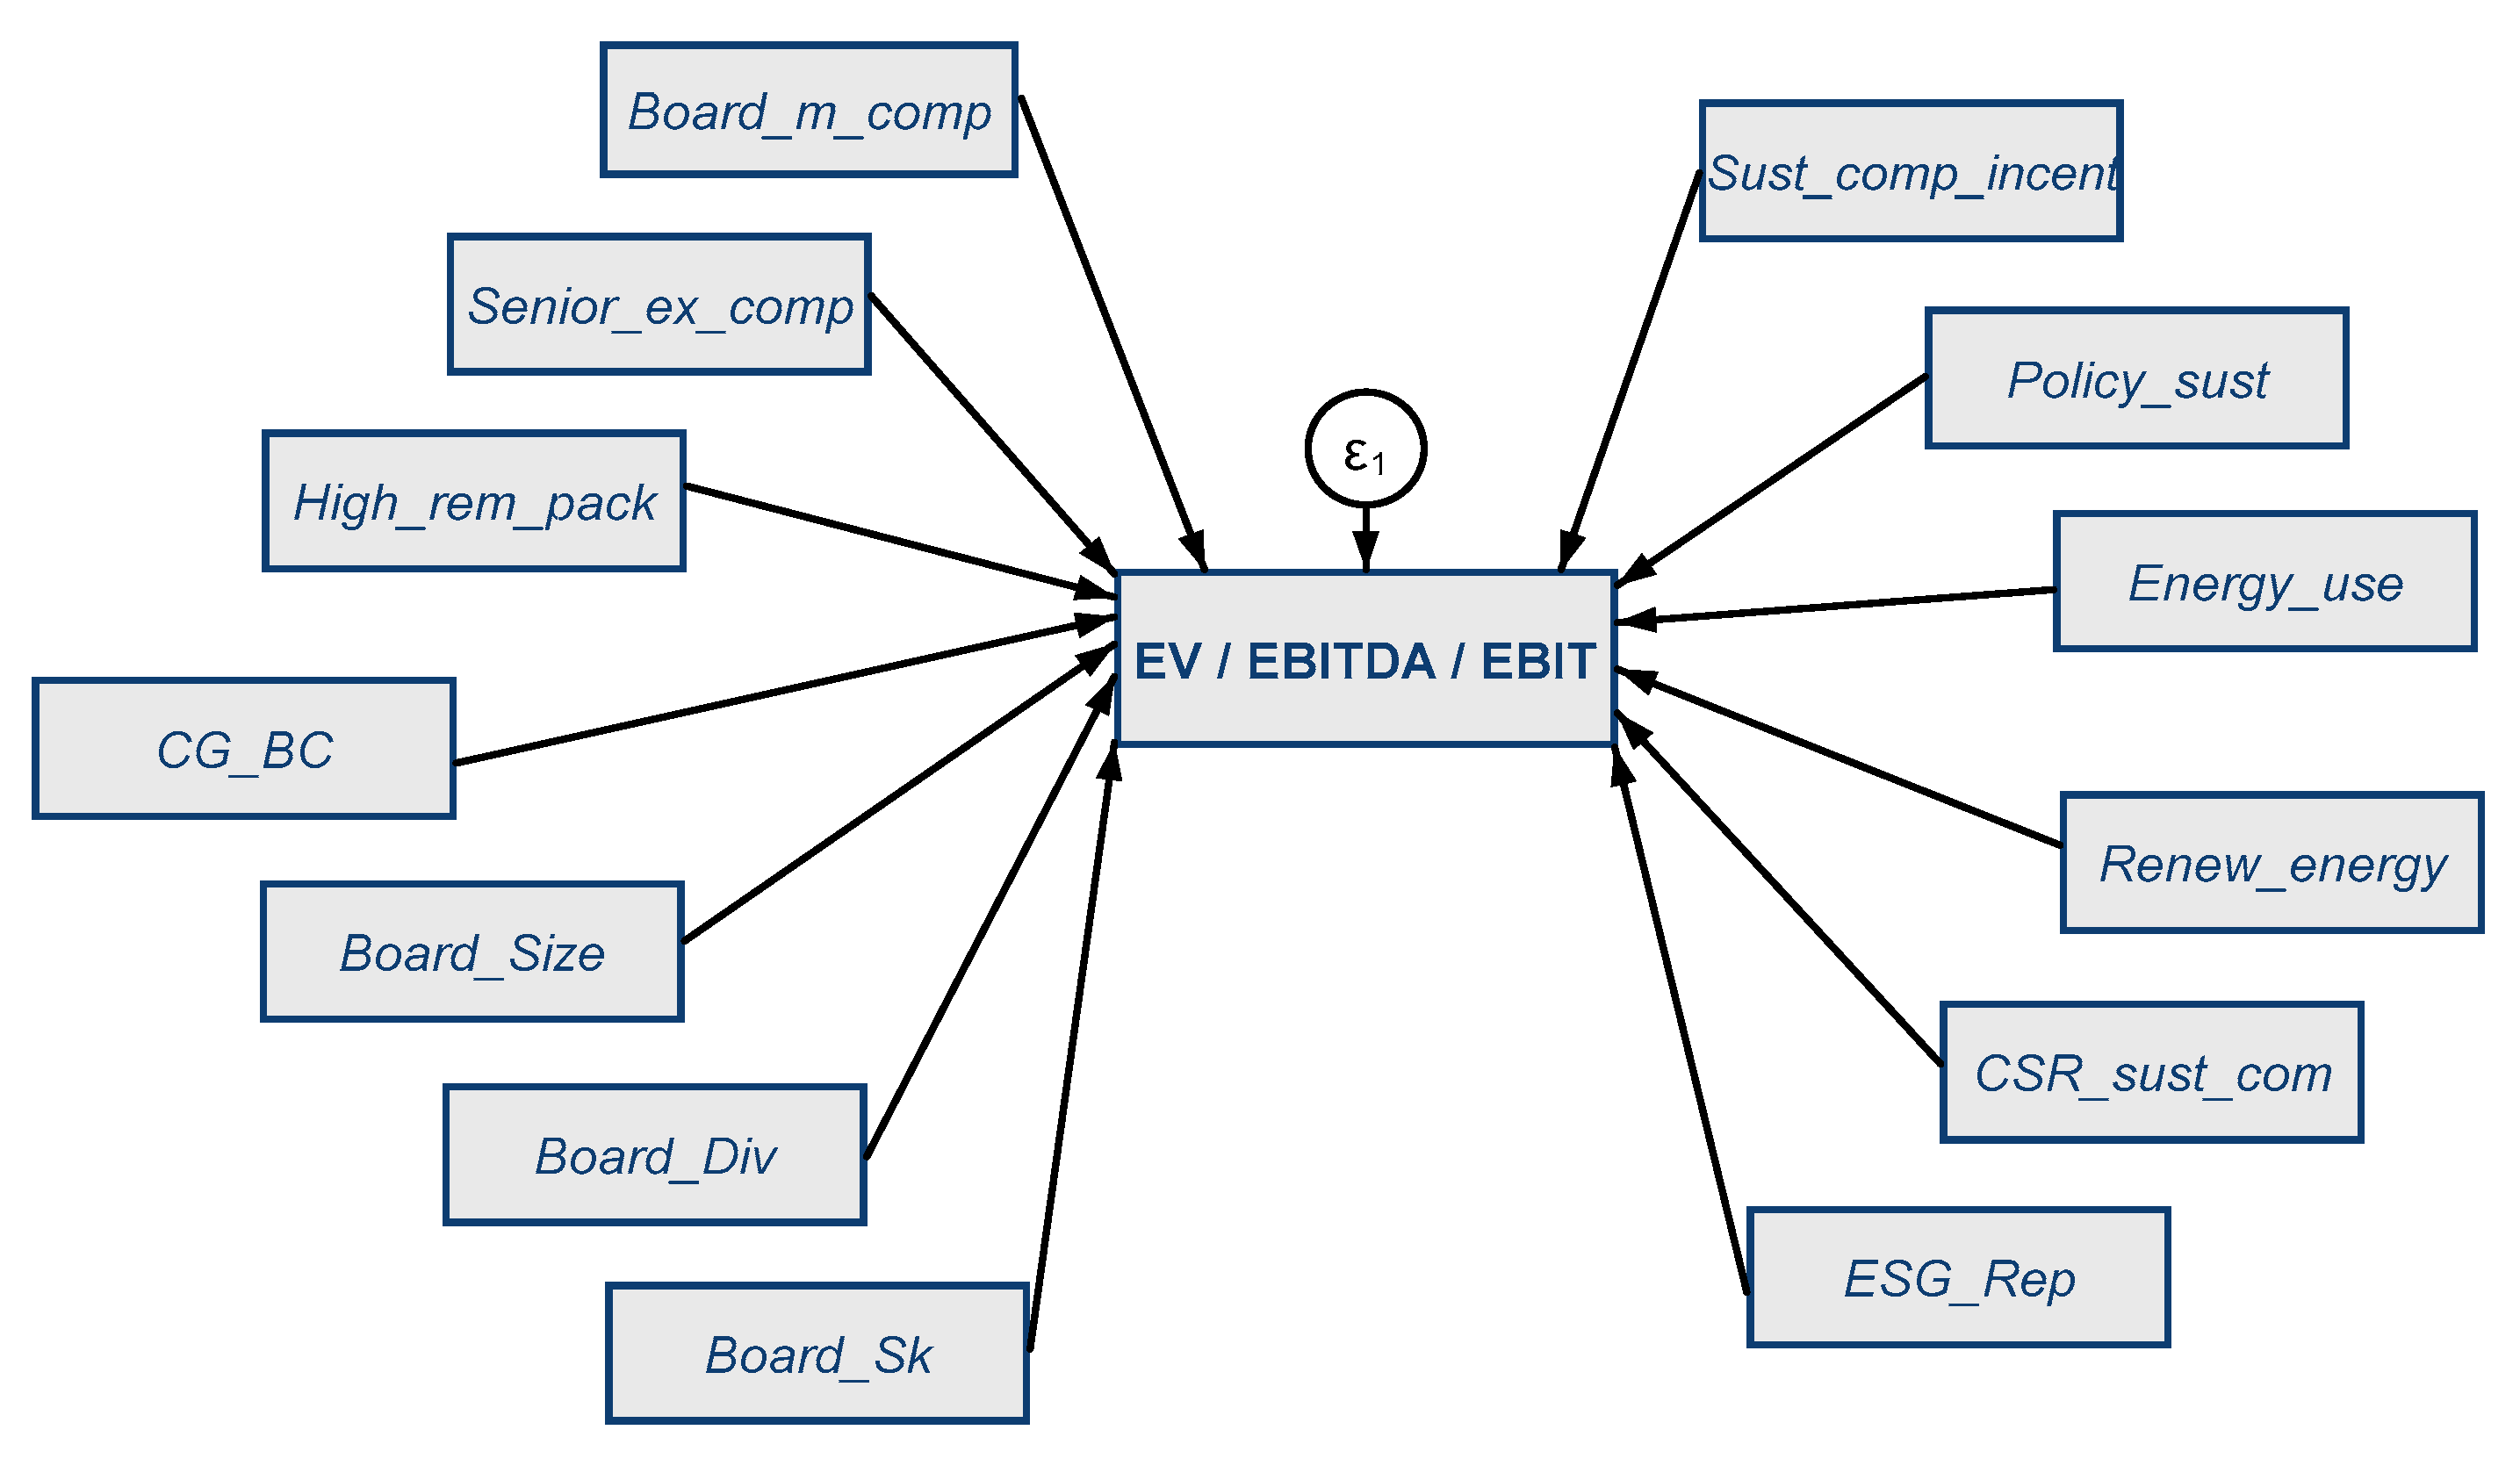
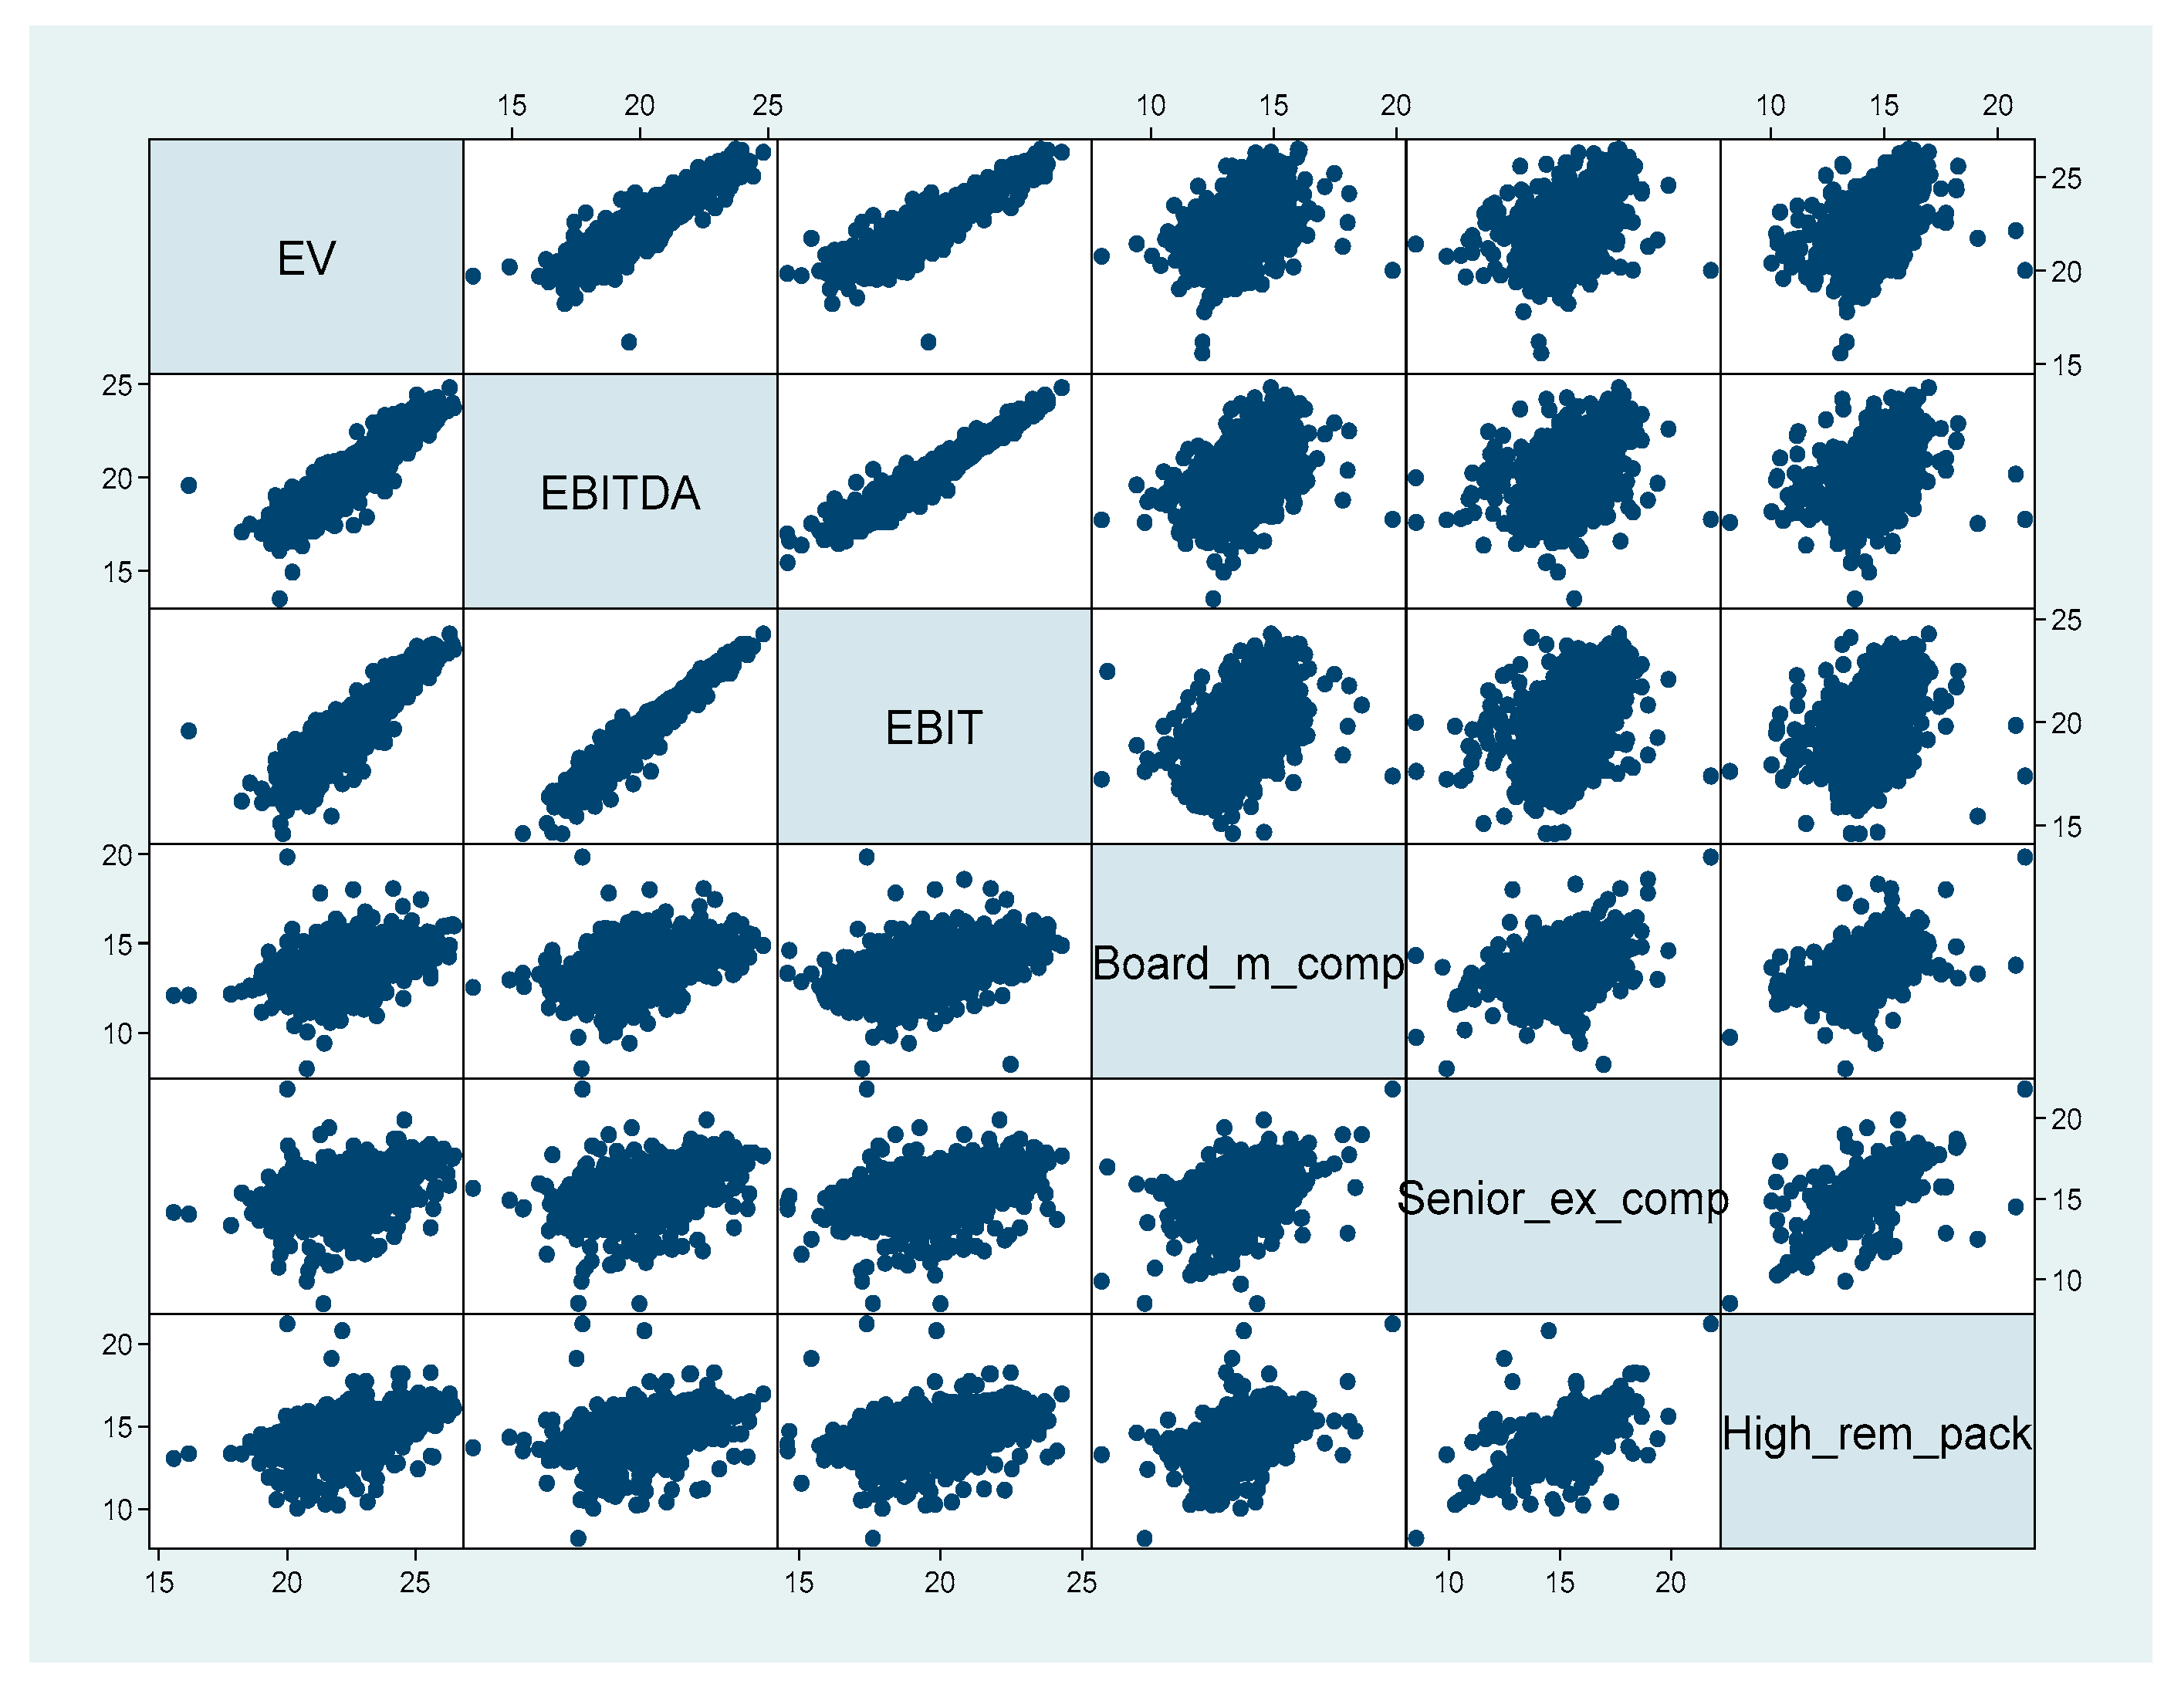
  • firm performance indicators: Enterprise value—EV (mean, next fiscal year—FY1, United States Dollar—USD), Earnings before interest, tax, depreciation and amortization—EBITDA (mean FY1, USD), Earnings before interest and taxes—EBIT (mean, FY1, USD);
  • firm size: Total assets—Assets (mean, FY1, USD);
  • management financial incentives: total board member compensation—Board_m_comp (prior fiscal year—FY0, USD), total senior executives’ compensation—Senior_ex_comp (FY0, USD), highest remuneration package—High_rem_pack (FY0, USD);
  • corporate governance and board characteristics: corporate governance board committee—CG_BC (FY0, binary, yes = 1, no = 0), board size—Board_Size (FY0, number), board background and skills—Board_Sk (FY0, binary, yes = 1, no = 0), board gender diversity—Board_Div (percent, FY0);
  • sustainable development credentials: Environmental, Social and Governance (ESG) reporting scope—ESG_rep (FY0, percent), Corporate Social Responsibility (CSR), sustainability committee—CSR_sust_com (FY0, binary, yes = 1, no = 0), Energy use total—Energy_use (FY0), Renewable energy use—Renew_energy (FY0, binary, yes = 1, no = 0), Policy sustainable packaging—Policy_sust (FY0, binary, yes = 1, no = 0), Sustainability compensation incentives—Sust_comp_incent (FY0, binary, yes = 1, no = 0).

3.3. Methodology

The research methodology is strategically based on various methods and instruments so as to ensure that final estimates are robust, accurate and reliable for a correct interpretation. Three econometric techniques are therefore employed, namely: (i) multifactorial models processed through robust regressionRREG (based on Cook’s distance, with Huber and Biweight iterations that cope with outliers, autocorrelation and ensure robust estimates) and two-stage least squares (2SLS/IV) estimator deployed in order to pin down the causality issue and potential endogeneity; these models are built to assess the first hypothesis regarding the direct influences induced through the financial incentives for the management, corporate governance, board characteristics and sustainable development credentials on each considered financial performance indicator; (ii) structural equation models (SEMs), including generalized structural equation models in light of the latent class analysis (LCA) (Gaussian family) in order to appraise the second hypothesis concerning the overall interlinkages between all variables and their influence on each considered financial performance indicator; and (iii) Gaussian Graphical Models (GGMs), for overall evaluation of all considered variables interconnections in a network analysis. Multifactorial and SEM models, including LCA, are processed in Stata 16 (StataCorp LLC, College Station, TX, USA) and GGMs are configured in R 3.6.3 (The R Foundation for Statistical Computing, Vienna, Austria).
Robust regression (RREG) has been selected as a first method applied in the empirical endeavor since it addresses the outliers in our data given that there are 1594 companies of different sizes and from various industries. RREG is a modern estimation method that ensures robust results, going beyond the classical OLS, by weighting and re-weighting the observations based on how well they perform. Hence, RREG firstly runs the OLS, extracts the Cook’s distance (D) for each observation, then drops the observations with a value for Cook’s D greater than 1, and initiates the iteration process based on two different kinds of weight—Huber and Biweight—each tackling difficulties with severe outliers and multiple solutions, being very efficient [67], including to cope with causal inference and endogeneity. The patterns of the RREG multifactorial models were designed for each considered financial performance indicator, namely: Enterprise value—EV, Earnings before interest, tax, depreciation and amortization—EBITDA, and Earnings before interest and taxes—EBIT, in relation to the independent variables (management financial incentives, corporate governance and board characteristics and sustainable development dimensions), presented in Equations (1) and (2).
E V / E B I T D A / E B I T = δ + β M F I + β S D D + β C G B C + θ i + λ t + ε
E V / E B I T D A / E B I T = δ + β 1 B o a r d _ m _ c o m p + β 2 S e n i o r _ e x _ c o m p + β 3 H i g h _ r e m _ p a c k + + β 4 S u s t _ c o m p _ i n c e n t + β 5 P o l i c y _ s u s t + β 6 E n e r g y _ u s e + β 7 R e n e w _ e n e r g y + β 8 C S R _ s u s t _ c o m + + β 9 E S G _ r e p + β 10 C G _ B C + β 11 B o a r d _ S i z e + β 12 B o a r d _ D i v + β 13 B o a r d _ S k + θ i + λ t + ε
where:
  • MFI—Management Financial Incentives indicators (Board_m_comp, Senior_ex_comp, High_rem_pack);
  • SDD—Sustainable Development Dimensions indicators (Sust_comp_incent, Policy_sust, Energy_use, Renewable_energy, CSR_sust_com, ESG_rep);
  • CGBC—Corporate Governance and Board Characteristics indicators (CG_BC, Board_Size, Board_div, Board_Sk);
  • δ and β—parameters that need to be estimated;
  • ε—stochastic element;
  • θ i and λ t —variables accounting for spatial and time effects.
Moreover, as previously stated, the regression models are also processed through the 2SLS/IV estimator in order to cope with the causality issues and potential endogeneity. The method instruments firm size is measured through the log of total assets (Assets) as a key variable in this area that affects the other variables (dependent and independent ones) as Dang et al. [68] and Coles and Li [69] have entailed. We have selected total assets as a proxy for firm size since it basically represents a total of firm resources and is a widely used measure with robust estimates as evidenced by numerous studies [68,69,70,71,72,73,74].
The methodological endeavor also relies on Structural Equation Modelling (SEM). SEM represents an advanced technique used in the analysis of multivariate data, much more complex than general regression models, since they embody variables in their direct, indirect and total connections, as well as latent hypothetical constructions that can be represented by groups of observed variables. Also, SEM was used to cope with endogeneity since it allows unobserved components in the equations and correlation between equations and multilevel modelling (unobservable correlation in multiple equations), the estimation being made through maximum likelihood [75]. The general diagram of the SEM models, presented in Figure 1, is built for each considered financial performance indicator (EV, EBITDA and EBIT) within the overall interlinkages of all considered variables.
The classical SEM model has been complemented in our research by generalized structural equation modelling through latent class analysis (LCA), with another model deployed from the Gaussian family. Along these lines, in the final stage of our research endeavor, we have implemented the network analysis through Gaussian graphical models (GGMs). The GGMs with network component allow to assess the intensity of the connections between the considered variables, as well as the structure within the network analysis [76,77]. The models estimation is designed through partial correlation (PCOR) and extended Bayesian information criterion (EBIC) with graphical lasso.

4. Results and Discussion

4.1. Results of Econometric Models (Robust Regression)

The results of econometric models (Table 1) processed through robust regression (RREG, Huber and Biweight iterations), show that most of the considered variables have a significant positive influence on firms’ financial performance, and the most substantial of these is registered on companies’ earnings (EBITDA, R2 = 0.653, and EBIT, R2 = 0.564). Idem, management financial incentives, reflected by board member compensation (Board_m_comp) and highest remuneration package (High_rem_pack), have a positive and statistically significant influence (p < 0.001) on both enterprises’ value (EV), and companies’ earnings (EBITDA and EBIT). The same favorable influence upon companies’ earnings was registered for the senior executives’ compensation (Senior_ex_comp) (statistically significant only in the case of EBITDA, p < 0.05). The results are consistent with those obtained by Molonko [5], Conyon and He [6], Perry and Zenner [42], Merhebi et al. [43] and Miyienda et al. [44], especially with regard to the relationship between board compensation and earnings after taxes (EBIT). 2SLS/IV estimations reconfirm and reinforce RREG main findings.
Besides the positive and statistically significant estimated coefficients associated with the credentials of financial incentives for the management, and the good fit entailed by high values of the R2, which grasp that more than half of the variation in the financial performance indicators used as dependent variables in multiple robust and IV regression models can be explained through the variations in selected explanatory variables, the strong correlation between firm performance and management incentives (Board_m_comp, Senior_ex_comp and High_rem_pack) is also entailed by the graphical correlation matrix presented in Figure 2.
Moreover, the results detailed in Table 1 highlight that except for the ESG reporting scope (ESG_rep) and the presence or absence of the sustainability compensation incentives (Sust_comp_incent) (the results are not statistically significant), all the other sustainable development dimensions, namely the existence of the CSR sustainability committee (CSR_sust_com), the use of energy (Energy_use) and of the renewable energy (Renew_energy), and also the implementation of a policy sustainable packaging (Policy_sust), have positively and statistically significant influenced the financial performance of the selected European companies. Similar findings were obtained by Barontini and Bozzi [21], Ruparelia and Njuguna [8] and Chen et al. [78], that underlined the paramount role of CSR mechanisms for financial performance of the companies [79].
Likewise, the variables included in corporate governance (CG) dimension, namely the existence of corporate governance board committee (CG_BC), and management characteristics (board size—Board_Size, and gender diversity—Board_Div) have positively and statistically shaped the main dimensions of financial performances of companies in a significant way, more noticeable for earnings (EBIT, model 3), in the case of all variables. At the same time, there are also other unobserved management characteristics that can yield the problem of endogeneity, as entailed by Coles and Li [69]. The European companies value (EV, model 1) is the most substantially marked by the existence of corporate governance board committee (CG_BC) (coefficient is 0.366, p < 0.001). The role of corporate governance mechanisms upon performance of a company was also stressed out by Andreas et al. [7], Müller [41] and Yatim [45], though jointly with the implications of board remuneration.
We also note that the coefficients of firm size measure (Assets) are positive, robust in sign and statistical significance. Moreover, the goodness of fit measured by R-squared significantly improves for the models instrumenting firm size as an important credential affecting financial performance. As firm’s size increases, the firm will tend to perform better due to upturn operating as well as financing efficiency, economies of scale and production efficiency [80]. Rahman et al. [81] found the same positive association in the context of listed manufacturing firms in Bangladesh.
In the light of the results obtained, we assess that our first Hypothesis H1: There are significant direct influences induced through the financial incentives for the management, corporate governance, board characteristics and sustainable development dimensions on the financial performance of the European companies, is fulfilled.

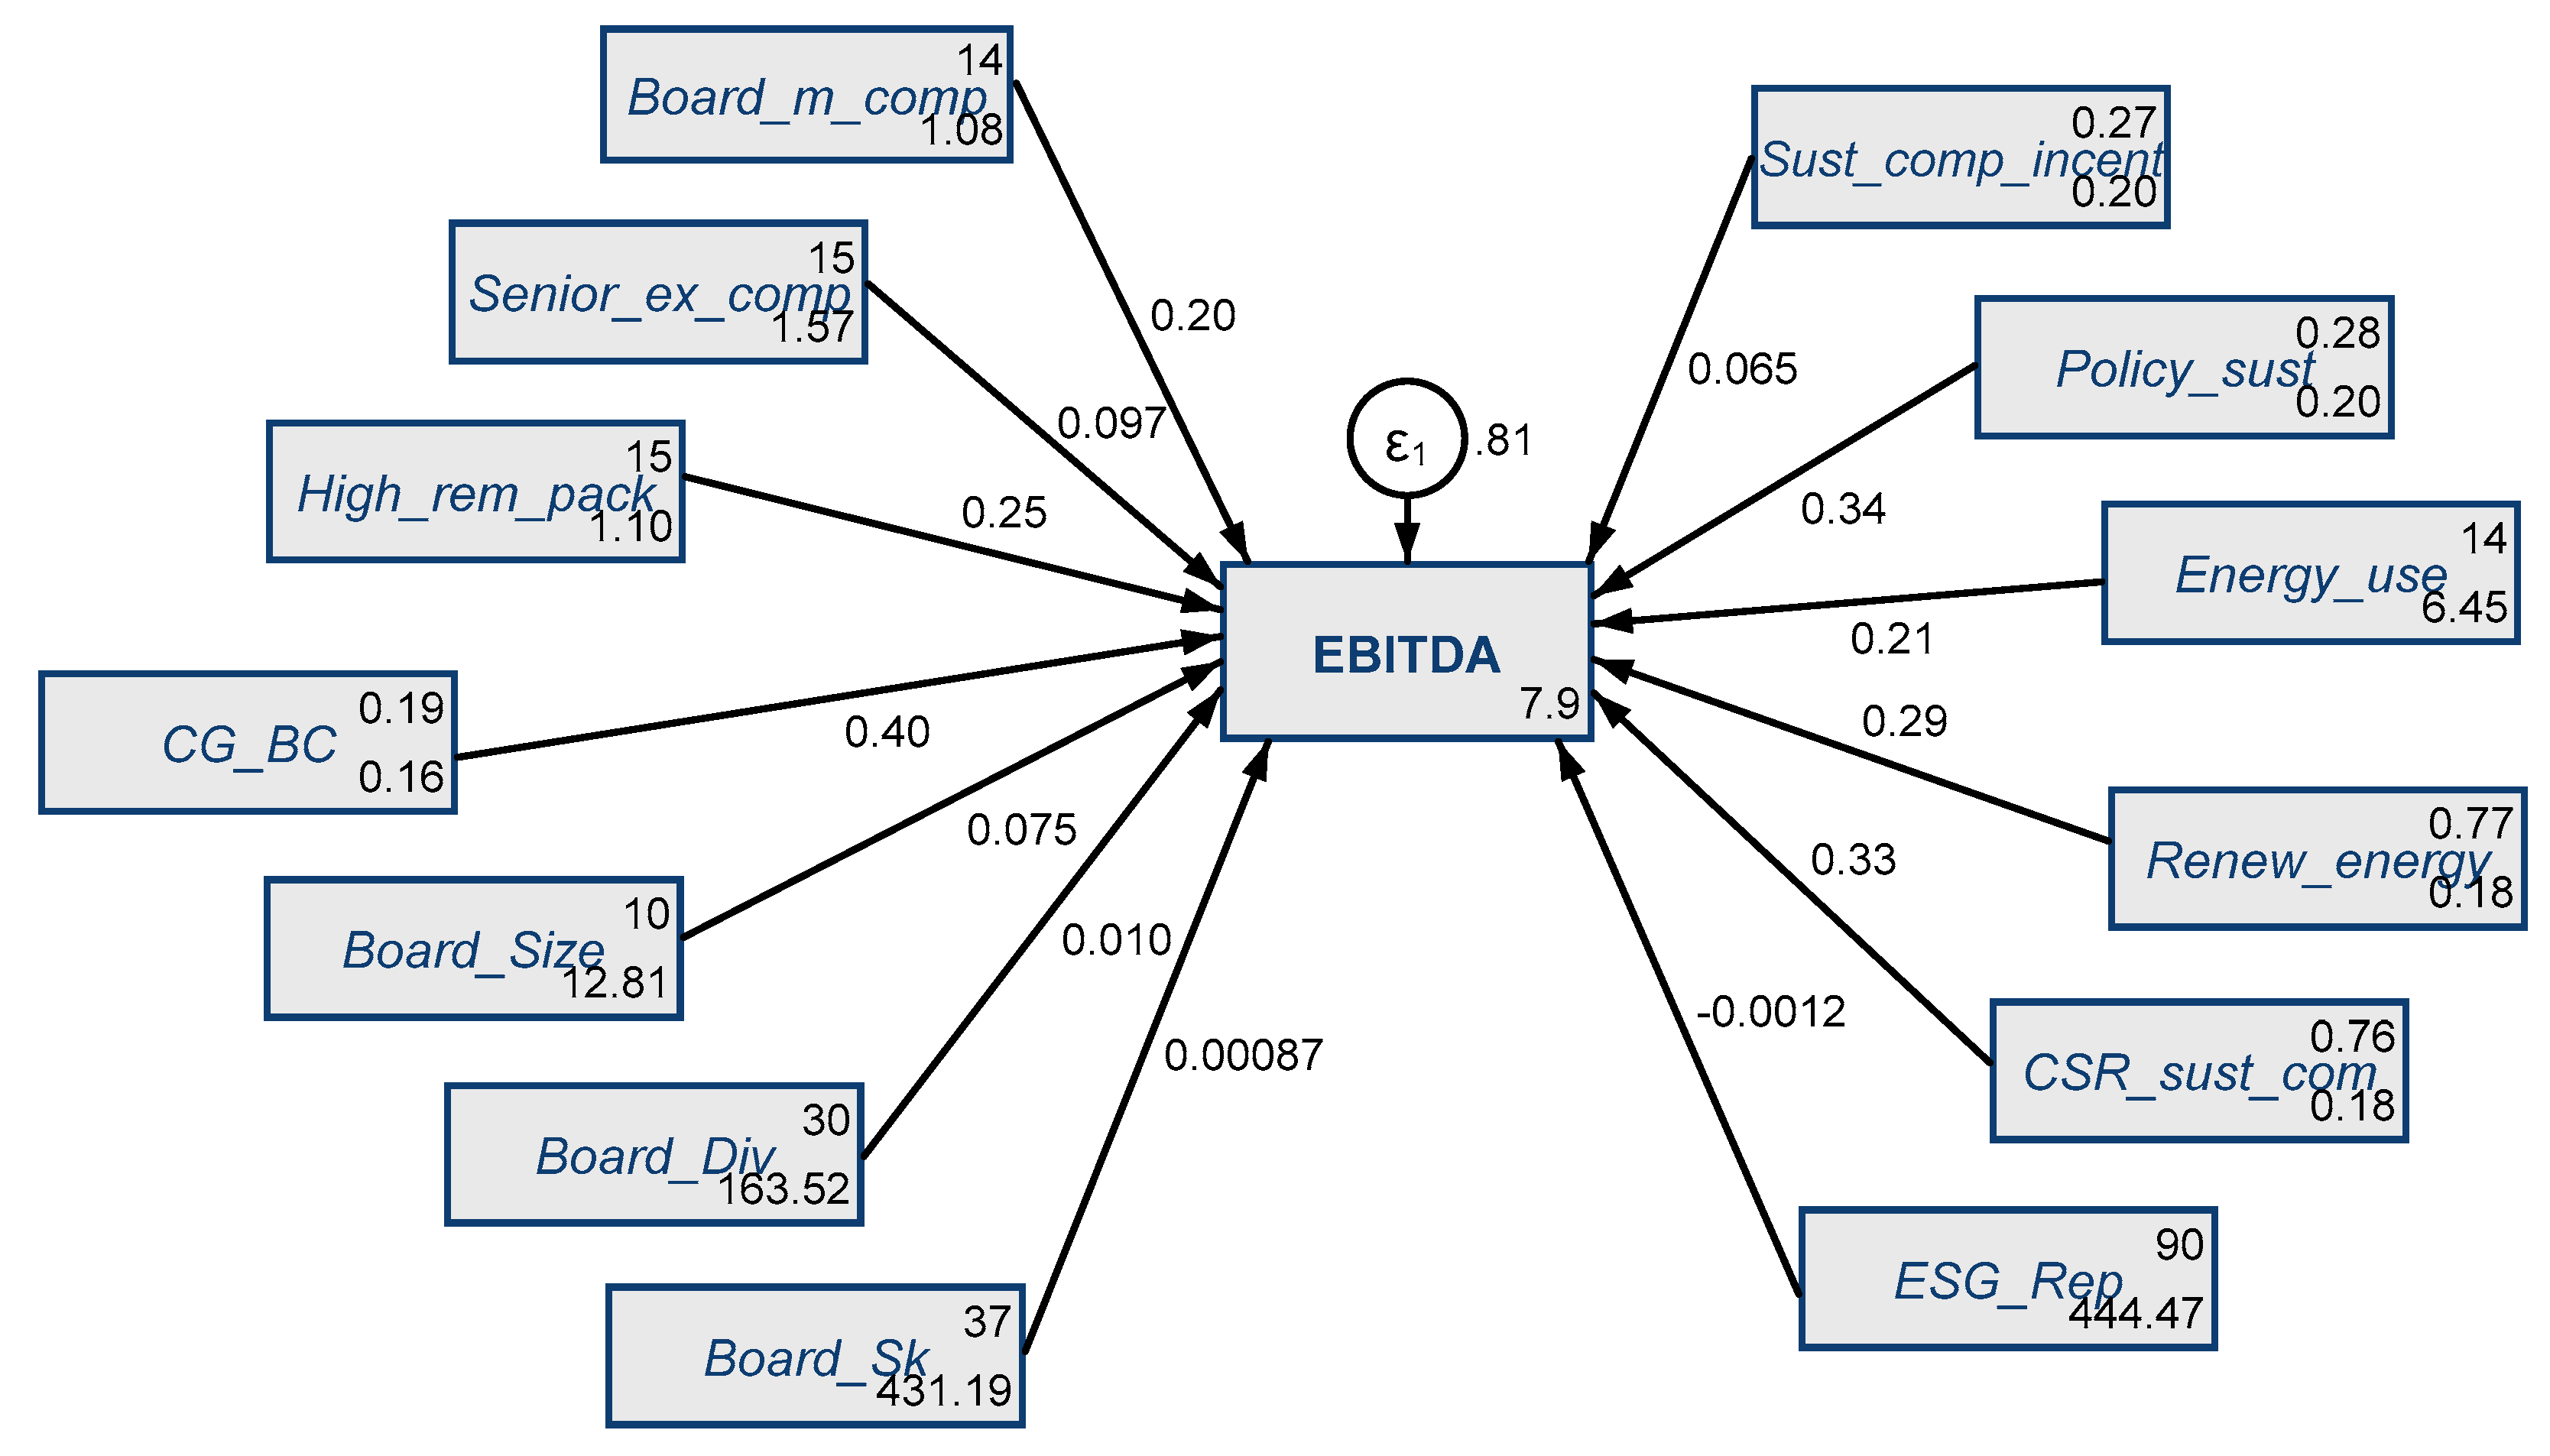
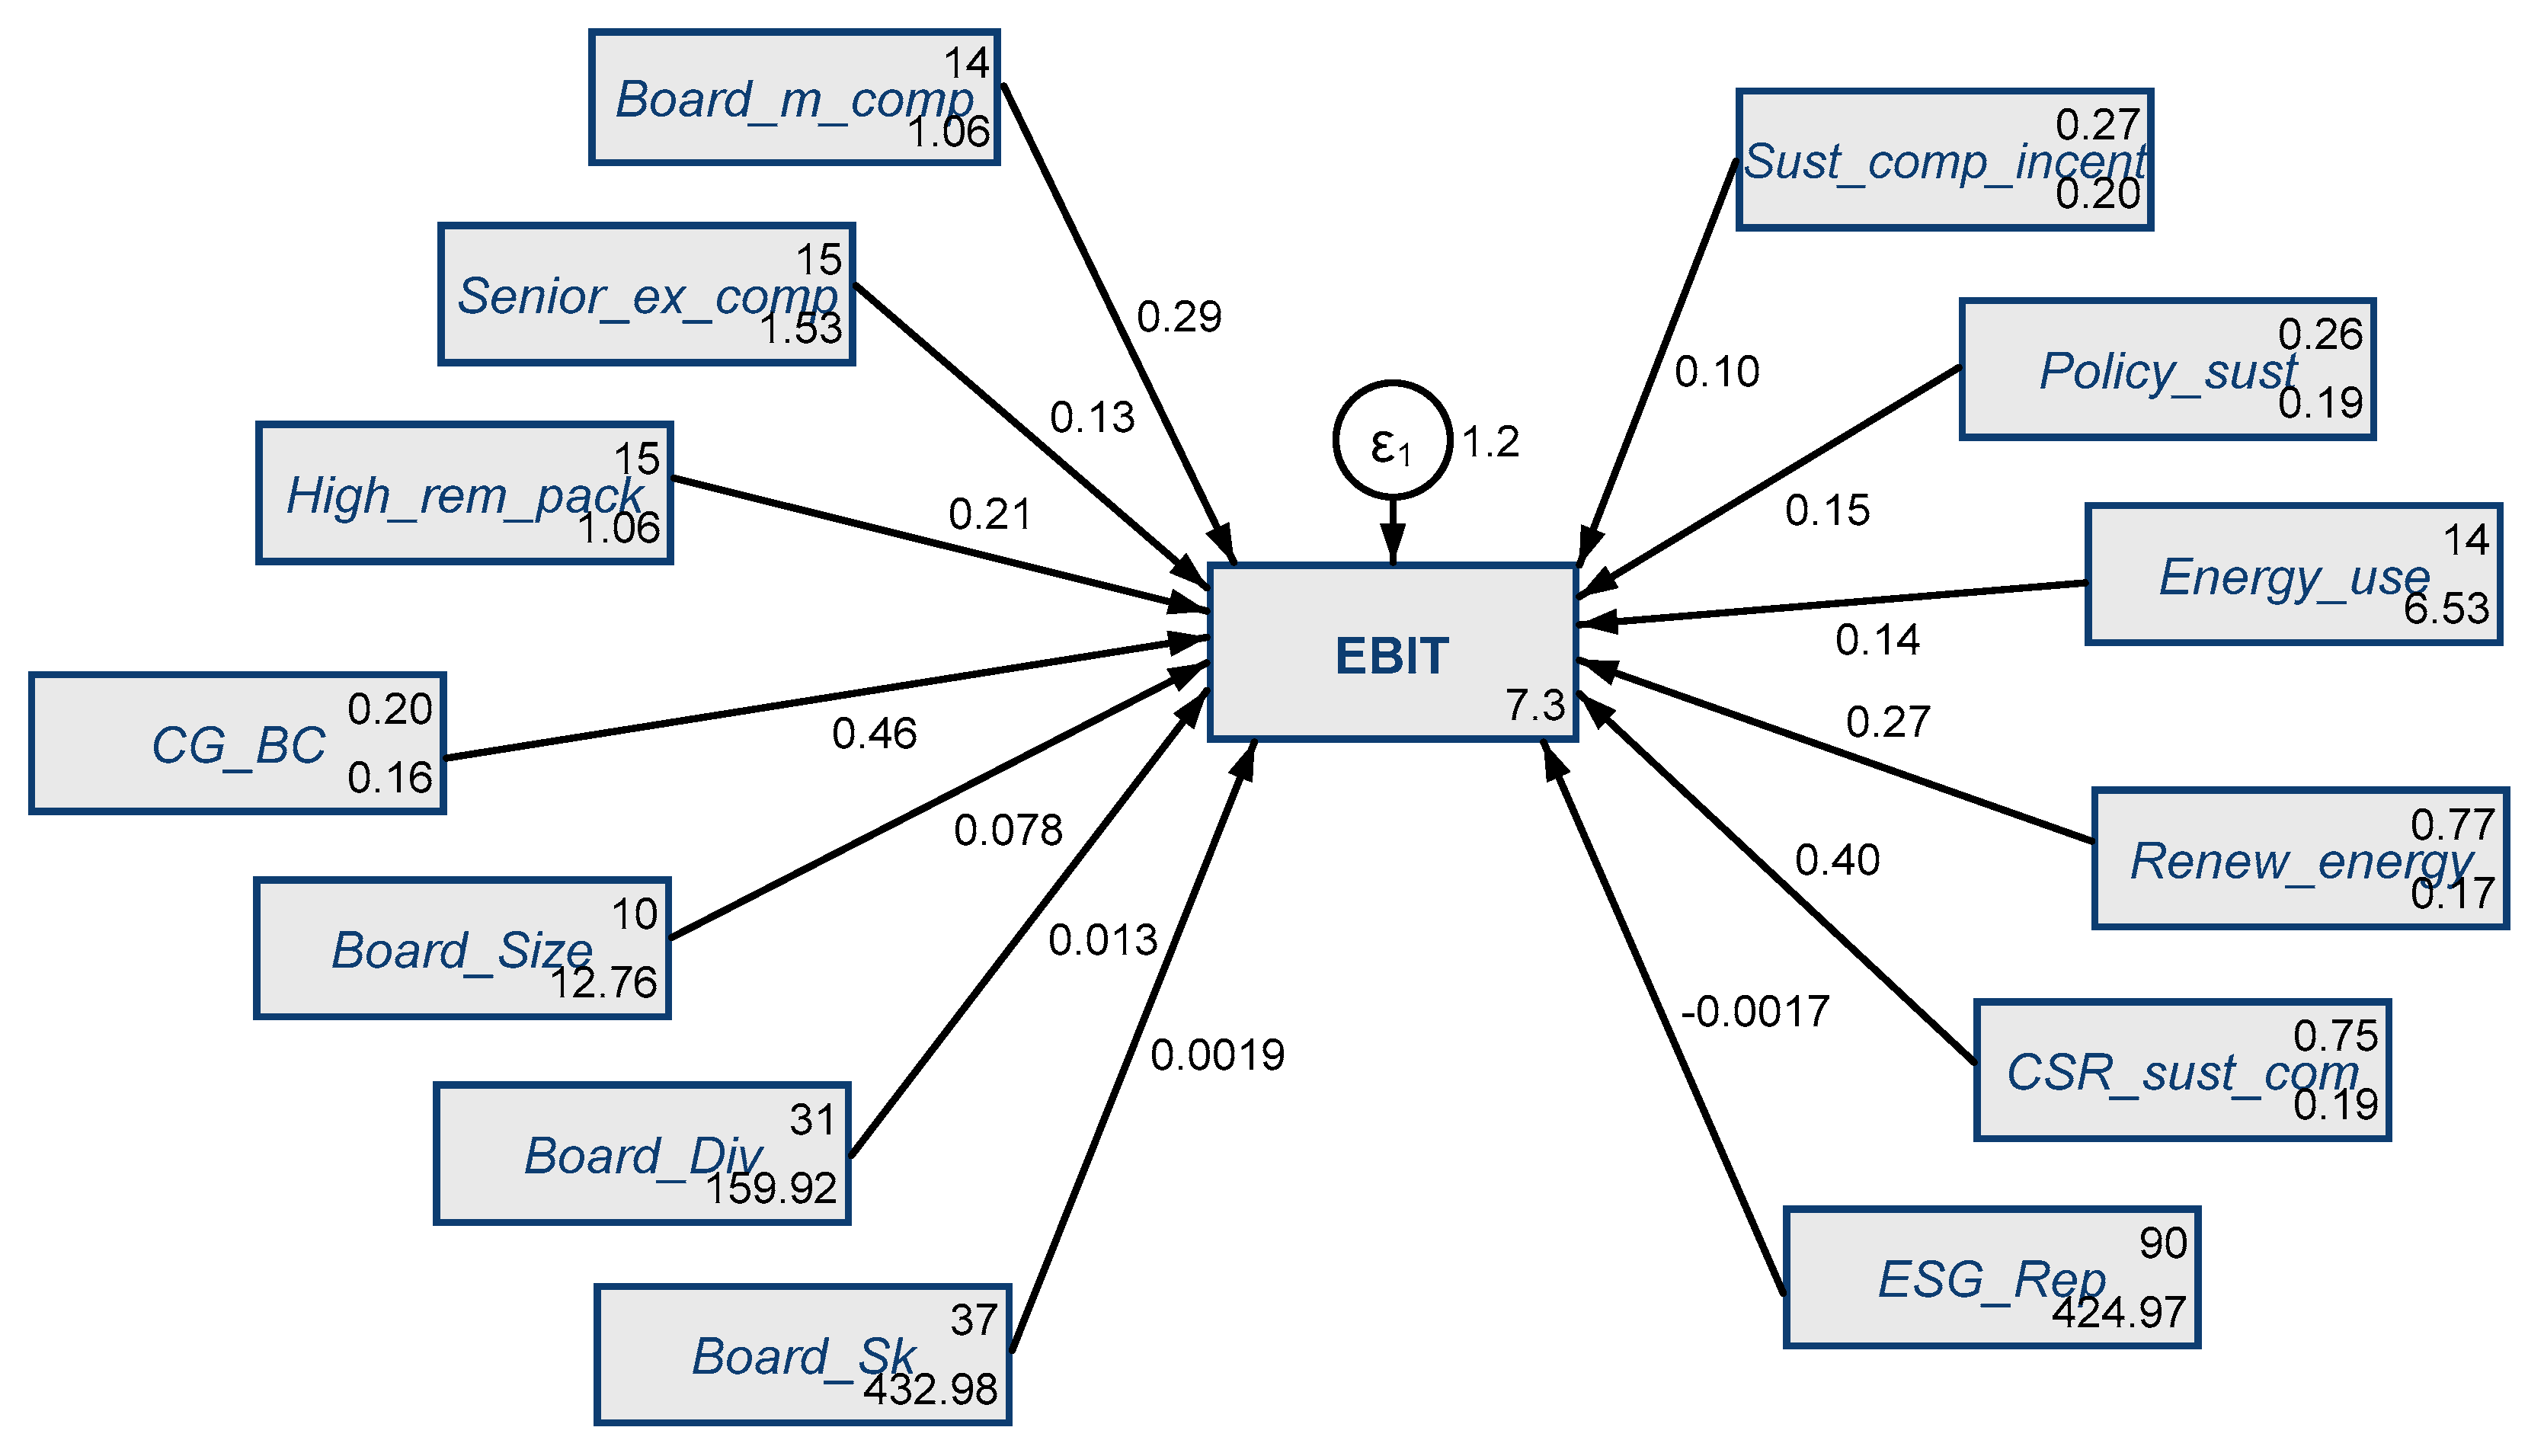
4.2. Results of Structural Equation Models (SEMs)

To assay the extent to which the three clusters of variables considered (namely, financial incentives for the management, sustainable development dimensions, and corporate governance and board characteristics) have overall influenced the financial performance of considered firms (the second Hypothesis H2), we have applied the SEM for each of the dimensions considered, namely the company’s value (EVFigure 3) and earnings (EBITDAFigure 4, and EBITFigure 5).
SEM models were processed using the Maximum Likelihood Estimator (MLE) method with missing values, inasmuch as some variables do not confer all values. In order to endorse the SEMs’ results, we have firstly checked specific tests for SEM confidence (Cronbach’s Alpha test, total scale of coefficient Alpha is over 0.7 for each considered model) (Table A3), the Wald test (p-value is 0.000 for each equation) (Table A4), and the Goodness-of-fit tests (Table A5), which reveal that the Comparative fit index (CFI) and Tucker–Lewis index (TLI) have the highest value of 1, having a very good degree of fit. The coefficient of determination (CD) evidence that, in a proportion over 50% (in case of EV and EBIT), and of 64.2% (in case of EBITDA), the variables considered have influenced the financial performance of the European companies.
As for the overall implications of management financial incentives upon the financial performance of considered European companies, the results are similar with those obtained in case of multifactorial econometric models (direct implications), both for Enterprises’ value (EV) (Figure 3), Earnings before interest, tax, depreciation and amortization (EBITDA) (Figure 4) and Earnings before interest and taxes (EBIT) (Figure 5). More specific, board member compensation (Board_m_comp) positively and statistically significant (p < 0.001) influenced all dimensions of the considered financial performances of the companies, more pronounced for Earnings before interest and taxes (Figure 5, Table A2) (the coefficient is 0.290). The highest remuneration package (High_rem_pack) has significantly influenced the financial performance of selected companies, especially the enterprises’ value (the coefficient is 0.388, p < 0.001) (Figure 3, Table A2). The senior executives’ compensation (Senior_ex_comp) has also induced a positive impact on European companies’ earnings (statistically significant in the case of EBITDA and EBIT) (Table A2). We emphasize that the causality between financial compensation of the management and financial performance may be also reversed or even bidirectional. However, in terms of empirical accuracy, the robust regression method overcomes the autocorrelation and causality problem, thus ensuring robust results, since it tackles the outliers and weights the observations differently based on how well they perform (basically, it configures a weighted and reweighted regression). Same robustness checks and validity is ensured by the IV procedure.
Furthermore, the presence of corporate governance board committee (CG_BC), board size (Board_Size) and its gender diversity (Board_Div) have induced favorable overall influences (statistically significant, p < 0.001) on the financial performance dimensions, more predominantly for EBIT (Figure 5, Table A2).
As regards the sustainable development dimensions, we can see that the presence of the CSR sustainability committee (CSR_sust_com), the use of energy (Energy_use) and of the renewable energy (Renew_energy), along with applying a policy sustainable packaging (Policy_sust) have engendered significant improvements of the companies’ financial performances.
Overall, the enterprise value (EV) of the European companies considered in the analysis is the highest favorable shaped by the use of renewable energy (Renew_energy) (the coefficient is 0.466, p < 0.001) (Figure 3, Table A2), whereas, if we consider the earnings (EBITDA—Figure 4, and EBIT—Figure 5) these are mostly shaped by the corporate governance board committee (CG_BC) (the coefficient is 0.401, respectively 0.464, p < 0.001) (Table A2).
In view of the SEMs’ results for each considered dimension of the companies’ financial performance, as well as in the light of the additional empirical evidence of the generalized structural equation modelling—latent class analysis detailed in the Appendix A (Table A6), we conclude that our second Hypothesis H2: There are significant overall influences of the management financial incentives, corporate governance, board characteristics and sustainable development dimensions on the financial performance of the European companies, is fulfilled, being similar with those obtained in the case of direct implications (H1).

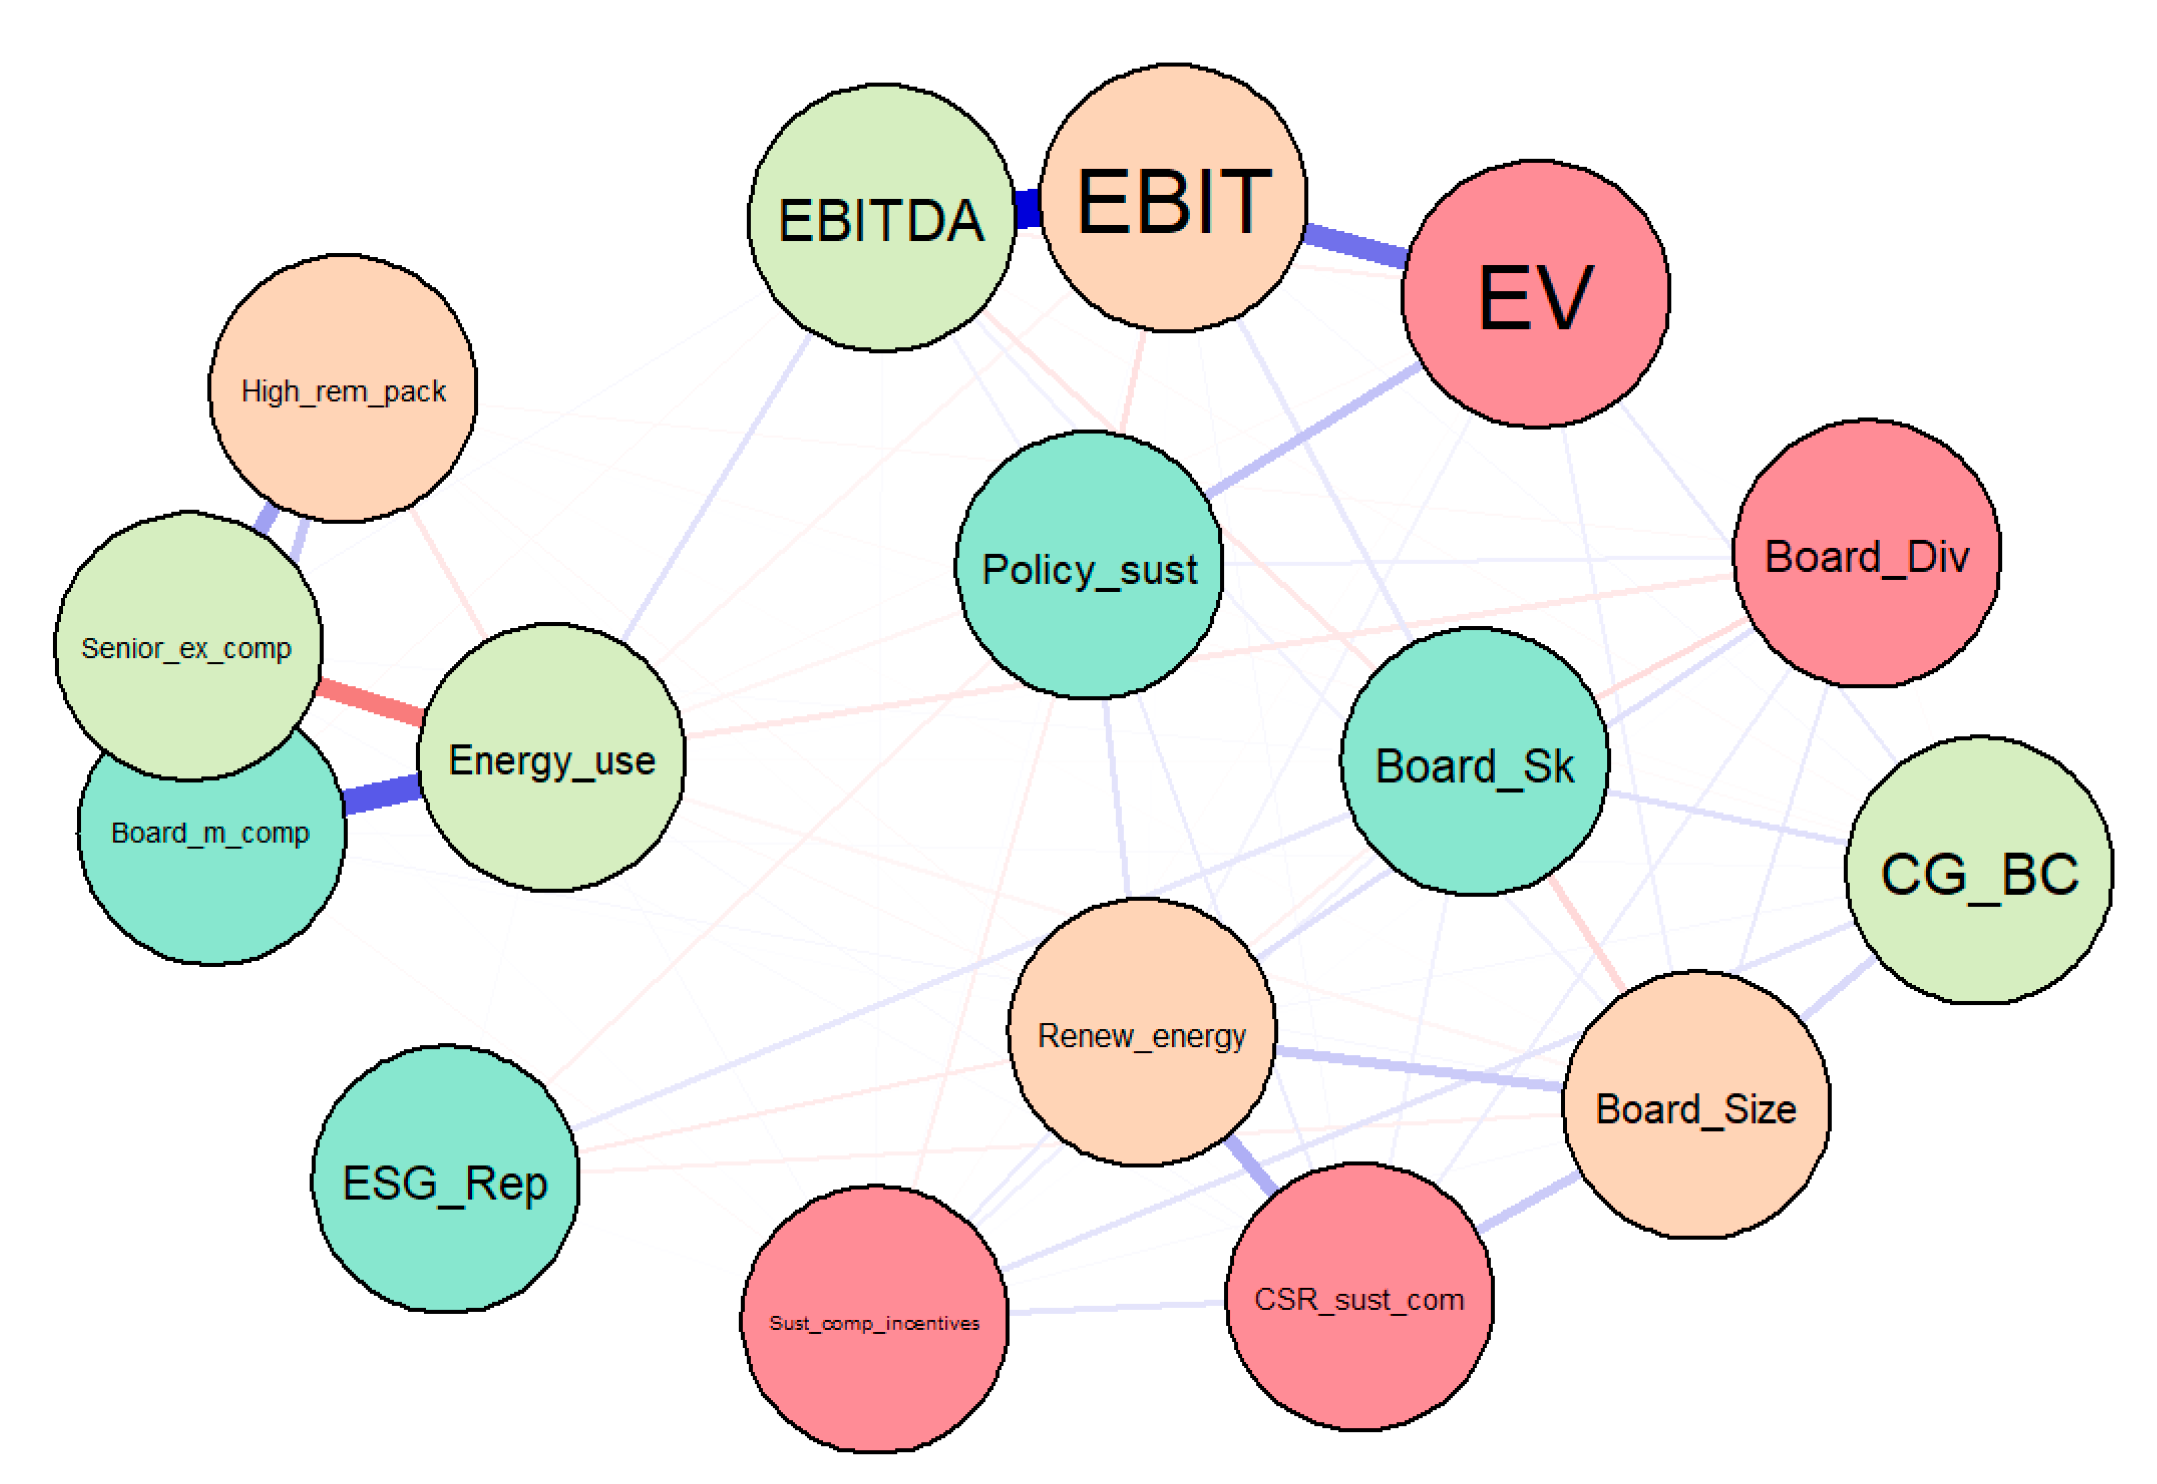
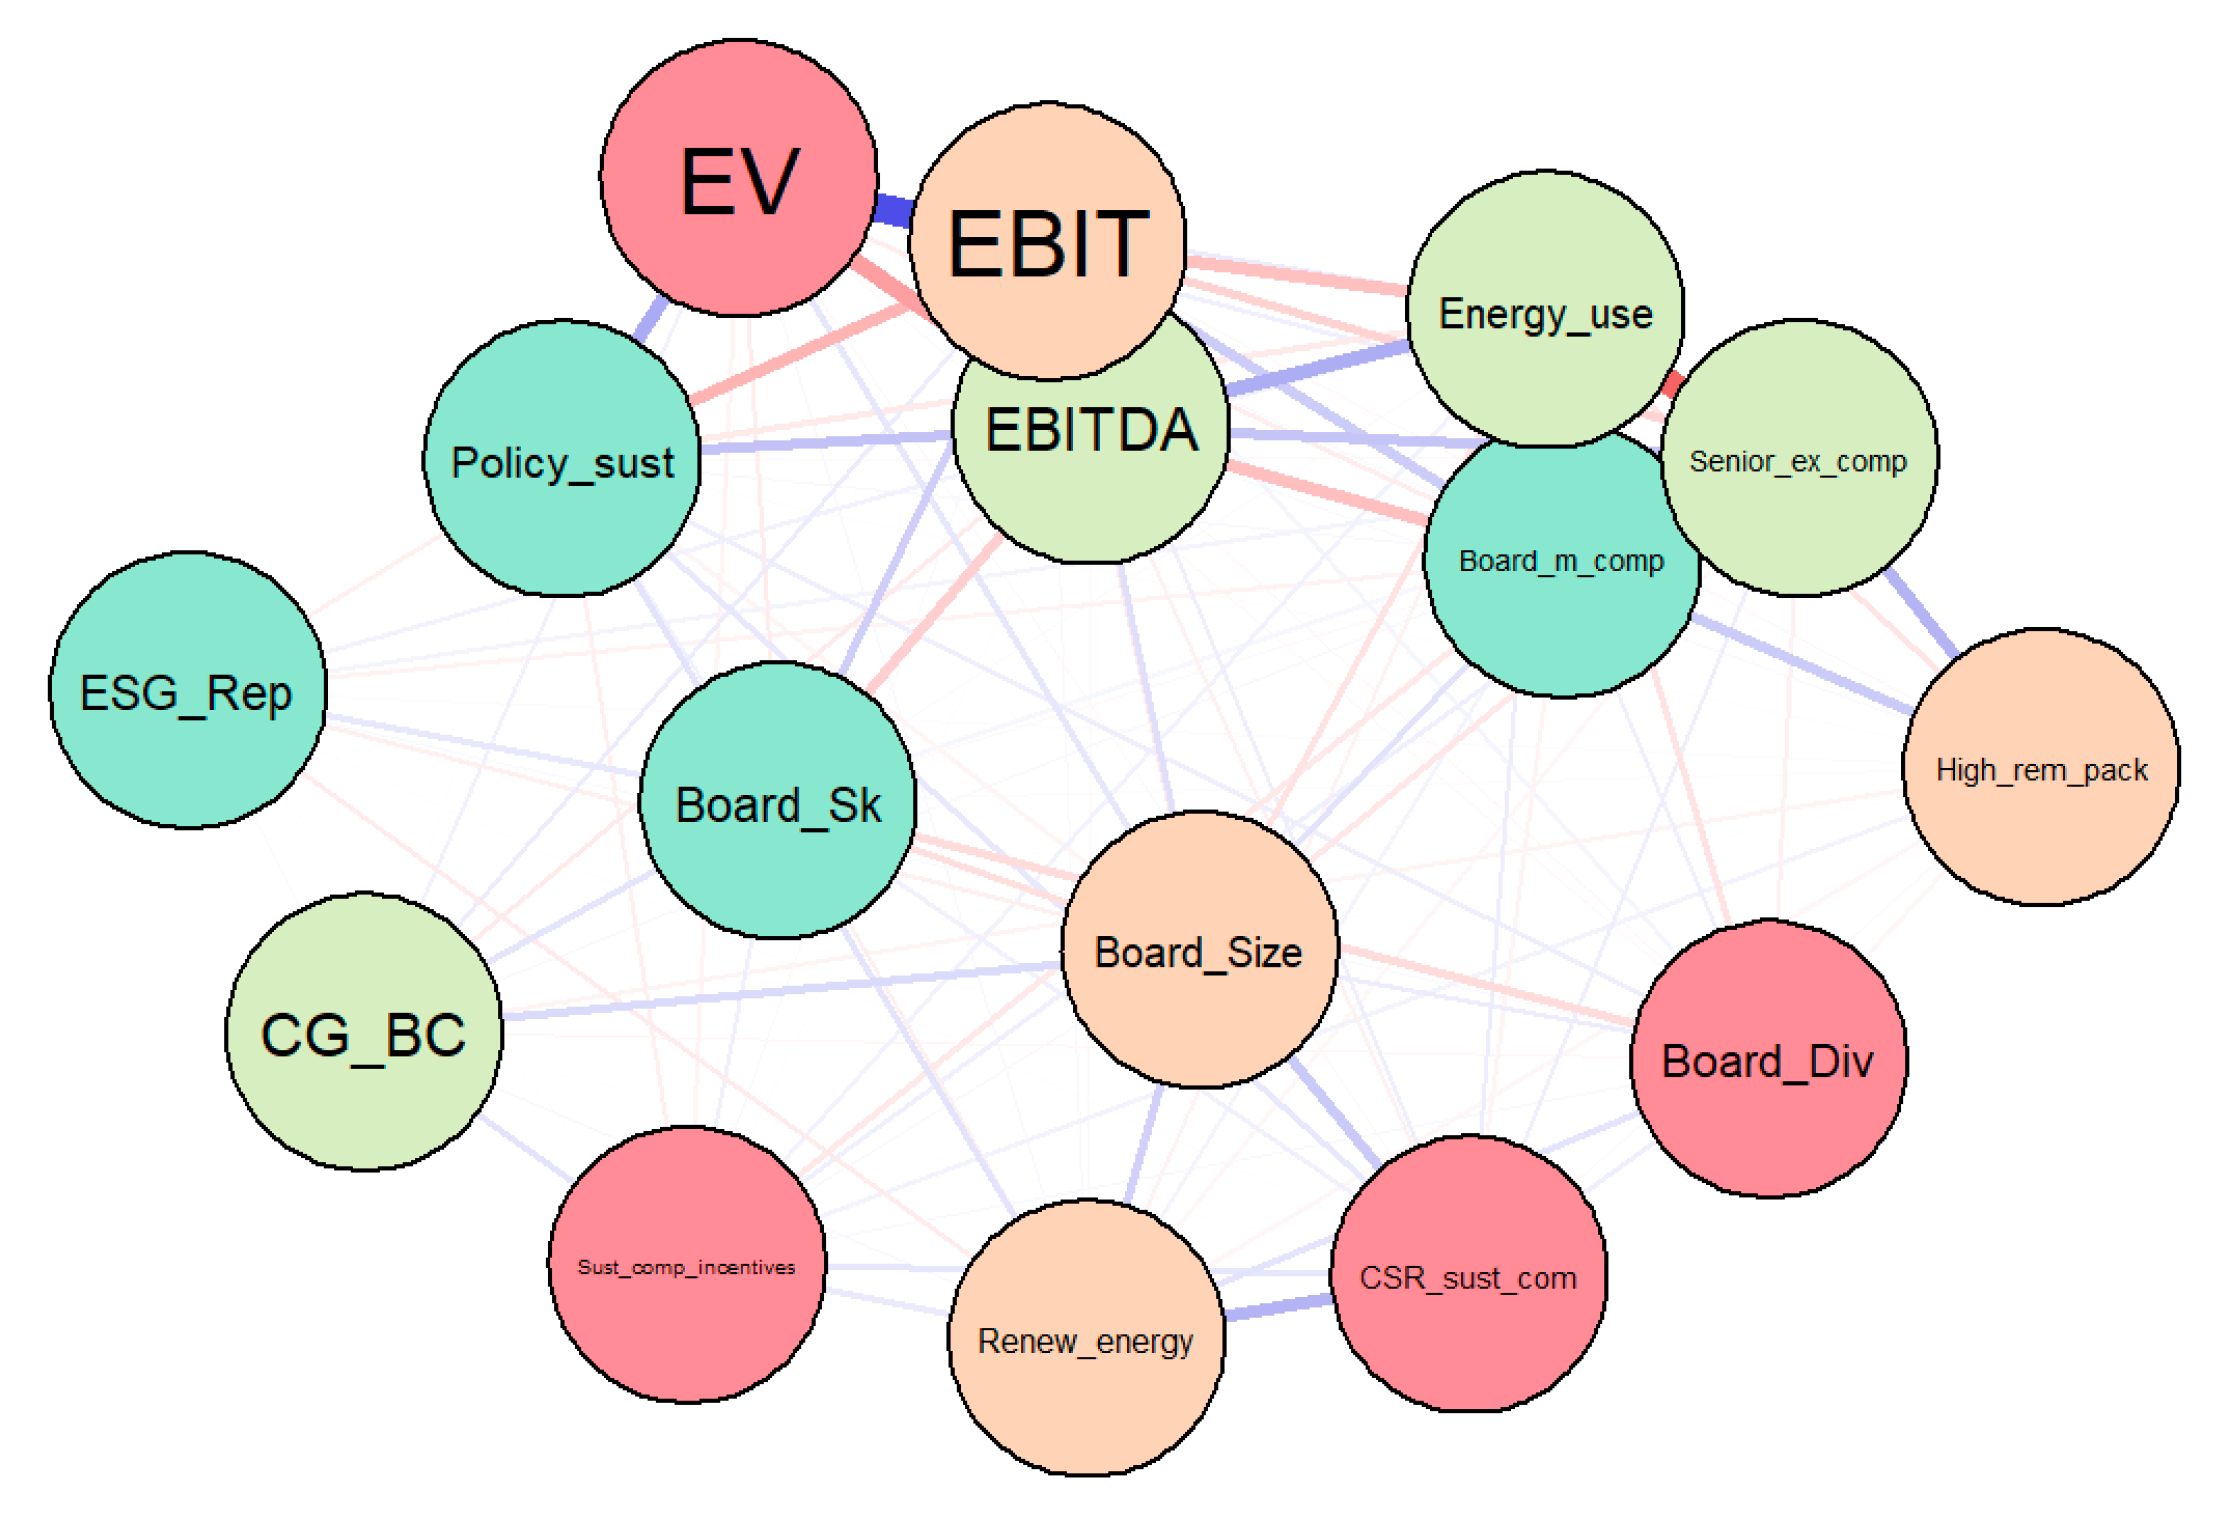
4.3. Results of the Network Analysis—Gaussian Graphical Models (GGMs)

Lastly, our research endeavor is accomplished by a network analysis deployed through two Gaussian graphical models configured and estimated based on the Extended Bayesian Information Criterion with graphical lasso (EBICglasso) (Figure 6) and partial correlations (PCOR) (Figure 7), relying on previous empirical evidence brought by the robust regression econometric models (detailed in Section 4.1) and structural equation models and generalized structural equation model—latent class analysis (Gaussian family) (detailed in Section 4.2 and the Appendix A).
The Gaussian graphical model (Table A6) configured through EBICglasso (Figure 6) entails important linkages between the three considered firm performance indicators (EV, EBITDA, EBIT) and the sustainable credentials, namely the existence of a policy sustainable packaging (Policy_sust) and further with the energy use (Energy_use), which is also strongly connected with the three coordinates of management financial incentives: Board_m_comp, Senior_ex_comp and High_rem_pack. At the same time, there are also linkages between firms’ performance indicators, corporate governance and board characteristics, tightly related with the sustainability committees, incentives and the ESG reporting credentials. The same connections between all considered variables are also entailed by the second GGM estimated through partial correlations (Figure 7), yet the latter presents a denser regularized network.

5. Conclusions

Based on our previous research on the CSR mechanisms’ effects on the sustainability of companies’ performance in Europe [82] and as one of the future directions introduced, this paper reveals the comprehensive relationship between board and executive management compensation and remunerations and the financial performance of companies within the sustainable development pathway.
Upheld on valuable data offered by the Thomson Reuters Eikon for 2019 [14] and three advanced econometric techniques (multifactorial regression models—robust and IV estimations, structural equation modelling, including latent class analysis, and network analysis through Gaussian Graphical Models), our findings provide interesting insights and bring to the fore that financial incentives/packages for the management positively and significantly reverberate on the performance of European firms, leading to important upwards in enterprise value and company earnings (measured by Earnings before interest, tax, depreciation and amortization—EBITDA, and Earnings before interest and taxes—EBIT). The findings propose a straightforward roadmap for decision makers to include management financial incentives into official strategic outline/plan of the companies, related to CSR activities and CG system. However, the companies have to keep the board compensation/remuneration on balance under a transparent control mechanism, ensured by the CSR and CG, as Ruparelia and Njuguna [8] pointed out.
The sustainability indicators (particularly, a policy sustainable packaging, but also a sustainability committee, energy use, renewable energies) also have positive effects on the financial performance of considered companies. Moreover, CSR policies, enforced at the level of board management, may induce “a domino effect” further down, at the level of executive management and upon the actions of all employees, as Uyar et al. [15] (p. 9) also proved. We have highlighted that the renewable energy and corporate governance board committee had the utmost favorable effects on companies’ value and earnings. The presence of CG board committee will orient the European companies towards sustaining the environment and upturn involvement in socially responsible actions, with overall effects for their better positioning on the market. Therefore, our research acknowledges that corporate governance represents a liaising factor of the favorable connection between the sustainable development implications of the companies and their financial performance outcomes, as Siminică et al. [12] also proved. The results of this research may uphold policymakers for further reliance by the European companies of corporate governance mechanisms, extending the CSR implementation and the approach of sustainability dimensions. Since our findings revealed that board gender diversity has improved the overall companies’ value and earnings, policymakers may set a minimum share of female representatives on board management of the European companies, to be enclosed within the CG rules. Women may heighten the existing activities of the companies by mostly orientation towards social and environmental actions [83], female representatives being “more philanthropically driven and community-oriented” than male counterparts [15] (p. 9), or more focused on reporting quality [22].
The findings of the current study are important for practitioners, policymakers and other researchers, especially for European countries and firms that are scrutinizing the puzzle of executives’ compensation/remuneration and financial performance of companies from various industries in a sustainable development framework. The key implication of this study is that greater firm performance can be achieved by pursuing tailored strategies focused on management financial incentives under a good structure of corporate governance, sustainability and CSR activities and management characteristics.
Summing up, this study contributes with several innovations to the literature. First, the paper enlarges the literature on management financial incentives and firm performance in a sustainable framework by providing a complex and comprehensive empirical examination of the role played by three dimensions related to financial compensation and remuneration, sustainable development coordinates, corporate governance and management characteristics in shaping the financial performance of companies with the headquarters in Europe. Furthermore, it provides insights on various methods and econometric techniques that can be employed with robust results to evidence complex patterns of relationships amongst these management fundamentals, thus sketching out the essentials of financial performance strategies. Nonetheless, our study brings new evidence to attest that management financial incentives (particularly board member compensation and highest remuneration package) and management characteristics such as board size, diversity and skills can significantly improve companies’ value and earnings level, while grasping the importance of also accounting for unobserved characteristics. Finally, we contribute to the growing body of literature on how the sustainability indicators and CSR policies can enhance the financial performance of companies and to the discussion of the pay—sustainable performance framework as a topical subject approached by diverse strands of thought.
The main limitations of our research consist in some missing data in Thomson Reuters Eikon specific reports, but also to the degree of significance of binary data included in CSR reports. Another limit may embody the large group of companies (a single panel), since there are some institutional discrepancies across countries as regards CSR and CG implementations, as they were forewarned by the Ruparelia and Njuguna [8]. Consequently, our future research direction is oriented to the connection between CG mechanisms and financial sustainable performance of the companies within specific economic, social and environmental framework of the developed and developing origin countries, on one hand, and distinctive fields of the industries and reversed or bilateral connections between financial performance and management financial incentives, on the other hand. A particular attention shall be paid to enhance other observed and unobserved managerial attributes and firm characteristics (other proxies) that determine executive compensation incentives and firm financial performance following the research of Coles and Li [84]. Last but not least, other areas that will employ our attention are the management features in different ethnic groups [85], and the further impact on firm competitiveness [86,87], will both be augmented in our future research.

Author Contributions

G.G.N., M.C., C.N.J., A.B., and I.L.P. designed the conceptualization of the paper, overall visualization, and prepared the original draft of the manuscript. G.G.N. configured the methodology and applied the formal analysis, software; G.G.N. and M.C. discussed the results obtained. N.J., M.C., and A.B. prepared the dataset and reviewed the literature. I.L.P. was in charge of writing—review and editing. A.B. covered the funding acquisition. All authors have read and agreed to the published version of the manuscript.

Funding

This research was funded by West University of Timisoara.

Acknowledgments

The authors are indebted to two anonymous referees for their accurate and very constructive comments that were extremely useful in framing the overall research.

Conflicts of Interest

The authors declare no conflict of interest.

Appendix A

Table A1. Descriptive statistics.
VariablesNMeanSDMinMax
EV12291.30 × 10103.06 × 1010−2.03 × 10103.25 × 1011
EBITDA13711.42 × 1093.92 × 109−4.62 × 1085.97 × 1010
EBIT14821.04 × 1092.69 × 109−5.95 × 1083.49 × 1010
Board_m_comp15751,750,1351.15× 1072923.0774.12 × 108
Senior_ex_comp15161.11 × 1077.62 × 10702.89 × 109
High_rem_pack13945,095,5055.21 × 1073670.081.61× 109
Sust_comp_incent15940.23086570.421518901
Policy_sust15940.17816810.382774301
Energy_use8753.55 × 1072.80 × 10807.34 × 109
Renew_energy15940.53764120.498737601
CSR_sust_com15940.56210790.496283301
ESG_rep127790.9280920.838191100
CG_BC15940.1744040.379575601
Board_Size15949.2804273.467873223
Board_Div159427.4004614.16414075
Board_Sk159340.1543122.575610100
Assets14103.81 × 10101.70 × 1073.30 × 1072.76 × 1012
N1594
Source: Authors’ contribution in Stata 16.
Table A2. SEM models detailed results (Estimation method: maximum likelihood).
Variables(1)(2)(3)
EVEBITDAEBIT
Board_m_comp0.228 ***0.196 ***0.290 ***
(0.0525)(0.0452)(0.0525)
Senior_ex_comp0.06680.0968 *0.126 **
(0.0461)(0.0399)(0.0460)
High_rem_pack0.388 ***0.251 ***0.207 ***
(0.0537)(0.0469)(0.0547)
CG_BC0.390 ***0.401 ***0.464 ***
(0.107)(0.0931)(0.106)
Board_Size0.0614 ***0.0750 ***0.0781 ***
(0.0136)(0.0118)(0.0135)
Board_Div0.00948 **0.0103 ***0.0134 ***
(0.00332)(0.00289)(0.00331)
Board_Sk0.0009530.0008740.00190
(0.00204)(0.00179)(0.00203)
Sust_comp_incent0.06830.06480.105
(0.0924)(0.0810)(0.0933)
Policy_sust0.363 ***0.335 ***0.151
(0.0899)(0.0792)(0.0936)
Energy_use0.115 ***0.205 ***0.138 ***
(0.0185)(0.0161)(0.0179)
Renew_energy0.466 ***0.294 ***0.272 **
(0.101)(0.0892)(0.103)
CSR_sust_com0.337 **0.332 ***0.402 ***
(0.103)(0.0893)(0.102)
ESG_rep0.000356−0.00118−0.00168
(0.00193)(0.00168)(0.00197)
_cons9293 ***7862 ***7273 ***
(0.752)(0.638)(0.746)
/
var(e.log_EV)1.022 ***
(0.0566)
var(e.log_EBITDA) 0.813 ***
(0.0441)
var(e.log_EBIT) 1.164 ***
(0.0604)
N653680742
Note: Standard errors in parentheses, * p < 0.05, ** p < 0.01, *** p < 0.001. Source: Authors’ contribution in Stata 16.
Table A3. Cronbach’s alpha for the SEM models.
Model 1, EVModel 2, EBITDAModel 3, EBIT
ItemItem-Test CorrelationAlphaItem-Test CorrelationAlphaItem-Test CorrelationAlpha
EV/EBITDA/EBIT0.72880.65920.77200.68480.75500.6848
Board_m_comp0.69330.65470.66460.69430.66520.6937
Senior_ex_comp0.66320.66210.61970.70260.62160.7018
High_rem_pack0.68690.66070.65590.69890.65650.6983
CG_BC0.45830.69410.44660.72580.45020.7247
Board_Size0.57160.67650.61630.70210.61650.7017
Board_Div0.07200.74510.26320.74890.26160.7487
Board_Sk0.20590.72940.14230.76250.14800.7610
Sust_comp_incent0.35780.70950.36330.73700.36230.7365
Policy_sust0.32810.71270.34660.73840.34290.7384
Energy_use0.55400.68610.55280.71710.53970.7175
Renew_energy0.50820.68700.55750.71120.55500.7110
CSR_sust_com0.53220.68310.56830.70960.56800.7091
ESG_rep0.23760.72010.24440.74650.24440.7459
Total scale 0.7088 0.7360 0.7356
Source: Authors’ contribution in Stata 16.
Table A4. Wald tests for equations associated with the SEM models.
Model 1, EVModel 2, EBITDAModel 3, EBIT
VariablesChi2dfp-ValueChi2dfp-ValueChi2dfp-Value
EV801.64130.000------
EBITDA---1219.58130.000---
EBIT------844130.000
H0: All coefficients excluding the intercepts are 0. We can thus reject the null hypothesis for each equation. Source: Authors’ contribution in Stata 16.
Table A5. Goodness-of-fit tests for the SEM models.
SpecificationsModel 1 EVModel 2 EBITDAModel 3 EBIT
Likelihood ratio
Model vs. saturated chi2_ms (0)0.0000.0000.000
p > chi2---
Baseline vs. saturated chi2_bs (13)523,012698,561563,639
p > chi20.0000.0000.000
Information criteria
AIC (Akaike’s information criterion)33,461.11734,757.82138,117.779
BIC (Bayesian information criterion)33,528.34134,825.65338,186.919
Baseline comparison
CFI (Comparative fit index)1.0001.0001.000
TLI (Tucker–Lewis index)1.0001.0001.000
Size of residual
CD (Coefficient of determination)0.5510.6420.532
SRMR (Stand. root mean sq. residual)000
Source: Authors’ contribution in Stata 16.
Table A6. Latent class analysis (LCA)—Generalized structural equation model (Gaussian family).
VariablesModel 1 EVModel 2 EBITDAModel 3 EBIT
1.A#c.Board_m_comp0.228 ***0.196 ***0.290 ***
(0.0525)(0.0452)(0.0525)
1.A#c.Senior_ex_comp0.06680.0968 *0.126 **
(0.0461)(0.0399)(0.0460)
1.A#c.High_rem_pack0.388 ***0.251 ***0.207 ***
(0.0537)(0.0469)(0.0547)
1.A#c.Sust_comp_incent0.06830.06480.105
(0.0924)(0.0810)(0.0933)
1.A#c.Policy_sust0.363 ***0.335 ***0.151
(0.0899)(0.0792)(0.0936)
1.A#c.Energy_use0.115 ***0.205 ***0.138 ***
(0.0185)(0.0161)(0.0179)
1.A#c.Renew_energy0.466 ***0.294 ***0.272 **
(0.101)(0.0892)(0.103)
1.A#c.CSR_sust_com0.337 **0.332 ***0.402 ***
(0.103)(0.0893)(0.102)
1.A#c.ESG_rep0.000356−0.00118−0.00168
(0.00193)(0.00168)(0.00197)
1.A#c.CG_BC0.390 ***0.401 ***0.464 ***
(0.107)(0.0931)(0.106)
1.A#c.Board_Size0.0614 ***0.0750 ***0.0781 ***
(0.0136)(0.0118)(0.0135)
1.A#c.Board_Div0.00948 **0.0103 ***0.0134 ***
(0.00332)(0.00289)(0.00331)
1.A#c.Board_Sk0.0009530.0008740.00190
(0.00204)(0.00179)(0.00203)
1.A#c._cons9293 ***7862 ***7273 ***
(0.752)(0.638)(0.746)
/
var(e.log_EV)#1.A1022 ***
(0.0566)
var(e.log_EBITDA)#1.A 0.813 ***
(0.0441)
var(e.log_EBIT)#1.A 1.164 ***
(0.0604)
N653680742
Note: Standard errors in parentheses, * p < 0.05, ** p < 0.01, *** p < 0.001. Source: Authors’ contribution in Stata 16.

References

  1. Conyon, M. Executive compensation and incentives. Acad. Manag. Perspect. 2006, 20, 25–44. [Google Scholar] [CrossRef]
  2. Pucheta-Martinez, M.C.; Gallego-Alvarez, I. Do board characteristics drive firm performance? An international performance. Rev. Manag. Sci. 2019, 1–47. [Google Scholar] [CrossRef]
  3. Cullen, M.; Kirwan, C.; Brennan, N. Comparative analysis of corporate governance theory: The agency-stewardship continuum. In Proceedings of the 20th Annual Conference of the Irish Accounting & Finance Association, Institute of Technology, Tralee, Ireland, 10–11 May 2012. [Google Scholar]
  4. Kartadjumena, E.; Rodgers, W. Executive compensation, sustainability, climate, environmental concerns, and company financial performance: Evidence from Indonesian commercial banks. Sustainability 2019, 11, 1673. [Google Scholar] [CrossRef] [Green Version]
  5. Molonko, L.K. Board structure, board compensation and firm profitability. Evidence from the banking industry. Master’s Thesis, Faculty of Commerce, University of Nairobi, Nairobi, Kenya, 2004. [Google Scholar]
  6. Conyon, M.J.; He, L. Executive compensation and corporate governance in China. J. Corp. Financ. 2011, 17, 1158–1175. [Google Scholar] [CrossRef] [Green Version]
  7. Andreas, J.; Rapp, M.S.; Wolf, M. Determinants of director compensation in two-tier systems: Evidence from German panel data. Rev. Manag. Sci. 2012, 6, 33–79. [Google Scholar] [CrossRef]
  8. Ruparelia, R.; Njuguna, A. Relationship between board remuneration and financial performance in the Kenyan Financial Services Industry. Int. J. Financ. Res. 2016, 7, 247–255. [Google Scholar] [CrossRef] [Green Version]
  9. Jensen, M.C.; Meckling, W.H. Theory of the firm: Managerial behavior, agency costs and ownership structure. J. Financ. Econ. 1976, 3, 305–360. [Google Scholar] [CrossRef]
  10. Schäuble, J. The impact of external and internal corporate governance mechanisms on agency costs. Corp. Gov. 2019, 19, 1–22. [Google Scholar] [CrossRef]
  11. Naciti, V. Corporate governance and board of directors: The effect of a board composition on firm sustainability performance. J. Clean. Prod. 2019, 237, 117727. [Google Scholar] [CrossRef]
  12. Siminică, M.; Cristea, M.; Sichigea, M.; Noja, G.G.; Anghel, I. Well-governed sustainability and financial performance: A new integrative approach. Sustainability 2019, 11, 4562. [Google Scholar] [CrossRef] [Green Version]
  13. Javeed, S.H.; Lefen, L. An analysis of Corporate Social Responsibility and firm performance with moderating effects of CEO power and ownership structure: A case study of the manufacturing sector of Pakistan. Sustainability 2019, 11, 248. [Google Scholar] [CrossRef] [Green Version]
  14. Eikon Database; Thomson Reuters: Toronto, ON, Canada, 2020.
  15. Uyar, A.; Kilic, M.; Koseoglu, M.A.; Kuzey, K.; Karaman, A. The link among board characteristcs, corporate social responsability, and financial performance: Evidence from the hospitality and tourism industry. Tour. Manag. Perspect. 2020, 35, 100714. [Google Scholar] [CrossRef]
  16. Nitescu, D.C.; Cristea, M.A. Environmental, social and governance risks—New challenges for the banking business sustainability. Amfiteatru Econ. 2020, 22, 692–706. [Google Scholar] [CrossRef]
  17. Akter, S.; Ali, H.; Abedin, T.; Hossain, B. Directors’ remuneration and performance: Evidence from the textile sector of Bangladesh. J. Asian Financ. Econ. Bus. 2020, 7, 265–275. [Google Scholar] [CrossRef]
  18. Fernandes, N. EC: Board compensation and firm performance: The role of “independent” board members. J. Multinatl. Financ. Manag. 2008, 18, 30–44. [Google Scholar] [CrossRef]
  19. Randoy, T.; Nielsen, J. Company performance, corporate governance and CEO compensation in Norway and Sweden. J. Manag. Gov. 2002, 6, 57–81. [Google Scholar] [CrossRef]
  20. Watson, R.; Wilson, N. Board pay and the separation of ownership from control in U.K. SMEs. Small Bus. Econ. 2005, 24, 465–476. [Google Scholar] [CrossRef]
  21. Barontini, R.; Bozzi, S. Board compensation and ownership structure: Empirical evidence for Italian listed companies. J. Manag. Gov. 2009, 15, 59–89. [Google Scholar] [CrossRef]
  22. Saona, P.; Muro, L.; San Martín, P.; Baier-Fuentes, H. Board of director’s gender diversity and its impact on earnings management: An empirical analysis for select European firms. Technol. Econ. Dev. Econ. 2019, 25, 634–663. [Google Scholar] [CrossRef] [Green Version]
  23. Albuquerque, R.; Koskinen, Y.; Yang, S.; Zhang, C. Love in the Time of COVID-19: The Resiliency of Environmental and Social Stocks. CEPR Discussion Papers (No. 14661). 2020, pp. 35–56. Available online: https://econpapers.repec.org/paper/cprceprdp/14661.htm (accessed on 3 July 2020).
  24. He, H.; Harris, L. The impact of Covid-19 pandemic on corporate social responsibility and marketing philosophy. J. Bus. Res. 2020, 116, 176–182. [Google Scholar] [CrossRef]
  25. Alchian, A.; Demsetz, H. Production, information costs, and economic organization. Am. Econ. Rev. 1972, I62, 777–795. [Google Scholar]
  26. Padilla, A. Can agency costs justify the regulation of insider trading? Q. J. Austrian Econ. 2002, 5, 3–38. [Google Scholar] [CrossRef]
  27. Eisenhardt, K.M. Agency theory: An assessment and review. Int. J. Manag. 1989, 5, 341–353. [Google Scholar]
  28. Mukaila, A.S.; Sanda, A.U.; Garba, T. Corporate governance mechanisms and firm financial performance in Nigeria. Final Report Presented to the Biannual Research Workshop of the AERC; The African Economic Research Consortium: Nairobi, Kenya, 2005. [Google Scholar]
  29. Fama, E.F. Agency problems and the theory of the firm. J. Polit. Econ. 1980, 88, 288–307. [Google Scholar] [CrossRef]
  30. Magnan, M.; St-Onge, S.; Gélinas, P. Director compensation and firm value: A research synthesis. Int. J. Discl. Gov. 2010, 7, 28–41. [Google Scholar] [CrossRef]
  31. Pfeffer, J.; Salancik, G. The External Control of Organizations: A Resource Dependency Perspective; Harper and Row: New York, NY, USA, 1978. [Google Scholar]
  32. Aslam, E.; Haron, R.; Tahir, M.N. How director remuneration impacts firm performance: An empirical analysis of executive director remuneration in Pakistan. Borsa Istanb. Rev. 2019, 19, 186–196. [Google Scholar] [CrossRef]
  33. Boyd, B.K. Board control and CEO compensation. Strateg. Manag. J. 1994, 15, 335–344. [Google Scholar] [CrossRef]
  34. Zajac, E.J.; Westphal, J.D. Director reputation, CEO-board power, and dynamics of board interlocks. Adm. Sci. Q. 1996, 41, 507–529. [Google Scholar] [CrossRef] [Green Version]
  35. Elhagrasey, G.M.; Harrison, J.R.; Buchholz, R.A. Power and pay: The politics of CEO compensation. J. Manag. Gov. 1998, 2, 309–332. [Google Scholar] [CrossRef]
  36. Lee, J.M. Non-linear relationships among related party transactions, financial characteristics, corporate governance, and corporate value–Analysis of high-growth and low-growth food firms. Agric. Econ. 2019, 65, 123–132. [Google Scholar] [CrossRef]
  37. Zahra, S.; Pearce, J. Board of directors and corporate governance financial performance: A review and integrative model. J. Manag. 1989, 15, 291–334. [Google Scholar]
  38. Huse, M. Boards of Directors in SMEs: A review and research agenda. Entrep. Reg. Dev. 2000, 12, 271–290. [Google Scholar] [CrossRef]
  39. Barbu, C.M.; Ponea, Ș. Professional motivation and satisfaction. Case study at Prexi Com LTD. J. Adv. Res. Manag. 2020, 10, 85–97. [Google Scholar] [CrossRef]
  40. Crăciun, L.; Ponea, Ş.; Băndoi, C.L. Manager and conflict in public institutions. Ann. Univ. Craiovaecon. Sci. Ser. 2010, 10, 36–41. [Google Scholar]
  41. Müller, V. Do corporate board compensation characteristics influence the financial performance of listed companies? Proced. Soc. Behav. 2014, 109, 983–988. [Google Scholar] [CrossRef]
  42. Perry, T.; Zenner, M. Pay for performance? Government regulation and the structure of compensation contracts. J. Financ. Econ. 2001, 62, 453–488. [Google Scholar] [CrossRef]
  43. Merhebi, R.; Pattenden, K.; Swan, P.L.; Zhou, X. Australian chief executive officer remuneration: Pay and performance. J. Bus. Financ. Account. 2006, 46, 481–497. [Google Scholar] [CrossRef]
  44. Miyienda, M.; Oirere, C.O.; Miyogo, J. The relationship between director remuneration and performance of firms listed in the Nairobi Securities Exchange. Int. J. Soc. Sci. 2012, 15, 1–17. [Google Scholar]
  45. Yatim, P. Directors’ remuneration and corporate governance in Malaysia. In Proceedings of the 7th Asia Pacific Interdisciplinary Research in Accounting Conference, Kobe, Japan, 26 July 2013. [Google Scholar]
  46. Sheikh, N.A.; Wang, Z. Effects of corporate governance on capital structure: Empirical evidence from Pakistan. Corp. Gov. 2012, 12, 629–641. [Google Scholar] [CrossRef]
  47. Gupta, P.; Kennedy, D.; Weaver, S. Corporate governance and firm value: Evidence from Canadian capital markets. Corp. Ownersh. Control. 2009, 6, 293–307. [Google Scholar] [CrossRef]
  48. Stanwick, P.A.; Stanwick, S.D. The relationship between governance and financial performance: An empirical study of Canadian firms. Bus. Rev. Camb. 2010, 16, 35–41. [Google Scholar]
  49. Ponnu, C. Corporate governance structures and the performance of Malaysian public listed companies. Int. Rev. Bus. Res. Pap. 2008, 4, 217–230. [Google Scholar]
  50. Haat, M.H.; Abdul, R.R.; Mahenthiran, S. Corporate governance, transparency and performance of Malaysian companies. Manag. Audit. J. 2008, 23, 744–778. [Google Scholar] [CrossRef] [Green Version]
  51. Ghazali, N.A.M. Ownership structure, corporate governance and corporate performance in Malaysia. Int. J. Commer. Manag. 2010, 20, 109–119. [Google Scholar] [CrossRef]
  52. Sami, H.; Wang, J.; Zhou, H. Corporate governance and operating performance of Chinese listed firms. J. Int. Account. Audit. Tax. 2011, 20, 106–114. [Google Scholar] [CrossRef]
  53. Kholeif, A. CEO duality and accounting-based performance in Egyptian listed companies: A re-examination of agency theory predication. Res. Account. Emerg. Econ. 2008, 8, 65–98. [Google Scholar] [CrossRef]
  54. Mashayekhi, B.A.; Bazaz, M.S. Corporate governance and firm performance in Iran. J. Contemp. Account. Econ. 2008, 4, 156–172. [Google Scholar] [CrossRef]
  55. Attaway, M. A study of the relationship between company performance and CEO compensation. Am. Bus. Rev. 2000, 18, 77–85. [Google Scholar]
  56. Madura, J.; Martin, A.D.; Jessel, K.A. Determinants of CEO compensation in small publicly-traded businesses. Am. Bus. Rev. 1996, 14, 80–88. [Google Scholar]
  57. Gregg, P.; Machin, S.; Szymanski, S. The disappearing relationship between directors’ pay and corporate performance. Br. J. Ind. Relat. 1993, 31, 1–9. [Google Scholar] [CrossRef]
  58. Brick, I.E.; Palmon, O.; Wald, J.K. CEO compensation, director compensation, and firm performance: Evidence of cronyism? J. Corp. Financ. 2006, 12, 403–423. [Google Scholar] [CrossRef] [Green Version]
  59. Haron, R. Do Muslim directors influence firm performance? Empirical evidence from Malaysia. J. Islam Econ. Bank. 2018, 283–305. Available online: http://irep.iium.edu.my/68215/ (accessed on 22 July 2020).
  60. Callan, S.J.; Thomas, J.M. Relating CEO compensation to social performance and financial performance: Does the measure of compensation matter? Corp. Soc. Responsib. Environ. Manag. 2014, 21, 202–227. [Google Scholar] [CrossRef]
  61. Callan, S.J.; Thomas, J.M. Executive compensation, corporate social responsibility, and corporate financial performance: A multi-equation framework. Corp. Soc. Responsib. Environ. Manag. 2011, 18, 332–351. [Google Scholar] [CrossRef]
  62. Mahoney, L.S.; Thorne, L. Corporate social responsibility and long-term compensation: Evidence from Canada. J. Bus. Ethics 2005, 57, 241–253. [Google Scholar] [CrossRef]
  63. Mahoney, L.S.; Thorne, L. An examination of the structure of executive compensation and corporate social responsibility: A Canadian investigation. J. Bus. Ethics 2006, 69, 149–162. [Google Scholar] [CrossRef]
  64. Frye, M.B.; Nelling, E.; Webb, E. Executive compensation in socially responsible firms. Corp. Gov. Int. Rev. 2006, 14, 446–455. [Google Scholar] [CrossRef]
  65. Miles, P.C.; Miles, G. Corporate social responsibility and executive compensation: Exploring the link. Soc. Responsib. J. 2013, 9, 76–90. [Google Scholar] [CrossRef] [Green Version]
  66. Cai, Y.; Jo, H.; Pan, C. Vice or virtue? The impact of corporate social responsibility on executive compensation. J. Bus. Ethics 2011, 104, 159–173. [Google Scholar] [CrossRef]
  67. Hamilton, L.C. How robust is robust regression? Stata Tech. Bull. 1991, 2, 21–26. [Google Scholar]
  68. Dang, C.; Li, Z.F.; Yang, C. Measuring firm size in empirical corporate finance. J. Bank Financ. 2018, 86, 159–176. [Google Scholar] [CrossRef]
  69. Coles, J.L.; Li, Z.F. An Empirical Assessment of Empirical Corporate Finance (7 June 2019). Available online: https://ssrn.com/abstract=1787143 (accessed on 23 August 2020). [CrossRef] [Green Version]
  70. Comment, R.; Schwert, G.W. Poison or placebo? Evidence on the deterrence and wealth effects of modern anti-takeover measures. J. Financ. Econ. 1995, 39, 3–43. [Google Scholar] [CrossRef]
  71. Harford, J.; Mansi, S.A.; Maxwell, W.F. Corporate governance and firm cash holdings in the US. J. Financ. Econ. 2008, 87, 535–555. [Google Scholar] [CrossRef]
  72. Magerakis, E.; Gkillas, K.; Tsagkanos, A.; Siriopoulos, C. Firm size does matter: New evidence on the determinants of cash holdings. J. Risk Financ. Manag. 2020, 13, 163. [Google Scholar] [CrossRef]
  73. Hashmi, S.D.; Gulzar, S.; Zeshan, G.; Iram, N. Sensitivity of firm size measures to practices of corporate fnance: Evidence from BRICS. Future Bus. J. 2020, 6, 1–19. [Google Scholar] [CrossRef] [Green Version]
  74. Kanapathippillaia, S.; Gul, F.; Mihret, D.; Muttakin, M.B. Compensation committees, CEO pay and firm performance. Pac. Basin Financ. J. 2019, 57. [Google Scholar] [CrossRef]
  75. Pinzon, E. Dealing with and Understanding Endogeneity; StataCorp LP: Barcelona, Spain, 2016. [Google Scholar]
  76. Amini, A.A.; Aragam, B.; Zhou, Q. On Perfectness in Gaussian Graphical Models. Cornell University, 2019. Available online: http://arxiv.org/abs/1909.01978 (accessed on 11 July 2020).
  77. Fitch, K. Learning Directed Graphical Models from Gaussian Data. Cornell University, 2019. Available online: http://arxiv.org/abs/1906.08050 (accessed on 14 July 2020).
  78. Chen, X.; Wan, P.; Quan, X.; Sial, M.S. Does corporate social responsibility matter to management forecast precision? Evidence from China. Ekon. Istraz. 2020, 33, 1767–1795. [Google Scholar] [CrossRef]
  79. Park, K.O. How CSV and CSR affect organizational performance: A productive behavior perspective. Int. J. Environ. Res. Public Health 2020, 17, 2556. [Google Scholar] [CrossRef] [Green Version]
  80. Imam, M.O.; Malik, M. Firm performance and corporate governance through ownership structure: Evidence from Bangladesh stock market. Int. Rev. Bus. Res. Pap. 2007, 3, 88–110. [Google Scholar]
  81. Rahman, M.M.; Meah, M.R.; Chaudhory, N.U. The Impact of Audit Characteristics on Firm Performance: An Empirical Study from an Emerging Economy. J. Asian Financ. Econ. Bus. 2019, 6, 59–69. [Google Scholar] [CrossRef]
  82. Suciu, M.C.; Noja, G.G.; Cristea, M. Diversity, social inclusion and human capital development as fundamentals of financial performance and risk mitigation. Amfiteatru Econ. 2020, 22, 742–757. [Google Scholar] [CrossRef]
  83. Pucheta-Martínez, M.C.; Gallego-Álvarez, I. An international approach of the relationship between board attributes and the disclosure of corporate social responsibility issues. Corp. Soc. Responsib. Environ. Manag. 2019, 26, 612–627. [Google Scholar] [CrossRef]
  84. Coles, J.L.; Li, Z. Managerial attributes, incentives, and performance. Rev. Corp. Financ. Stud. 2020, 9, 256–301. [Google Scholar] [CrossRef]
  85. Dinca, M.; Luches, L. Work integration of the roma: Between family and labor market. Sustainability 2018, 10, 1495. [Google Scholar] [CrossRef] [Green Version]
  86. Pirtea, M.; Botoc, C.; Jurcut, C. Risk and return analysis: Evidence from emerging markets. Transform. Bus. Econ. 2014, 13, 637–647. [Google Scholar]
  87. Bibu, N.; Stefea, P.; Sala, D. External and internal environment influences on SME competitiveness from the Western area of Romania. Megatrend Rev. 2009, 6, 41–52. [Google Scholar]
Figure 1. General design and configuration of the structural equation models (SEMs). Source: Authors’ contribution in Stata 16. EV, enterprise value; EBITDA, earnings before interest, tax, depreciation and amortization; EBIT, earnings before interest and taxes.
Sustainability 12 07247 g001
Figure 2. Correlation graph matrix between firm performance indicators and financial compensations.
Sustainability 12 07247 g002
Figure 3. Results of SEM for companies’ value (EV). Source: authors’ contribution in Stata 16.
Sustainability 12 07247 g003
Figure 4. Results of SEM for Earnings before interest, tax, depreciation and amortization (EBITDA). Source: authors’ contribution in Stata 16.
Sustainability 12 07247 g004
Figure 5. Results of SEM for Earnings before interest and taxes (EBIT). Source: authors’ contribution in Stata 16.
Sustainability 12 07247 g005
Figure 6. Results of Gaussian graphical models (GGMs), Extended Bayesian Information Criterion with graphical lasso (EBICglasso). Source: authors’ contribution in R programming.
Sustainability 12 07247 g006
Figure 7. Results of GGMs, partial correlations (PCOR). Source: authors’ contribution in R programming.
Sustainability 12 07247 g007
Table 1. Results of multiple regression models processed through robust regression (RREG, Huber and Biweight iterations), IV/2SLS estimator (classic and firms size control proxied by total assets—Assets).
CategoryVariablesModel 1 EV Model 2 EBITDA Model 3 EBITA
RREGIV/2SLSIV/2SLSRREGIV/2SLSIV/2SLSRREGIV/2SLSIV/2SLS
Management financial incentivesBoard_m_comp0.215 ***0.229 ***0.102 **0.194 ***0.195 ***0.0380.304 ***0.289 ***0.061
(0.0539)(0.0531)(0.0380)(0.0454)(0.0457)(0.0284)(0.0513)(0.0530)(0.0339)
Senior_ex_comp0.07890.06620.01020.0811*0.0968*0.02380.08610.126 **0.0252
(0.0473)(0.0466)(0.0331)(0.0401)(0.0404)(0.0248)(0.0450)(0.0465)(0.0292)
High_rem_pack0.392 ***0.389 ***0.236 ***0.308 ***0.251 ***0.0917 **0.314 ***0.208 ***0.124 ***
(0.0551)(0.0543)(0.0386)(0.0471)(0.0474)(0.0291)(0.0535)(0.0553)(0.0344)
Sustainable development dimensionsSust_comp_incent0.08530.06930.02180.09730.06450.02240.1130.1050.0485
(0.0949)(0.0935)(0.0659)(0.0814)(0.0819)(0.0499)(0.0913)(0.0943)(0.0588)
Policy_sust0.364 ***0.364 ***0.322 ***0.321 ***0.338 ***0.361 ***0.1340.1560.408 ***
(0.0921)(0.0908)(0.0643)(0.0795)(0.0800)(0.0491)(0.0914)(0.0944)(0.0596)
Energy_use0.118 ***0.115 ***0.1290.203 ***0.204 ***0.0940 ***0.127 ***0.137 ***0.0994 ***
(0.0190)(0.0187)(0.0142)(0.0161)(0.0162)(0.0106)(0.0175)(0.0181)(0.0114)
Renew_energy0.507 ***0.467 ***0.205 **0.274 **0.297 **0.4210.286 **0.277 **0.584
(0.104)(0.102)(0.0730)(0.0896)(0.0901)(0.0558)(0.100)(0.103)(0.0652)
CSR_sust_com0.361 ***0.337 **0.3200.290 **0.333 ***0.111 *0.287 **0.404 ***0.205 **
(0.105)(0.104)(0.0746)(0.0897)(0.0903)(0.0562)(0.0992)(0.103)(0.0651)
ESG_rep0.02550.03820.0583−0.0184−0.0222−0.01390.00655−0.0221−0.0405
(0.0900)(0.0887)(0.0621)(0.0776)(0.0781)(0.0475)(0.0895)(0.0925)(0.0573)
Corporate governance and board characteristicsCG_BC0.366 ***0.389 ***0.4560.418 ***0.400 ***0.3790.536 ***0.463 ***0.112
(0.110)(0.108)(0.0779)(0.0935)(0.0941)(0.0587)(0.103)(0.107)(0.0682)
Board_Size0.0561 ***0.0616 ***0.02400.0784 ***0.0757 ***0.006240.0815 ***0.0792 ***0.0745
(0.0139)(0.0137)(0.0998)(0.0119)(0.0119)(0.00760)(0.0131)(0.0136)(0.0888)
Board_Div0.0106 **0.00946 **0.003750.0112 ***0.0103 ***0.0413 *0.0153 ***0.0134 ***0.00562**
(0.00341)(0.00336)(0.00239)(0.00290)(0.00292)(0.00180)(0.00324)(0.00334)(0.00212)
Board_Sk0.002310.0009160.002460.001560.0008010.0006160.001980.001780.00176
(0.00209)(0.00206)(0.00145)(0.00180)(0.00181)(0.00111)(0.00199)(0.00205)(0.00128)
Firm sizeTotal assets 0.732 *** 0.711 *** 0.644 ***
(0.0288) (0.0214) (0.0192)
_cons9027 ***9144 ***0.7787237 ***7858 ***0.2986090 ***7221 ***0.531
(0.863)(0.851)(0.690)(0.722)(0.726)(0.504)(0.823)(0.850)(0.571)
N653653640680680660742742721
R20.5480.5510.7780.6530.6420.8660.5640.5320.817
Note: Standard errors in parentheses, * p < 0.05, ** p < 0.01, *** p < 0.001. Source: Authors’ process in Stata 16.

