Article

Do Political Ties Cause Over-Investment in Corporate Social Responsibility? Empirical Evidence from Chinese Private Firms

1
Department of Marketing, School of Management, Wuhan Institute of Technology, Wuhan 430205, China
2
Department of Financial Management, School of Accounting, Shanghai Lixin University of Accounting and Finance, Shanghai 201209, China
3
Department of Management and Organization, Shanghai Jiao Tong University, Shanghai 200030, China
*
Author to whom correspondence should be addressed.
Sustainability 2020, 12(17), 7203; https://doi.org/10.3390/su12177203
Submission received: 23 July 2020 / Revised: 28 August 2020 / Accepted: 31 August 2020 / Published: 3 September 2020
(This article belongs to the Section Economic and Business Aspects of Sustainability)

Abstract

:
One of the most significant trends of firms in recent years is the investment growth in Corporate Social Responsibility (CSR) in China. CSR investment helps firms to create business value and develop strategic resources, whereas many firms ignore its optimal level. Extraordinary enthusiasm for CSR possibly leads to over-investment in CSR, which increases firms’ cost and has a negative influence on financial performance. We tried to explore the reasons why Chinese firms are so enthusiastic about CSR investment. Drawing upon the social exchange theories, we tested the relationship between political ties and over-investment in CSR, and examined how this relationship is moderated by the degree of resource competition. Based on a sample of 2304 private firms in China, we found that political ties have a positive effect on CSR over-investment. Our findings also suggested that the degree of resource competition positively moderates the relationship between political ties and over-investment in CSR.

1. Introduction

In recent years, firms in transitional economies have shown increasing interest in demonstrating their corporate social responsibility (CSR) [1,2,3]. Firms in China have shown particular enthusiasm about showing their CSR through philanthropic donations. According to the Annual Report on China’s Philanthropy Development published by China Charity Information Center and the Ministry of Civil Affairs, China accepted 139.3 billion RMB (22 billion dollars) in donation in 2016 and 110.9 billion RMB (17.5 billion dollars) in donation in 2015, where donations from firms accounted for 65.2% and 70% of total annual donations in 2016 and 2015, respectively. By contrast, in 2016, donations from firms only accounted for less than 10% of total annual donations in the USA and UK. Why are Chinese firms so enthusiastic about corporate philanthropy? One possibility is that Chinese firms make generous philanthropic donations in order to gain political legitimacy, generate positive stakeholder responses, reduce investment inefficiency [4], mitigate risk [5], and thereby increase firm value [6] and enhance firm performance [7].
However, not all CSR investments will pay off. CSR, defined as “actions that appear to further some social good, beyond the interests of the firm and that which is required by law,” is viewed as a form of corporate investment [8]. The corporate investment perspective suggests that firms invest in CSR to enhance their financial performance and that stakeholders’ demands for CSR determine the optimal level of CSR investments [8,9,10]. However, CSR is negatively associated with financial performance under certain circumstances, that is, CSR costs may sometimes exceed its returns, generating negative financial returns [11]. In fact, recent empirical findings indicate that some firms make excessive CSR investments that exceed optimal economic levels [12,13].
The possibility that firms might over-invest in CSR has been recognized. Once CSR investment exceeds an optimal level, CSR cannot create sufficient benefit to cover financial costs and missed opportunity costs of firms [8,13]), or even is associated with a high crash risk in firms from the Asia-Pacific region [13]. These previous studies explored the consequences of CSR over-investment; however, they paid little attention to explaining why firms make excessive investments in CSR. There were two exceptions; Lys, Naughton, and Wang [12] suggested that CSR over-investment is primarily derived from signaling value about future financial prospects of firms; and Bhandari and Javakhadze [14] mentioned that firms’ over-investment in CSR could be due to managers pursuing personal goals or private interests. A lot of previous studies have explored the antecedents of CSR, including individual-level factors (e.g., supervisor commitment to CSR and employee psychological needs), organizational-level factors (e.g., seeking legitimacy and firm mission), and institutional-level factors (e.g., stakeholder influence and economic conditions) [15]. In this regard, previous studies have largely advanced our understanding of why firms engage in socially responsible (or irresponsible) practices. However, little is known about why firms make over-investments in CSR. This research attempted to fulfill this research gap.
In this research, we took the social exchange perspective [16,17] in an attempt to better understand reasons for over-investment in CSR. In general, we suggest that firms make excessive CSR investments to maintain good governmental relationships and political legitimacy. We examined a sample of private firms in China and found that private firms with political ties are more likely to over-invest in CSR than firms without political ties. We suggest that political ties give political legitimacy and access to governmental resources. Hence, firms that enjoy the benefits of political ties over-invest in CSR as a way to positively reciprocate. We also found that regional competition for governmental resources strengthens the relationship between political ties and over-investments in CSR.
Our study contributes to the CSR literature in two important ways. First, we addressed an important research topic that previous studies have largely ignored. That is, we focused on over-investments rather than on CSR itself. Although much is known about CSR and its antecedents and outcomes [18,19] and CSR is understood as a form of investment [8], only a few studies have considered over-investments. Adopting the methodology of Lys et al. [12], we empirically showed that Chinese private firms invest excessively in CSR. We also found that political ties are linked with the probability that firms will over-invest in CSR. Our study broadened our understanding of CSR and suggested that scholars should shift attention to over-investments. Second, we examined CSR from the social exchange perspective [17] and offered a new avenue for investigating CSR. Previous studies have investigated CSR from many theoretical lenses. Although “we seem know quite a bit about the reasons why organizations engage in CSR” [20], examining CSR from the social exchange perspective can enable us to understand why firms make over-CSR investments that generate negative financial returns. Our results provided guidance for firms’ decision-making in CSR investment.

2. Literature Review

Many studies have examined the antecedent of CSR (for a comprehensive review, see Aguinis and Glavas [15]). Factors that can influence CSR can be divided into three groups: individual-level factors, organizational-level factors, and institutional level factors. For example, individual-level factors are supervisor commitment to CSR [21], employee psychological needs [22], and employee perceptions of CSR [23]. Previous studies have also examined organizational-level factors, such as competitiveness [24], seeking legitimacy [25], and firm mission [26]. Lastly, institutional-level factors that are supposed to influence CSR include stakeholder influence [27], economic conditions [28], and activist group pressures [29].
Previous studies that examined the antecedents of CSR at various levels had largely advanced our understanding of why firms engage in socially responsible (or irresponsible) practices. However, very few studies have considered whether firms may over-invest in CSR and what factors may lead them to make over-investments in CSR. As noted above, a firm can have several reasons to engage in in socially responsible (or irresponsible) practices. In this regard, the firm may pursue CSR not for its economic gains. For example, some Chinese private firms make very generous charitable donations in order to maintain a legitimate image in the eyes of the government [7]. Perhaps, such donations may be beyond pure economic considerations and might exceed the optimal levels of CSR investments. In fact, a few studies have recognized that some may invest in CSR over the optimal level (e.g., [12]). While scholars have acknowledged the fact that firms may invest in CSR over the optimal levels, we know little about why firms make over-investments in CSR. To fulfill this research gap, this study explored whether privative firms with political ties are more likely to over-invest in CSR than firms without political ties.

3. Theory and Hypotheses

3.1. Political Ties and Private Firms’ Over-Investment in CSR

In transitional economies where institutional environments are underdeveloped, legal systems are ineffective and the government stills controls valuable resources and impacts firm strategies [18,19,20]. Firms find it increasingly important to develop favorable governmental relationships for obtaining political legitimacy [30], which is particularly crucial if they are to survive and grow [31]. Without political legitimacy, firms cannot obtain governmental resources or preferential treatment [31,32]. Both state-owned and private firms in China are pressed to acquire political legitimacy, but state-owned firms have a general advantage in that they can obtain political legitimacy through state-ownership and the appointment of governmental officials [33]. Often, the government ultimately owns state-owned firms and appoints governmental officials to act as supervisors, directors, and top executives. In contrast, private firms cannot directly access governmental resources without a relationship with the government, and they must engage in non-market strategies to acquire political legitimacy and obtain governmental resources [32].
The notion “political ties” refers to firms’ social connections with government officials in various levels of administration, and is extraordinary popular in transitional economies [33]. Many entrepreneurs are keen to establish political ties since they are reliable and effective in maintaining the relationship between the government and firms [34]. More specifically, political ties can help firms to get policy information, more favorable treatment, subsidies, and tax rebates from the government, and enhance firms’ financial performance [35]. Thus, political ties play a key role in the improvement of firms’ financial performance in transitional economies.
Private firms commonly try to establish political ties for obtaining political legitimacy and gaining access to governmental resources [35]. For instance, many entrepreneurs of private firms strive to join two political institutions, namely, the Chinese People’s Political Consultative Conference (CPPCC) and the People’s Congress (PC), because membership confers political ties that enable entrepreneurs to contact political officials, acquire preferential governmental treatment, and directly participate in political decision-making processes in favor of their firms’ interests [35]. However, the establishment of political ties does not necessarily ensure that private firms can obtain continual political legitimacy and access to governmental resources. Political ties offer only a channel for social exchanges between the government and private firms. According to the social exchange theory, if one party acquires benefits from another party, positive reciprocation is expected. If the benefitting party fails to reciprocate positively or even reciprocate negatively, it violates the principle of positive reciprocity. Consequently, the party that conveyed the benefits will punish or respond negatively to the party that benefitted [16,17]. That is, when the government grants political legitimacy and provides governmental resources to private firms through political ties, the private firms must exchange favors by giving the government a “gift” [36]. If they fail to properly exchange the favors, the government will cease to grant political legitimacy, stop providing governmental resources, or even punish them [36].
Since 2006, the Chinese government has issued several policies, encouraging firms to promote CSR [37], signaling that the government needs firms to help address social issues [38]. Consequently, private firms with political ties are more likely to invest excessively, beyond optimal levels, to show their compliance with governmental policies [38]. By over-investing in CSR, firms signal to the government that they are aware of governmental policies regarding CSR and are willing to sacrifice their profits to address social issues. In this case, over-investments are the “gift” in exchange for government-provided political legitimacy and resources. That is, firms with political ties are more motivated to allocate corporate resources to show their sincerity and loyalty to the government by contributing to causes that deal with natural disasters and environmental protection, improving working conditions and employee health, and enhancing community welfare [31,37].
In contrast, private firms that lack such political ties are less likely to make excessive CSR investments. Lacking political legitimacy through political ties, they do not need to positively reciprocate to the government. Although they may still invest in CSR, often even heavily, they are less likely to over-invest. Instead, their CSR investments are largely profit-driven to maximize economic returns. In sum, we hypothesize:
Hypothesis 1.
Private firms with political ties are more likely to over-invest in CSR than firms without political ties.

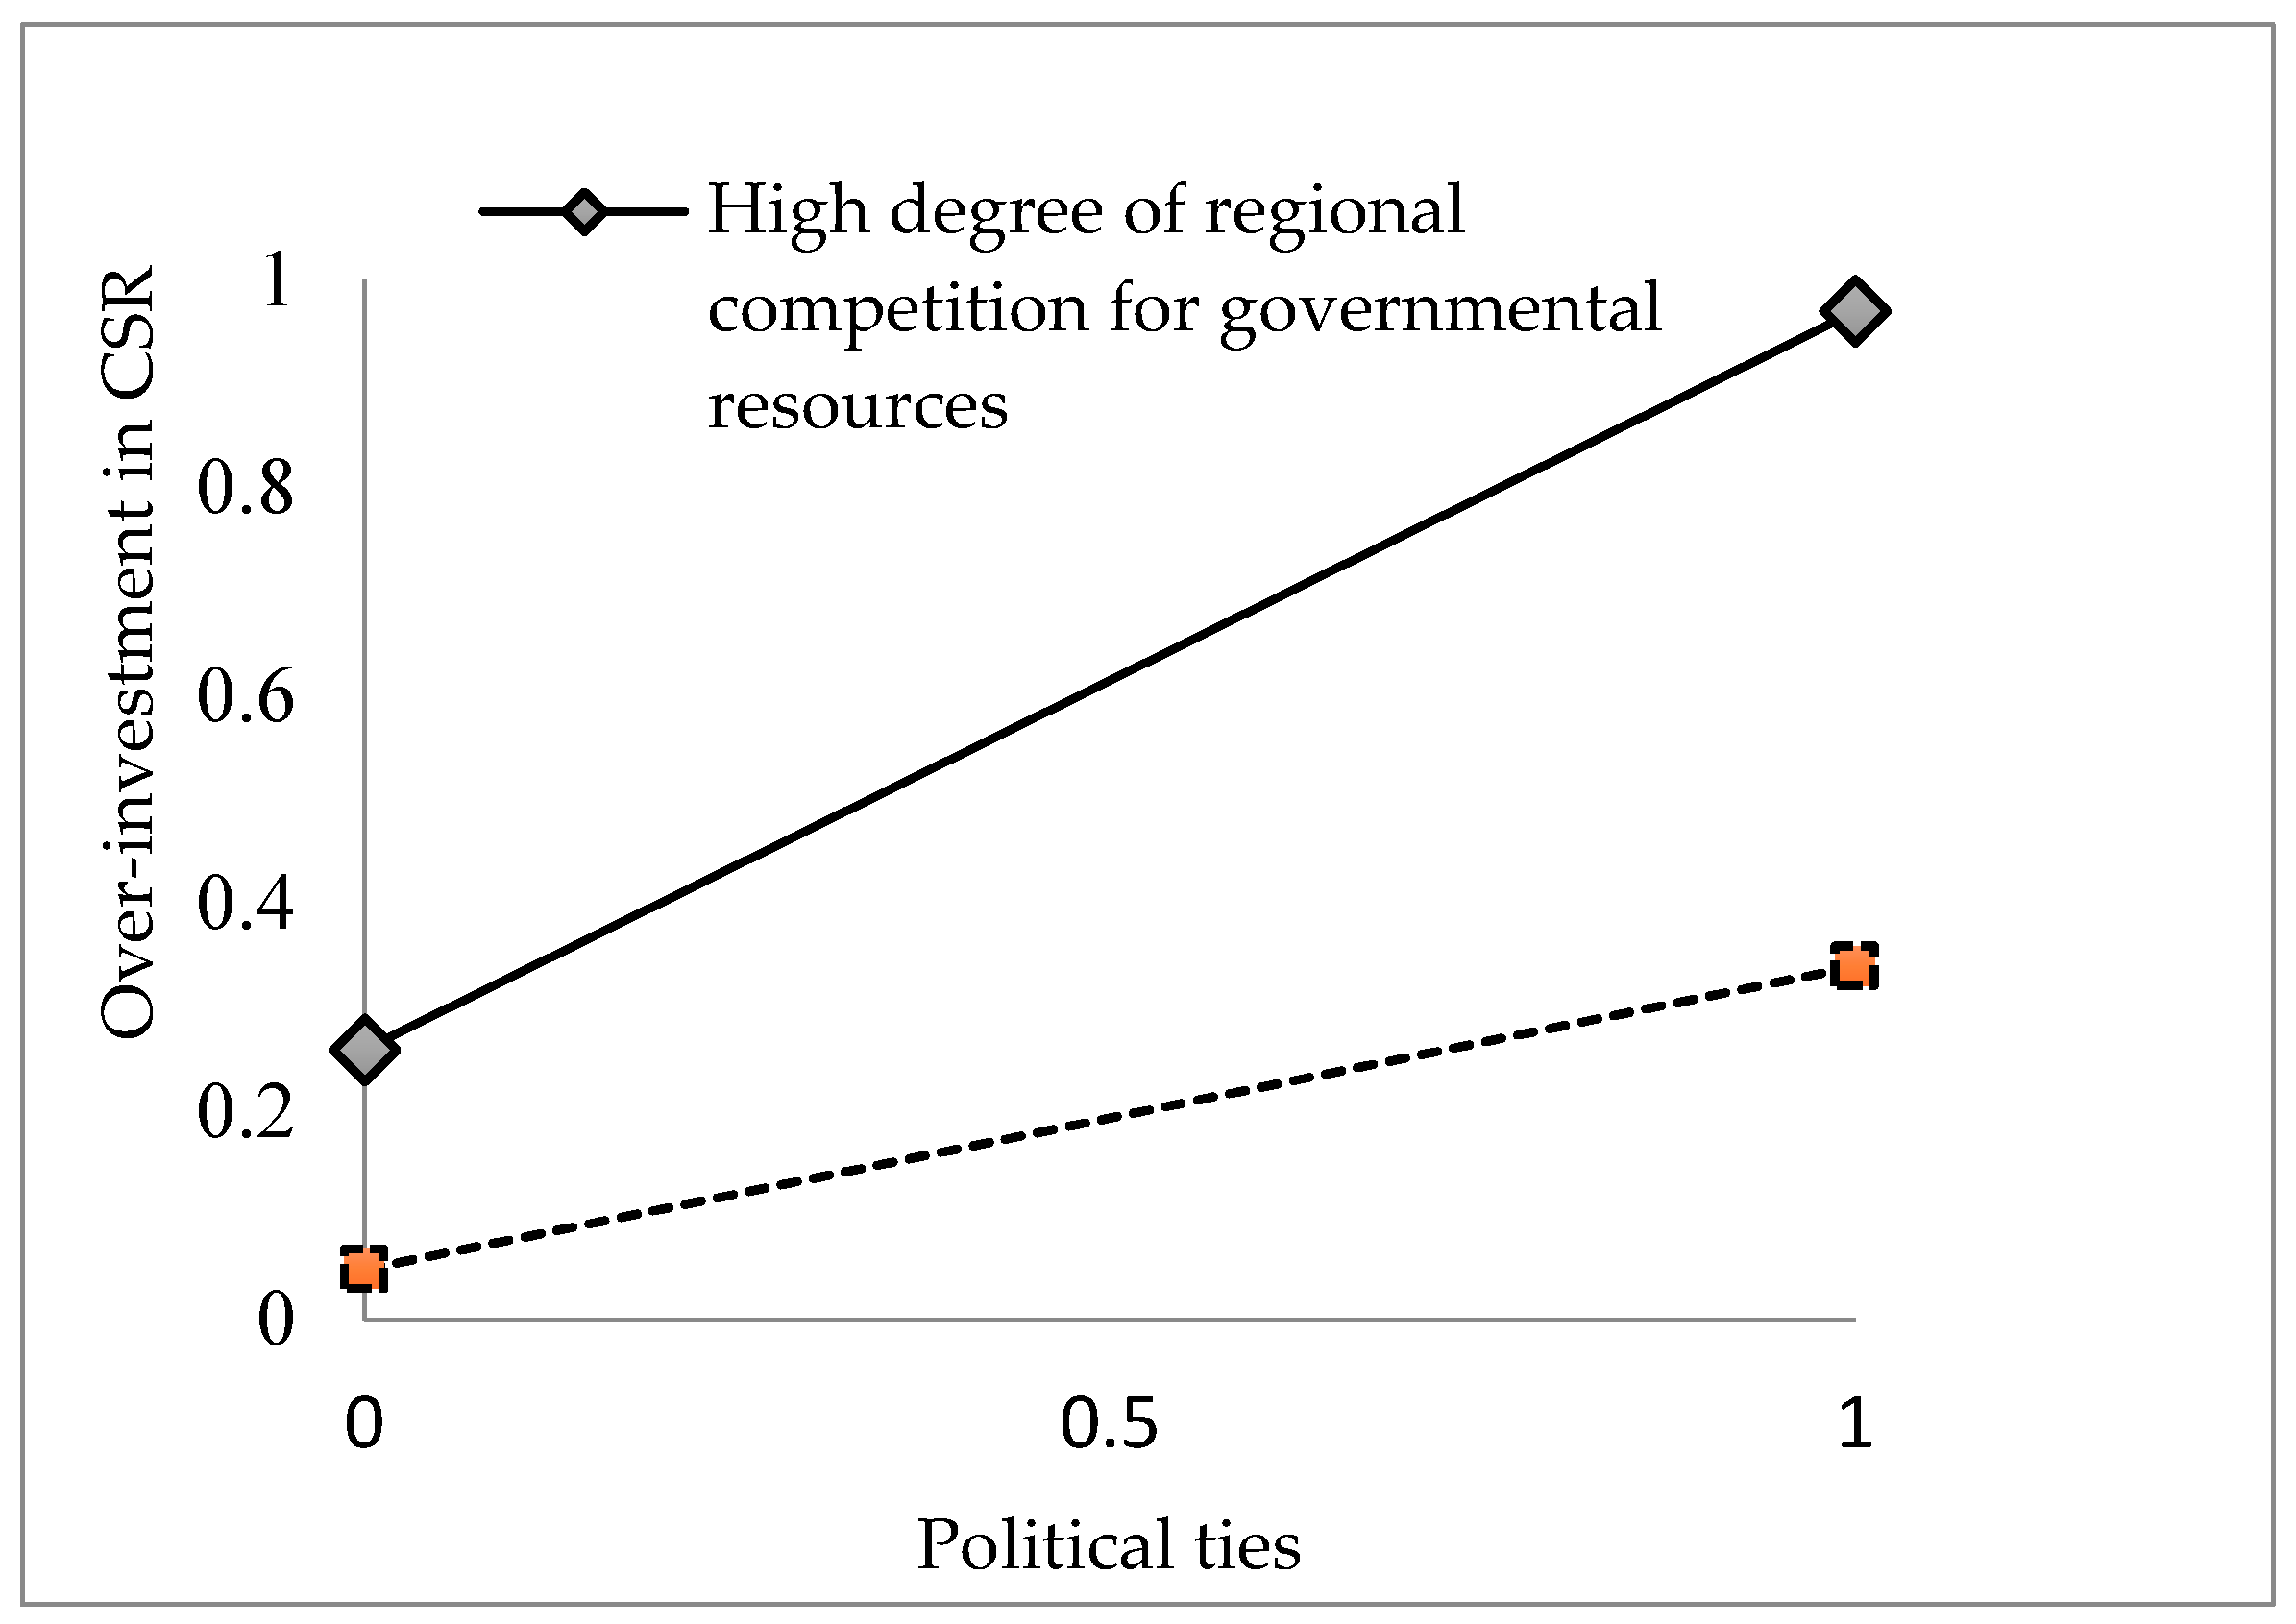
3.2. The Moderating Effect of Regional Competition for Governmental Resources

Political legitimacy is crucial to private firms in China; they must obtain and maintain political legitimacy if they are to benefit from favorable firm/governmental relationships and governmental resources [30]. However, governmental resources are limited and thus private firms are faced with the need to compete with one another to obtain resources [39]. As competition for governmental resources intensifies, maintaining favorable firm/government relationships and political legitimacy becomes even more essential [33]. Therefore, competition could affect the likelihood of over-investments in CSR.
Across China’s regions, non-state sectors differ largely and the number of private firms varies greatly, so the competition for governmental resources also varies [40]. For instance, eastern regions have many more private firms than central and western regions [41]. The competition varies substantially across regions because the number of competing firms determines the competition for governmental resources [42]. In regions that have more competition for governmental resources, private firms with political ties will be locked in stronger competitive battles with many other private firms and will be more likely to over-invest in CSR in exchange for political legitimacy and governmental resources. In contrast, in regions that have less competition, private firms with political ties will compete against fewer private firms. In that case, private firms are less likely over-invest in CSR in exchange for political legitimacy and governmental resources.
Hypothesis 2.
Political ties will more strongly and positively influence over-investments in CSR in regions that have more competition for governmental resources than in regions that have less competition for governmental resources.

4. Methods

4.1. Data and Sample

To examine our hypotheses, we relied on the Chinese Private Enterprise Survey conducted in March 2008. This survey was conducted jointly by the United Front Work Department of the Central Committee of the Chinese Communist Party, the All-China Federation of Industry and Commerce, the State Administration for Industry and Commerce of China, and the China Private Economy Association. This survey has been used by many studies focusing on private firms in China, and recently published studies using this survey include Gao et al. [43] and Zhang et al. [44]. Originally, the State Bureau of Statistics of China used this survey to collect information of private enterprises in China, including entrepreneurial characteristics, firm information, and a wide range of management practices. The original sample consisted of 4096 private firms. After deleting missing values, the final sample consisted of 2304 private firms.
We proposed that this survey would be particularly useful for our study for two reasons. First, this survey specifically focused on Chinese private firms and thus it was suitable for testing our hypotheses that address CSR investments of Chinese private firms. Second, and more importantly, the year of 2008 offered a particularly useful context for our study. As suggested by Hypothesis 1, private firms with political ties are more likely to invest excessively in CSR, beyond optimal levels, to show their compliance with governmental policies promoting CSR and accordingly to obtain governmental resources. We posited that this relationship would be salient during the 2008 crisis. Around the year of 2008, financial crisis led to a global recession and many Chinese private firms struggled to survive. Due to the significant impact of the financial crisis, many Chinese private firms depend more on governmental resources to survive and thus are likely to make excessive CSR investments in order to exchange for governmental favors and resources, as our study had predicted. However, we also wondered whether our hypotheses will hold for other years without crises. Due to data limitations, our study could only use the data of 2008 to test our hypotheses, but we encourage future studies to test our hypotheses using data from other years without crises. We also encourage future studies to test our hypotheses using data from other years with crises (e.g., COVID-19 in 2020).

4.2. Measures

Dependent variable. For this study, the dependent variable was over-investments in CSR. We followed Lys et al. [12] to construct a dummy variable to reflect whether private firms made CSR investments that were above optimal levels. Here, optimal-level CSR investments refer to CSR investments that maximize the economic returns for the investments. In other words, optimal-level CSR investments represent CSR investments that can be explained by economic factors; non-optimal level CSR investments are unrelated to economic factors [12]. In this sense, CSR investments are either optimal-level or non-optimal-level investments. For our purposes, CSR investment is the ratio of total sales in 2007 to the total amount of firm investment in the environment, employee welfare, and local community [45]. Following Lys et al. [12], we used Equation (1) to estimate the optimal-level CSR investments:
CSR investments = β0 + β1 firm factors + β2 industry factors + εi
To ensure that firm and industry factors can explain as much of the variation in CSR investments as possible, we comprehensively searched the extant literature to find factors that are related with CSR investments. Specifically, firm factors included firm age and firm size [46], advertising and R&D expenditures [47], brand numbers [48], managerial discretion [49], leverage ratio [50], number of new products [51], donation history [52], overseas sales and investments [53], return on equity (ROE) and return on sales (ROS), and net income [54]. Firm factors also included whether the firm has a quality certificate such as ISO 9000 and whether the firm had previously made charitable donations [55]. We also included industry-fixed effect [56,57]. We used the fitted value of CSR investments estimated from Equation (1) as a proxy for the optimal-level CSR investments, and then used the residuals to construct the measure for over-investments. That is, we coded over-investment in CSR “1” if the residual was greater than zero and “0” otherwise.
Independent variable. We adopted the measure of political ties from Marquis and Qian’s [38] study. This dummy variable was coded “1” if the owner of a private firm was a member of the CPPCC or a delegate of the PC and “0” otherwise.
Moderator. Regional competition for governmental resources was measured by a major subcategory in marketization index: the development of non-state sectors in China [40]. This index was constructed based on an aggregation of (a) the ratio of the sales of the non-state sector to the total sales of all firms, (b) the ratio of the fixed-assets of the non-state sector to the total fixed assets of all firms, and (c) the ratio of the number of employees in the non-state sector to the total number of employees. This index is a suitable measure for regional competition for governmental resources because in regions with more developed private sectors, more private firms compete for limited governmental resources [39].
Control variables. To exclude alternative explanations, we controlled for some characteristics of firm, industry, and owners of private firms because they may confound the relationship between political ties and over-investments in CSR. All variables used to estimate optimal-level CSR investments were also included. We also controlled some characteristics of private firm owners including age, education, gender, and duality status. All variables are defined in Table 1.

5. Results

We report the means, standard deviations, and correlations of variables in Appendix A (Table A1). Table 2 reports the regression results of estimating the optimal-level investments in CSR. We followed the method suggested by Lys et al. [12] to find the factors which could affect private firms’ investments in CSR. Model 1 in Table 2 includes the factors that are expected to influence CSR investments. Following Lys et al. [12], we specifically dropped some factors (Model 2 and Model 3) and/or eliminated the industry-fixed effect (Model 4). In sum, Model 1 had the highest explanatory power, as suggested by the highest R2 (44.9%). To construct the measure of over-investments in CSR, we used the residuals obtained from Model 1 because Model 1 had the highest explanatory power [12].
Our empirical model included firm-level variables (e.g., political ties) and a regional-level variable (i.e., regional competition for governmental resources), as well as an interaction term between political ties and regional competition for governmental resources. Therefore, we utilized the mixed-effects method to test our hypotheses to account for both fixed effects and random effects [58,59]. Table 3 reports the results of the mixed-effects method. To confirm the robustness of our results, we further used probit regression to test our hypotheses and obtained similar results. The results of the probit regression are reported in Appendix A (Table A2).
Model 1 of Table 3 included all control variables and the moderator. Hypothesis 1 predicts a positive relationship between private firms’ political ties and over-investments in CSR. In model 2, political ties were significantly and positively related to over-investments in CSR (β = 0.188, p < 0.05), providing empirical support for Hypothesis 1. We can also interpret the economic effect of political ties on over-investments in CSR. More precisely, results of Model 2 suggested that, on average, firms with political ties make 118.8% more over-investments in CSR than firms without political ties.
Hypothesis 2 predicted that political ties will have a stronger positive association with over-investments in CSR in regions with more competition for governmental resources. To examine the hypothesis, we added the interaction terms between political ties and regional competition. Both variables were mean-centered before constructing the interaction term [60]. Results of Model 3 supported Hypothesis 2. Specifically, the coefficient of the interaction term was positive and significant (β = 0.046, p < 0.10). To further demonstrate the moderating effect of regional competition for governmental resources, we plotted the interaction effect between political ties and competition for governmental resources. As demonstrated by Figure 1, the relationship between political ties and over-investments in CSR was stronger for firms in regions with more competition for governmental resources than for firms in regions with less competition for governmental resources. Therefore, Hypothesis 2 was confirmed by Figure 1.

6. Conclusions

Our study empirically supported our proposal that Chinese private firms with political ties are more likely than those without political ties to over-invest in CSR. Moreover, we found that regional competition for governmental resources strengthens the relationship between political ties and over-investments. This study differed from extant literature of CSR in two important ways and provided theoretical implications for current CSR literature.
First, we differed from previous literature in that we examined over-investments in CSR. As our literature review indicates, most previous studies examined the antecedents of CSR. With a few exceptions [12], previous studies largely neglected the fact that some firms may make excessive investments in CSR than the optimal levels. In fact, CSR is similar to other corporate activities, such as R&D and advertising, in that it incurs costs [8] and often has uncertain and ambivalent economic returns [11,61]. Thus, some firms may quite possibly over-invest or exceed optimal levels for enjoying investment returns. In this study, we applied the method of Lys et al. [12] to empirically estimate over-investments in CSR of Chinese private firms. The results suggested that, in our sample, 42% firms made over-investments in CSR. Many previous studies have examined the relationship between CSR investments and financial performance and reported mixed results (e.g., [62,63]). The inconsistent relationship between CSR investments and financial performance is still an ongoing debate [63] and needs further exploration [64]. In this regard, our finding that many firms make over-investments in CSR could potentially provide a new explanation for the inconsistent relationship. Future studies examining the linkage between CSR over-investments and financial performance could add new insights to explain the relationship between CSR investments and financial performance.
Second, we took a social exchange perspective to examine political ties as driving over-investments in CSR. As noted above, many firms in our sample make over-investments in CSR. Therefore, it is interesting to explore why so many firms make CSR investments exceeding the optimal levels. Our study begins to answer this question by looking at the relationship between political ties and CSR over-investments. Political ties are known to grant firms political legitimacy and access to governmental resources [39]. However, the social exchange theory suggests that the benefits obtained through political ties require positive reciprocation. We contend that private firms use over-investments to signal to the government that they are responding to government requests to promote CSR in reciprocation for the benefits they have received. Therefore, private firms with political ties are more likely to over-invest in CSR. We also acknowledge that other factors could also matter to firms’ decisions of whether to over-invest in CSR. In addition to the social exchange perspective, other theories can also provide explanations for whether and why firms invest in CSR excessively more than the optimal levels. Therefore, futures studies can either explore other factors influencing over-investments in CSR or theoretical mechanisms explaining over-investments in CSR.
Lastly, our study was not without limitations. One limitation was that the data sample was from 2008 and consisted of private enterprises in China, because we did not find other similar datasets for our study. To examine the generalizability of the results of our study, future studies may collect data from other samples (e.g., publically listed firms) across more years. We also suggest that future studies examine our theory in years without crises, as well as years with crises, such as COVID-19.

Author Contributions

Conceptualization, methodology, writing—original draft preparation, C.X.; Validation, writing—review and editing, K.Z.; Data analysis, validation, writing—review and editing, X.Z. All authors have read and agreed to the published version of the manuscript.

Funding

This research was funded by the National Nature Science Foundation of China, grant numbers 71702137 and 71632007; the Hubei Soft Science Project, grant number 2017ADC107; and the Scientific Research Plan of Hubei Provincial Department of Education, grant number Q20171506.

Conflicts of Interest

The authors declare no conflict of interest.

Appendix A

Table A1. Descriptive Statistics and Correlations.
VariableMeanSD123456789101112
CSR investments0.170.001
CSR over-investment0.420.490.291
Political ties0.470.50−0.110.141
Regional competition for government resources9.842.67−0.090.110.021
Firm age7.394.75−0.070.040.250.121
Firm size6.672.18−0.440.240.400.230.231
New product number0.661.16−0.060.080.200.130.150.321
Brand number0.190.42−0.060.060.240.010.160.260.361
Overseas investment ratio0.000.050.010.010.02−0.000.00−0.010.020.011
Overseas sales ratio0.050.02−0.060.060.070.170.070.210.250.080.041
R&D intensity0.020.130.110.00−0.01−0.02−0.00−0.080.120.030.010.031
Advertisement intensity0.010.120.32−0.02−0.02−0.03−0.03−0.130.010.000.00−0.020.211
ROS4.570.13−0.190.020.020.010.020.040.010.010.000.000.000.00
Leverage ratio1.044.67−0.040.020.04−0.010.020.110.040.06−0.010.03−0.00−0.01
Donation history0.990.080.11−0.020.050.020.030.110.070.060.010.040.020.02
Quality certificate0.460.50−0.100.060.260.100.180.430.350.340.030.150.03−0.03
ROE0.730.08−0.080.080.040.030.040.130.070.050.000.010.06−0.01
Income8.250.23−0.090.140.170.050.090.330.190.18−0.000.040.08−0.02
Managerial discretion0.330.470.060.01−0.120.020.01−0.24−0.12−0.08−0.03−0.04−0.03−0.02
Entrepreneur duality1.090.290.04−0.00−0.12−0.06−0.07−0.07−0.02−0.020.03−0.04−0.020.03
Entrepreneur age47.1970.37−0.02−0.03−0.02−0.020.020.020.010.00−0.01−0.00−0.00−0.01
Entrepreneur education3.031.190.02−0.10−0.140.090.05−0.18−0.14−0.11−0.03−0.01−0.040.00
Entrepreneur gender1.150.360.00−0.05−0.10−0.07−0.07−0.13−0.08−0.030.03−0.040.020.02
1314151617181920212223
ROS1
Leverage ratio0.001
Donation history0.000.021
Quality certificate0.020.070.081
ROE0.020.300.020.081
Income0.020.020.020.190.251
Managerial discretion0.01−0.03−0.01−0.13−0.03−0.091
Entrepreneur duality0.01−0.02−0.05−0.060.02−0.0−0.101
Entrepreneur age0.00−0.01−0.010.01−0.010.01−0.020.001
Entrepreneur education0.000.02−0.01−0.11−0.04−0.100.19−0.060.031
Entrepreneur gender0.01−0.02−0.02−0.10−0.01−0.040.010.070.00−0.011
Note: The highlighted figures indicate that a correlation coefficient is significant at least at the 5% level.
Table A2. Robustness Test by Probit Regression.
DV = Over-Investment in CSRModel 1Model 2Model 3
Control variable
Regional competition for governmental resources0.027 ***0.030 ***0.029 ***
(0.010)(0.010)(0.011)
Firm age−0.007−0.010 **−0.010 **
(0.005)(0.005)(0.005)
Firm size0.141 ***0.127 ***0.130 ***
(0.037)(0.040)(0.040)
New product number0.0080.0090.005
(0.030)(0.030)(0.030)
Brand number0.009−0.014−0.011
(0.060)(0.058)(0.057)
Overseas investment ratio0.4960.4520.495
(0.534)(0.516)(0.526)
Overseas sales ratio−0.054−0.051−0.065
(0.121)(0.124)(0.122)
R&D intensity0.0160.0160.002
(0.333)(0.336)(0.334)
Advertisement intensity0.2610.2430.238
(0.195)(0.192)(0.193)
ROS0.1180.1160.118
(0.098)(0.099)(0.097)
Leverage ratio−0.003−0.003−0.003
(0.004)(0.004)(0.004)
Donation history−0.614 **−0.635 **−0.649 **
(0.295)(0.300)(0.304)
Quality certificate−0.171 ***−0.180 ***−0.186 ***
(0.066)(0.064)(0.064)
ROE0.6180.6340.675
(0.638)(0.658)(0.655)
Net income0.3380.3270.326
(0.284)(0.285)(0.283)
Managerial discretion0.219 ***0.229 ***0.231 ***
(0.077)(0.076)(0.077)
Entrepreneur’s duality0.0040.0260.023
(0.113)(0.117)(0.117)
Entrepreneur’s age−0.001 ***−0.001 ***−0.001 ***
(0.000)(0.000)(0.000)
Entrepreneur’s education−0.079 ***−0.074 ***−0.074 ***
(0.019)(0.019)(0.019)
Entrepreneur’s gender−0.070−0.060−0.059
(0.098)(0.098)(0.098)
Independent variable
Political ties 0.197 ***0.185 **
(0.074)(0.088)
Interaction term
Political ties × competition for governmental resources 0.044 **
(0.020)
Industry dummiesIncludedIncludedIncluded
Log likelihood−1479.816 ***−1474.748 ***−1472.454 ***
N230423042304
Note: ***, **, and * indicate significance at the 1%, 5%, and 10% levels, respectively. N denotes sample size.

References

  1. Lin, K.J.; Tan, J.; Zhao, L.; Karim, K. In the name of charity: Political connections and strategic corporate social responsibility in a transition economy. J. Corp. Financ. 2015, 32, 327–346. [Google Scholar] [CrossRef]
  2. Barnea, A.; Rubin, A. Corporate social responsibility as a conflict between shareholders. J. Bus. Ethics 2010, 97, 71–86. [Google Scholar] [CrossRef]
  3. Jamali, D.; Mirshak, R. Corporate social responsibility (CSR): Theory and practice in a developing country context. J. Bus. Ethics 2007, 72, 243–262. [Google Scholar] [CrossRef]
  4. Benlemlih, M.; Bitar, M. Corporate social responsibility and investment efficiency. J. Bus. Ethics 2018, 148, 647–671. [Google Scholar] [CrossRef]
  5. Becchetti, L.; Ciciretti, R.; Hasan, I. Corporate social responsibility, stakeholder risk, and idiosyncratic volatility. J. Corp. Financ. 2015, 35, 297–309. [Google Scholar] [CrossRef]
  6. Albuquerque, R.; Koskinen, Y.; Zhang, C. Corporate social responsibility and firm risk: Theory and empirical evidence. Manag. Sci. 2019, 65, 4451–4469. [Google Scholar] [CrossRef] [Green Version]
  7. Wang, H.; Qian, C. Corporate philanthropy and corporate financial performance: The roles of stakeholder response and political access. Acad. Manage. J. 2011, 54, 1159–1181. [Google Scholar] [CrossRef]
  8. McWilliams, A.; Siegel, D. Corporate social responsibility: A theory of the firm perspective. Acad. Manag. Rev. 2001, 26, 117–127. [Google Scholar] [CrossRef]
  9. Cheng, B.; Ioannou, I.; Serafeim, G. Corporate social responsibility and access to finance. Strateg. Manag. J. 2014, 35, 1–23. [Google Scholar] [CrossRef]
  10. Mackey, A.; Mackey, T.B.; Barney, J.B. Corporate social responsibility and firm performance: Investor preferences and corporate strategies. Acad. Manag. Rev. 2007, 32, 817–835. [Google Scholar] [CrossRef]
  11. Margolis, J.D.; Walsh, J.P. Misery loves companies: Rethinking social initiatives by business. Adm. Sci. Q. 2003, 48, 268–305. [Google Scholar] [CrossRef] [Green Version]
  12. Lys, T.; Naughton, J.P.; Wang, C. Signaling through corporate accountability reporting. J. Account. Econ. 2015, 60, 56–72. [Google Scholar] [CrossRef] [Green Version]
  13. Utz, S. Over-investment or risk mitigation? Corporate social responsibility in Asia-Pacific, Europe, Japan, and the United States. Rev. Financ. Econ. 2018, 36, 167–193. [Google Scholar] [CrossRef]
  14. Bhandari, A.; Javakhadze, D. Corporate social responsibility and capital allocation efficiency. J. Corp. Financ. 2017, 43, 354–377. [Google Scholar] [CrossRef]
  15. Aguinis, H.; Glavas, A. What we know and don’t know about corporate social responsibility a review and research agenda. J. Manag. 2012, 38, 932–968. [Google Scholar]
  16. Blau, P.M. Justice in social exchange. Sociol. Inq. 1964, 34, 193–206. [Google Scholar] [CrossRef]
  17. Cropanzano, R.; Mitchell, M.S. Social exchange theory: An interdisciplinary review. J. Manag. 2015, 31, 874–900. [Google Scholar] [CrossRef] [Green Version]
  18. Yin, J.; Singhapakdi, A.; Du, Y. Causes and moderators of corporate social responsibility in China: The influence of personal values and institutional logics. Asian. Bus. Manag. 2016, 15, 226–254. [Google Scholar] [CrossRef]
  19. Hoskisson, R.E.; Eden, L.; Lau, C.M.; Wright, M. Strategy in emerging economies. Acad. Manag. J. 2000, 43, 249–267. [Google Scholar]
  20. Li, H.; Zhang, Y. The role of managers political networking and functional experience in new venture performance: Evidence from Chinas transition economy. Strateg. Manag. J. 2007, 28, 791–804. [Google Scholar] [CrossRef]
  21. Muller, A.; Kolk, A. Extrinsic and intrinsic drivers of corporate social performance: Evidence from foreign and domestic firms in Mexico. J. Manag. Stud. 2010, 47, 1–26. [Google Scholar] [CrossRef]
  22. Rupp, D.E. An employee-centered model of organizational justice and social responsibility. Organ. Psychol. Rev. 2011, 1, 72–94. [Google Scholar]
  23. Rupp, D.E.; Ganapathi, J.; Aguilera, R.V.; Williams, C.A. Employee reactions to corporate social responsibility: An organizational justice framework. J. Organ. Behav. 2006, 27, 537–543. [Google Scholar] [CrossRef]
  24. Bansal, P.; Roth, K. Why companies go green: A model of ecological responsiveness. Acad. Manag. J. 2000, 43, 717–736. [Google Scholar]
  25. Sharma, S. Managerial interpretations and organizational context as predictors of corporate choice of environmental strategy. Acad. Manag. J. 2000, 43, 681–697. [Google Scholar]
  26. Marcus, A.A.; Anderson, M.H. A general dynamic capability: Does it propagate business and social competencies in the retail food industry? J. Manag. Stud. 2006, 43, 19–46. [Google Scholar] [CrossRef]
  27. Brammer, S.; Millington, A. Does it pay to be different? An analysis of the relationship between corporate social and financial performance. Strateg. Manag. J. 2008, 29, 1325–1343. [Google Scholar] [CrossRef]
  28. Campbell, J.L. Why would corporations behave in socially responsible ways? An institutional theory of corporate social responsibility. Acad. Manag. Rev. 2007, 32, 946–967. [Google Scholar] [CrossRef]
  29. den Hond, F.; de Bakker, F.G.A. Ideologically motivated activism: How activist groups influence corporate social change activities. Acad. Manag. Rev. 2007, 32, 901–924. [Google Scholar] [CrossRef] [Green Version]
  30. Hillman, A.J.; Withers, M.C.; Collins, B.J. Resource dependence theory: A review. J. Manag. 2009, 35, 1404–1427. [Google Scholar] [CrossRef] [Green Version]
  31. Tokoro, N. Stakeholders and corporate social responsibility (CSR): A new perspective on the structure of relationships. Asian Bus. Manag. 2007, 6, 143–162. [Google Scholar] [CrossRef]
  32. Li, W.; Zhang, R. Corporate social responsibility, ownership structure, and political interference: Evidence from China. J. Bus. Ethics 2010, 96, 631–645. [Google Scholar] [CrossRef]
  33. Xin, K.K.; Pearce, J.L. Guanxi: Connections as substitutes for formal institutional support. Acad. Manag. J. 1996, 39, 1641–1658. [Google Scholar]
  34. Okhmatovskiy, I. Performance implications of ties to the government and SOEs: A political embeddedness perspective. J. Manag. Stud. 2010, 47, 1020–1047. [Google Scholar] [CrossRef]
  35. Peng, M.W.; Luo, Y. Managerial ties and firm performance in a transition economy: The nature of a micro-macro link. Acad. Manag. J. 2000, 43, 486–501. [Google Scholar]
  36. Shleifer, A.; Vishny, R.W. Politicians and firms. Q. J. Econ. 1994, 109, 995–1025. [Google Scholar] [CrossRef]
  37. See, G. Harmonious Society and Chinese CSR: Is There Really a Link? J. Bus. Ethics 2009, 89, 1–22. [Google Scholar] [CrossRef]
  38. Marquis, C.; Qian, C. Corporate social responsibility reporting in China: Symbol or substance? Organ Sci. 2013, 25, 127–148. [Google Scholar] [CrossRef]
  39. Park, S.H.; Luo, Y. Guanxi and organizational dynamics: Organizational networking in Chinese firms. Strateg. Manag. J. 2001, 22, 455–477. [Google Scholar] [CrossRef]
  40. Fan, G.; Wang, X.; Zhu, H. Index of Marketization of China; Economic Science Press: Beijing, China, 2007. [Google Scholar]
  41. Cui, G.; Liu, Q. Regional market segments of China: Opportunities and barriers in a big emerging market. J. Consum. Mark. 2003, 17, 55–72. [Google Scholar] [CrossRef] [Green Version]
  42. Boisot, M.; Child, J. From fiefs to clans and network capitalism: Explaining China’s emerging economic order. Adm. Sci. Q. 1996, 41, 600–628. [Google Scholar] [CrossRef]
  43. Gao, Y.; Hafsi, T.; He, X. Business owners’ achieved social status and corporate philanthropy: Evidence from Chinese private small-and medium-sized enterprises. J. Manag. Organ. 2017, 23, 277–296. [Google Scholar] [CrossRef]
  44. Zhang, Y.; Liu, C.; Wang, T. Direct or indirect? The impact of political connections on export mode of Chinese private enterprises. China Econ. Rev. 2020, 61, 1–16. [Google Scholar] [CrossRef]
  45. Fabrizi, M.; Mallin, C.; Michelon, G. The role of CEO’s personal incentives in driving Corporate Social Responsibility. J. Bus. Ethics 2014, 124, 311–326. [Google Scholar] [CrossRef] [Green Version]
  46. Arya, B.; Zhang, G. Institutional reforms and investor reactions to CSR announcements: Evidence from an emerging economy. J. Manag. Stud. 2009, 46, 1089–1112. [Google Scholar] [CrossRef]
  47. Luo, X.; Bhattacharya, C.B. The debate over doing good: Corporate social performance, strategic marketing levers, and firm-idiosyncratic risk. J. Mark. 2009, 73, 198–213. [Google Scholar] [CrossRef] [Green Version]
  48. Berens, G.; Van Riel, C.B.; Van Bruggen, G.H. Corporate associations and consumer product responses: The moderating role of corporate brand dominance. J. Mark. 2005, 69, 35–48. [Google Scholar] [CrossRef] [Green Version]
  49. Arnaud, S.; Wasieleski, D.M. Corporate humanistic responsibility: Social performance through managerial discretion of the HRM. J. Bus. Ethics 2014, 120, 313–334. [Google Scholar] [CrossRef]
  50. Orlitzky, M.; Benjamin, J.D. Corporate social performance and firm risk: A meta-analytic review. Bus. Soc. 2001, 40, 369–396. [Google Scholar] [CrossRef]
  51. Smith, S.M.; Alcorn, D.S. Cause marketing: A new direction in the marketing of corporate responsibility. J. Consum. Mark. 1991, 8, 19–35. [Google Scholar] [CrossRef]
  52. Wang, S.; Gao, Y.; Hodgkinson, G.P.; Rousseau, D.M.; Flood, P.C. Opening the black box of CSR decision making: A policy-capturing study of charitable donation decisions in China. J. Bus. Ethics 2015, 128, 665–683. [Google Scholar] [CrossRef] [Green Version]
  53. Liu, X.; Garcia, P.; Vredenburg, H. CSR adoption strategies of Chinese state oil companies: Effects of global competition and cooperation. Soc. Resp. J. 2014, 10, 38–52. [Google Scholar] [CrossRef]
  54. Hammond, S.A.; Slocum, J.W., Jr. The impact of prior firm financial performance on subsequent corporate reputation. J. Bus. Ethics 1996, 15, 159–165. [Google Scholar] [CrossRef] [Green Version]
  55. Graafland, J.; Van de Ven, B.; Stoffele, N. Strategies and instruments for organising CSR by small and large businesses in the Netherlands. J. Bus. Ethics 2003, 47, 45–60. [Google Scholar] [CrossRef]
  56. Griffin, J.J.; Mahon, J.F. The corporate social performance and corporate financial performance debate twenty-five years of incomparable research. Bus. Soc. 1997, 36, 5–31. [Google Scholar] [CrossRef]
  57. Karpoff, J.M.; Lott, J.R., Jr.; Wehrly, E.W. The reputational penalties for environmental violations: Empirical evidence. J. Law Econ. 2005, 48, 653–675. [Google Scholar] [CrossRef]
  58. Baltagi, B.H.; Chang, Y.-J. Incomplete panels: A comparative study of alternative estimators for the unbalanced one-way error component regression model. J. Econ. 1994, 62, 67–89. [Google Scholar] [CrossRef]
  59. Singer, J.D. Using SAS PROC MIXED to fit multilevel models, hierarchical models, and individual growth models. J. Educ. Behav. Stat. 1998, 23, 323–355. [Google Scholar] [CrossRef] [Green Version]
  60. Aiken, L.S.; West, S.G. Multiple Regression: Testing and Interpreting Interactions; Sage Publications: Thousand Oaks, CA, USA, 1991. [Google Scholar]
  61. Orlitzky, M. Corporate social responsibility, noise, and stock market volatility. Acad. Manag. Perspect. 2013, 27, 238–254. [Google Scholar] [CrossRef] [Green Version]
  62. Waddock, S.A.; Graves, S.B. The corporate social performance–financial performance link. Strateg. Manag. J. 1997, 18, 303–319. [Google Scholar] [CrossRef]
  63. Zhao, X.; Murrell, A.J. Revisiting the corporate social performance-financial performance link: A replication of Waddock and Graves. Strateg. Manag. J. 2016, 37, 2378–2388. [Google Scholar] [CrossRef]
  64. Zhao, X.; Wu, C.; Chen, C.C.; Zhou, Z. The influence of corporate social responsibility on incumbent employees: A meta-analytic investigation of the mediating and moderating mechanisms. J. Manag. 2020. [Google Scholar] [CrossRef]
Figure 1. The Moderating Effect of Regional Competition for Governmental Resources.
Sustainability 12 07203 g001
Table 1. Measurement of Variables.
VariableMeasurement
Independent variable and moderator
Political tiesCoded as “1” if an entrepreneur is a member of the CPPCC or a delegate of the PC, and as “0” otherwise
Regional competition for governmental resourcesThe index of the development of non-state sectors in China, a major sub-category in marketization index [40]
Dependent variable
CSR investmentsThe ratio of the total amount of firm investment in environment, employee welfare, and local community to total sales in 2007
Over-investments in CSRCoded as “1” if the residual of the first-stage regression is greater than zero, and as “0” otherwise.
Control variable
Firm age2007 minus the year of firm’s establishment
Firm sizeNature log of firm’s sales in 2007
New product numberNature log of total number of new products
Brand numberNature log of total number of famous trademarks officially certificated by the State Administration for Industry and Commerce of China
Overseas investment ratioThe ratio of overseas investment to total sales in 2007
Overseas sales ratioThe ratio of overseas sales to total sales in 2007
R&D intensityThe ratio of R&D expenditures to total sales in 2007
Advertisement intensityThe ratio of advertisement expenditure to total sales in 2007
ROSThe ratio of net income to total sales
Leverage ratioThe ratio of debt to total asset
Donation historyWhether a firm had previously made charitable donations
Quality certificateWhether a firm had acquired quality certificate (e.g., ISO 9000)
ROEThe ratio of net income to total equity
Net incomeNet income in 2007
Managerial discretionWhether an entrepreneur has discretion in firm’s decision making
Entrepreneur dualityWhether the roles of CEO and chairperson were held simultaneously
Entrepreneur age2007 minus entrepreneur’s year of birth
Entrepreneur educationThe conferring of credentials. Code entrepreneur education as 1–6 which correspond to six different levels of conferring of credentials (from primary school to graduate degree)
Entrepreneur genderMale or female
Industry dummiesA set of industry dummies used to control for industry-fixed effects
Note: CSR = corporate social responsibility; ROE = return on equity; ROS = return on sales; CPPCC = Chinese People’s Political Consultative Conference; PC = People’s Congress.
Table 2. First-Stage Regression: Economic Determinants of CSR Investments.
DV = CSR InvestmentsModel 1Model 2Model 3Model 4
Firm age0.001−0.003 ***0.0010.001
(0.001)(0.001)(0.001)(0.001)
Firm size−0.072 *** −0.080 ***−0.070 ***
(0.003) (0.003)(0.003)
New product number0.008 *−0.0040.012 **0.007
(0.005)(0.005)(0.005)(0.005)
Brand number0.015−0.0090.0200.009
(0.012)(0.014)(0.013)(0.012)
Overseas investment ratio0.0730.190 *0.0670.085
(0.095)(0.109)(0.103)(0.096)
Overseas sales ratio0.051 **−0.049 *0.054 *0.043 *
(0.026)(0.030)(0.028)(0.026)
R&D intensity0.160 ***0.271 ***0.217 ***0.160 ***
(0.037)(0.042)(0.040)(0.037)
Advertisement intensity0.795 ***0.940 *** 0.808 ***
(0.038)(0.043) (0.039)
ROS−0.493 ***−0.526 ***−0.485 ***−0.495 ***
(0.036)(0.041)(0.039)(0.036)
Leverage ratio0.002−0.0000.0020.002
(0.001)(0.001)(0.001)(0.001)
Donation history0.295 ***0.213 ***0.317 ***0.308 ***
(0.054)(0.062)(0.059)(0.054)
Quality certificate0.043 ***−0.032 ***0.043 *** 0.054 ***
(0.011)(0.012)(0.012)(0.011)
ROE−0.167 ***−0.221 ***−0.168−0.172 ***
(0.061)(0.070)(0.067)(0.062)
Net income0.059 ***−0.069 ***0.062 *** 0.070 ***
(0.021)(0.024)(0.023)(0.022)
Managerial discretion−0.040 ***0.016−0.051 ***−0.040 ***
(0.010)(0.011)(0.011)(0.010)
Industry dummiesIncludedIncludedIncludedNot Included
R20.4490.2800.3480.429
N2365236523652379
Note: ***, **, and * indicate significance at the 1%, 5%, and 10% levels, respectively. N denotes sample size. CSR = corporate social responsibility.
Table 3. Second-Stage Regression: Mixed-Effects Estimation on Over-investment in CSR.
DV = Over-Investment in CSRModel 1Model 2Model 3
Control variable
Regional competition for governmental resources0.025 *0.025 **0.023 *
(0.013)(0.012)(0.013)
Firm age−0.008 *−0.010 **−0.010 **
(0.005)(0.005)(0.005)
Firm size0.147 ***0.139 ***0.142 ***
(0.041)(0.042)(0.042)
New product number−0.007−0.006−0.009
(0.032)(0.032)(0.031)
Brand number−0.026−0.037−0.034
(0.052)(0.054)(0.053)
Overseas investment ratio0.5420.4940.528
(0.566)(0.546)(0.551)
Overseas sales ratio−0.120−0.116−0.128
(0.125)(0.126)(0.124)
R&D intensity−0.001−0.001−0.015
(0.334)(0.339)(0.337)
Advertisement intensity0.3150.3040.298
(0.215)(0.213)(0.213)
ROS0.1310.1280.128
(0.099)(0.101)(0.101)
Leverage ratio−0.004−0.004−0.004
(0.004)(0.003)(0.003)
Donation history−0.692 **−0.699 **−0.708 **
(0.306)(0.303)(0.306)
Quality certificate−0.205 ***−0.207 ***−0.211 ***
(0.066)(0.066)(0.065)
ROE0.6410.6510.692
(0.683)(0.693)(0.691)
Net income0.3480.3430.342
(0.300)(0.301)(0.299)
Managerial discretion0.232 *** 0.235 ***0.236 ***
(0.079)(0.078)(0.078)
Entrepreneur duality0.0100.0210.017
(0.104)(0.104)(0.104)
Entrepreneur age−0.001 ***−0.001 *** −0.001 ***
(0.000)(0.000)(0.000)
Entrepreneur education−0.085 ***−0.084 ***−0.084 ***
(0.023)(0.022)(0.022)
Entrepreneur gender−0.080−0.078−0.077
(0.103)(0.101)(0.100)
Independent variable
Political ties 0.188 **0.192 **
(0.074)(0.083)
Interaction term
Political ties × regional competition for governmental resources 0.046 *
(0.025)
Industry dummiesIncludedIncludedIncluded
Log likelihood−1462.056 ***−1459.354 ***−1457.517 ***
N230423042304
Note: ***, **, and * indicate significance at the 1%, 5%, and 10% levels, respectively. N denotes sample size.

