1. Introduction
The current economy and urbanization grow rapidly to a certain extent at the expense of the environment. This imposes significant environmental burdens in air/water pollution, resource depletion and climate warming. Many countries increasingly focus on production process and collection, and enact legislation to restrict manufacturers’ behaviors. Governments hold manufacturers responsible for operating and managing their used products by eco-friendly processes, such as collection and recycling, which is the so-called extended producer responsibility (EPR) [
1]. EPR regulations are expected to reduce pollution in landfills and create incentives for eco-friendly product designs [
2]. For example, the European Union enacts the Waste Electrical and Electronic Equipment (WEEE) directive to stipulate the responsibility of manufacturers for collecting products [
3]. Similar legislations are either in other countries, such as the United States’ electronic waste (e-waste) take-back laws in 25 states and the PC Recycling System and Specified Household Appliances Recycling Law (SHARL) in Japan [
4,
5].
According to a product lifecycle, the tasks which EPR regulations focus on usually include collecting and remanufacturing at the recycling stage and performing eco-design at the production stage [
6]. For the used products, recycling is the best known and the most frequently used disposal alternative. EPR regulations may require manufacturers to collect and reprocess [
7,
8] or remanufacture [
9,
10,
11]. Products of which parts can be fully reused and sold, or become another new product after remanufacturing, should not have their life ended by being discarded into nature. Remanufacturing is seen as a more eco-friendly option thanks to reducing virgin material use and energy/resource consumption throughout the whole product’s lifecycle [
12]. Manufacturers’ collection and remanufacturing strategies are more than to abide by EPR regulations, and this process may be economic [
13]. Before any policy enforcement, it is estimated that the remanufacturing industry has nearly 500,000 employees in the U.S. [
14]. Therefore, manufacturers may also select remanufacturing even without a take-back policy. Moreover, in today’s markets, produce activity and remanufacturing activity sometimes are performed separately by two parties. This study considers manufacturers which are responsible for the collection and remanufacturing of their products, such as Nikon and Canon.
On the other hand, eco-design performed at the production stage may help ease the end-of-life collection, recycling and landfill, which solves environmental problems at the source [
15]. Manufacturers’ eco-design efforts focus on three main methods: (i) reduce materials and energy usage at the production stage, (ii) select greener materials which are less toxic and safer to landfill, (iii) improve design for recyclability and upgrade [
16,
17]. EPR is an important regulatory policy instrument, which extends a producer’s responsibility for a product to the post-consumption stage and the waste disposition stage. For instance, the Sustainable Production and Consumption Unit of the European Union stipulates that both recyclability and durability are key eco-design attributes [
18].
With all the above background, this paper studies, under the governments’ take-back policy, the optimal policy that motivates eco-design at the production stage or remanufacturing at the collection stage, and induces the manufacturers’ collection, production and eco-design effort. This motivates the research questions addressed in the paper, which are as follows:
- (1)
How will the take-back policy of penalty or subsidy affect the manufacturers’ optimal decisions?
- (2)
Under different take-back policies, what strategy is the best selection for manufacturers? Practicing remanufacturing or performing eco-design?
- (3)
Whether the manufacturers’ decision is remanufacturing or eco-design, which take-back policy should the government select? Will the policy indeed be effective in motivating remanufacturing or eco-design?
To address these research questions, we consider a system consisting of a single government and a single manufacturer. A model framework is presented, such that the government, aiming for maximizing utilitarian social welfare, plays a Stackelberg game with a profit-maximizing manufacturer. The government has two options of regulation policies (i.e., imposing a take-back penalty or offering a take-back subsidy), and the manufacturer reacts by one strategy of remanufacturing or eco-design.
The remainder of this paper is organized as follows. The next section reviews the related literature.
Section 3 introduces fundamental notations, assumptions and formulates scenarios.
Section 4 provides models and equilibrium decisions for each scenario.
Section 5 analyzes the equilibrium and presents the sub-game perfect equilibrium.
Section 6 concludes this study and outlines directions for future research. All proofs of this paper are in
Appendix A.
2. Literature Review
Regarding used product recovery problems with the take-back policy, research has been carried out in various aspects. Our study is primarily related to two streams of literature: take-back mechanism designs, and production and recycling strategy selection and sustainable operations.
The literature of take-back mechanism designs, which is from the governments’ perspective, mainly focuses on the efficiency of various policy mechanisms under implementing EPR legislations. Recycling fees, take-back penalties or subsidies are commonly used [
19,
20,
21,
22,
23]. These studies also provide guidance for governments in designing mechanisms by analyzing the social welfare while considering environmental and economic performances. In terms of EPR legislation, governments implement several types, carbon/emission tax [
10,
24,
25], take-back [
26,
27], penalty/subsidy/joint tax subsidy [
28,
29,
30], remanufacturing levels [
9,
31], etc.
Several studies further explore the validity and efficiency of the take-back mechanisms for motivating eco-friendly product designs or remanufacturing to reduce pollution and waste. Webster and Mitra [
26] consider a take-back policy under competition in an independent remanufacturer and an original equipment manufacturer, and they find that the take-back policy is positive to financial outcome. Yenipazarli [
10] discusses the conditions in which the manufacturer decides on remanufacturing under emissions tax policy to reduce effectively the environmental impact. They investigate how to realize a win-win of the economic and environmental or a triple-win situation of economic, environmental and social benefits for remanufacturing by emissions taxes. Pazoki and Zaccour [
30] propose a general framework for regulations that guide social planners designing new regulations, proving that the quantity of past production modifies the effect of target rates and incentives on environmental performance. However, Atasu et al. [
31] study the effects of WEEE-type legislation and this type based on the weight may not necessarily be efficient on the economic or ecological side. It shows that there is debate on the problem of the effectiveness and efficiency of EPR regulations, and it seems worthy to be studied further.
The other stream of literature is sustainable operations and production and recycling strategy selection under the take-back policy. Scholars research a wide range of areas, mainly including remanufacturing [
32,
33,
34,
35], green product designs [
17,
36], and the interaction between product design and used product recovery [
37,
38,
39]. Remanufacturing is more investigated due to its potential profitability; literature reviews of this are summarized comprehensively in [
33,
40]. Li et al. [
41] study the relation between remanufacturing and product quality improvement, and the findings show that the extent of the cost increase for producing high-quality products can motivate remanufacturing. Esenduran et al. [
42] discuss and further extend the problem of minimum target levels for collection and remanufacturing for vertically differentiated new and remanufactured products. They conclude that for an independent remanufacturer allowed to enter the market, remanufacturing may be deterred by a minimum target level for collection. However, none of the above studies considers product design.
Product design, also known as eco-design or design for environment, solves environmental problems at source through ecological innovation in product design [
36]. Sabaghi et al. [
43] provide design methodologies for end-of-life products, such as design for modularity, recycling or the environment, etc. These studies ignore the interaction between regulations and eco-design. Raz et al. [
17] consider a newsvendor model for the environment design issues, and they conclude that the extent of the unit’s environmental impact decrease due to eco-design is maybe not enough to offset the extent of the overall environmental impact increase due to overproduction. Huang et al. [
44] consider how durability and recyclability interact, and investigate the choice of these two design attributes for a durable good producer under EPR. They find that recyclability or durability may be reduced with more stringent collection targets or recycling targets. Recently, scholars have also increasingly focused on the interaction between product design and used product recovery. Wu [
39] provides a two-period model framework to analyze the design-for-disassembly problem in a supply chain consisting of an original equipment manufacturer which produces new products and a remanufacturer who remanufactures the used products. Atasu et al. [
37] studied the impact of product reuse on product quality choice, and found that recovery may increase product quality. The results further show the function of the product recovery form, recovery cost structure and product take-back regulation on product quality. However, existing literature rarely focuses on the interaction between eco-design and remanufacturing. Zheng et al. [
45] consider competition between an independent remanufacturer and an original equipment manufacturer and assume that design for the environment reduces remanufacturing costs. They further analyze how it affects design for environment strategies. Pazoki and Samarghandi [
46] consider the collecting activity, and investigate whether the regulator’s take-back regulation influences the producer’s strategy selection of remanufacturing and eco-design. As indicated above, none of these models simultaneously consider strategy selection of eco-design and remanufacturing under different take-back regulations.
Our study extends the existing literature in three ways. First, our study considers a system including a government implementing the take-back policy of penalty or subsidy and a manufacturer responsible for collecting their used products. Second, from the government’s standpoint, we further characterize the optimal penalty or subsidy and analyze the effectiveness and efficiency of the take-back policy. Third, we simultaneously identify the decision of eco-design or remanufacturing for a manufacturer, based on which we provide a set of guidelines in practical managerial recommendations for governments and manufacturers. In the current literature, there has not been research on the subject of the effect of regulation policy of take-back penalty or subsidy on a manufacturer’s production strategy choice of eco-design and remanufacturing has not been studied to date.
3. Model Development
Consider a single government and a single manufacturer as two decision-makers deciding for themselves variables to maximize social welfare and profit. The manufacturer produces a brand new product and collects properly end-of-use products to reduce pollution by offering financial incentives to original consumers, in the first step. On the other side, the government expects the manufacturer to recycle, and applies the regulation policy, i.e., the take-back penalty or subsidy. Specifically, the government limits the manufacturer’s collection behavior by imposing the take-back penalty and supports this behavior using the take-back subsidy, considering the impact of landfill pollution products on the environment from the social welfare side. Finally, under the different policies, the manufacturer reacts respectively by remanufacturing or performing eco-design. Therefore, we discuss four scenarios, based on Stackelberg game structures. The notations used in our models are presented in
Table 1.
Meanwhile, we discuss some assumptions which are considered in this paper as follows.
Demand functions: For consumers, their valuation from consuming new products is where and consumers have a heterogeneous taste. Thus, without remanufacturing, the demand function for the brand-new products is . If the manufacturer produces remanufactured products as substitutes for new products, consumers gain by purchasing remanufactured products, where denotes that the perceived quality of remanufactured products is lower than the new. Consumers decide which product to buy by comparing and . We further obtain the inverse demand functions: and .
Product acquisition and processing cost: Generally, the manufacturer collects products that satisfy the minimum quality conditions of remanufacturing [
47]. Collection price implies the remanufactured quality to a certain extent. According to [
46], we assume the collected quantity has linear correlations with the collection price. The acquisition function is presented as
where
is acquisition efficiency, and acquisition cost is
. For a collected product, the manufacturer also needs to process it with cost
whether or not they are remanufacturing [
29]. Consequently, the processing cost is presented as
.
Eco-design: The manufacturer can redesign the brand-new products by eco-design to reduce environmental pollution at the source. For the monetary value of the environmental impact of landfill
[
31], the manufacturers’ emission reduction effort is represented by
, reducing the amount of toxic materials in the product, and they incur the investment cost of
for eco-design [
28,
44]. According to [
16,
17,
18], we assume further that the investing in eco-design reduces the recycling processing cost by
.
Take-back policy: The government, according to the take-back policy, decides to penalize the manufacturer for the uncollected product with pollution risks or subsidize the manufacturer for the collected product. When a take-back penalty is imposed, the manufacturer needs to pay the penalty for uncollected products by
. When a take-back subsidy is offered, the manufacturer can gain the subsidy for collected products by
. Referring to the analysis of extended producer responsibility (EPR) regulation [
30,
46], the take-back policy can reduce effectively landfilled products and restrain the collection behavior of manufacturers. As discussed before, the government considers the impact of the monetary value of the environmental impact of landfill on the total environment which is presented as a function
in a social welfare function [
46].
Based on the above, we define four scenarios in
Table 2.
A two-stage game sequence for the interaction between the two parties can be modeled as follows: The government decides to impose a take-back regulation penalty or offer a take-back regulation subsidy, and what the equilibrium penalty or subsidy is. Upon observing the penalty or subsidy , the manufacturer reacts by performing remanufacturing or eco-design. If he selects remanufacturing, he makes decisions on the quantity of brand new, remanufactured and collected products. If eco-design is the best strategy for the manufacturer, the decisions are made on the quantity of brand new and collected products, as well as emission reduction effort.
4. Scenarios
4.1. Scenario 1
In this scenario, the government decides to impose a take-back penalty and the manufacturer chooses to collect and to remanufacture as response strategies. The manufacturer performs to reduce the total paid penalty by acquisition, and to obtain revenue from collected products by remanufacturing. The manufacturer maximizes a profit which can be presented as follows:
The manufacturer determines the quantity of brand-new products, remanufactured products and collected products to maximize the profit. We obtain equilibrium strategies, which are given in Lemma 1.
Lemma 1. Given the per unit take-back penalty, in Scenario 1, the manufacturer’s best response to the equilibrium strategies is: Lemma 1 shows that the quantity of remanufactured and collected products increases with per unit take-back penalty, and the quantity of brand-new products decreases with it.
The government maximizes utilitarian social welfare which can be presented as follows:
Given the manufacturer’s equilibrium strategies as the best response, the government maximizes the social welfare by setting the per unit take-back penalty. We can derive the equilibrium penalty for the government. Combining the value with the manufacturer’s best response function yields the equilibrium penalty, production and acquisition strategies, which are presented in Proposition 1.
Proposition 1. In Scenario 1, the equilibrium solutions are given by Proposition 1 reveals that a take-back penalty policy is effectively implemented () when the monetary value of the environmental impact of the landfill is greater than the certain threshold (i.e., ). To analyze the impacts of the monetary value of environmental impact on the optimal decisions of the government and manufacturer, we deduce Corollary 1 by Proposition 1.
Corollary 1. , , , .
Corollary 1 describes the effect of the monetary value of the environmental impact of landfill on the equilibrium solutions in Scenario 1. The manufacturer may incur a higher take-back penalty for a product with higher landfill pollution to the environment. Therefore, he needs to collect and remanufacture more and produce fewer new products to neutralize higher landfill pollution.
4.2. Scenario 2
This scenario describes that with the government’s take-back penalty the manufacturer decides to collect and perform eco-design. Instead of remanufacturing collected products, the manufacturer performs eco-design to reduce the recycling processing cost. The manufacturer maximizes a profit which can be given as follows:
The manufacturer determines the emission reduction effort, the quantity of brand-new products and collected products to maximize the profit. The manufacturer’s equilibrium strategies are given in Lemma 2.
Lemma 2. Assuming and given the per unit take-back penalty, in Scenario 2, the manufacturer’s best response to the equilibrium strategies is: Intuitively, the condition ensuring manufacturer’s positive decisions is , suggesting that the take-back penalty must be bigger than per unit recycle processing cost and smaller than the maximum marginal profit of new products. Furthermore, a higher per unit penalty leads to a larger quantity of collected products and per unit emission reduction effort, and a smaller quantity of new products.
The government maximizes utilitarian social welfare which can be given as follows:
Based on the response functions in Lemma 2, the government maximizes social welfare by setting the per unit take-back penalty. We can obtain the government’s equilibrium penalty. Combining the value with the manufacturer’s best response function yields the equilibrium penalty, emission reduction effort, production and acquisition strategies, which are given in Proposition 2.
Proposition 2. In Scenario 2, the equilibrium solutions are given by
Proposition 2 shows that, for an effective take-back regulation (), the monetary value of the environmental impact of landfill must be greater than a threshold (i.e., ). To analyze the impacts of the monetary value of environmental on the optimal decisions of the government and manufacturer, we deduce Corollary 2 by Proposition 2.
Corollary 2. , , , .
Corollary 2 implies the effect of the monetary value of the environmental impact of landfill on the equilibrium solutions in Scenario 2. The government may set a higher take-back penalty for a product with more hazardous materials. The manufacturer will invest more emission reduction efforts on higher landfill pollution product, and increase collection but decrease the production of the new, due to the force of regulation.
4.3. Scenario 3
In this scenario, the government offers the take-back subsidy and the manufacturer reacts by collecting and remanufacturing. Performing product collection makes the manufacturer obtain the take-back subsidy to neutralize some acquisition costs. The manufacturer further derives revenue by remanufacturing. The manufacturer maximizes a profit which can be presented as follows:
Lemma 3. Given the per unit take-back subsidy, in Scenario 3, the manufacturer’s best response to the equilibrium strategies is: Obviously, the per unit take-back subsidy has a positive impact on product collection, and no impact on the quantity of brand new and remanufactured products.
The government maximizes utilitarian social welfare which can be presented as follows:
Given the manufacturer’s equilibrium strategies as the best response, the government maximizes the social welfare by setting the per unit take-back subsidy. We can derive the equilibrium subsidy for the government. Combining the value with the manufacturer’s best response function yields the equilibrium subsidy, production and acquisition strategies, which are presented in Proposition 3.
Proposition 3. In Scenario 3, the equilibrium solutions are given by Proposition 3 reveals that remanufacturing costs must be less than to justify remanufacturing (). Moreover, collected products must be more than or equal to remanufactured products () resulting in a threshold for . Otherwise, the manufacturer cannot perform remanufacturing.
4.4. Scenario 4
This scenario describes that the government decides to offer the take-back regulation subsidy, and the manufacturer decides to collect and perform eco-design. When seeing the take-back subsidy as a motivator the manufacturer performs eco-design to reduce recycle processing cost. The manufacturer maximizes a profit which can be given as follows:
Lemma 4. Assumingand given the per unit take-back subsidy, in Scenario 4, the manufacturer’s best response to the equilibrium strategies is: Intuitively, the per unit take-back subsidy is a positive influence on emission reduction efforts and product collection. The quantity of brand-new products just relates to the cost.
The government maximizes utilitarian social welfare which can be presented as follows:
Proposition 4. In Scenario 4, the equilibrium solutions are given by It is obvious that a product with more hazardous materials will be subsidized more and will attract more emission reduction efforts and collection.
5. Equilibrium Analyses
In this section, based on the above solutions for each scenario, we propose to find the scenario which is a result of Stackelberg game by comparing the social welfare of the government and profits of the manufacturer in different scenarios. To discover the sub-game perfect equilibrium, the manufacturer as a follower of the game is a start to finding the best strategy under each strategy of the government as a leader. Then we explore the government’s decisions on penalizing and subsidizing by comparing social welfare in different scenarios.
5.1. Manufacturer
Under scenarios 2 and 4, we will assume that . It suggests that compared to its processing cost reduction effectiveness if cost-efficiency of eco-design efforts is sufficiently small, the manufacturer reaches an extreme point of investment in eco-design which is related to acquisition efficiency. Therefore, we re-write the condition as , and name “eco-design coefficient” as an important factor. Larger eco-design coefficients mean fewer eco-design efforts and profit from the investment in eco-design.
For the government’s take-back penalty, the manufacturer predicts the value of the penalty and chooses to collect and to remanufacture or to collect and perform eco-design to gain a higher profit. Since the optimal take-back penalty is structurally complex, we proceed by a numerical example to shed light on the impact of eco-design coefficient on the manufacturer’s best strategy later.
For the government’s take-back subsidy, the manufacturer predicts the value of the subsidy and chooses to collect and to remanufacture or to collect and to perform eco-design to gain a higher profit. We find the best strategy which the manufacturer selects by comparing profit functions for scenarios 3 and 4.
Proposition 5. Under the take-back subsidizing, If, then the manufacturer prefers to invest in eco-design instead of remanufacturing; otherwise, the manufacturer selects remanufacturing.
Proposition 5 sets an upper bound on the eco-design coefficient. Obviously, Propositions 5 shows that if the eco-design coefficient is no more than some threshold, meaning that eco-design investment cost is relatively lower than per unit processing cost reduction, the manufacturer selects to perform eco-design. If the eco-design coefficient is higher than this threshold, remanufacturing is the best option for the manufacturer.
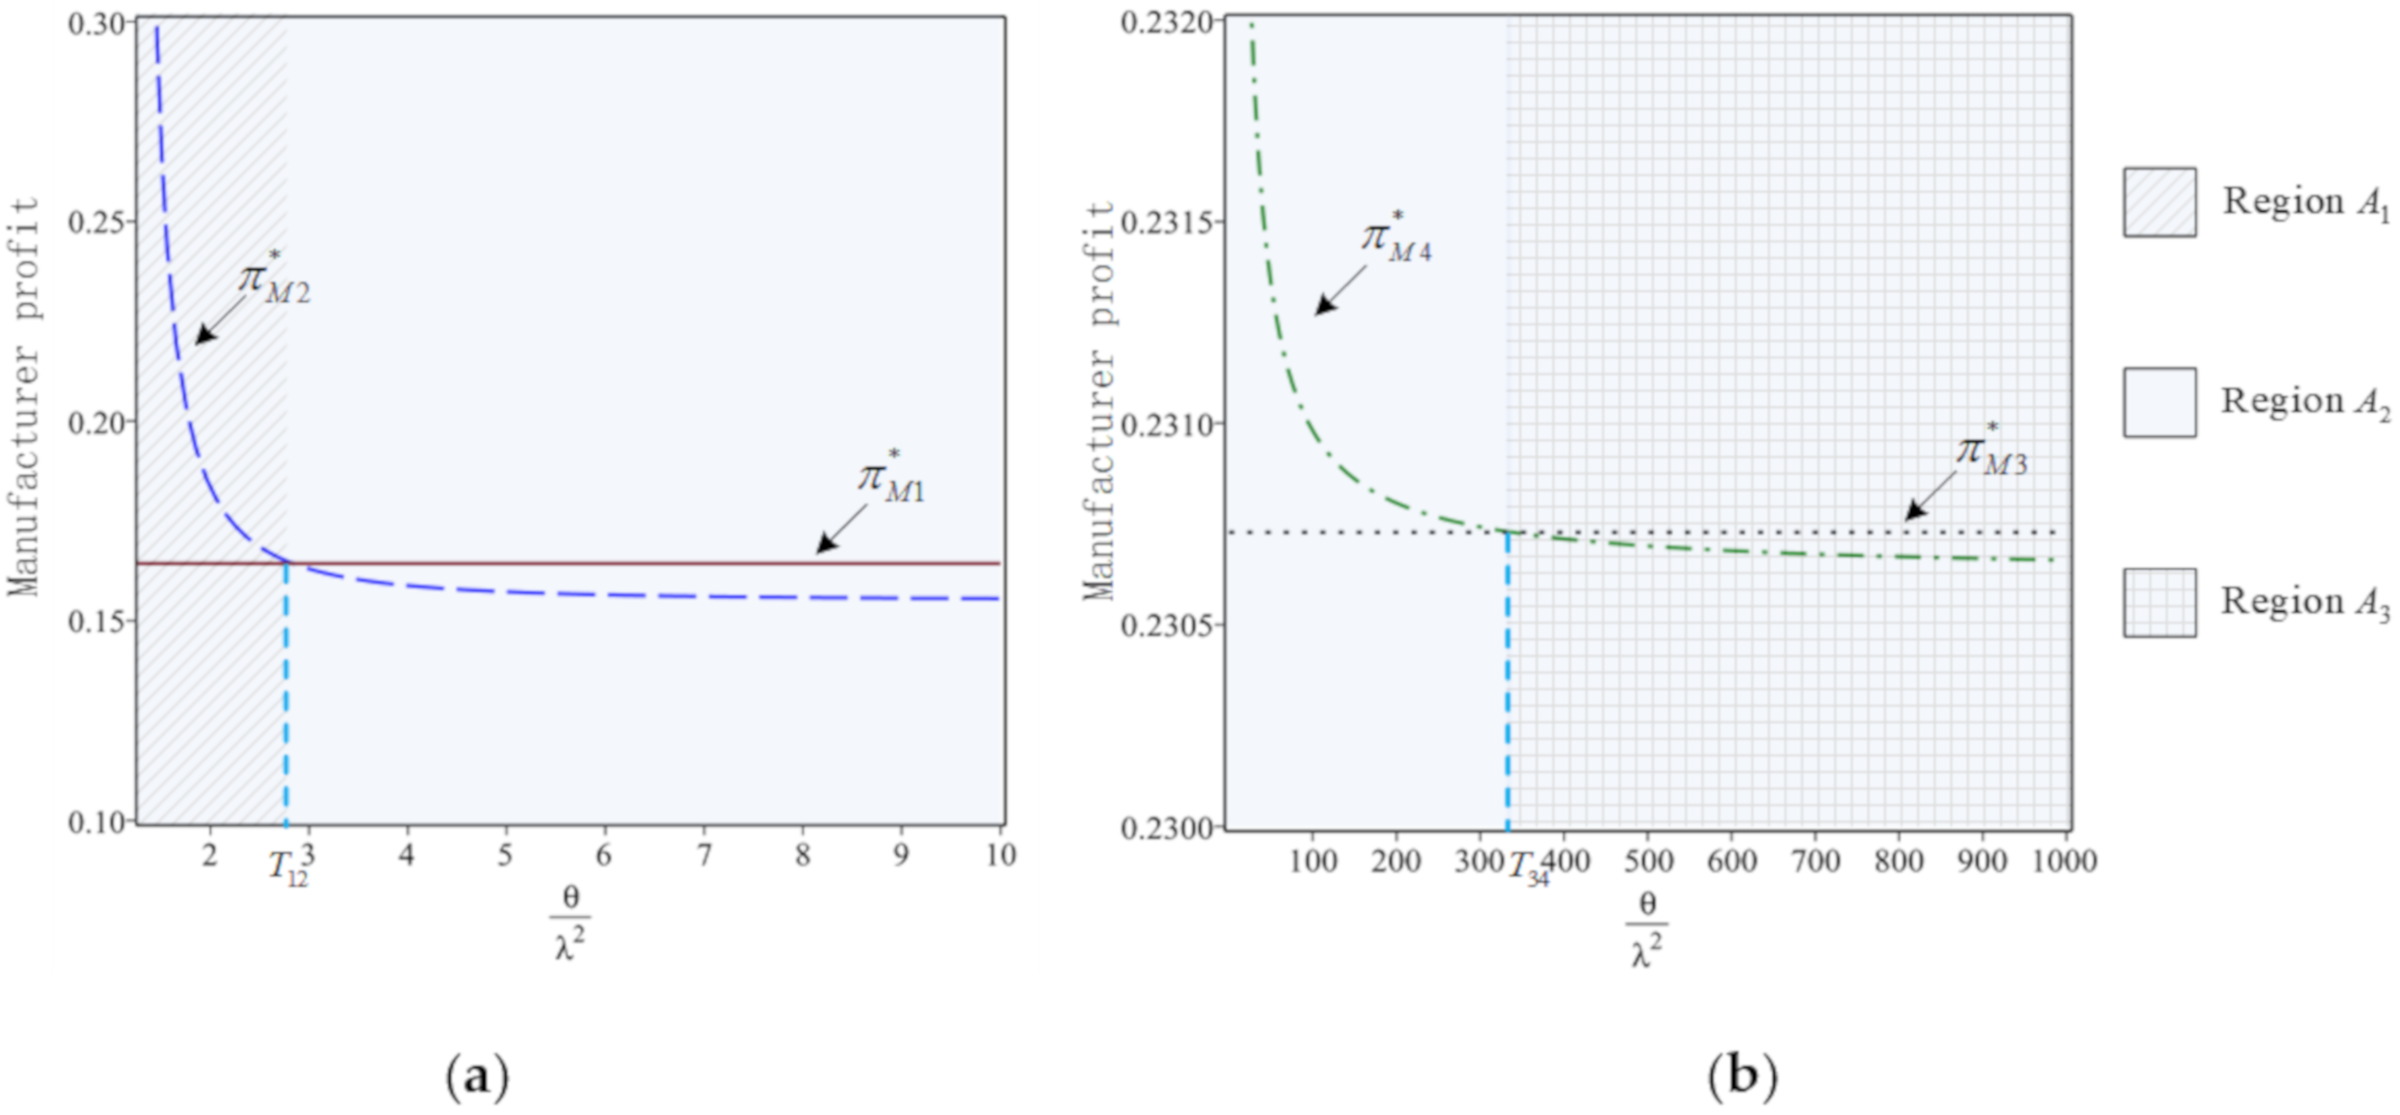
To examine the best strategy for the manufacturer when the government decides on two different take-back policies (i.e., penalizing and subsidizing), we present the impact of the eco-design coefficient on the manufacturer’s profits in each scenario by a numerical example. We consider the eco-design coefficient break-even point that represents under a take-back penalty the threshold to change the manufacturer’s strategy from eco-design to remanufacturing. Within the same idea, the point is the threshold for a subsidized manufacturer.
In this example, let
,
,
,
,
and
, we further get
and
. The main outcomes are illustrated in
Figure 1. From
Figure 1, if
, the manufacturer will just choose to carry on with eco-design for whichever take-back policy is in place, and if
, the manufacturer will just choose to carry on remanufacturing for any take-back policy. However, if
, the manufacturer’s choice can depend on whether the government’s take-back policy is of penalty or subsidy.
Based on the observation from
Figure 1, we divide the eco-design coefficient domain into three regions. We name the region on the left of min
as
, the region between min
and max
as
, and the region on the right of max
as
. Specifically, if
(i.e., the situation in
Figure 1),
is the upper bound of the region
and the lower bound of the region
.
is the upper bound of the region
and the lower bound of the region
. By the same logic, the bound values of regions are min
and max
when
. If the eco-design coefficient is low (
), the manufacturer’s profit when selecting eco-design is always higher than the profit under remanufacturing. It means that whether the government decides on penalizing or subsidizing, the manufacturer always performs eco-design. However, under a higher eco-design coefficient (
), remanufacturing is always the best strategy for the manufacturer, whether penalizing or subsidizing. In particular, for the medium eco-design coefficient, the manufacturer decides on the government’s take-back policy basis (
).
5.2. Government
Based on the above analysis about the regions, we further discuss the government’s strategy of imposing a take-back penalty or offering a take-back subsidy in each region. For the take-back policy, the government values the pollution of the product, not the penalty or subsidy. Consequently, we analyze the government’s take-back strategy by concentrating on the monetary value of the environmental impact of the landfill.
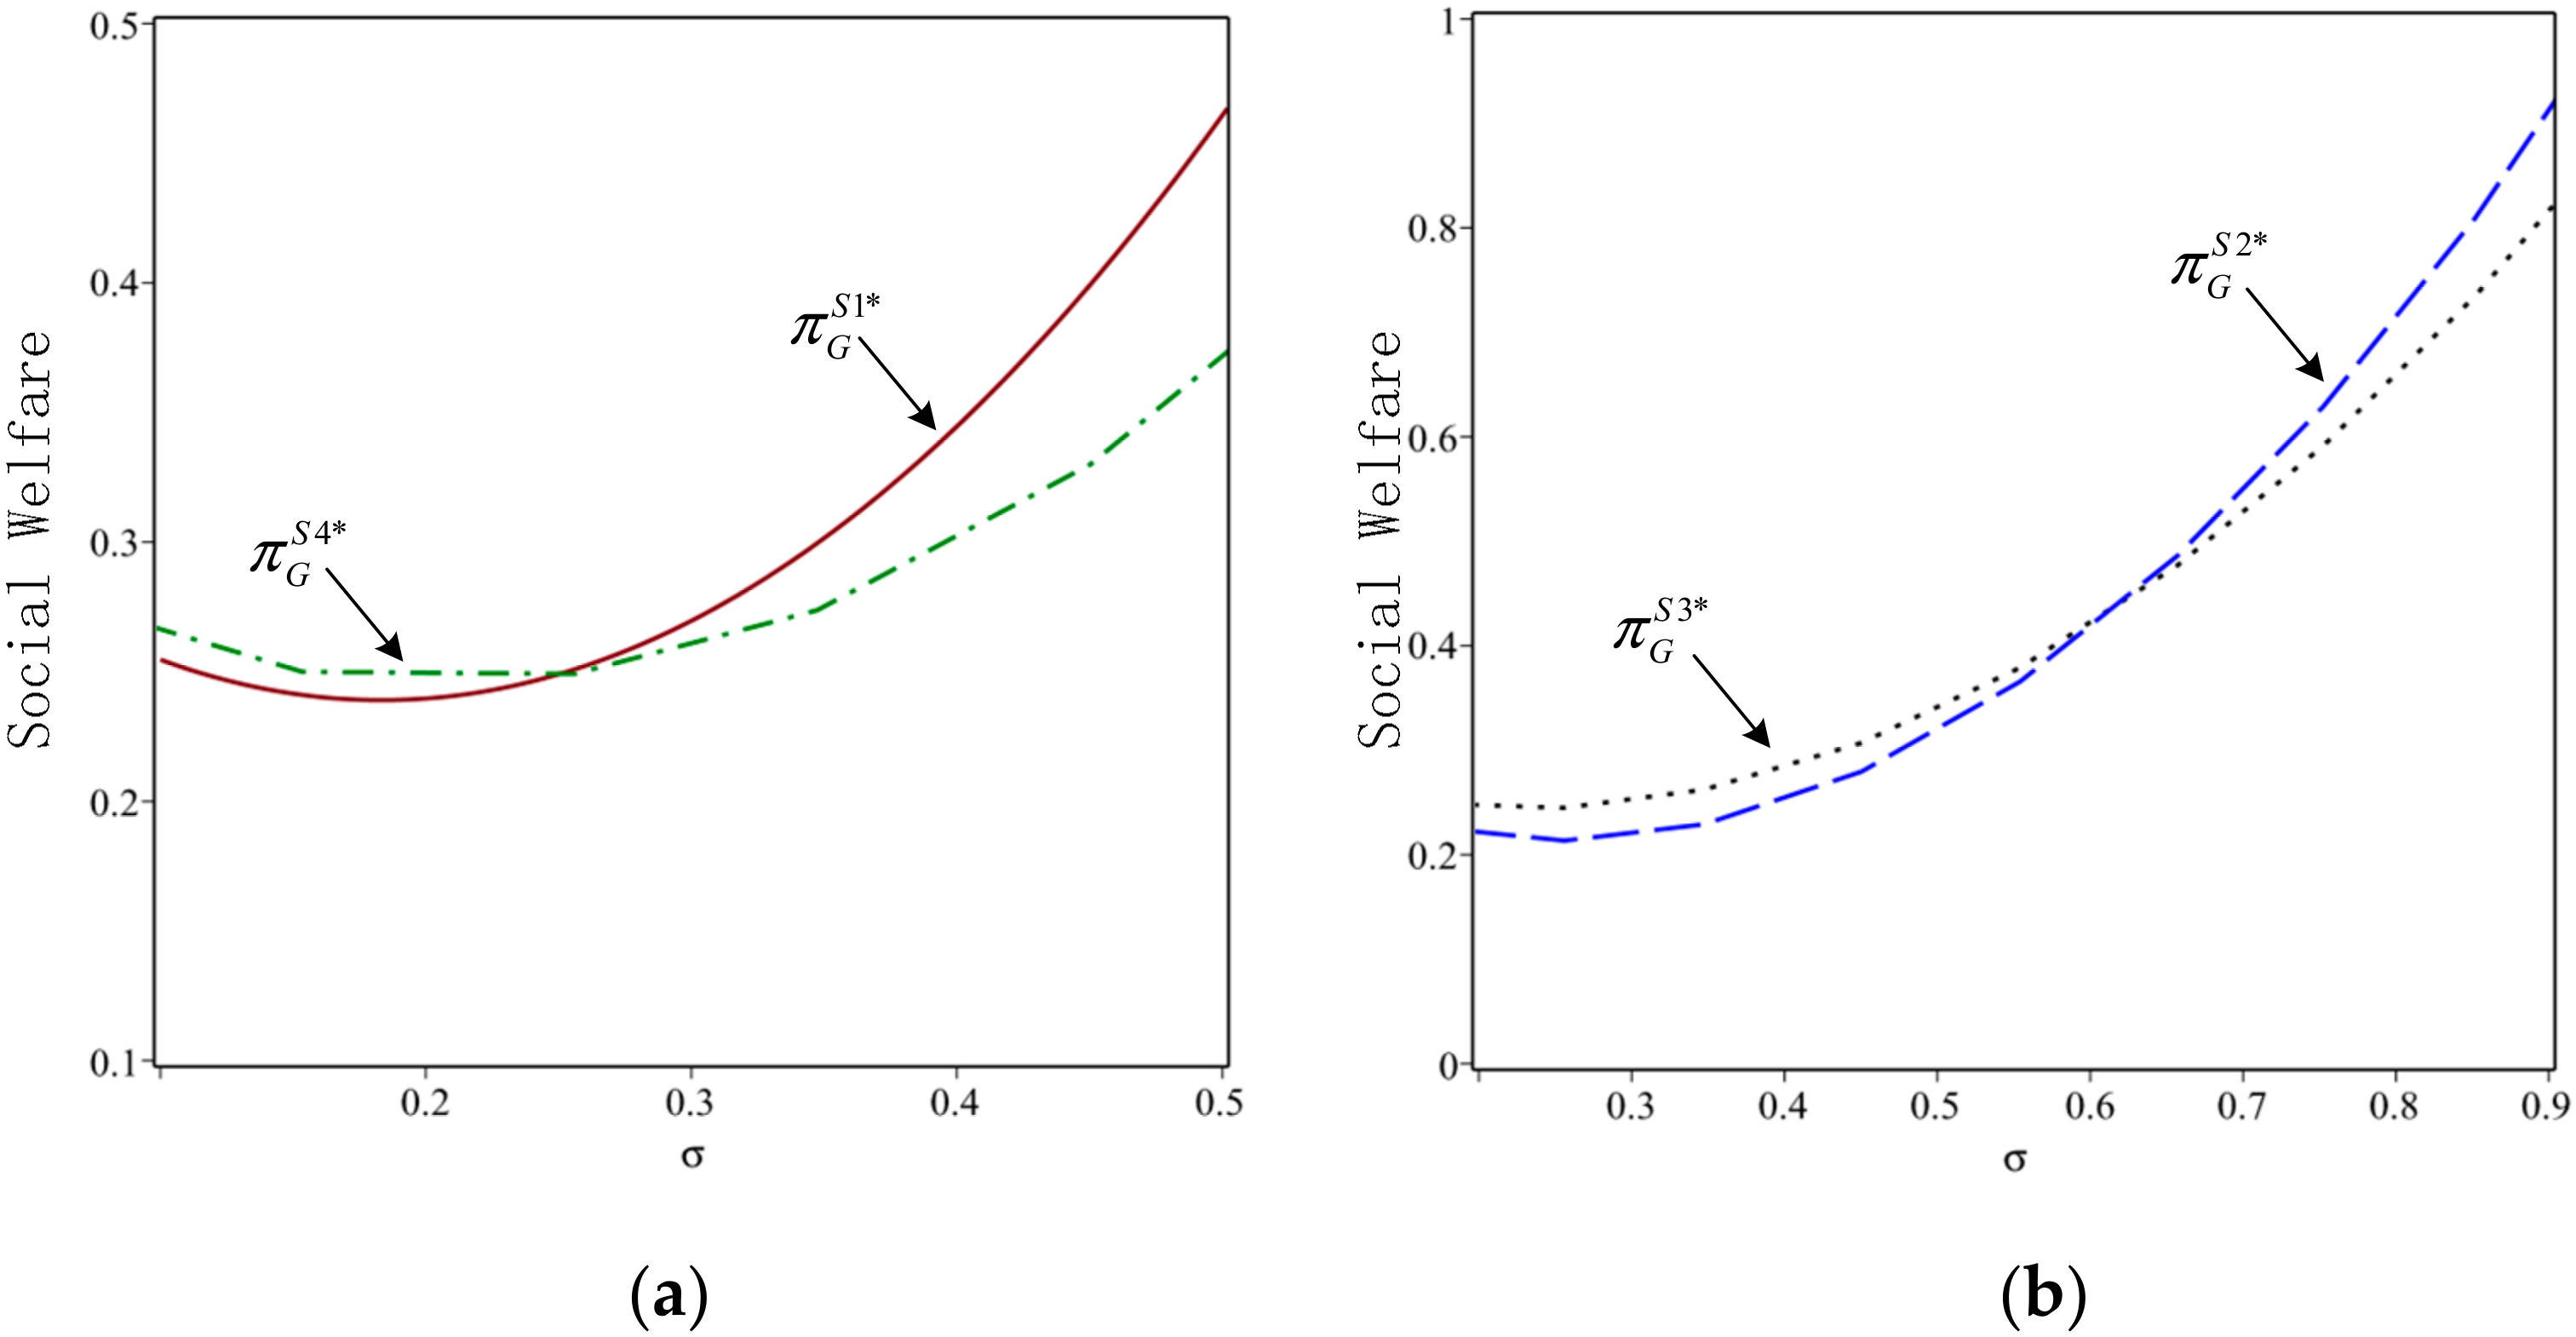
5.2.1. Region
In this region, the government decides on penalizing or subsidizing and the manufacturer’s response is always eco-design.
Proposition 6. If, the government offers a take-back subsidy; otherwise, the government imposes a take-back penalty. In this case,.
Proposition 6 indicates that if the monetary value of the environmental impact of landfill is lower than a certain threshold, performing subsidizing results in higher social welfare. For a higher landfill pollution product, the government’s best strategy is imposing a take-back regulation penalty, which can increase social welfare. Then the manufacturer only reacts by investing in eco-design under a lower eco-design coefficient.
We test the validity of Proposition 6 under the condition of Region
by a numerical example, which showing in
Figure 2. For
Figure 2a (
), let
,
,
,
,
and
. For
Figure 2b (
), let
,
,
,
,
and
. Observing
Figure 2a, when
, the social welfare under subsidizing is higher than it is under penalizing. If
, the government changes the best strategy from subsidizing to penalizing to gain higher social welfare.
Figure 2b shows the same logic. It implies that under a lower eco-design coefficient, a more polluting product’s manufacturer is more likely to be penalized, and a greener product leads to subsidy for a manufacturer.
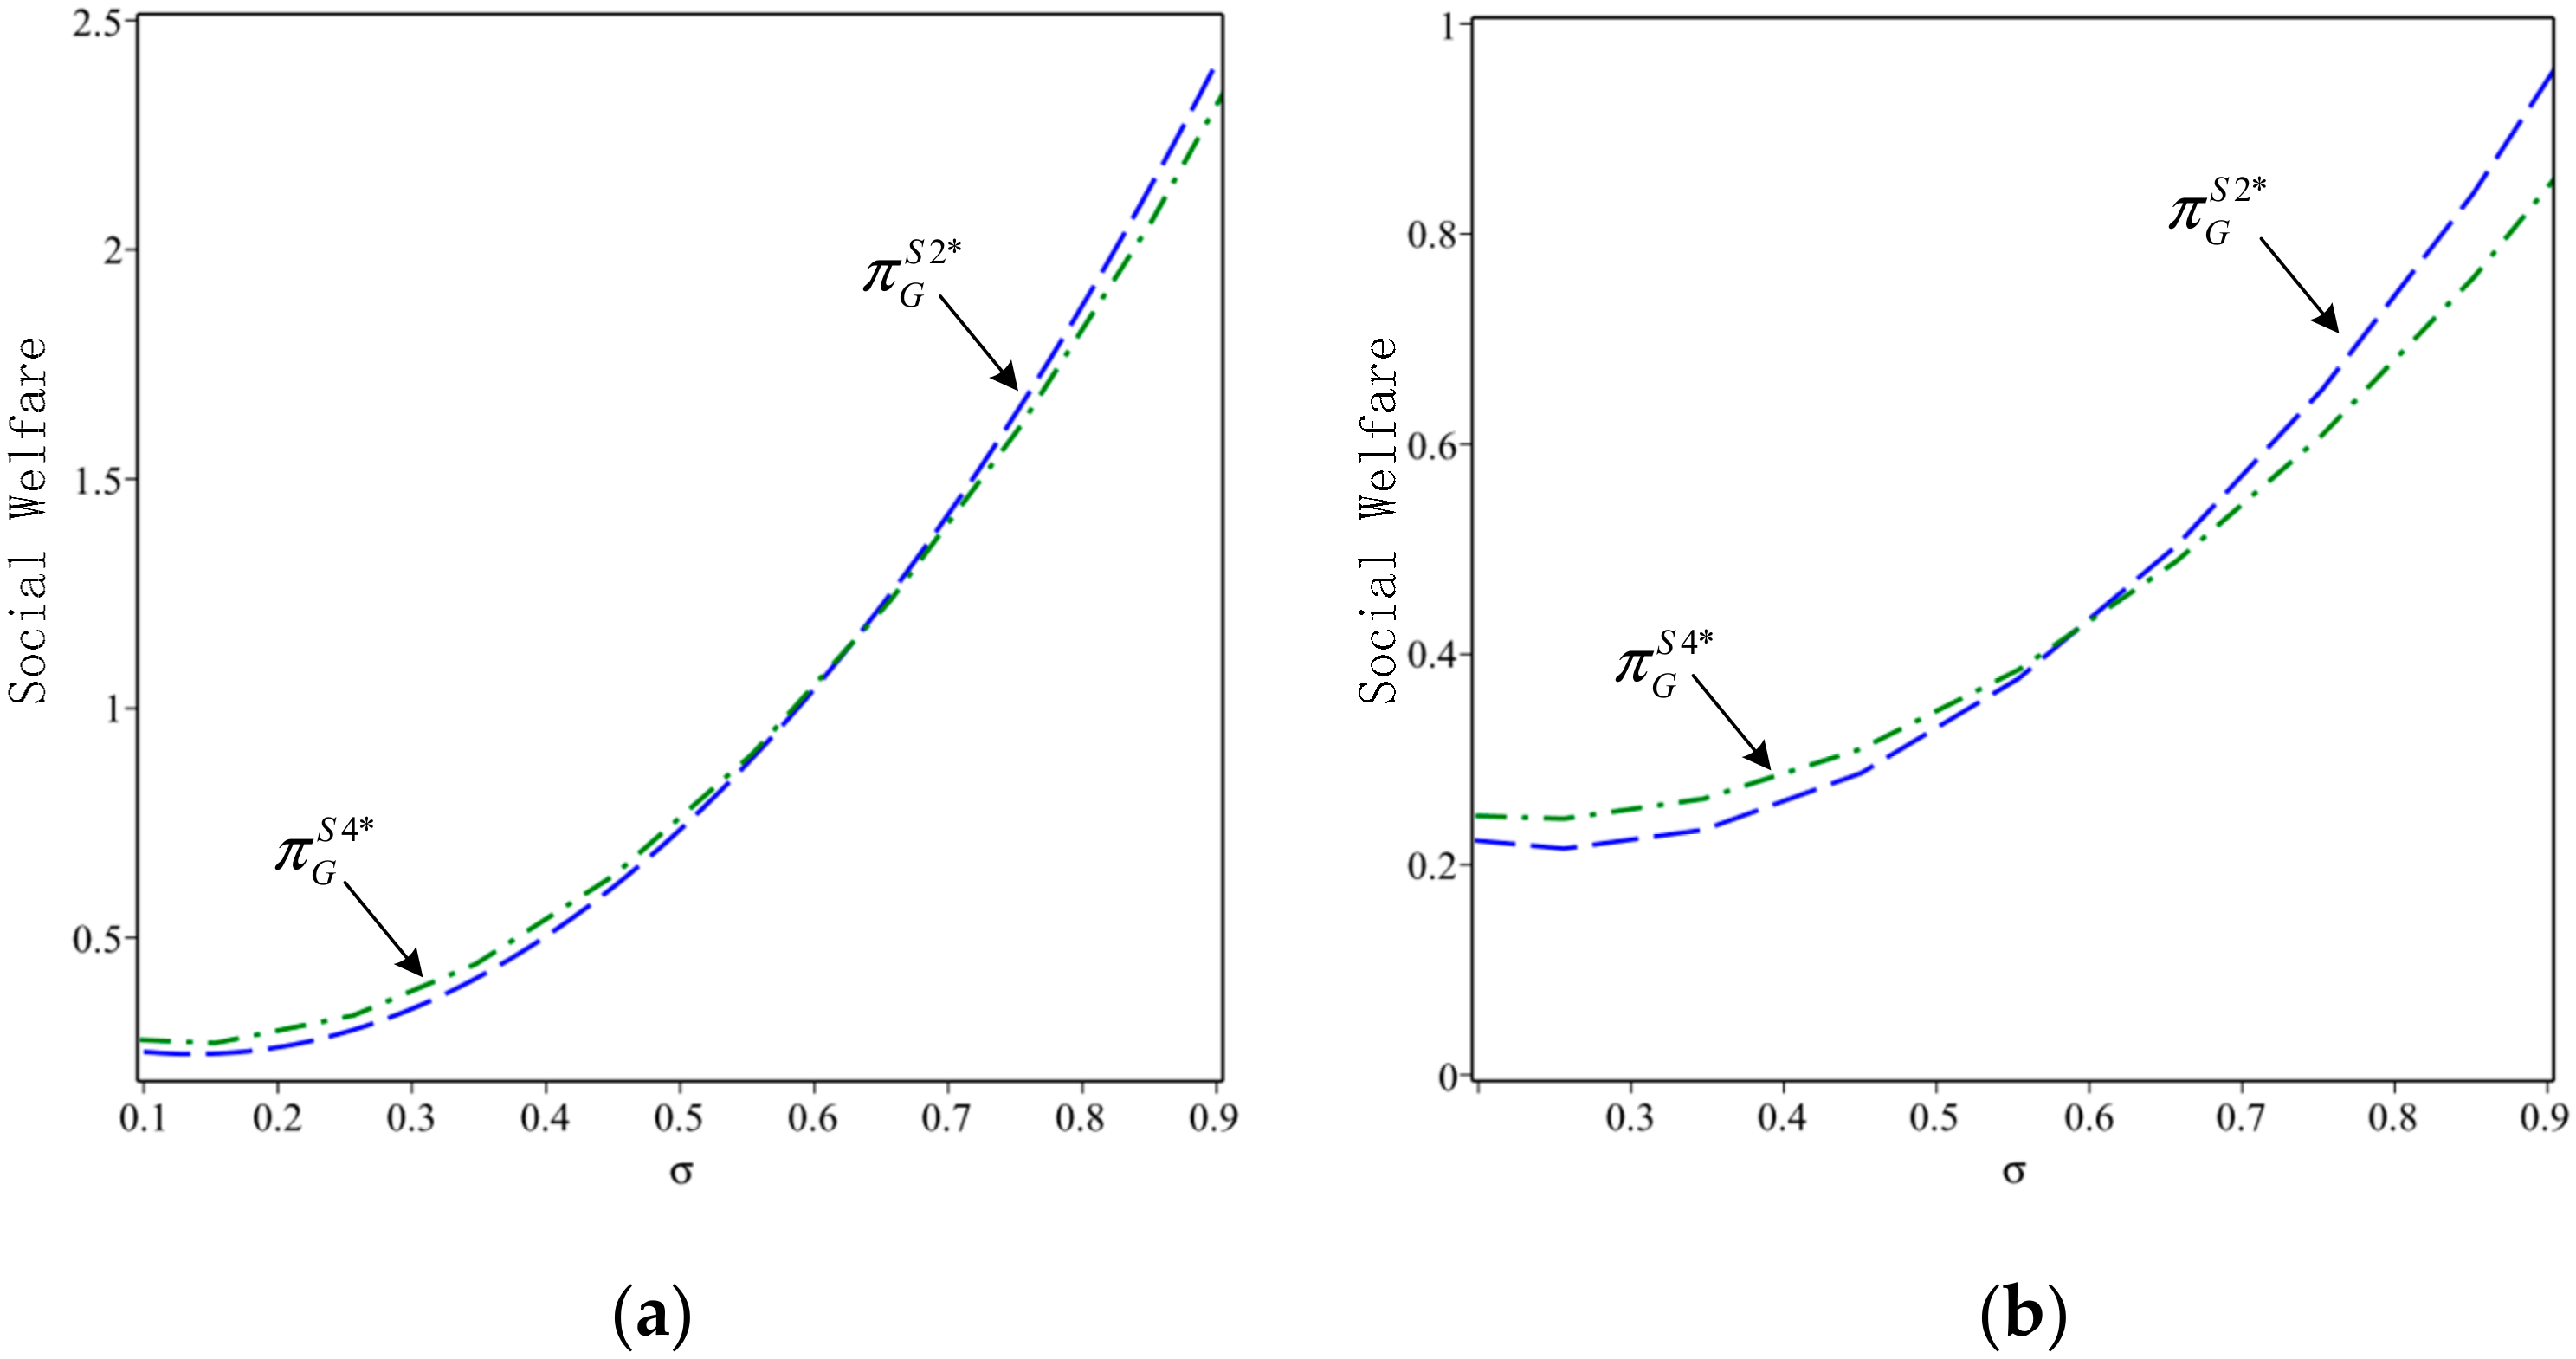
5.2.2. Region
In the region
, the manufacturer’s decision is not constant and it depends on the government’s strategy. Under a medium eco-design coefficient, if
, the equilibrium strategy pair is one of {Penalize(G), Remanufacture(M)} or {Subsidize(G), Eco-design(M)}. If
, the equilibrium strategy pair is one of {Subsidize(G), Remanufacture(M)} or {Penalize(G), Eco-design(M)}. Due to the structural complexity of equilibrium decisions shown in
Section 4, and consequently the comparison of the optimal social welfare, we analyze by presenting numerical simulations.
Under the condition of Region
, for
Figure 3a (
), let firstly
,
,
,
,
and
. In
Figure 3a, for a higher level of hazardous materials (i.e.,
), the government is likely to impose a take-back penalty, and the manufacturer reacts by remanufacturing. A smaller amount of toxic materials in the product (i.e.,
) motivates the chance that the government offers a take-back subsidy, and the manufacturer prefers to perform eco-design instead of remanufacturing. Then, for
Figure 3b (
), let
,
,
,
,
and
.
Figure 3b reveals that if the manufacturer produces a more polluting product (i.e.,
), the government imposes a take-back penalty and eco-design is the manufacturer’s response. However, for a product with a lower level of hazardous materials, the government offers a take-back subsidy, and the manufacturer performs remanufacturing which avoids the regulation penalty. In total, under a medium eco-design coefficient, a product with a larger amount of toxic materials inhibits the government’s subsidy and motivates the penalty.
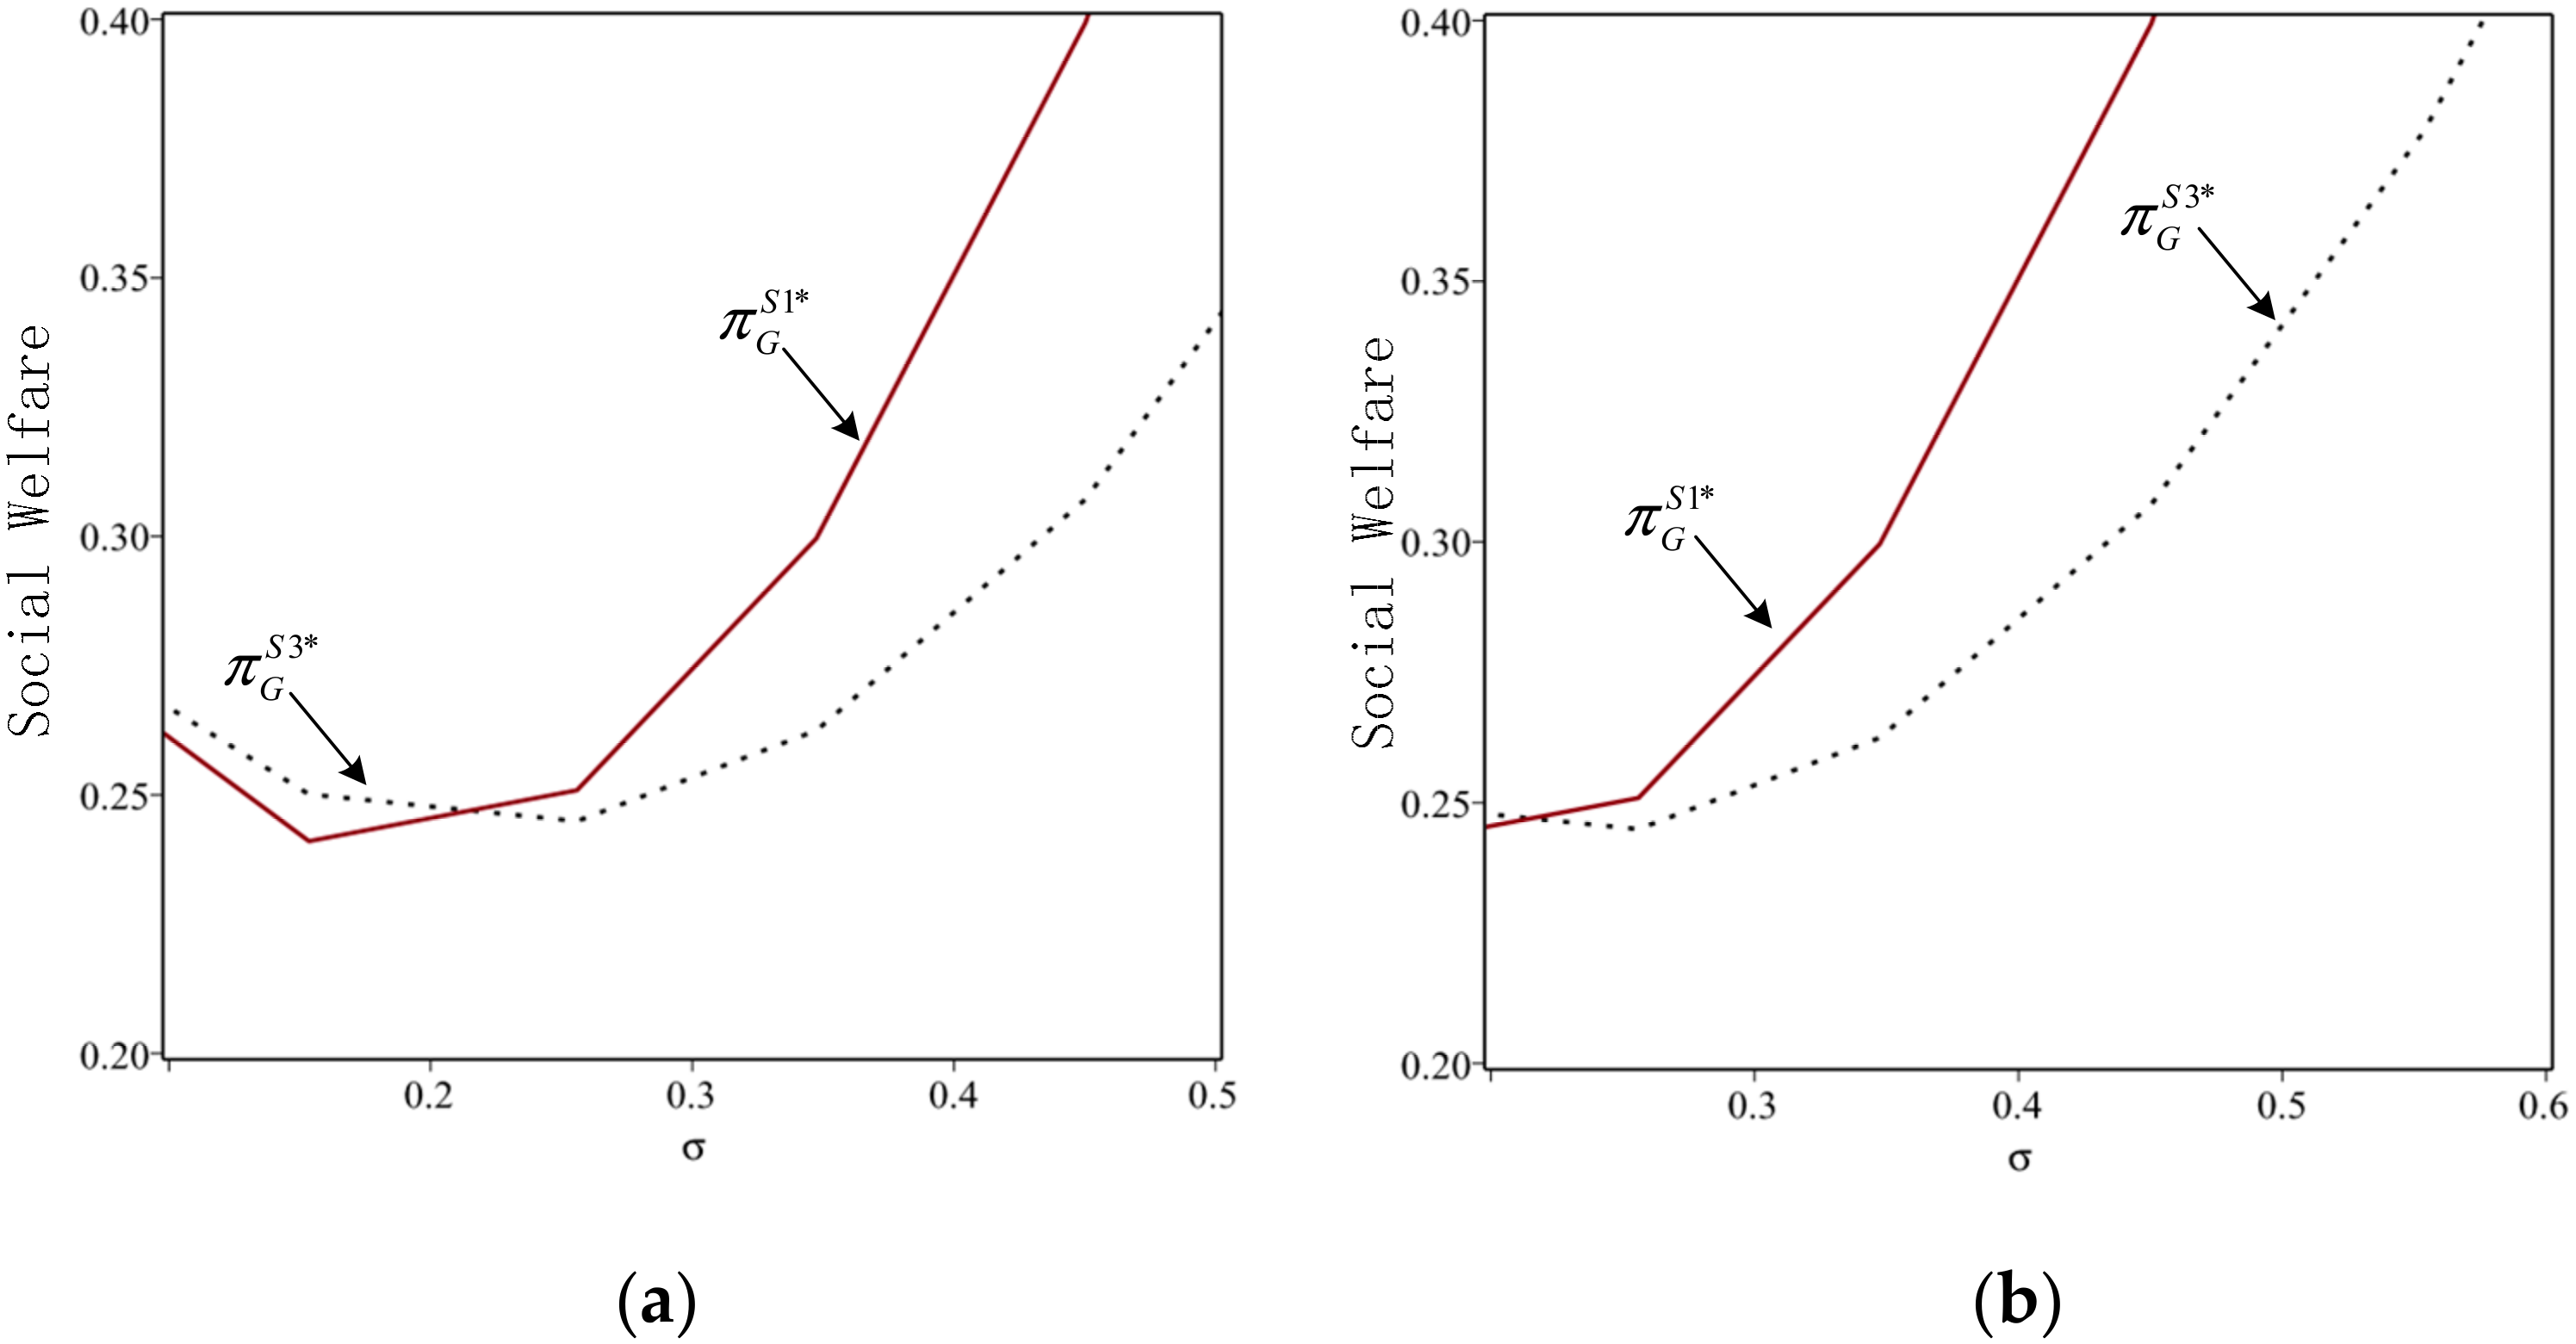
5.2.3. Region
In this region, the manufacturer always decides on remanufacturing, not considering the take-back policy which involves a penalty or subsidy.
Proposition 7. If, the government offers a take-back subsidy; otherwise, the government imposes a take-back penalty. In this case,.
Proposition 7 describes that a certain threshold for the monetary value of environmental impact of landfill that separates penalizing and subsiding. Under a higher eco-design coefficient, the government decides to penalize the manufacturer’s higher landfill pollution product to obtain higher social welfare. Otherwise, offering a take-back subsidy is the best choice. Then the manufacturer only decides on remanufacturing as a response.
We need numerical examples to verify the validity of Proposition 7 under the condition of Region
, which is shown in
Figure 4. For
Figure 4a (
), let
,
,
,
,
and
. For
Figure 4b (
), let
,
,
,
,
and
. In
Figure 4a, if
, the government selects to subsidize to increase social welfare. A take-back penalty is more necessary for the manufacturer who produces a more polluting product (i.e.,
). The same logic applies to the situation that
in
Figure 4b. This example also implies that under a higher eco-design coefficient, the government’s take-back policies, either penalizing or subsidizing, cannot prompt the manufacturer to invest in eco-design.
5.3. Sub-Game Perfect Equilibria
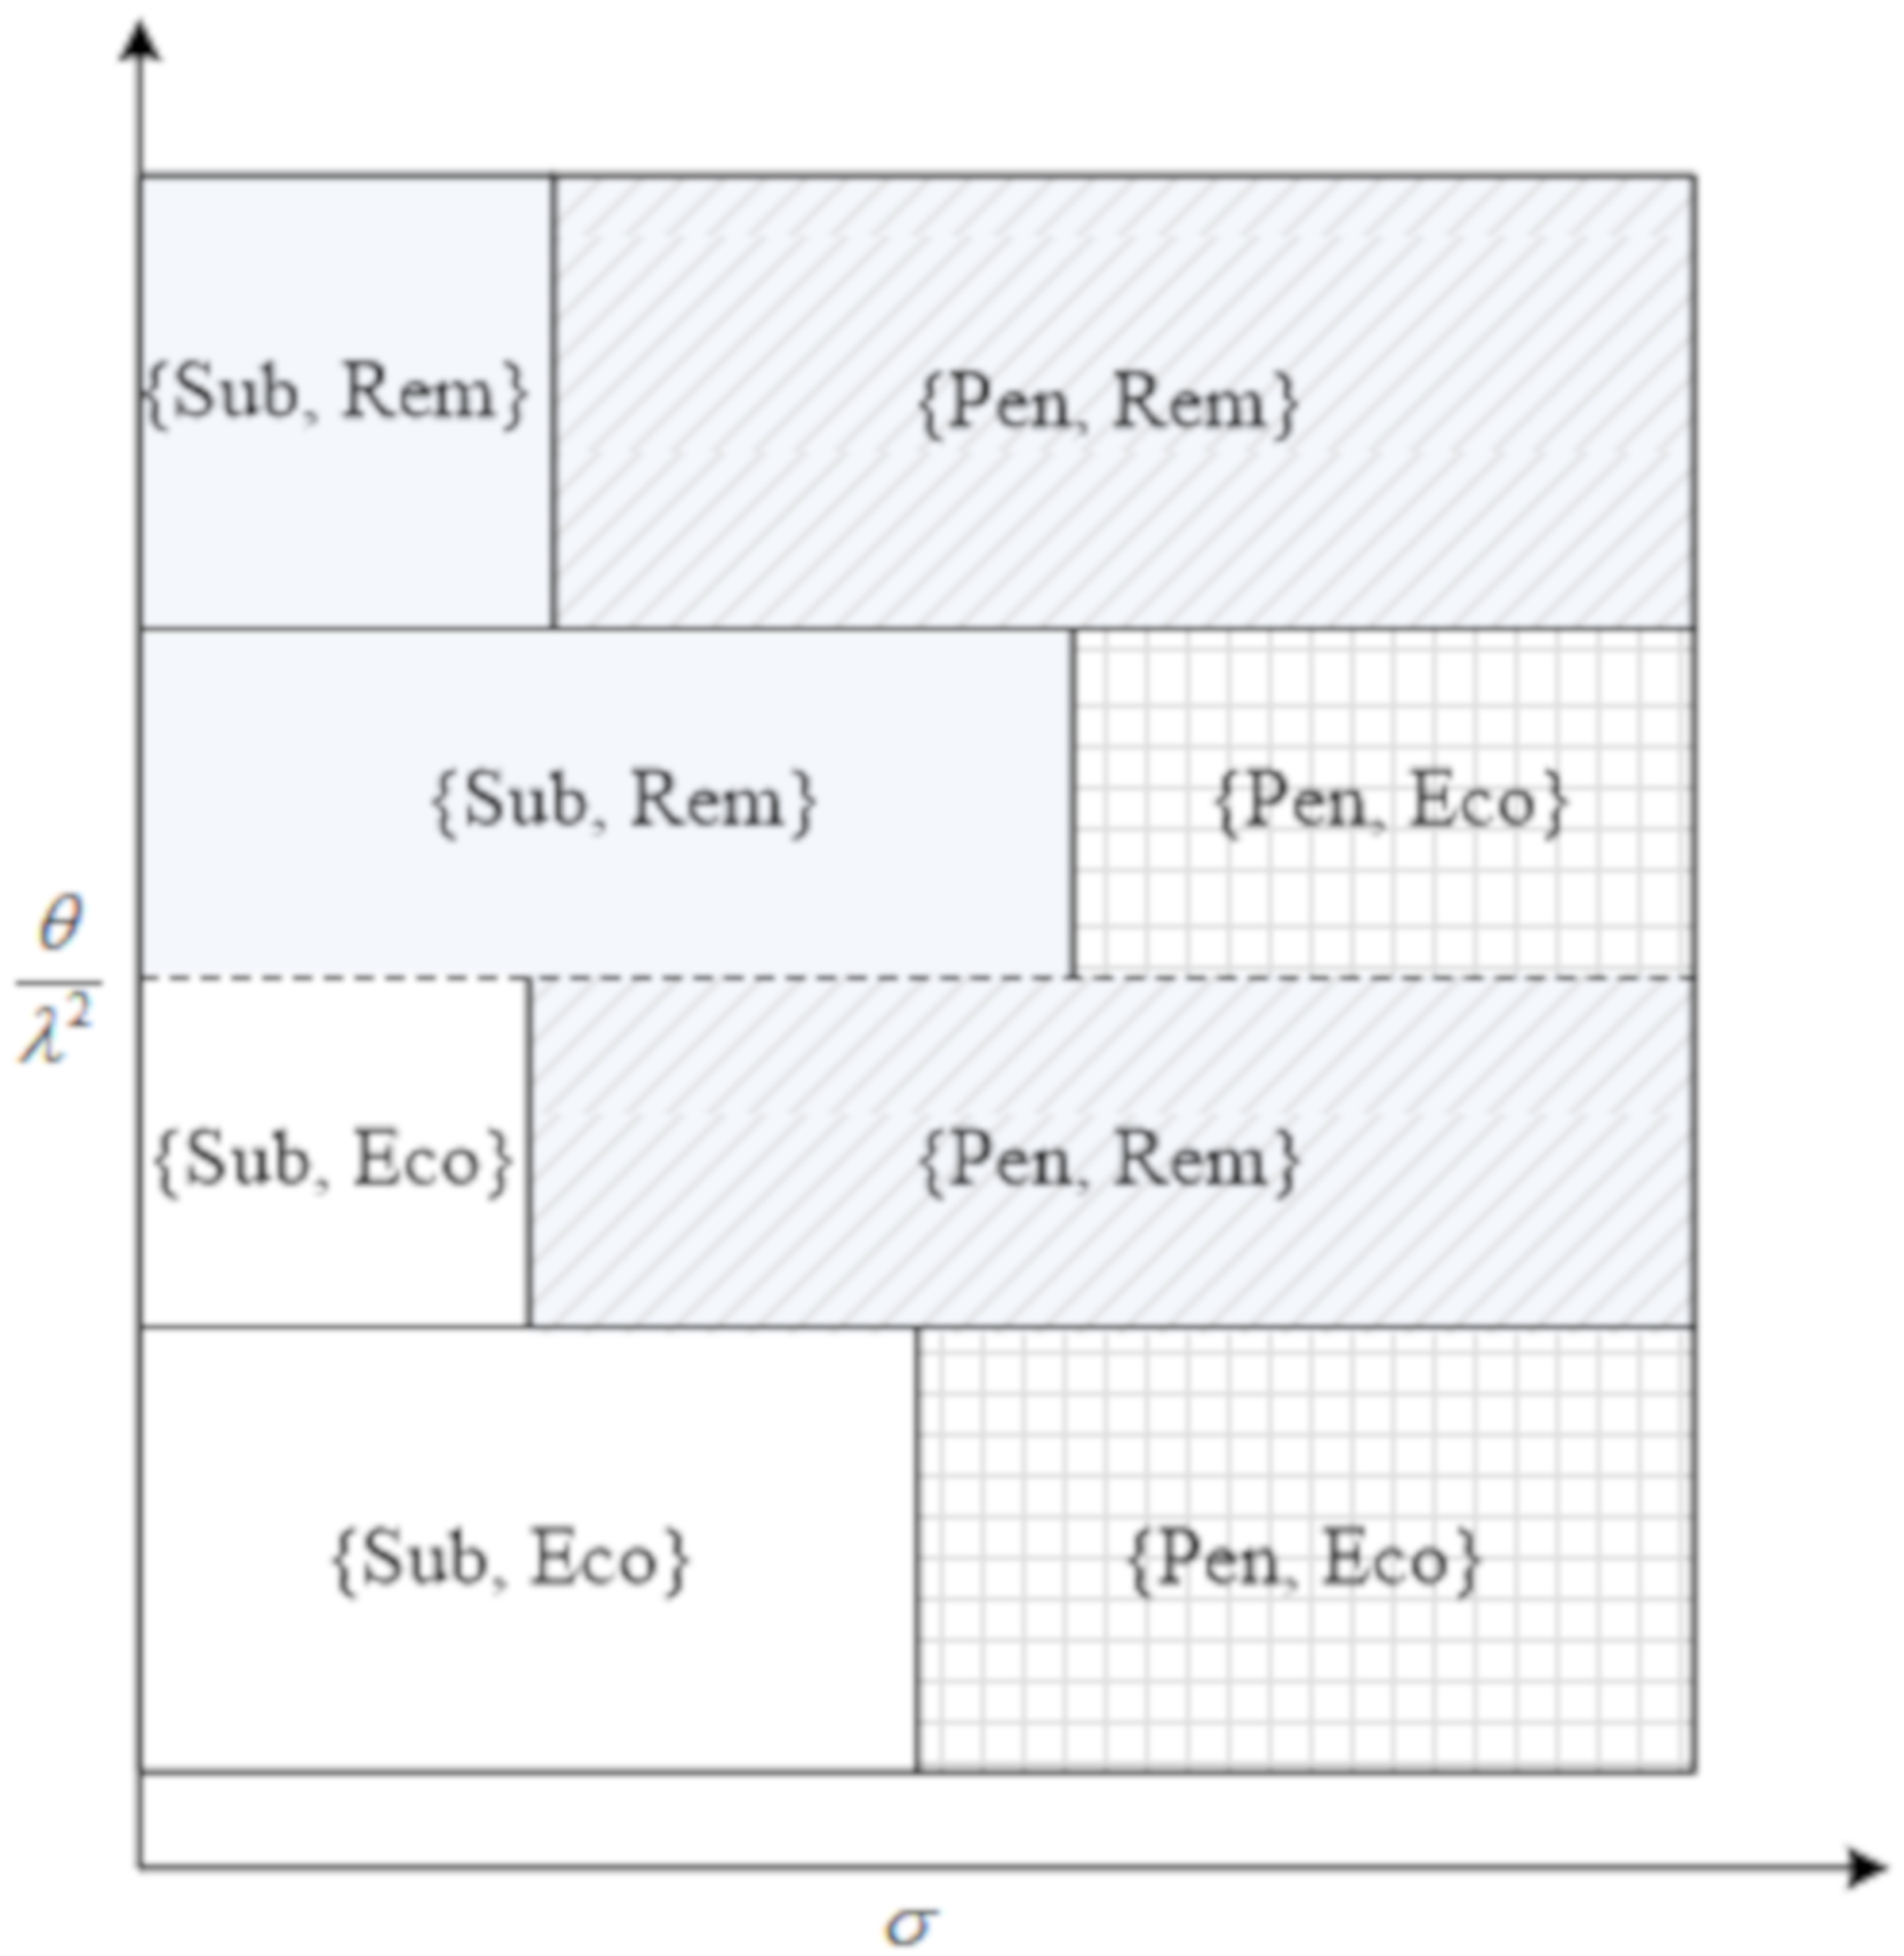
Based on the above, with the support of theoretic analysis and numerical simulation, we further sum up the optimal strategy pairs for government and manufacturer as decision guidance in
Figure 5. We still select the monetary value of environmental impact of landfill and eco-design coefficient as two factors which are important in making decisions. “Rem”, “Eco”, “Pen” and “Sub” are abbreviations for “Remanufacturing”, “Eco-design”, “Penalizing” and “Subsidizing”. Each strategy pair in the square is sub-game perfect equilibria at different levels of polluting products and eco-design.
In
Figure 5, let
,
,
,
and
. Observing
Figure 5, whether the take-back has penalized or granted a subsidy, the manufacturer performs eco-design when the eco-design coefficients are low enough, and the manufacturer chooses to remanufacture when the eco-design coefficients are high enough. However, for medium eco-design coefficients, the manufacturer’s decision depends on the government’s strategy on penalizing or subsidizing. On the other hand, the government, a leader in the game, prefers to offer a take-back subsidy for a low monetary value of environmental impact of landfill and changes to impose a penalty for high monetary value.
We present the central research question of this study in
Figure 5, which is to characterize where the government imposes a take-back penalty or offers a take-back subsidy and when the manufacturer performs eco-design or remanufacturing.
6. Conclusions
This paper investigates the question of whether the manufacturer selects remanufacturing and eco-design as two strategies to react to the government’s take-back policy of penalizing or subsidizing. The government, as a leader, selects to impose a take-back regulation penalty or offer a take-back regulation subsidy, and decides on the optimal per unit penalty or subsidy. The manufacturer, as a follower, decides to remanufacture or invest in eco-design as a response to regulation policies. We present four scenarios on the basis of strategy pairs and provide framework models for each scenario to analyze and compare equilibrium. We consider regulatory forces firstly take part in the decisions of two take-back policies, which has been less studied in the past. Under different policies, producers’ strategy selections also present a more complex response mechanism, which differs from the literature that we reviewed in
Section 2. Our findings add to the previous literature about the take-back regulation question in terms of modeling and practical managerial recommendations. Our results shed light on the option of remanufacturing and eco-design under the take-back policies in the following aspects.
We provide insights into the decisions of production, acquisition, remanufacturing, emission reduction efforts and take-back policies in different scenarios. We find that the government may set a higher take-back penalty for a browner product, and the manufacturer will invest more emission reduction efforts in a browner product, and increase production of remanufacturing and collecting but decrease production of the new. We further get an important constraint for this paper, which expresses cost-efficiency of eco-design efforts related to its processing cost reduction effectiveness, named “eco-design coefficient”.
Then, focusing on two factors of the monetary value of environmental impact of landfill and eco-design coefficient, we analyze the equilibrium strategy pairs by comparing profit and social welfare in each scenario. We find that the government offers a take-back subsidy for greener products and imposes a take-back penalty for browner products. The manufacturer, as a follower, performs eco-design when investing cost when the eco-design is lower. If the monetary value of environmental impact of landfill and the eco-design coefficient are medium, the manufacturer also prefers to invest in eco-design in some situations. However, for a high eco-design coefficient, the manufacturer does not consider eco-design and practices remanufacturing, whether penalized and subsidized.
Our work also has some limitations. For manufacturers, we consider the recycle processing cost as a negative factor for profits. It means that manufacturers incur costs by recycling and processing collected products. However, some examples show that manufacturers may obtain profits higher than costs from recycle processing; this is a point we ignore. Moreover, the government can also implement the joint penalty-subsidy policy to regulate the take-back behaviors of manufacturers. It is an interesting future research direction that models the above considerations in more depth.


