Empirical Study of Urban Development Evaluation Indicators Based on the Urban Metabolism Concept
Abstract
1. Research Motivation and Objectives
2. Literature Review
2.1. Urban Metabolism
2.2. Sustainable Development Indicators
2.3. The Link between Sustainable Development Indicators for Urban Metabolism
3. Research Methods and Procedures
3.1. Fuzzy Delphi Method
3.2. Analytic Network Process
4. Urban Metabolism Indicator Establishment
5. Discussions
- (1)
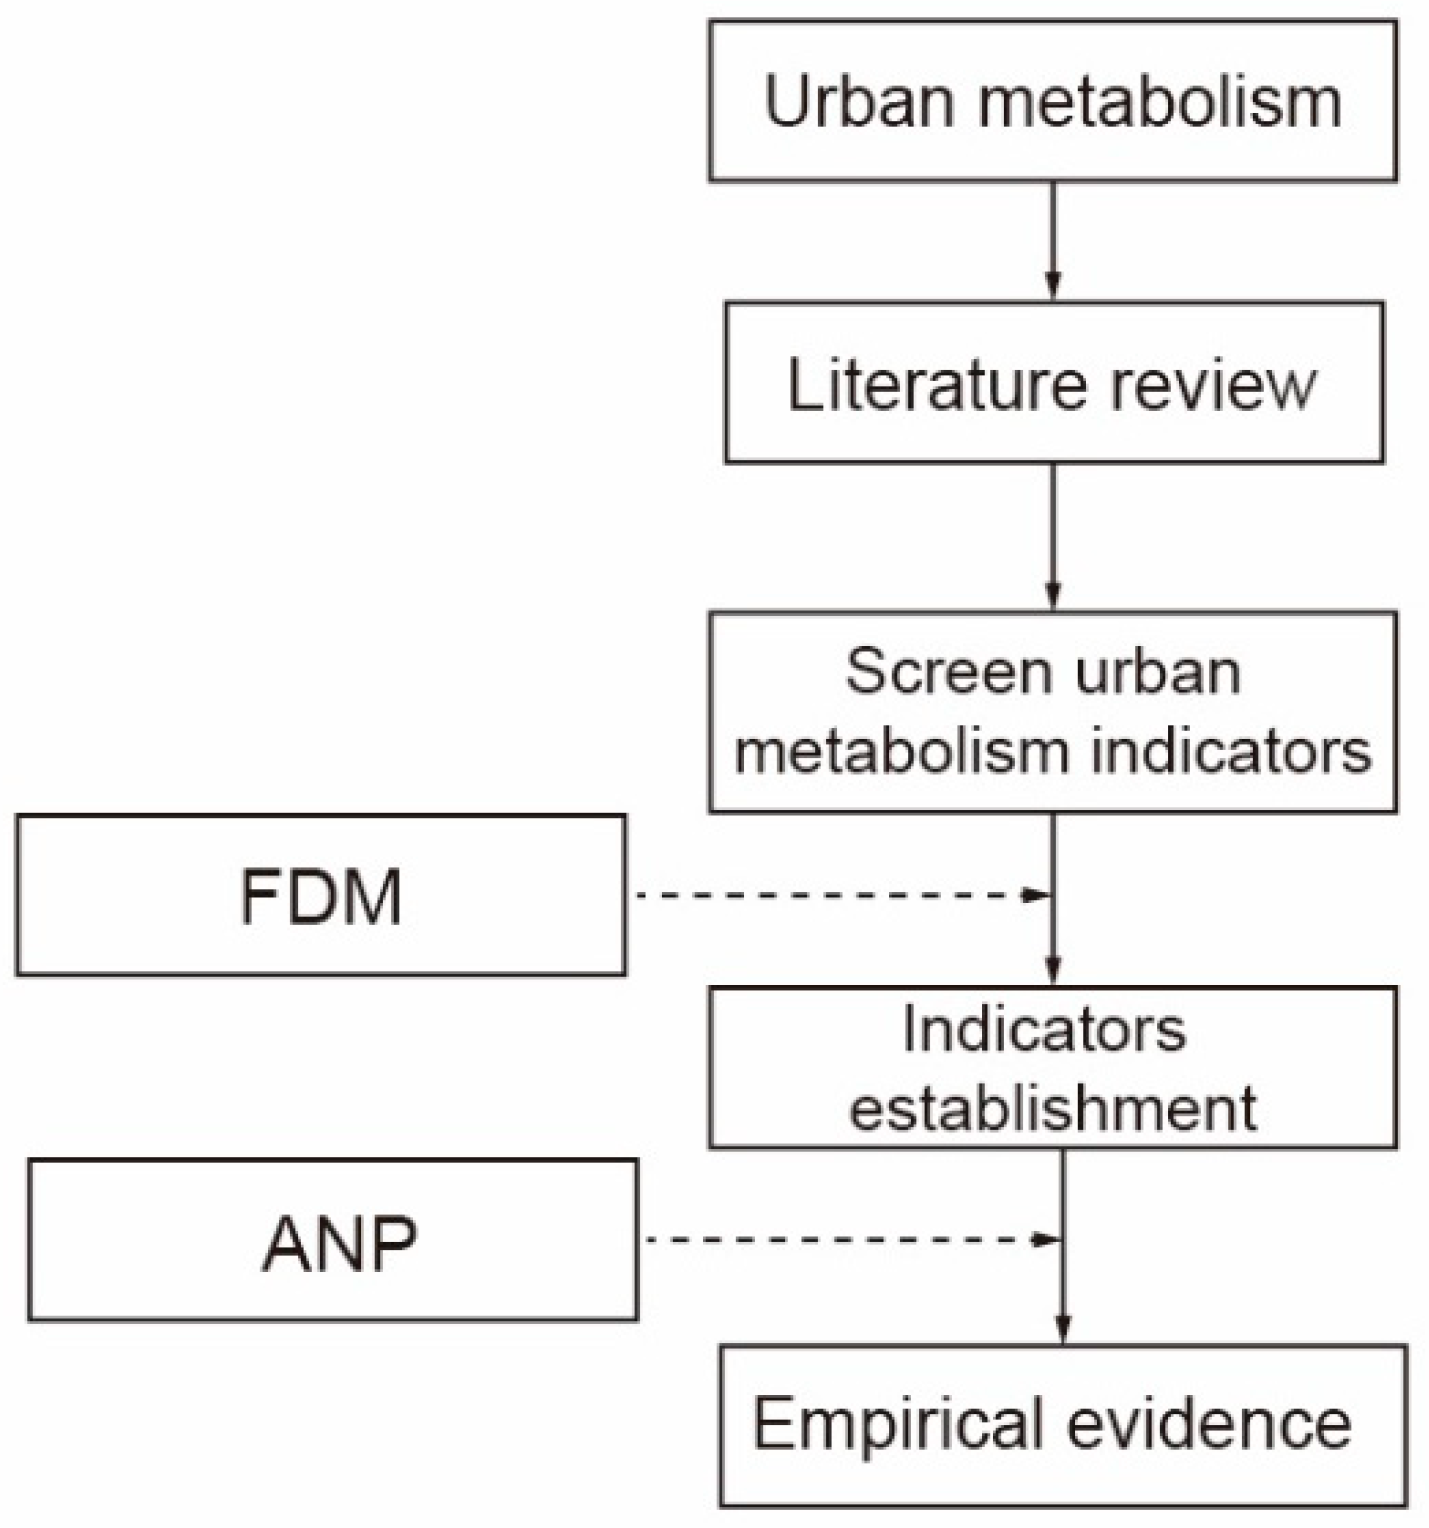
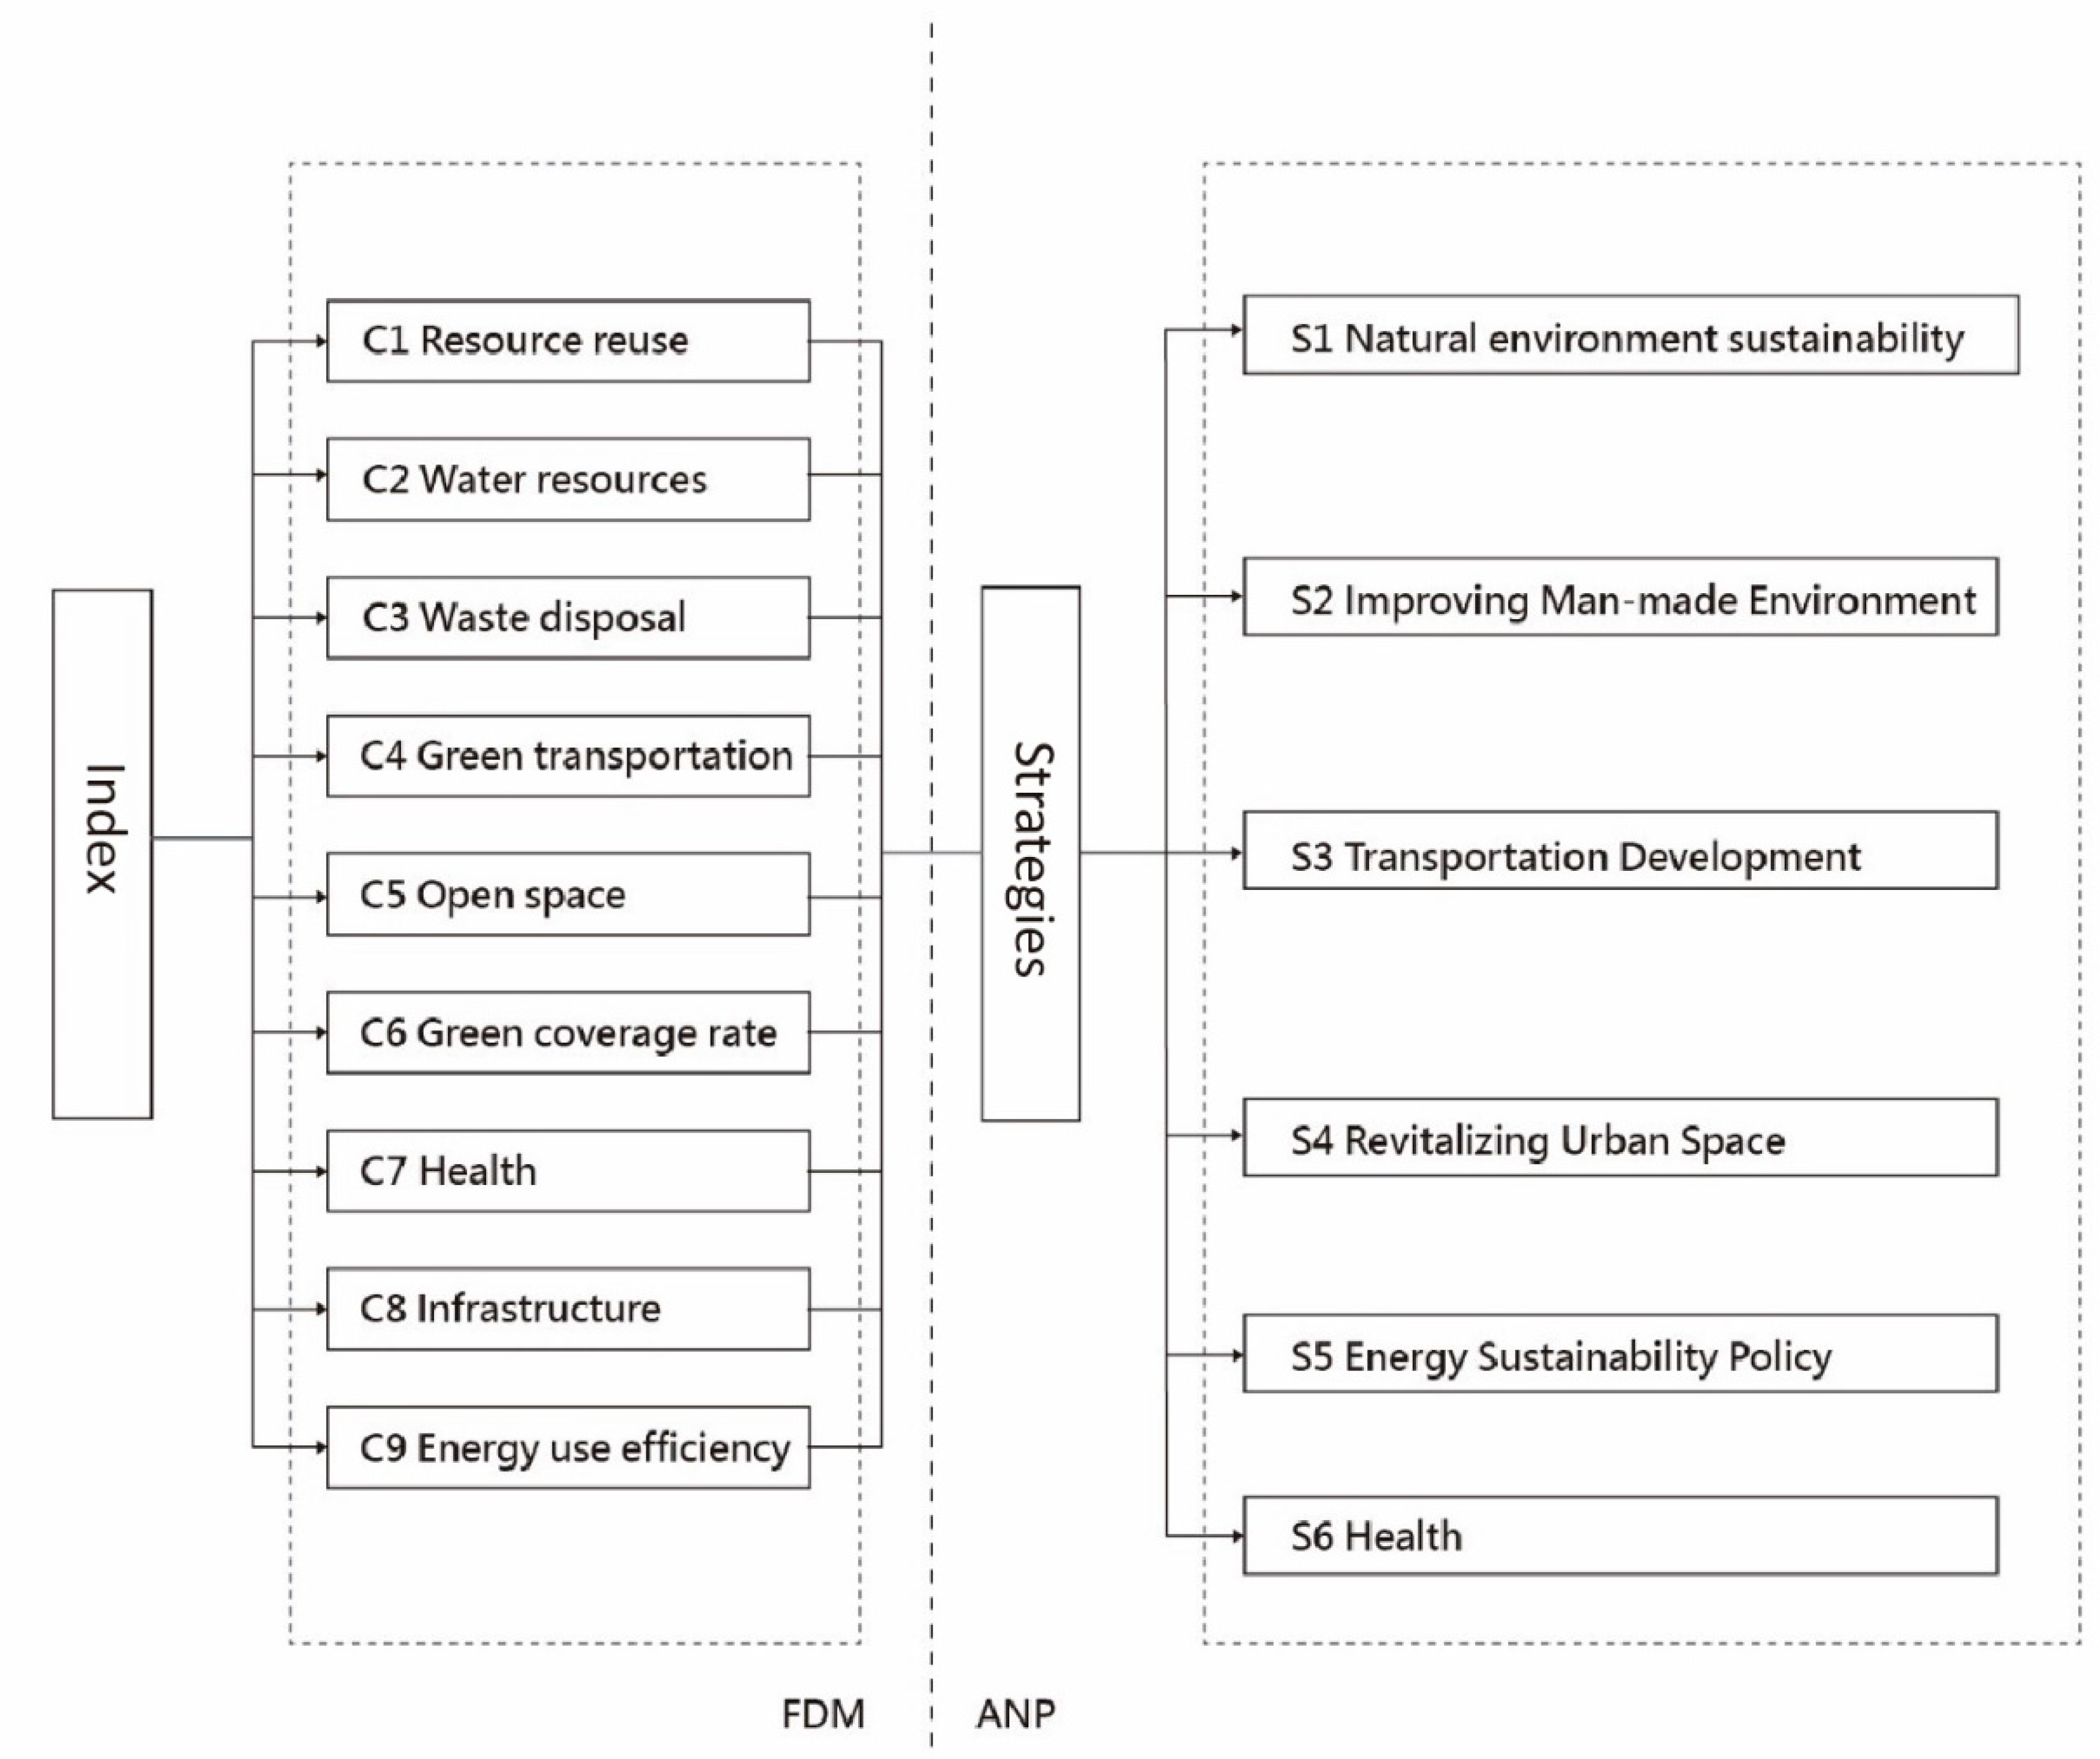
- Through a literature review and fuzzy Delphi calculations on expert questionnaires, evaluation indicators for urban metabolism were developed. The indicators were divided into economic, social, and environmental aspects, including resource reuse, energy use efficiency, green transportation, infrastructure, waste disposal, green coverage rate, water resources, health, open space, air quality, energy self-sufficiency rate, population structure, alternative energy use efficiency, ecosystem diversity, cultural/artistic facilities, working population, urban design, and noise, and were used as a preliminary structure to conduct expert questionnaires. Analysis of the fuzzy Delphi method revealed that expert consensus was high. Experts discussed the importance of evaluation indicators according to designated thresholds. Based on the geometric mean of 6.93, a consensus value of 7.00 was set as a threshold to screen out indicators. Nine indicators were finally selected: resource reuse, energy use efficiency, green transportation, infrastructure, waste disposal, green coverage rate, water resources, health, and open space.
- (2)
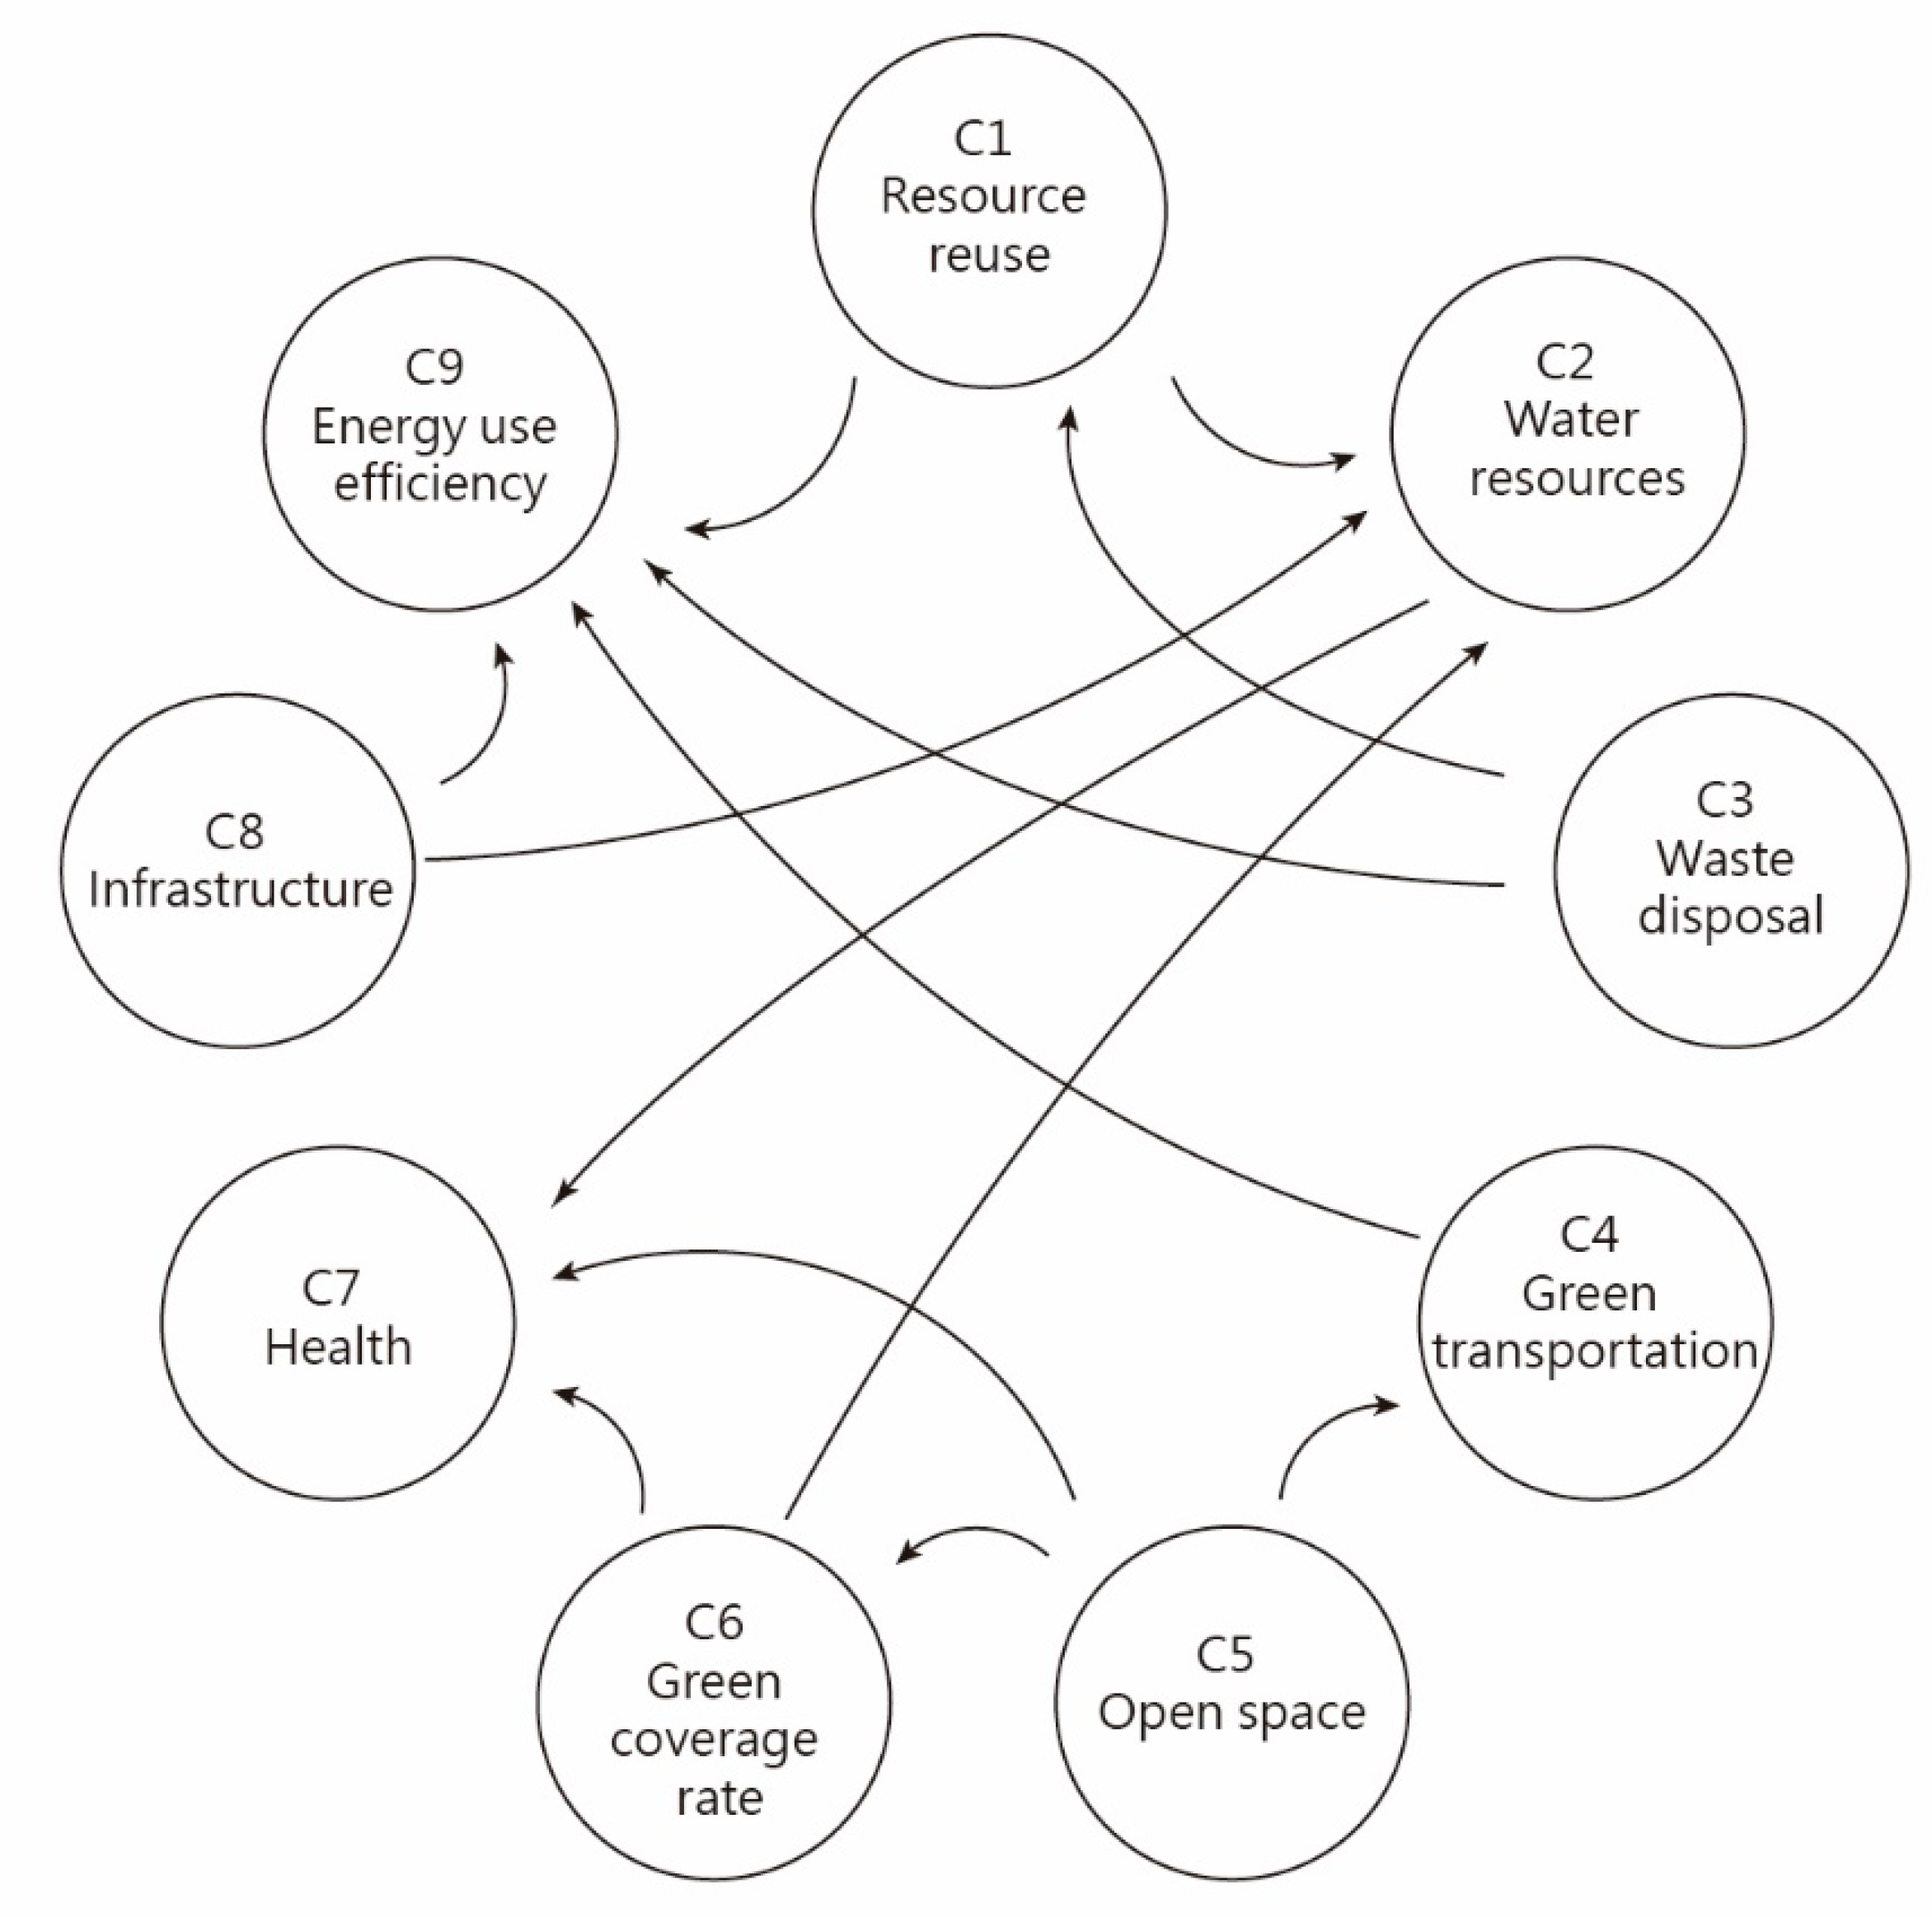
- Expert questionnaires with the fuzzy Delphi method in the first stage were the basis of the second stage at which the ANP was performed. According to the policy implementation report of Taipei City over the past 3 years, six strategies were summarized: Natural Environment Sustainability, Energy Sustainability, Improving Man-Made Environment, Revitalizing Urban Space, Transportation Development, and Health. The actual importance weight was obtained through the matrix statistical operation for the second-stage AHP questionnaire. After considering the interdependencies of indicators, actual weights Wc were acquired: C1 resource reuse = 0.059, C2 water resources = 0.470, C3 waste disposal = 0.035, C4 green transportation = 0.068, C5 open space = 0.037, C6 green coverage rate = 0.075, C7 health = 0.126, C8 infrastructure = 0.048, and C9 energy use efficiency = 0.080. Indicators with high importance level comprised water resources, followed by health and then energy use efficiency.
- (3)
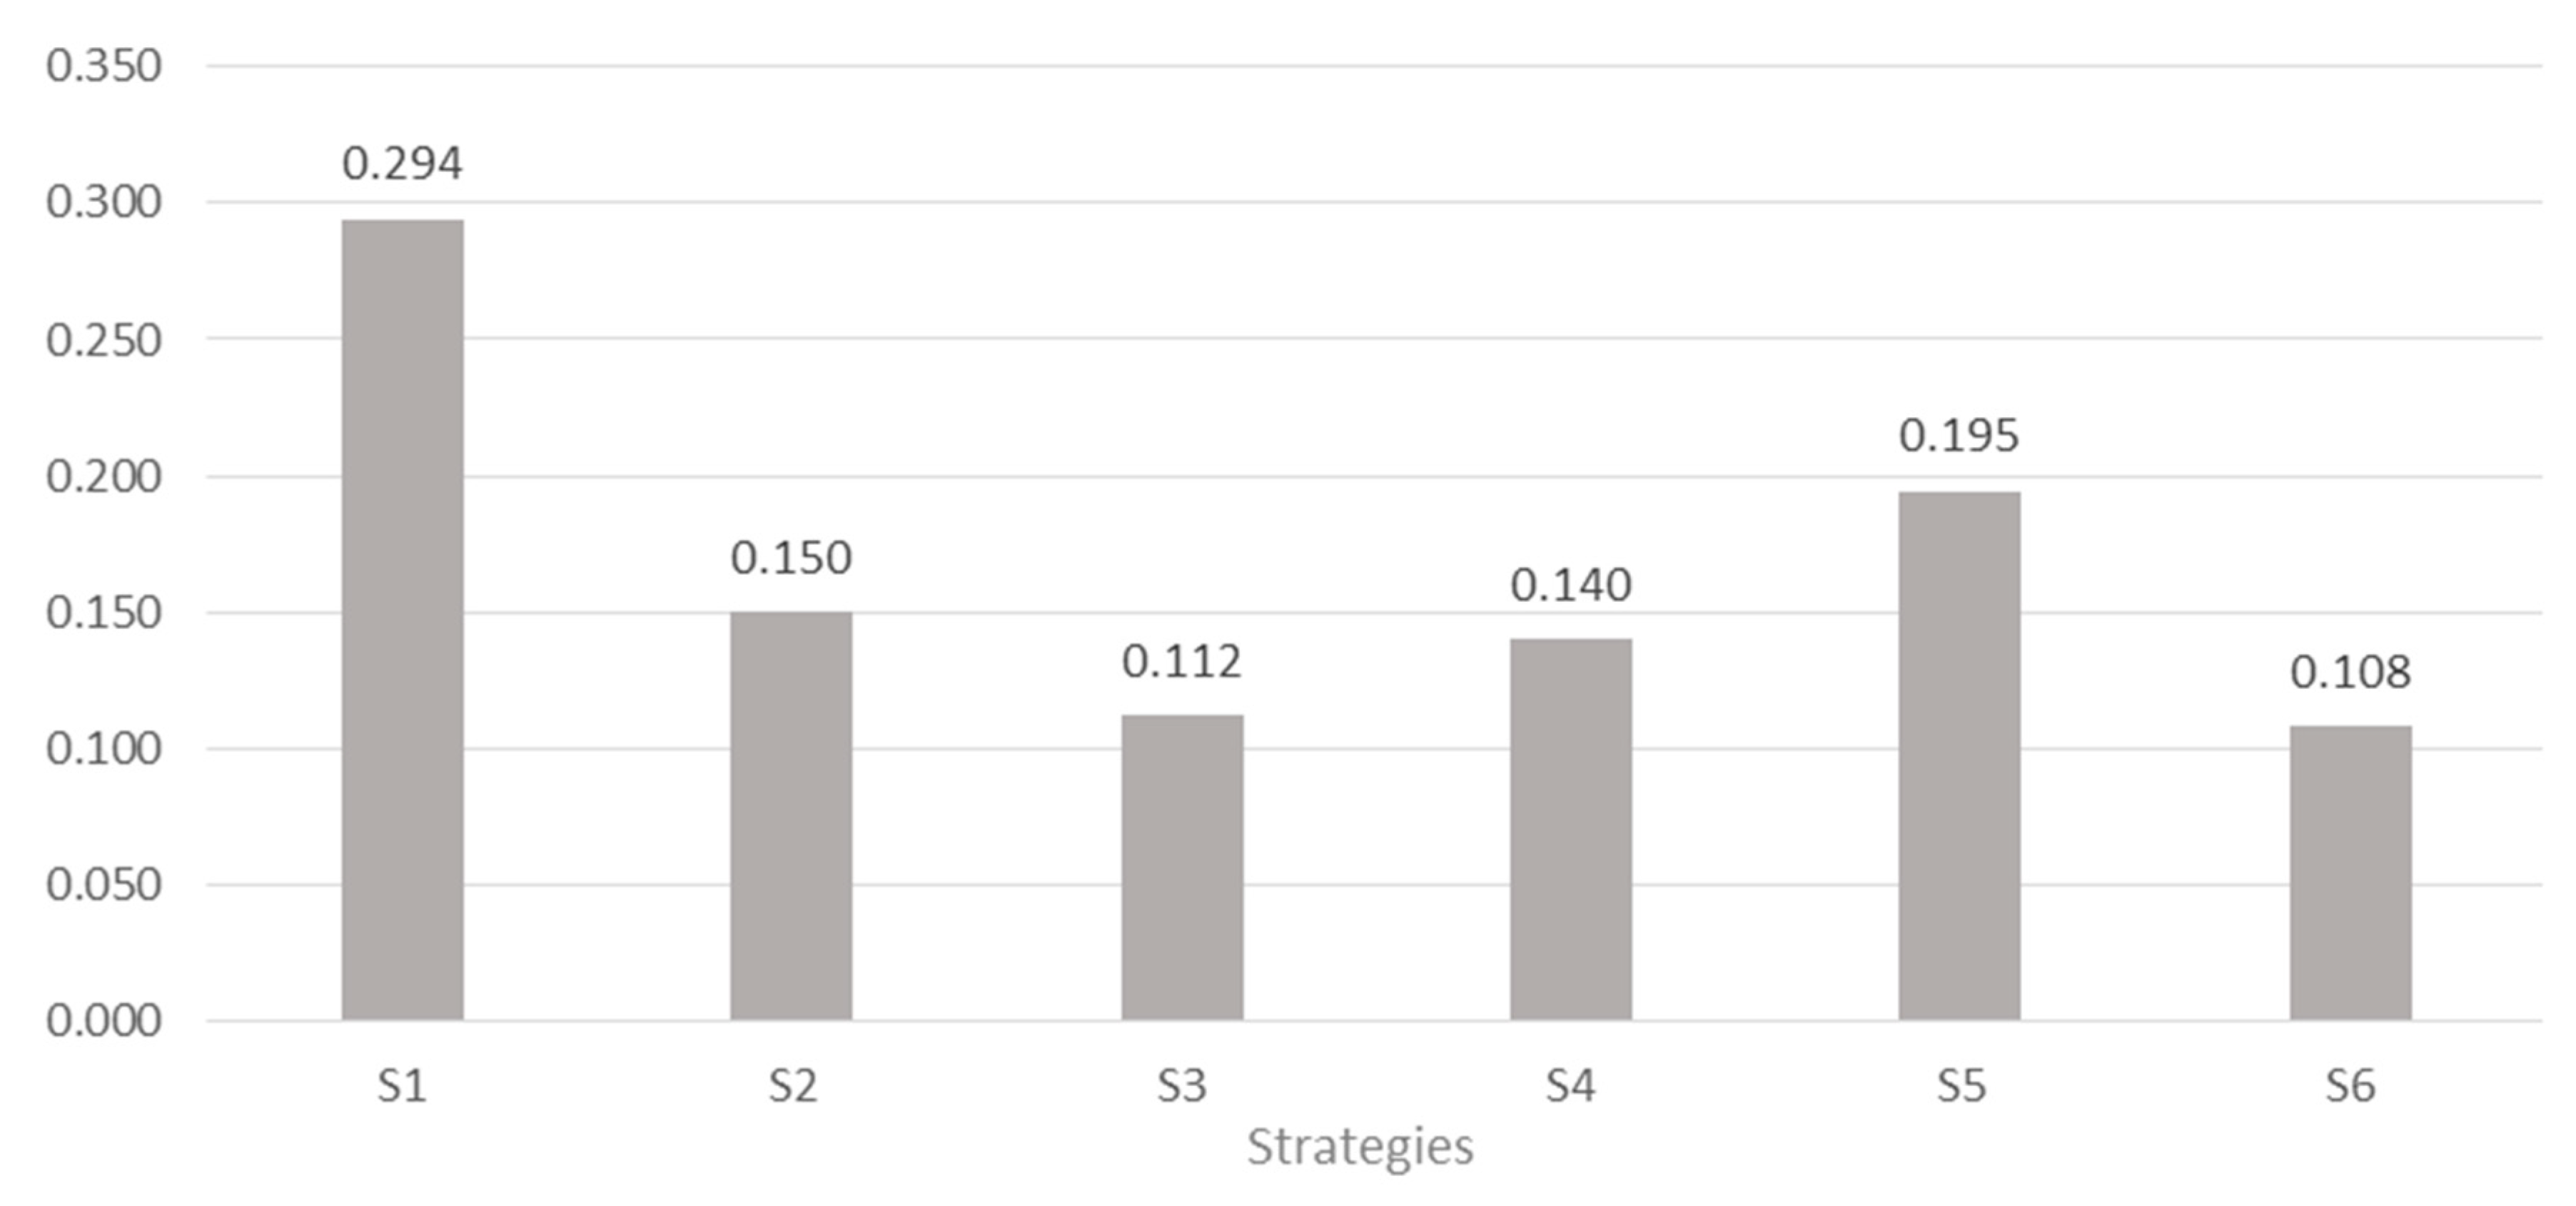
- Regarding urban development policy evaluation based on the metabolism concept, the study results (Figure 7) reveal that S1 Natural Environment Sustainability (29.4%) and S5 Energy Sustainable Development (19.5%) were crucial and prioritized plans. These results were consistent with the analysis results of selected indicators, and S2 Improving Man-Made Environment (15.0%), S4 Revitalizing Urban Space (14.0%), and S3 Transportation Development (11.2%) exhibited small differences in values, which were secondary urban development policy considerations.
- (4)
- Natural environment sustainability obtained the highest weight value. Because Taipei City planned a “Sustainable Taipei Eco-City” for environmental sustainability, this study proposed corresponding strategies under its vision for environmental ecology, water treatment, resource reuse, and flood control. The government should strengthen the establishment of key performance indicators with regular monitoring and tracking, encourage citizens to participate in activities (e.g., seminars or family activities), and introduce the environmental protection concept into people’s daily lives. Moreover, environmental education can be conducted for elementary school students. Energy sustainability strategies can be initiated in public institutions, such as by building smart grids and solar panels and converting idle waste landfills into solar power parks to expand green energy generation. In addition, the government can strengthen the promotion of smart grids and solar panels, organize regional seminars or events, communicate with the public, and use incentive measures to encourage people to participate and move toward sustainable development together.
Author Contributions
Funding
Acknowledgments
Conflicts of Interest
Appendix A
| Evaluation factor | Description | |
|---|---|---|
| C1 | Resource reuse | All urban resources should be conserved to prevent environmental damage caused by excessive use of them, such as through resource recycling promotion and reuse activities. |
| C2 | Water resources | The use and treatment of water resources involves major environmental impact assessment projects and is an essential part of metabolism. |
| C3 | Waste disposal | Waste is the product of activity, disposal methods affect the environment, and waste is the most crucial part affecting metabolism. |
| C4 | Green transportation | Cities should have environmentally friendly transportation, which includes cycling and walking in addition to mass transportation. |
| C5 | Open space | Open spaces are where residents can rest and relax. Most open spaces improve residents’ living environments and may attract visitors to the city. |
| C6 | Green coverage rate | This refers to urban areas covered by green vegetation, including parks and flower gardens that provide leisure activities in urban life and allow for the development of beautiful landscapes to improve residents’ quality of life. |
| C7 | Health | This refers to urban residents’ physical and mental health levels and the number of health facilities. |
| C8 | Infrastructure | This refers to basic pipelines in the city, including tap water, sewers, gas, and water conservancy. |
| C9 | Energy use efficiency | This is the ratio of effectively used energy to actual consumed energy. Efficient energy use can reduce waste output and increase metabolism. |
References
- Goodland, R.; Daly, H. Environmental sustainability: Universal and non-negotiable. Ecol. Appl. 1996, 6, 1002–1017. [Google Scholar] [CrossRef]
- UNDP. Agenda 30. 2016. Available online: https://sustainabledevelopment.un.org/post2015/transformingourworld (accessed on 4 October. 2019).
- Flood, J. Urban and housing indicators. Urban Stud. 1997, 34, 1635–1665. [Google Scholar] [CrossRef]
- Huang, S.L.; Yeh, C.T.; Che, L.L. A Review of Urban Sustainability Indicators: Systems Framework and Policy Evaluation. City Plan. 2005, 32, 227–251. [Google Scholar]
- Wolman, A. The Metabolism of Cities. Sci. Am. 1965, 213, 178–190. [Google Scholar] [CrossRef]
- UNCED. Agenda 21. 1992. Available online: http://www.un.org/esa/sustdev/agenda21.htm. (accessed on 4 October.2019).
- European Environment Agency. Developing a Pragmatic Approach to Assess Urban Metabolism in Europe; Stockholm Environment Institute: Stockholm, Sweden, 2011. [Google Scholar]
- Heynen, N.; Kaika, M.; Swyngedouw, E. In the Nature of Cities: Urban Political Ecology and the Politics of Urban Metabolism; Routledge: Abingdon, UK, 2006. [Google Scholar]
- Girardet, H. The Metabolism of Cities. In The Living City: Towards a Sustainability Further; Taylor &Francis: New York, NY, USA, 1990. [Google Scholar]
- Van Broekhoven, S.; Vernay, A.-L. Integrating Functions for a Sustainable Urban System: A Review of Multifunctional Land Use and Circular Urban Metabolism. Sustainability 2018, 10, 1875. [Google Scholar] [CrossRef]
- Bettencourt, L.M.A.; Lobo, J.; Helbing, D.; Kühnert, C.; West, G.B. Growth, innovation, scaling, and the pace of life in cities. Proc. Natl. Acad. Sci. USA 2007, 104, 7301–7306. [Google Scholar] [CrossRef]
- Pataki, D. Integrating Ecosystem Services into the Urban Metabolism Framework; Public Interest Energy Research (PIER) Program of the California Energy Commission: Sacramento, CA, USA, 2010. [Google Scholar]
- Kennedy, C.; Pincetl, S.; Bunje, P. The study of urban metabolism and its applications to urban planning and design. Environ. Pollut. 2011, 159, 1965–1973. [Google Scholar] [CrossRef]
- Zhang, Y. Urban metabolism: A review of research methodologies. Environ. Pollut. 2013, 178, 463–473. [Google Scholar] [CrossRef]
- Kennedy, C.; Cuddihy, J.; Engel-Yan, J. The Changing Metabolism of Cities. J. Ind. Ecol. 2007, 11, 43–59. [Google Scholar] [CrossRef]
- Pengue, W. Fundamentos de Economia Ecologica; Kalcron: Buenos Aires, Argentina, 2009. [Google Scholar]
- Golubiewski, N. Is There a Metabolism of an Urban Ecosystem? An Ecological Critique. Ambio 2012, 41, 751–764. [Google Scholar]
- Barles, S. Urban metabolism and river systems: an historical perspective – Paris and the Seine, 1790–1970. Hydrol. Earth Syst. Sci. 2007, 11, 1757–1769. [Google Scholar] [CrossRef]
- Odum, H.T. Environmental Accounting: Energy and Environmental Decision Making; Wiley: New York, NY, USA, 1996. [Google Scholar]
- Huang, S.L.; Wong, J.H.; Chen, T.C. The Development and Evaluation of Sustainability Indicator System for Taipei City. City Plan. 1997, 24, 23–42. [Google Scholar]
- Seattle City Council. The City of Seattle Comprehensive Plan: Toward a Sustainable Seattle: A Plan for Managing Growth, 1994–2014; Seattle City Council: Seattle, WA, USA, 1994. [Google Scholar]
- Huang, S.-L.; Hsu, W.-L. Materials flow analysis and emergy evaluation of Taipei’s urban construction. City Plan. 2001, 28, 187–209. [Google Scholar] [CrossRef]
- Lee, Y.J.; Lin, S.J.; Huang, C.M. Construction and Application of Taipei’s Sustainable Development. J. Arch. 2008, 65, 1–26. [Google Scholar]
- Newman, P.W.G. Sustainability and cities: Extending the metabolism modal. Landsc. Urban Plan. 1999, 44, 219–226. [Google Scholar] [CrossRef]
- Pincetl, S.; Bunje, P.; Holmes, T. An expanded urban metabolism method: Toward a systems approach for assessing urban energy processes and causes. Landsc. Urban Plan. 2012, 107, 193–202. [Google Scholar] [CrossRef]
- Rosales, N. Towards the Modeling of Sustainability into Urban Planning: Using Indicators to Build Sustainable Cities. Procedia Eng. 2011, 21, 641–647. [Google Scholar] [CrossRef]
- Kennedy, C.; Steinberger, J.K.; Gasson, B.; Hansen, Y.; Hillman, T.; Havranek, M.; Pataki, D.; Phdungsilp, A.; Ramaswami, A.; Mendez, G.V.; et al. Methodology for inventorying greenhouse gas emissions from global cities. Energy Policy 2010, 38, 4828–4837. [Google Scholar] [CrossRef]
- Quinn, D. Urban Metabolism: Ecologically Sensitive Construction for a Sustainable New Orleans. 2007. Available online: http://web.mit.edu/djq/Public/Thesis/Holcim_April_07_David_Quinn.pdf (accessed on 2 October 2019).
- Conke, L.S.; Ferreira, T.L. Urban metabolism: Measuring the city’s contribution to sustainable development. Environ. Pollut. 2015, 202, 146–152. [Google Scholar] [CrossRef]
- D’Amico, G.; Taddeo, R.; Shi, L.; Yigitcanlar, T.; Ioppolo, G. Ecological indicators of smart urban metabolism: A review of the literature on international standards. Ecol. Indic. 2020, 118, 106808. [Google Scholar] [CrossRef]
- International Organization for Standardization. ISO 37122:2019—Sustainable Cities and Communities. Indicators for Smart Cities; ISO: Geneva, Switzerland, 2019. [Google Scholar]
- UNECE-ITU. The UNECE-ITU Smart Sustainable Cities Indicators; United Nations Economic and Social Council, Economic Commission for Europe: Geneva, Switzerland, 2015. [Google Scholar]
- Levine, R.S.; Hughes, M.T.; Mather, C.R.; Yanarella, E.J. Generating sustainable towns from Chinese villages: A system modeling approach. J. Environ. Manag. 2008, 87, 305–316. [Google Scholar] [CrossRef] [PubMed]
- Yang, D.; Kao, W.T.M.; Zhang, G.; Zhang, N. Evaluating spatiotemporal differences and sustainability of Xiamen urban metabolism using emergy synthesis. Ecol. Model. 2014, 272, 40–48. [Google Scholar]
- Ishikawa, A.; Amagasa, M.; Shiga, T.; Tomizawa, G.; Tatsuta, R.; Mieno, H. The max-min Delphi method and fuzzy Delphi method via fuzzy integration. Fuzzy Sets Syst. 1993, 55, 241–253. [Google Scholar] [CrossRef]
- Jeng, T.B. Fuzzy Assessment Model for Maturity of Software Organization in Improving its Staff’s Capability. Master’s Thesis, Department of Information Management, National Taiwan University of Science and Technology, Taipei, Taiwan, 2001. [Google Scholar]
- Saaty, T.L. Decision making with dependence and feedback: The analytic network process; RWS Publ.: Pittsburgh, PA, USA, 1996; ISBN 0-9620317-9-8. [Google Scholar]
- Lo, C.W.; Chiu, L.C. A Study on the Establishment for Green Transport Recreation Route Planning Indicators by applying Fuzzy Delphi Method and Analytic Network Process. J. Taiwan Land Res. 2015, 18, 81–108. [Google Scholar]
- Wu, J.Y.; Ho, M.C.; Chang, Y.C. Preliminary Study on Urban Disaster Risk Evaluation System under Climate Change. In Proceedings of the 2009 Joint Annual Conference of the Taiwan Institute of Urban Planning, the Chinese Regional Science Association—Taiwan, and the Regional Development Association, Taipei, Taiwan, December 2009. [Google Scholar]
- Wu, J.Y.; Chiang, Y.J. The Development and Analysis on Natural Disaster Statistics Index System in Taiwan. J. Geogr. Sci. 2008, 51, 65–84. [Google Scholar]
- Liu, Y.-Y.; Chiu, Y.-H. Evaluation of the Policy of the Creative Industry for Urban Development. Sustainability 2017, 9, 1009. [Google Scholar] [CrossRef]
- Policy Implementation Report of Taipei City Government. (2016–2018). Available online: https://www.gov.taipei/News_timeflow.aspx?n=0E791EFBDDAAAF80&sms=B53935F84114DE92 (accessed on 12 November 2019).
- Saaty, T.L. The analytic hierarchy and analytic network processes for the measurement of intangible criteria and for decision-making. In Multiple Criteria Decision Analysis; Springer: New York, NY, USA, 2016; pp. 363–419. [Google Scholar]


| Evaluation Indicators | Min (Ci) | Max (Oi) | Singular Value (a) | Geometric Mean | Test Value (Zi) | Expert Consensus (Gi) | |||||
|---|---|---|---|---|---|---|---|---|---|---|---|
| Min | Max | Min | Max | Min | Max | Ci | Oi | Singular Value | |||
| Resource reuse | 5 | 7 | 8 | 10 | 6 | 8 | 6.07 | 8.84 | 7.34 | 3.77 | 7.46 ≥ 6.93 |
| Energy use efficiency | 2 | 8 | 7 | 10 | 5 | 9 | 5.12 | 8.81 | 7.37 | 2.69 | 7.39 ≥ 6.93 |
| Green transportation | 3 | 7 | 8 | 10 | 7 | 8 | 5.68 | 8.99 | 7.74 | 4.31 | 7.33 ≥ 6.93 |
| Infrastructure | 3 | 8 | 7 | 9 | 5 | 9 | 4.58 | 8.34 | 6.41 | 2.77 | 7.28 ≥ 6.93 |
| Waste disposal | 5 | 7 | 8 | 9 | 7 | 8 | 5.71 | 8.74 | 7.12 | 4.03 | 7.23 ≥ 6.93 |
| Green coverage rate | 2 | 8 | 8 | 10 | 7 | 9 | 5.61 | 8.84 | 7.56 | 3.23 | 7.23 ≥ 6.93 |
| Water resources | 5 | 7 | 7 | 10 | 6 | 8 | 5.69 | 8.58 | 7.22 | 3.12 | 7.14 ≥ 6.93 |
| Health | 4 | 8 | 8 | 10 | 6 | 9 | 5.45 | 8.73 | 7.57 | 3.28 | 7.09 ≥ 6.93 |
| Open space | 2 | 8 | 8 | 10 | 6 | 8 | 5.33 | 8.73 | 7.22 | 4.39 | 7.03 ≥ 6.93 |
| Air quality | 3 | 8 | 6 | 10 | 5 | 9 | 5.38 | 8.20 | 6.79 | 0.81 | 6.91 |
| Energy self-sufficiency rate | 2 | 8 | 6 | 10 | 4 | 9 | 4.77 | 8.29 | 6.72 | 1.52 | 6.83 |
| Population structure | 2 | 7 | 8 | 9 | 7 | 8 | 5.05 | 8.61 | 7.36 | 4.56 | 6.83 |
| Alternative energy use efficiency | 3 | 7 | 8 | 9 | 6 | 8 | 4.98 | 8.36 | 6.85 | 4.38 | 6.67 |
| Ecosystem diversity | 3 | 7 | 6 | 9 | 5 | 8 | 4.84 | 7.80 | 6.26 | 1.96 | 6.45 |
| Cultural/artistic facilities | 2 | 7 | 7 | 10 | 5 | 8 | 4.59 | 8.19 | 6.42 | 3.61 | 6.39 |
| Working population | 2 | 6 | 7 | 9 | 6 | 7 | 4.44 | 7.85 | 6.48 | 4.42 | 6.14 |
| Urban design | 3 | 6 | 7 | 10 | 5 | 9 | 4.38 | 7.82 | 6.39 | 4.45 | 6.10 |
| Noise | 2 | 6 | 5 | 9 | 4 | 8 | 3.88 | 7.09 | 5.84 | 2.20 | 5.50 |
| Geometric mean | 6.93 | Threshold | 6.93 | ||||||||
| Indicator | ||||||||||
|---|---|---|---|---|---|---|---|---|---|---|
| C1 | C2 | C3 | C4 | C5 | C6 | C7 | C8 | C9 | ||
| Indicator | C1 | 0.454 | 0.000 | 0.417 | 0.000 | 0.000 | 0.000 | 0.000 | 0.000 | 0.000 |
| C2 | 0.358 | 0.822 | 0.000 | 0.000 | 0.000 | 0.246 | 0.000 | 0.319 | 0.000 | |
| C3 | 0.000 | 0.000 | 0.350 | 0.000 | 0.000 | 0.000 | 0.000 | 0.000 | 0.000 | |
| C4 | 0.000 | 0.000 | 0.000 | 0.554 | 0.206 | 0.000 | 0.000 | 0.000 | 0.000 | |
| C5 | 0.000 | 0.000 | 0.000 | 0.000 | 0.378 | 0.000 | 0.000 | 0.000 | 0.000 | |
| C6 | 0.000 | 0.000 | 0.000 | 0.000 | 0.276 | 0.560 | 0.000 | 0.000 | 0.000 | |
| C7 | 0.000 | 0.178 | 0.000 | 0.000 | 0.140 | 0.193 | 1.000 | 0.000 | 0.000 | |
| C8 | 0.000 | 0.000 | 0.000 | 0.000 | 0.000 | 0.000 | 0.000 | 0.519 | 0.000 | |
| C9 | 0.187 | 0.000 | 0.233 | 0.446 | 0.000 | 0.000 | 0.000 | 0.162 | 1.000 | |
| Policy | S1 | 0.246 | 0.385 | 0.415 | 0.159 | 0.180 | 0.320 | 0.185 | 0.152 | 0.134 |
| S2 | 0.123 | 0.134 | 0.172 | 0.138 | 0.236 | 0.214 | 0.114 | 0.304 | 0.142 | |
| S3 | 0.204 | 0.080 | 0.059 | 0.395 | 0.080 | 0.053 | 0.057 | 0.214 | 0.116 | |
| S4 | 0.109 | 0.122 | 0.075 | 0.109 | 0.340 | 0.256 | 0.149 | 0.184 | 0.089 | |
| S5 | 0.264 | 0.222 | 0.190 | 0.133 | 0.050 | 0.084 | 0.070 | 0.074 | 0.479 | |
| S6 | 0.054 | 0.057 | 0.088 | 0.067 | 0.114 | 0.074 | 0.426 | 0.072 | 0.041 | |
| Indicator | ||||||||||
|---|---|---|---|---|---|---|---|---|---|---|
| C1 | C2 | C3 | C4 | C5 | C6 | C7 | C8 | C9 | ||
| Indicator | C1 | 0.059 | 0.059 | 0.059 | 0.059 | 0.059 | 0.059 | 0.059 | 0.059 | 0.059 |
| C2 | 0.470 | 0.470 | 0.470 | 0.470 | 0.470 | 0.470 | 0.470 | 0.470 | 0.470 | |
| C3 | 0.035 | 0.035 | 0.035 | 0.035 | 0.035 | 0.035 | 0.035 | 0.035 | 0.035 | |
| C4 | 0.068 | 0.068 | 0.068 | 0.068 | 0.068 | 0.068 | 0.068 | 0.068 | 0.068 | |
| C5 | 0.037 | 0.037 | 0.037 | 0.037 | 0.037 | 0.037 | 0.037 | 0.037 | 0.037 | |
| C6 | 0.075 | 0.075 | 0.075 | 0.075 | 0.075 | 0.075 | 0.075 | 0.075 | 0.075 | |
| C7 | 0.126 | 0.126 | 0.126 | 0.126 | 0.126 | 0.126 | 0.126 | 0.126 | 0.126 | |
| C8 | 0.048 | 0.048 | 0.048 | 0.048 | 0.048 | 0.048 | 0.048 | 0.048 | 0.048 | |
| C9 | 0.080 | 0.080 | 0.080 | 0.080 | 0.080 | 0.080 | 0.080 | 0.080 | 0.080 | |
| Policy | S1 | 0.294 | 0.294 | 0.294 | 0.294 | 0.294 | 0.294 | 0.294 | 0.294 | 0.294 |
| S2 | 0.150 | 0.150 | 0.150 | 0.150 | 0.150 | 0.150 | 0.150 | 0.150 | 0.150 | |
| S3 | 0.112 | 0.112 | 0.112 | 0.112 | 0.112 | 0.112 | 0.112 | 0.112 | 0.112 | |
| S4 | 0.140 | 0.140 | 0.140 | 0.140 | 0.140 | 0.140 | 0.140 | 0.140 | 0.140 | |
| S5 | 0.195 | 0.195 | 0.195 | 0.195 | 0.195 | 0.195 | 0.195 | 0.195 | 0.195 | |
| S6 | 0.108 | 0.108 | 0.108 | 0.108 | 0.108 | 0.108 | 0.108 | 0.108 | 0.108 | |
© 2020 by the authors. Licensee MDPI, Basel, Switzerland. This article is an open access article distributed under the terms and conditions of the Creative Commons Attribution (CC BY) license (http://creativecommons.org/licenses/by/4.0/).
Share and Cite
Ko, Y.-Y.; Chiu, Y.-H. Empirical Study of Urban Development Evaluation Indicators Based on the Urban Metabolism Concept. Sustainability 2020, 12, 7129. https://doi.org/10.3390/su12177129
Ko Y-Y, Chiu Y-H. Empirical Study of Urban Development Evaluation Indicators Based on the Urban Metabolism Concept. Sustainability. 2020; 12(17):7129. https://doi.org/10.3390/su12177129
Chicago/Turabian StyleKo, Yun-Yun, and Yin-Hao Chiu. 2020. "Empirical Study of Urban Development Evaluation Indicators Based on the Urban Metabolism Concept" Sustainability 12, no. 17: 7129. https://doi.org/10.3390/su12177129
APA StyleKo, Y.-Y., & Chiu, Y.-H. (2020). Empirical Study of Urban Development Evaluation Indicators Based on the Urban Metabolism Concept. Sustainability, 12(17), 7129. https://doi.org/10.3390/su12177129


