Article

Performance-Based Building Design of High-Rise Residential Buildings in Indonesia

by
Sulfiah Dwi Astarini
* and
Christiono Utomo
*
Department of Civil Engineering, Institut Teknologi Sepuluh Nopember, Sukolilo, Surabaya 60111, Indonesia
*
Authors to whom correspondence should be addressed.
Sustainability 2020, 12(17), 7103; https://doi.org/10.3390/su12177103
Submission received: 6 July 2020 / Revised: 20 August 2020 / Accepted: 21 August 2020 / Published: 31 August 2020

Abstract

:
The complexity of the design and completion of buildings poses a challenge for the construction industry in terms of meeting user needs. Performance-based building design (PBBD) is a design concept that describes these needs as performance requirements, designing buildings according to an iterative process of translating and evaluating the performance requirements of the buildings. PBBD is a concept that is used to produce buildings with high performance. This study aims to identify which PBBD factors are applied by architect and engineers in the planning and design of high-rise residential building in Surabaya, Indonesia. Primary data were collected by a survey using observation. A questionnaire was distributed to designers who were involved in design processes. A total of 68 respondents responded to the questionnaire. A descriptive analysis through a scatter plot was used to rank the application of PBBD. Factor analysis was used for the application of the PBBD concept. Four factors were identified: the interests of occupants, building management, process of design collaboration and risk of loss. Future research is needed to measure the success model of PBBD and to integrate PBBD into BIM (building information modeling) to allow interoperability.

1. Introduction

1.1. Background

Buildings are complex systems and are designed to meet certain criteria. However, in the complicated design process, the design often does not achieve integrated results [1], and problems arise in the implementation of construction projects [2]. Another important issue is the decision-making process for design solutions. The research presented in [3] considers a process that focuses on value. After all, the design determines whether the building provides support for the accommodated activities. The building performance requirements are translated by the designer and then processed and evaluated in terms of the achievement of the desired characteristics. Performance requirements are then integrated into a design; this is process is called performance-based building design (PBBD) [4]. The concept is not new; many countries have implemented it, and it is rapidly developing as a means for minimizing the risk of buildings in terms of natural and man-made hazards. This can be analyzed at an early design stage [4]. The key concepts of PBBD according to the work presented in [5] are: (1) performance parameters that are clear and refer to the target; (2) parameters that can be monitored in terms of acceptance of performance; (3) objective criteria; (4) if performance criteria are not achieved, it is ensured that this do not cause other problems; and (5) flexible performance parameters that they can be developed. The development of performance criteria means that they can be reused as data or information. For building owners during operation and maintenance, this is aspect becomes important in relation to the information available about the design process of the new building [6]. Meeting the needs of the building is not the designer’s only task; the designer needs to suit the needs of the user/occupants, but also to provide a mechanism so that the building can adapt to changes that will occur during its planned life cycle.
The aim of this research is to identify the factors, in consideration of the application of PBBD, that should be applied by designers in high-rise residential buildings in the city of Surabaya. The study begins with a literature review and continues with the distribution of a survey through a questionnaire distributed to 68 respondents who were experienced in designing high-rise residential buildings in Surabaya. This study is expected to support the development of PBBD research and its practice in achieving building performance in accordance with user/occupant requirements.

1.2. Geographic Context

Indonesia is located between the continents of Asia and Australia. Jakarta is the nation’s capital. Indonesia is bordered by other countries; it shares the island of Borneo with Malaysia, the island of Papua with Papua New Guinea and the island of Timor with Timor Leste. Figure 1 shows the map of Indonesia with the location of Surabaya.
Surabaya is one of the largest cities in Indonesia, with a population of 3,158,943 based on information from the statistical bureau in 2019. The dynamics of population growth will continue to increase, because Surabaya occupies a strategic position regionally and nationally that has business potential for economic development for Indonesia. This has led to increased migration to Surabaya; thus, the need for housing continues to grow. Because land prices in the city of Surabaya are relatively expensive and land availability is limited, apartments are one of the best solutions for providing vertical housing. To date, based on international Colliers data from 2018, the number of apartment units in the city of Surabaya was 31,471, with an occupancy rate of 52%. A home is a person’s basic need, and this represents a long-term investment that should be adapted to the habits of residents. Therefore, high-rise residential development is important to ensure that the needs of residents can be handled properly, and that the performance of a building is also guaranteed [7]. Occupant satisfaction is a complex matter that refers to residential units and satisfaction with the area and the environment. By conducting a post-occupancy evaluation, a designer can determine the occupants’ needs and then implement them in the next design process of residential [8].

2. Literature Review

2.1. PBBD

The definition of performance is an action or process of carrying out a task. In the construction industry, the performance of a building refers to how well the building can perform its functions [9]. This is a key concept of PBBD. The benefit of using the PBBD concept is that it provides designers with innovations in terms of producing alternative design solutions related to problems that arise in buildings. Common problems are related to safety, health [9], poor maintenance management, the deterioration of building quality and poor usability [10] by occupants. PBBD is known as an implementation of building design that focuses more on the results achieved by the building in accordance with its performance requirements, without specifying work methods and what materials should be used. However, the building as a whole must have good structural stability, which is achieved by analyzing the materials used [11].
Performance-based design is a design concept that focuses on performance targets required for the user needs [12]. Basically, performance targets can differ based on the perspectives of the relevant stakeholders. For example, the client is the owner of the building that will rent or sell the property; they are more concerned with financial aspects to increase profits and the durability of the entire facility, while only a few consider the well-being of occupants. In addition, entrepreneurs are also interested in meeting occupants’ needs at a minimal cost. The situation is different for owners as entrepreneurs who occupy the building after finishing as end users; they usually set strict performance requirements—for example, building aspects related to durability and energy. Another case could be that of a regulator that ensures the needs of end-users can be realized; additionally, the regulator could require the enhancement of environmental aspects due to the impact of buildings and that the economic stability of the building must be maintained. Furthermore, designers are focused on dealing with performance requirements whose processes involve scientific disciplines during the design process [11].
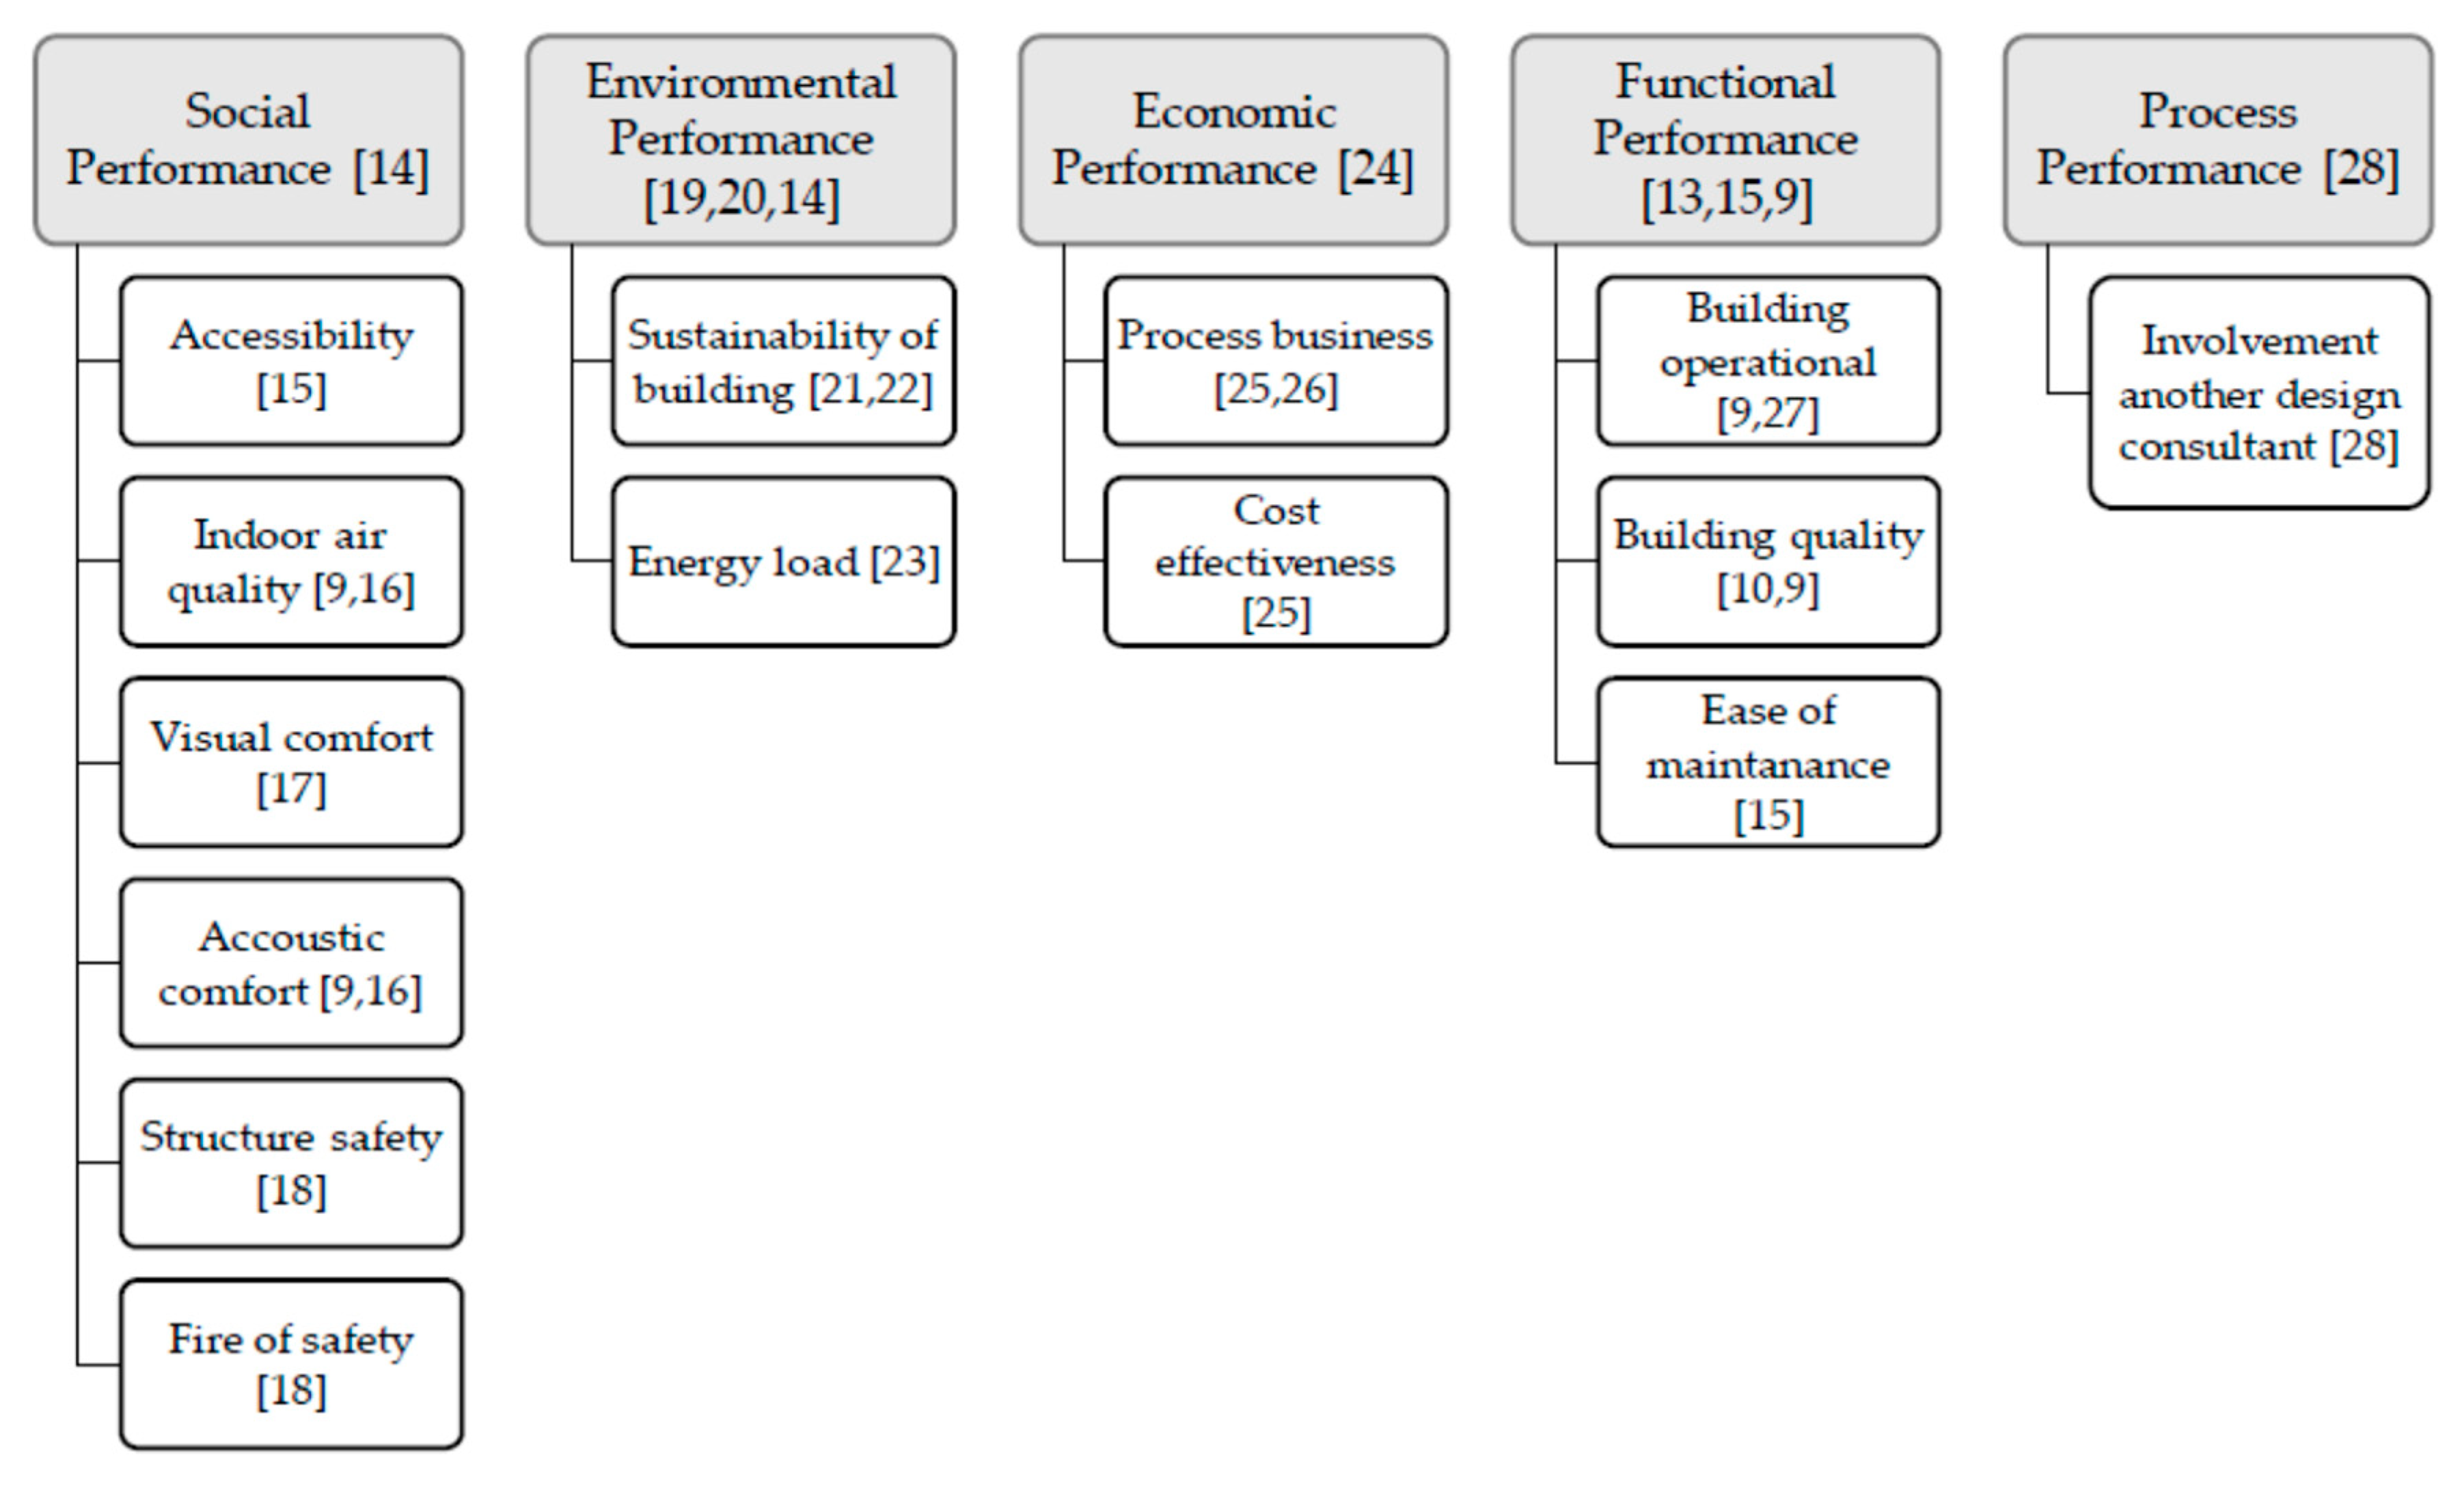
Building performance and user/occupant needs are two related matters. Gopikrishnan and Paul [13] divided the user/occupant requirements related to buildings into three factors: these are physical performance related to physical building condition, functional performance related to healthy occupants and financial performance related to capital costs or building life cycle costs (LCC). Sayın and Çelebi [4] discussed this further by adding social performance and process performance. Therefore, by setting the goals to be achieved at the beginning of the design, the step will focus the designer’s efforts on aspects of improving performance. In Figure 2, 14 performance factors are categorized into performance criteria based on literature studies.

2.1.1. Social Performance

Social performance includes criteria related to the comfort, health and safety of users/occupants and neighboring buildings [14]. In this study, social performance is divided into two categories, namely comfort–health and safety performance. Based on sub-performance, the comfort–health category consists of accessibility, indoor air quality and visual comfort. Based on sub-performance, safety consists of structural safety and fire safety.

Accessibility

The design of the building must consider accessibility, that is, the ease of reaching public facilities such as places to eat, worship facilities, car parking and sports facilities that are available in the apartment area. This refers to the proximity of buildings that can be reached on foot [15].

Indoor Air Quality (IAQ)

IAQ is an important performance aspect for the health and well-being of users/ occupants related to air contamination and indoor pollutants [9]. Diseases arising from indoor air quality are sick building syndrome and building-related illnesses (BRI) [16].

Visual Comfort

Visual comfort is related to user/occupants satisfaction with lighting conditions in the room. According to the work presented in [17], the quality of lighting and its effect on comfort levels depend on other factors, such as the distribution of luminance, glare, color rendition, daylighting, circadian effects and flicker. The new design approach—especially regarding visual comfort—can guarantee adequate lighting quality.

Acoustic Comfort

Acoustic performance has different levels of requirements based on the function of the room in the building. This is a performance aspect that is related to occupant satisfaction with various sounds in the building. Extreme sound with a long duration can cause damage to hearing [9]. Noise sources both inside and outside can affect the comfort of occupants, meaning that noise control depends on the filtering of building envelopes [16].

Structure and Fire Safety

In general, both are classified in the structural system, which is related to the safety of occupants and building property. Structural systems are classified as a critical and risk design; thus, understanding and careful design is needed. Therefore, designers usually innovate by incorporating these factors into performance-based design codes and standards [18].

2.1.2. Environmental Performance

Environmental performance in this study consists of two criteria, namely the sustainability of the building and energy load. This environmental performance arises from dissatisfaction with the environment caused by buildings [19]. Global challenges such as climate change, human population growth and limited resources [20] lead us to place emphasis on this domain. The emphasis on building quality is driving building standards such as Leadership in Energy and Environmental Design (LEED) in the US, building research establishments environmental assessment method (BREEAM) in the UK and Green Star in Australia, which are applied by clients, architects and engineers focused on optimizing building performance. Improving environmental performance can be done by using minimal resources [14].

Sustainability of the Building

Sustainable building design is currently in the initial stages of acceptance [21], but it must be ranked highly in terms of environmental, social and economic factors. Setting the specific sustainability targets before beginning the design allows the designer to improve and validate the design and reduce the impact of the building [22].

Energy Load

Energy load refers to the use of energy in building operations to provide comfort related to indoor temperatures and lighting. Energy efficiency is a concern in design, as part of achieving a sustainable building. One of the methods used to measure the energy efficiency a building is an envelope thermal transfer value (ETTV); this method can predict the energy load of the occupants with high accuracy [23].

2.1.3. Economic Performance

LCC analysis is a method that is believed to make the design process more complete. Usually, construction costs are a concern and the costs of the operation and maintenance buildings are often ignored. Maintenance costs are very important for investors when managing a building; however, LCC analysis can also guide investors in decisions making [24].

Business Process

Design is an important factor for business success; this is because the quality of the design can improve the image of the developer. In addition, if a designer is given a job opportunity, stable clients and the designer can charge for service provided at a premium price [25]. This represents a contribution to promoting design by increasing customers through products, product functionality and product quality [26].

Cost Effectiveness

The high and uncertain costs during the design process are a challenge for designers. Designing high-performance buildings requires a large initial cost, but the quality of the design is more efficient and environmentally friendly [25].

2.1.4. Functional Performance

The entire building objective is the basis for measuring the functional performance [13] that supports the activities of users/occupants in the building [15]. Functional performance includes the suitability of building functions; i.e., the use of space, physical conditions, safety and ease of service [9].

Building Operation

The operational phase of the building is now a concern in the design process. This refers to how well the building that was designed can work in practice [9]. Considering the operational phases of a building with digitalization support is useful for improving building performance, as well as providing feedback to the design stage to help eliminate performance gaps [27].

Building Quality

There is a relationship between building quality and building performance. As the research shows that the quality of planned buildings can change due to budget availability [10], changes affect the degree of increase of buildings damage; for example, changes in material quality can result in not reaching specified performance targets in the buildings. It was also highlighted in [9] that building quality is one of the key building performance requirements.

Ease of Maintenance

Maintenance is intended as an activity to prevent and reduce damage to building services. This includes residential equipment such as pipes, water pumps, elevators and swimming pools. This facility affects the quality of life of residents, so it should be well designed, installed and maintained [15].

2.1.5. Process Performance

The performance process is very important in the design of a building. This relates to activities that must be carried out to fulfill the design goals. The performance process focuses on managing resources and the creation of a design environment that supports designer and facilitates the completion of their tasks [28]. This requires the involvement of another design consultant; in this study, this is related to collaboration in the design of high-performance buildings. Because of the complexity of the design, collaborative work can improve design performance and influence the final outcome [25].
It has been explained above that the implementation of building design based on performance is developed in accordance with the needs of users/occupants in several aspects of the building. Before beginning the design, the client, the purpose of the building and the consequences of the building must be well understood. The determination of the requirements of the building can be compared after the building is finished to see the compatibility of planning with practice [29]. Basically, performance aspects are classified into a category system depending on interpretation and can be allocated to more than one category; for example, criteria related to health and comfort can be allocated to functional and social performance [14]. Some aspects of performance mentioned by researchers include spatial, location, esthetics, fire safety, noise, security, humidity, indoor air quality, durability [11,30], equipment and furniture—all of which can be optimized to improve the quality of buildings. The emphasis on building performance encourages building standards, such as WELL building standards, that are developed to integrate occupant activities in buildings with a greater emphasis on occupant health.

2.2. BIM in Performance Design

Another important aspect of PBBD is that it supports the building information modeling (BIM) approach throughout the life cycle of the building by considering aspects of design performance levels [31]. BIM is a tool, process and technology that is performed by a digital machine whose documentation can be updated regarding buildings, performance, planning and operations. The use of technology for performance-based design models can facilitate the development of ideas for producing innovative designs by incorporating performance principles into design generations [32]. Exploring performance-based design provides user-friendly parameters for using sophisticated simulation-based software, meaning that it helps designers to increase their creativity and find good solutions to problems [33]. To date, the development of BIM for sustainable design is still in its early stage. Both BIM and PBBD have a good potential relationship when integrated into building design. Bynum et al. [34] suggest that the use of BIM is most widely applied in companies for project coordination and project visualization. In addition, energy analysis, mechanical–electrical and plumbing analysis, as well as lighting analysis, are the most widely performed types of building performance analysis in a sustainable project. Designers recognize that, after understanding the potential benefits gained by using BIM, it will become an important tool for supporting sustainable design and construction practices. Of course, to achieve sustainability projects, the support of the parties and collaboration with each other must also be optimally carried out.

3. Research Methods

Before distributing the questionnaire, the census needed to be carried out in advance with the planning consulting firm incorporated in the National Association of Indonesia Consultants (INKINDO). The determination of the sample of respondents was done by using the purposive sampling technique, which is a sampling technique with special conditions [35]. In this case, in order to obtain an informative sample, the selection of respondents include experienced designers who were involved in designing high-rise residential in Surabaya, namely design engineering professionals at consulting firms.
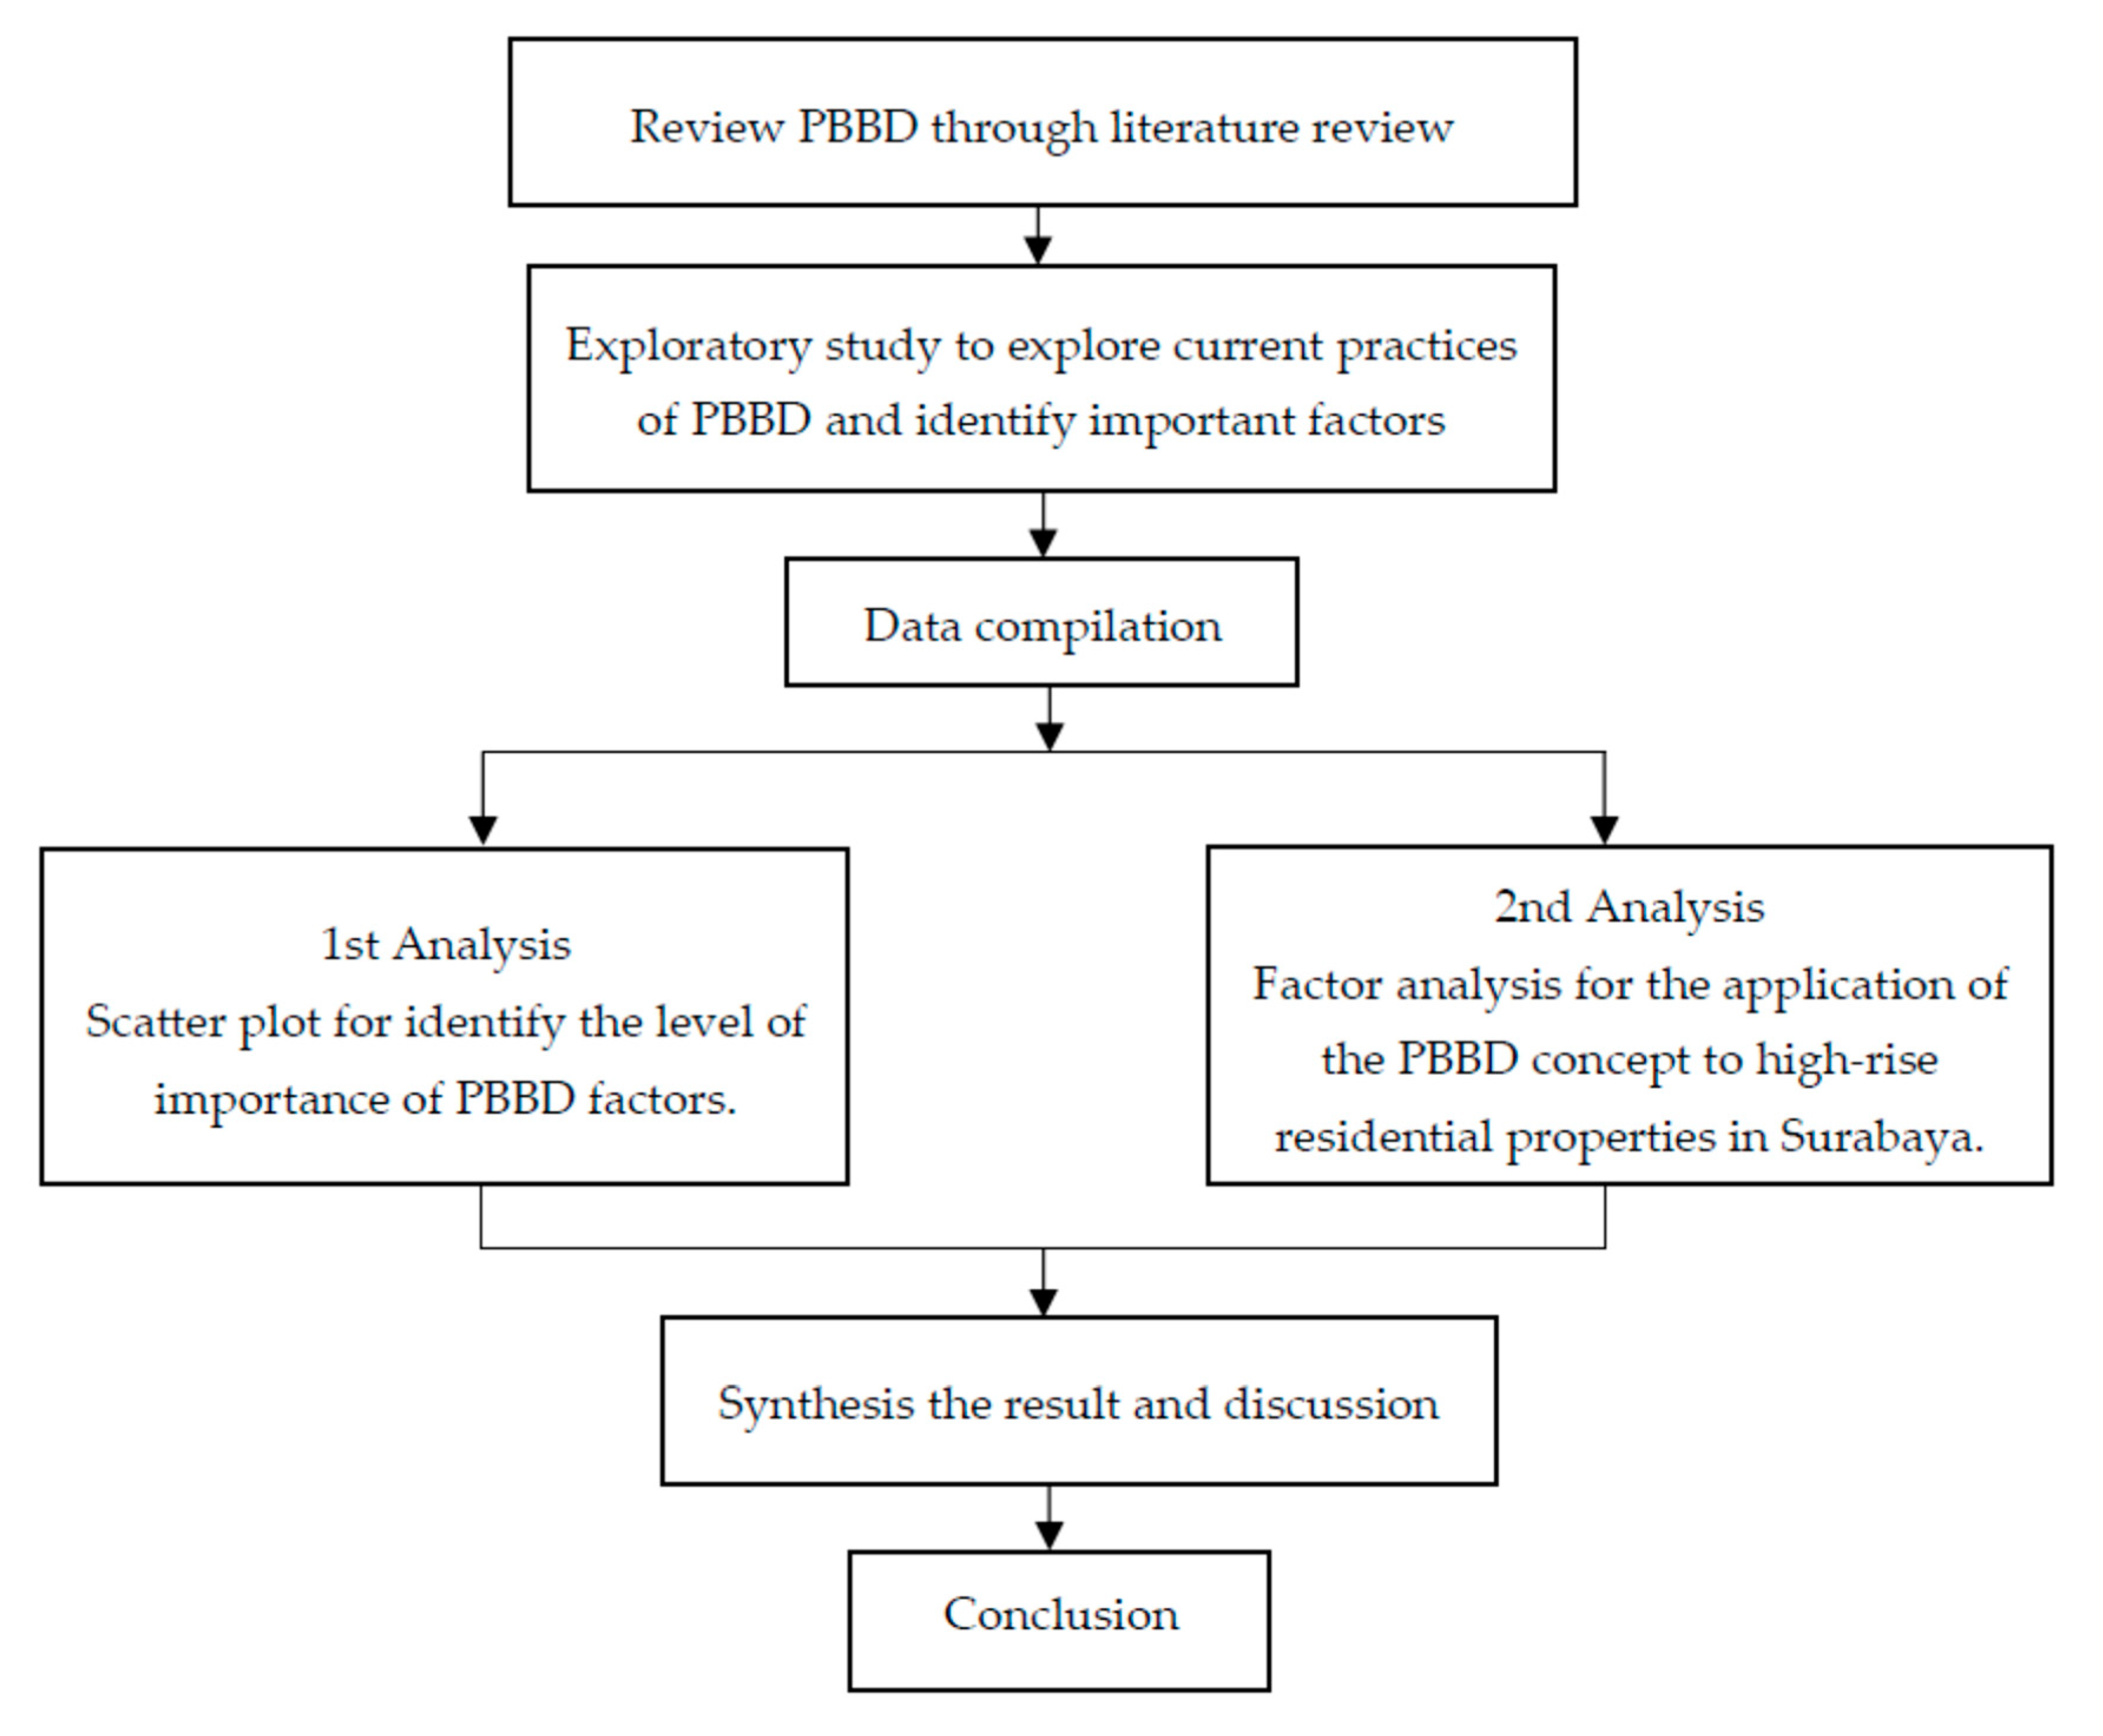
In this study, respondents were asked to fill out a questionnaire in accordance with the instructions mentioned above; that is, the respondents gave their information and completed questions about indicators of PBBD on a five-point Likert scale. The scale contained numbers from 1 to 5, each representing a level of agreement from very low to very high. The indicator was based on the performance criteria applied by respondents in their designs. Respondents were given a maximum of two weeks to fill out the questionnaire. Respondents were then contacted again to ascertain whether the questionnaire was sent back by post to the address that was included in the reply envelope. Of the 255 questionnaires distributed, 92 questionnaires were sent back, but only 68 questionnaires were declared valid based on the complete answers from the respondents and could be used. Figure 3 presented the process of research. There are two analysis method used: a scatter plot to identify the level of importance of PBBD factors and factor analysis to determine the factors in the application of PBBD.
Furthermore, factor analysis was used to validate and determine factors for the application of the concept of PBBD based on the respondents’ choice. It was intended that information from many variables could be summarized into a number of factors, meaning that it could be easily arranged, making conclusions easier to reach. The extraction method used was principal component analysis, where the main components extracted were based on the criteria for loading factors greater than 0.5.

4. Results

4.1. Profile of Respondents

General data collected from respondents covered information about their position and work experience background in their respective organizations. Table 1 presents a summary of the backgrounds of respondents.
In this study, most respondents were designs engineering professionals, accounting for of 70.5%. In general, it is known that design engineers are some of the most expert of the many professionals involved in the planning process, including architects and engineers. In total 50% of the respondents were architect consultants, their role in design is very important because they control and ensure that the design process is carried out effectively and can be accounted for in terms of planning. In developing a performance-based building design framework, members of the design team must handle performance requirements derived from the needs of users/occupants without any aspects being solved at the expense of other aspects. For example, for energy efficiency, the use of passive ventilation is designed to maximize openings, thereby affecting the performance of environmental aspects [36,37]; however, in social aspects, residents feel a lack of security related to privacy [38]. The role of architects in decision making becomes important when determining tradeoffs and assessing the actions which best fulfill the requirements. Decision making is accompanied by knowledge and the evaluation of the risks related to these aspects [39]. The aspects described as performance requirements are implemented in every discipline, the processes of which are coordinated and collaborated [11]. Furthermore, most respondents, at 52.9%, had work experience for five years, which means that the adequacy of respondents related to work experience was considered to be accurate and reliable.

4.2. Result of Distribution Data

The most influencing factors in the consideration of the application of PBBD in this study were found by considering the ranking based on the respondents’ chosen score. In Table 2, we show the distribution of data using mean and standard deviations (SD).
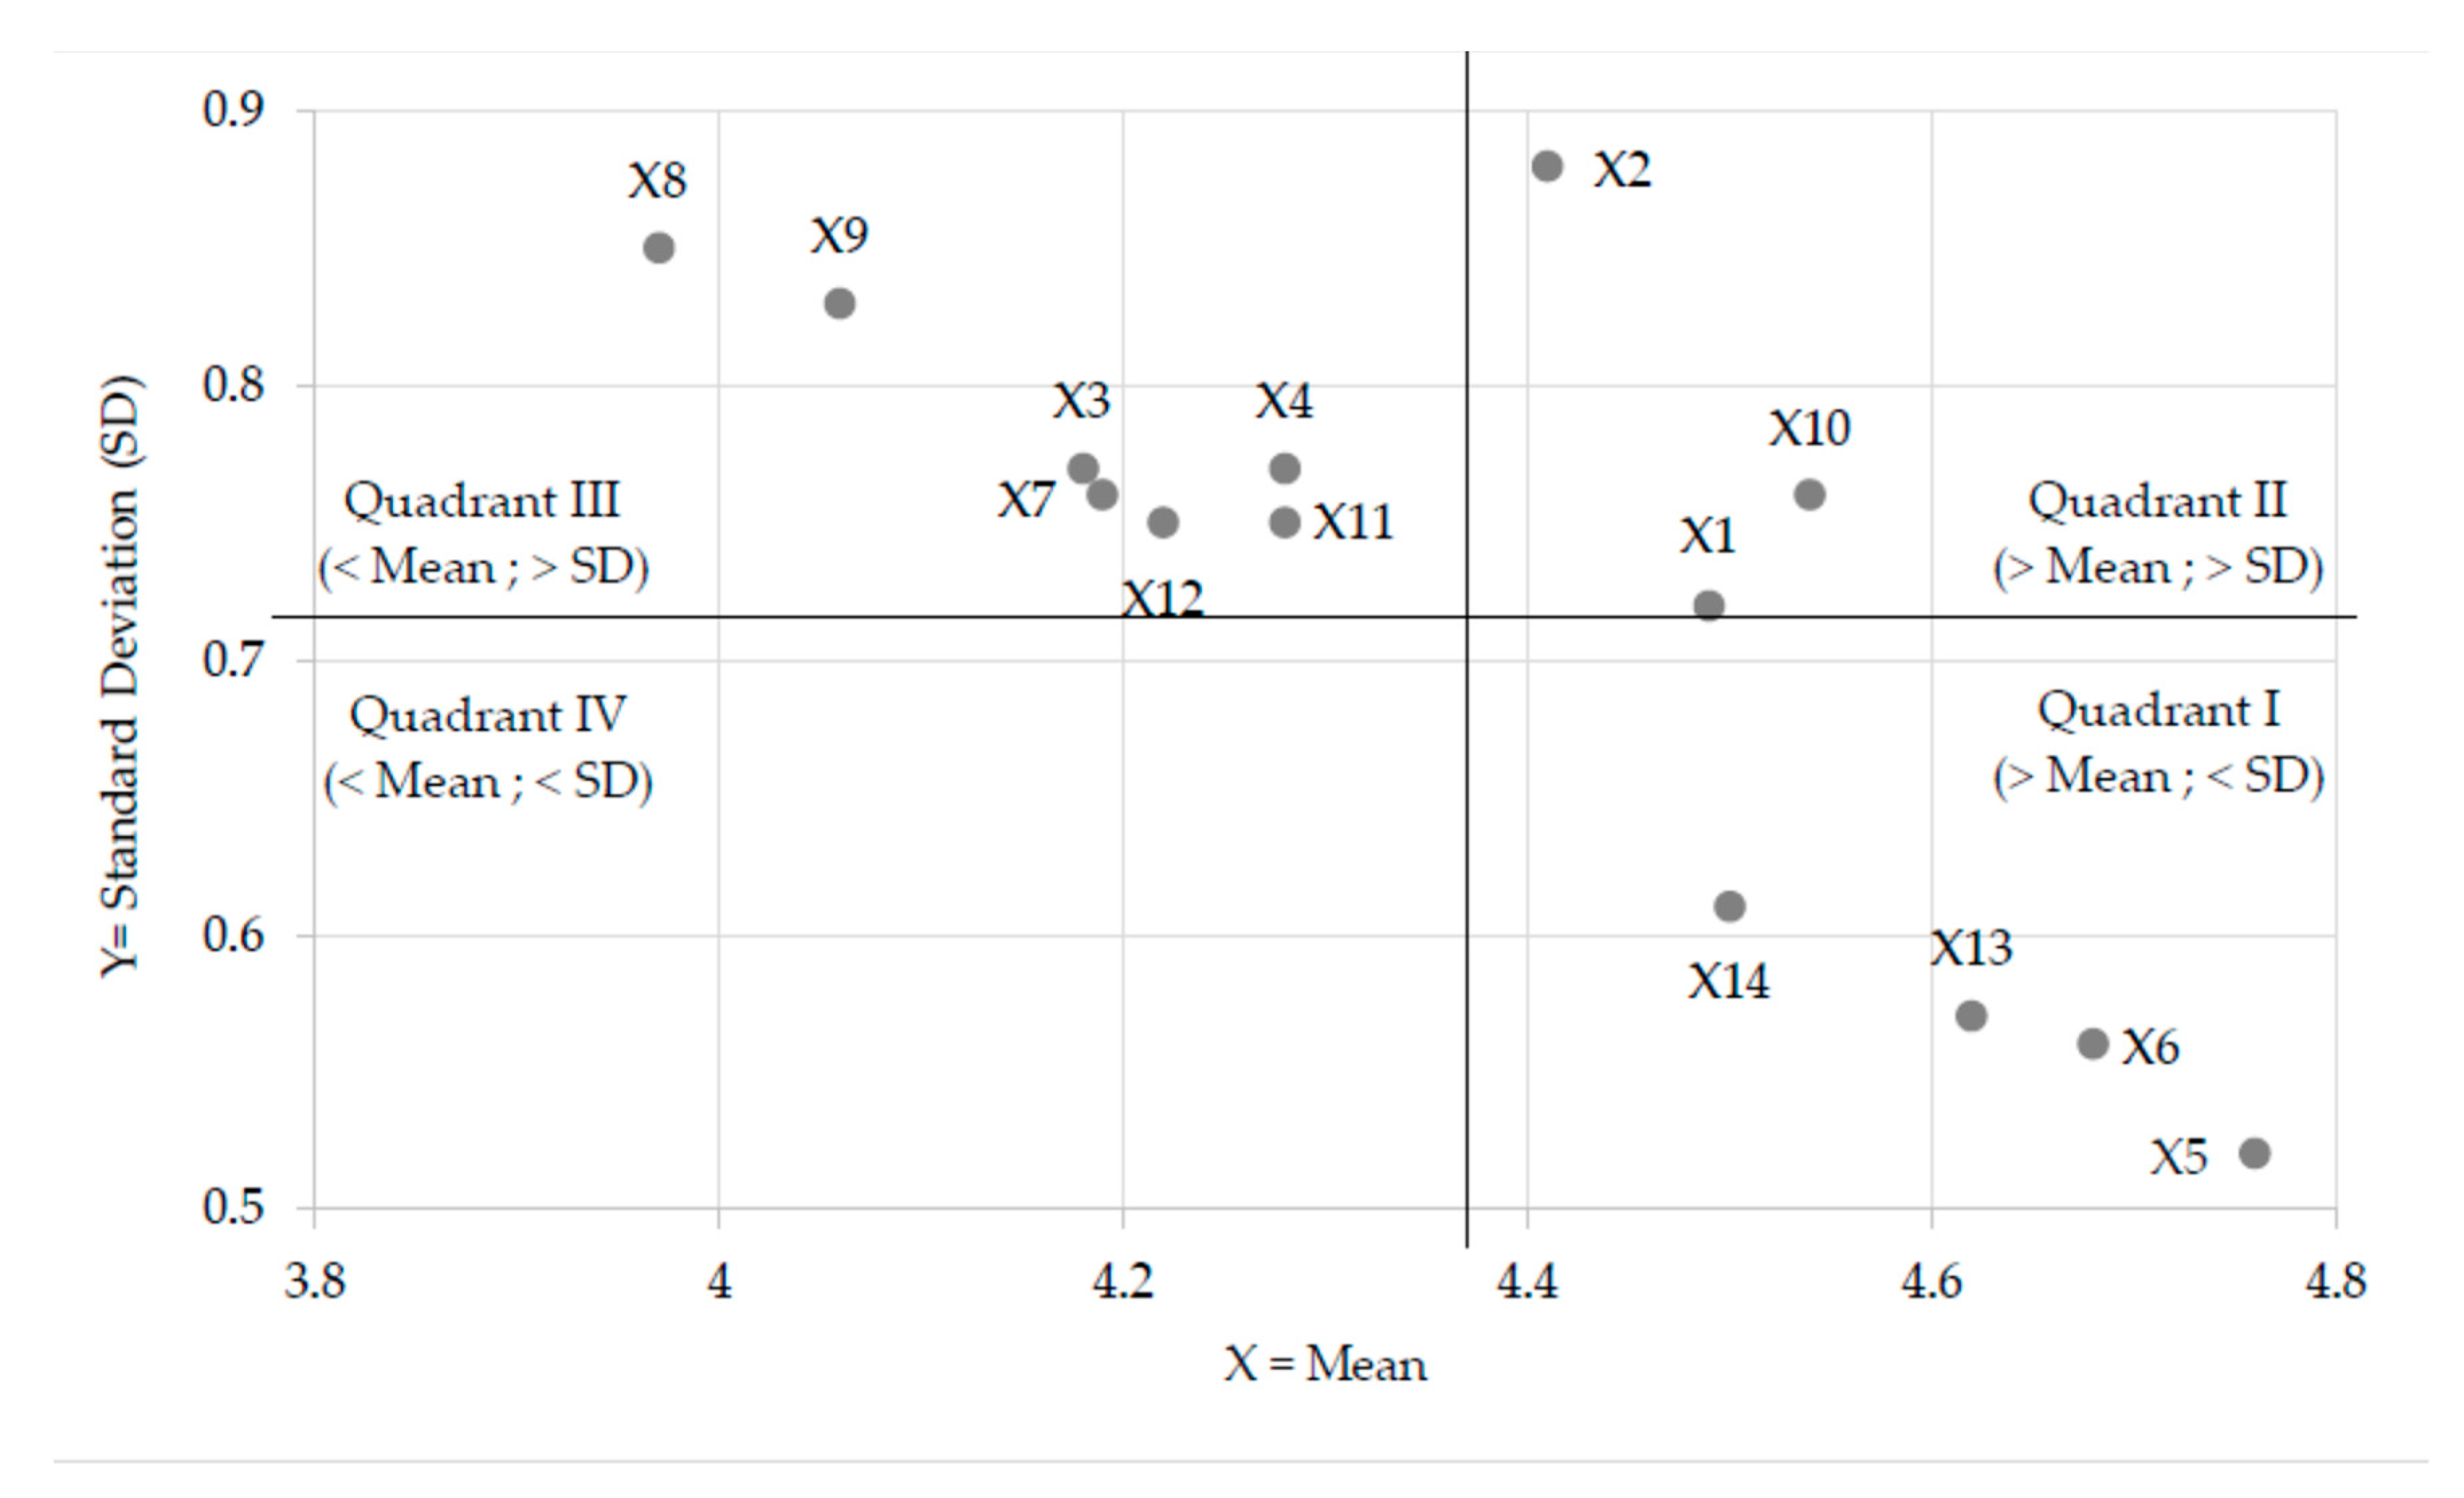
From the acquisition of the mean and SD, in the analysis presented the mean value is >3, which means that the respondents agree that all of these variables are important, although the importance of each of these variables was perceived differently for each respondent based on the SD. In order to facilitate the assessment of the order of the variables that had the most influence, mapping was done in a diagram where the X axis shows the mean and the Y axis shows the SD. Each research variable was divided into four quadrants based on the mean and standard deviation, as shown in Figure 4 and Table 3.
Based on Figure 4 and Table 3, the most influential variables in the application of PBBD can be seen to be in quadrant I. It is observed that the variables have a large mean value and a small number of standard deviations; this means that almost all respondents agree to implement PBBD, and only a few disagree. In quadrant II, which has a large mean value and standard deviation, it can be seen that although not all respondents agreed to apply the approach, more respondents agreed to apply PBBD. Furthermore, for quadrant III, with a small mean value and a large number standard deviation, it can be seen that respondents tended not to—but there were still some who did—apply the PBBD factor in their design. Based on the results of the scatter plot diagrams, the PBBD factors were found to be applied by designers in high-rise residential design in Surabaya, Indonesia. This can be seen in quadrant IV, where there are no PBBD factor attributes in the diagram. Quadrant IV has a small mean value and standard deviation, which means that all respondents agreed not to apply the approach.

4.3. Factor Analysis Results

4.3.1. Kaiser–Meyer–Olkin (KMO) and Bartlett Test

The KMO test shows the degree to which a partial correlation relates to the original correlation. If the interconnected matrix value is the identity matrix and the KMO value is <0.5, then the results indicate that the KMO value is small and shows that the correlation between pairs of variables cannot be explained by other variables [40]. The KMO index ranges from 0 to 1, where a value of 0.50 is considered suitable for factor analysis [41]. Bartlett’s test is used to determine whether the correlation matrix resembles the identity matrix, where the correlation coefficient is close to zero and must be significant at a level of 0.05 [42]. From the processing of the data, the KMO and Bartlett’s test values were obtained at 0.824 with a significance of 0.000. In this case, the KMO and Bartlett tests met the minimum criteria.

4.3.2. Measured of Sampling Adequacy (MSA)

MSA values indicate the adequacy of the sample. MSA uses a standard value of >0.5 [43], where a value of 1 means that the variable is predicted perfectly without error by other variables [40]. A value less than 0.5 is usually considered unacceptable and the variable must be reduced [40]. In this study, the MSA values for anti-image correlation tests for all diagonals were above 0.5 (between 0.659 and 0.879). MSA values are shown in Table 4.

4.3.3. Factor Extraction

The extraction method used in this study was the principal component analysis (PCA) method, as suggested in [41]. The purpose of using PCA is to simplify the components of a large variable into a number of small components [40]. The proportion of variance that is explained by each of the extracted factors is called the variable’s communality; the values range from 0.0 to 1.0. The closer the value is to 1.0, the greater the percentage explained variance of a variable [41]. However, in this study, the X12 variable only contributed a communality value of <0.5; Mvududu and Sink [41] suggest the removal of attributes that have values less than 0.5 before other factor analyses are carried out. This means that one attribute was removed, and then the remaining 13 attributes were analyzed. In Table 5 we show the overall extraction communality values of variables that met the minimum criterion >0.5.
In this study, maintaining the number of factors is a critical and difficult problem. The Kaiser Criterion is used to drop a factor with an eigenvalue below 1 [41]. The results obtained are based on the eigenvalue, four factors greater than 1 are formed. The extracted factors explain 70.76% of the variance, which means that these four factors are sufficiently typical to represent the original 13 variables.

4.3.4. Factor Rotation

Rotation is carried out so that the loading of each variable on the extracted factor can be maximized and the loading on other factors minimize [41]. For this study, Varimax orthogonal rotation was used based on recommendations [38]. The correlation between variables and factors is called factor loading [40]. The loading factor value is determined in this study as >0.5 for significance. According to the work presented in [40], a loading of 0.50 indicates that 25% of the variance is explained by the factor, where as a value of 0.70 indicates that 50% of the variance of the variable is explained by the factor. Thus, the greater the loading factor value, the more important it is in interpreting the factor matrix. The final result is the determination of each variable based on the factors formed by looking at the largest to the smallest correlation value on the formed factor.
X2, X3, X1 X4, X13 and X14 were labeled as factor 1, as “the occupants interest”; X8, X7 and X9 were clustered into factor 2 as “the building management”; X10 and X11 were aggregated into factor 3 as “the process of design collaboration”; and finally, X5 and X6 were grouped into factor 4 as “the risk of loss”.
The value of each variable was tested for reliability using Cronbach’s α. All criteria have acceptable reliability with margin values >0.7 [44], and even a value of >0.6 is still acceptable [43,44]; therefore, the formed factors can be said to be reliable and are considered to be consistent. Four components are defined as factors that apply performance-based design to high-rise residential buildings. Each factor will be further interpreted below.

5. Discussion

5.1. Occupants Interest

The importance of this factor is shown by the percentage of variance in the factor analysis in Table 4 with a value of 25.87%. This factor consists of attributes that include indoor air quality, visual comfort, accessibility, acoustic comfort, building quality and ease of maintenance [15]. The purpose of a building is to meet the expectations, needs and desires of users/occupants. Occupants become one of the significant factors and are correlated with the building performance [15,30]. The term “occupant’s interests” has become a design requirement when producing high-performance and sustainable buildings. As a central figure related to residential comfort, designed buildings must prioritize occupant requirements as the final product. This is possible by providing buildings as products which have a good quality; only then will the building earn the trust of occupants. Bragança et al. [21] also asserted that the interests of the occupants, as the final result of the use of the building, is a measure of the success of meeting design objectives. Occupant satisfaction can be evaluated using a post-occupancy evaluation [15]. This is a structured process for evaluating the performance of buildings after they are built and occupied [21] and can be approached as a tool that can inform the designer about the need to make a building that matches the occupants’ perceptions, preferences and abilities, as well as ensuring that residents receive the return on investment they expect [45]. Furthermore, this approach is also the best way of evaluating certain aspects of residents’ living environment that are related to the quality of the physical characteristics and functional characteristics of the building [8].

5.2. Building Management

This factor has a percentage variance of 17.18% in the application of performance-based building designs in high-rise residential building. This factor consists of three attributes, which include the energy load, sustainability of the building and business processes. The function of building management is to evaluate the performance of the building and provide services to occupants [46]. The interaction between buildings and occupants is usually regulated by a building management system (BMS) [9]. Buildings are the biggest energy contributor, at 80–90% in operation, while the energy contained in buildings contributes 10–20% [47]. The supply of renewable energy for residential buildings is key to building operations which aim to improving facilities. It is simultaneously a challenge for designers to ensure that their design includes energy savings during the operational period [48]. For example, the energy needed to create comfort in a room with a hot climates will require the use of a substantial electricity load, with associated environmental impacts [49]. To reduce energy use and its impact on the environment, Oti et al. [27] used BMS for analysis using BIM. This is useful as a comparison of performance that can be anticipated at the design stage and information sharing during the building life cycle. However, Ghaffarian-Hoseini et al. [50] highlighted the constraints of utilizing this knowledge-based platform, namely cost constraints and weaknesses in automation.

5.3. Process of Design Collaboration

This factor is the third factor in the application of performance-based building design with a variance of 15.03%. This factor consists of the attributes of the involvement of other design consultants and building operations. Performance-based building design requires designer collaboration in the process. Recently, collaboration has increased because of the support of design tools to help designers share information and knowledge [51] and help each other in decision making [28]. The availability of software allows multidisciplinary designers to work together in managing information related to building products. However, in a complex project, many problems are not clearly defined and are beyond the ability of each individual to understand, meaning that such problems can only be overcome by a group of people with various points of view that can provide the best solution [52]. Kalantari et al. [53] also highlights that these collaboration with facility managers who play a role in managing aspects of building operations is important. The designer must understand the role of the facility manager when applying the intended building use patterns [6]. Through good communication between designers and facility managers, the final product will be able to operate as efficiently as possible [54]. However, if the opposite happens, then only waste will result in higher operating costs, decreased building performance and low satisfaction levels for building occupants [55].

5.4. Risk of Loss

This factor is the last factor with a variance value of 12.66%. This factor includes structural safety and fire safety attributes. According to researchers, safety performance is divided into two measures based on leading indicators: hazard identification [56] and based lagging indicators—that is, mortality [57]. Hazards and mortality involve uncertainty regarding risk that occurs and is not desirable because it results in losses [5]. Residential buildings with a dense population should be designed and built in consideration of the appropriate structural characteristics. This is useful to minimize the risk of a disaster that causes death. Thompson and Bank [58] divided risk factors related to security and safety for occupants, including the risk of terrorist attacks, bomb threats, natural disasters and catastrophic fires. This affects the level of anxiety of occupants in occupying tall buildings. The three most critical building performance indicators highlighted in [59] were structural stability, fire prevention and building-related diseases. Designers who design structurally strong buildings have a good and reliable understanding of the risks to occupants’ lives and buildings and the economic losses incurred due to natural disasters. This structural element is an important element in terms of occupant safety that must be guarded and maintained. Designing performance-based buildings allows the designer to create scenarios of occupant movements during the process, with the aim of protecting occupants in the event of a disaster. Unfortunately, Mustafa [15] notes that the quality of buildings in terms of building safety and security is still at a low level among occupants.

6. Conclusions

PBBD requires a strategic focus in terms of integration in building design in accordance with the performance requirements. PBBD provides a way of thinking in the design process that is more oriented to how the users/occupants work. Based on the scatter plot analysis, respondents agreed that all PBBD factors were important. The study found four implementation factors of PBBD in high-rise residential buildings: the first factor is the occupant’s interest, consisting of indoor air quality, visual comfort, accessibility, acoustic comfort, building quality and ease of maintenance; the second factor is building management, consisting of energy load, sustainability of building and business process; the third factor is the process of design collaboration, consisting of the involvement of another design consultant and building operations; and the last factor is the risk of loss, which consists of structural safety and fire safety. Unfortunately, cost effectiveness is eliminated as an implementation factor. This result was also found in a case study in China [25]. In any event, the approach of performance-based design needs different attitudes and a different way of thinking about designing the building; this is related to what must be done in terms of the building for the owner and the user.
The limitations of this study include the introduction stage of implementing PBBD. First, the PBBD factors obtained are still in the form of basic information about building performance. There are several variables that have not been considered, including spatial layout, size of space, esthetics, etc. Second, respondents were involved only from a consultant design perspective. The result of this study not only has managerial implications for an urban residential design process that considers the needs of users; there are also important implications in formulating the development of high-rise housing policies, especially in Indonesia, through the application of PBBD. Future research is needed to measure the success of the model of PBBD and to integrate PBBD into BIM (building information modeling) interoperability.

Author Contributions

Writing—original draft preparation, S.D.A.; writing—review and editing, C.U.; supervision, C.U. All authors have read and agreed to the published version of the manuscript.

Funding

This research was funded by Research Grants “RistekBrin 2020”.

Acknowledgments

The authors are thankful to Indonesia Ristek/Brin 2020 for the grant.

Conflicts of Interest

The authors declare no conflict of interest.

References

  1. Love, P.E.; Lopez, R.; Edwards, D.J.; Goh, Y.M. Error begat error: Design error analysis and prevention in social infrastructure projects. Accid. Anal. Prev. 2012, 48, 100–110. [Google Scholar] [CrossRef] [PubMed]
  2. Vivacqua, A.S.; Garcia, A.C.B.; Gomes, A. BOO: Behavior-oriented ontology to describe participant dynamic in collocated design meetings. J. Exp. Syst. Appl. 2011, 38, 1139–1147. [Google Scholar] [CrossRef]
  3. Dell’Ovo, M.; Oppio, A. Bringing the Value-Focused Thinking Approach to Urban Development and Design Processes: The Case of Foz Do Tua Area in Portugal. 2019. Available online: http://hdl.handle.net/11311/1128290 (accessed on 29 July 2020).
  4. Sayın, S.; Çelebi, G. A practical approach to performance-based building design in architectural project. Build. Res. Inform. 2020, 48, 446–468. [Google Scholar] [CrossRef]
  5. Meacham, B.J. Accommodating innovation in building regulation: Lessons and challenges. Build. Res. Inform. 2010, 38, 686–698. [Google Scholar] [CrossRef]
  6. Jensen, P.A. Knowledge transfer from facilities management to building projects: A typology of transfer mechanisms. Arch. Eng. Des. Manag. 2012, 8, 170–179. [Google Scholar] [CrossRef] [Green Version]
  7. Paul, W.L.; Taylor, P.A. A comparison of occupant comfort and satisfaction between a green building and a conventional building. Build. Environ. 2008, 43, 1858–1870. [Google Scholar] [CrossRef]
  8. Jiboye, A.D. Post-occupancy evaluation of residential satisfaction in Lagos, Nigeria: Feedback for residential improvement. Front. Arch. Res. 2012, 1, 236–243. [Google Scholar]
  9. De Wilde, P. Building Performance Analysis, 1st ed.; John Wiley & Sons Inc.: Hoboken, NJ, USA, 2018. [Google Scholar]
  10. Arumsari, P.; Rarasati, A.D. Maintenance strategy for public-rented residential building: A case study in Jakarta, Indonesia. Built Environ. Proj. Asses. Manag. 2017, 7, 99–110. [Google Scholar] [CrossRef]
  11. Becker, R. Fundamentals of performance-based building design. Build. Simul. 2008, 1, 356–371. [Google Scholar] [CrossRef]
  12. Szigeti, F.; Davis, G. Performance Based Building: Conceptual Framework; CIB: Amsterdam, The Netherlands, 2005. [Google Scholar]
  13. Gopikrishnan, S.; Paul, V.K. User requirement related performance attributes for government residential buildings. J. Facil. Manag. 2017, 15, 409–422. [Google Scholar]
  14. Lützkendorf, T.; Speer, T.; Szigeti, F.; Davis, G.; Le Roux, P.; Kato, A.; Tsunekawa, K. A comparison of international classifications for performance requirements and building performance categories used in evaluation methods. In Proceedings of the 11th Joint BIM International Symposium, Helsinki, Finland, 13–16 June 2005; pp. 61–80. [Google Scholar]
  15. Mustafa, F.A. Performance assessment of buildings via post-occupancy evaluation: A case study of the building of the architecture and software engineering departments in Salahaddin University-Erbil, Iraq. Front. Arch. Res. 2017, 6, 412–429. [Google Scholar] [CrossRef]
  16. Sanni-Anibire, M.O.; Hassanain, M.A. Quality assessment of student housing facilities through post-occupancy evaluation. Arch. Eng. Des. Manag. 2016, 12, 367–380. [Google Scholar] [CrossRef]
  17. Leccese, F.; Salvadori, G.; Rocca, M.; Buratti, C.; Belloni, E. A method to assess lighting quality in educational rooms using analytic hierarchy process. Build. Environ. 2020, 168, 106501. [Google Scholar] [CrossRef]
  18. Armstrong, A.; Wright, C.; Ashe, B.; Nielsen, H. Enabling Innovation in Building Sustainability: Australia’s National Construction Code. Proc. Eng. 2017, 180, 320–330. [Google Scholar] [CrossRef]
  19. Gärling, T. Past and present environmental psychology. Eur. Psycriaty 2014. 19, 127–131. [CrossRef]
  20. Sörqvist, P. Grand challenges in environmental psychology. Front. Psychiatry 2016. 7, 583. [CrossRef] [Green Version]
  21. Bragança, L.; Mateus, R.; Koukkari, H. Building sustainability assessment. Sustainability 2010, 2, 2010–2023. [Google Scholar] [CrossRef] [Green Version]
  22. Russell-Smith, S.V.; Lepech, M.D.; Fruchter, R.; Meyer, Y.B. Sustainable target value design: Integrating life cycle assessment and target value design to improve building energy and environmental performance. J. Clean. Prod. 2015, 88, 43–51. [Google Scholar] [CrossRef]
  23. Karim, M.A.; Hasan, M.M.; Khan, M.I.H. A simplistic and efficient method of estimating air-conditioning load of commercial buildings in the sub-tropical climate. Energy Build. 2019, 203, 109396. [Google Scholar] [CrossRef]
  24. Fantozzi, F.; Gargari, C.; Rovai, M.; Salvadori, G. Energy upgrading of residential building stock: Use of life cycle cost analysis to assess interventions on social housing in Italy. Sustainability. 2019, 11, 1452. [Google Scholar] [CrossRef] [Green Version]
  25. Liu, X.; Xue, C.Q. Exploring the challenges to housing design quality in China: An empirical study. Habitat Int. 2016, 57, 242–249. [Google Scholar] [CrossRef]
  26. Hertenstein, J.; Platt, M.B.; Veryzer, R.W. The impact of industrial design effectiveness on corporate financial performance. Prod. Innov. Manag. 2005, 22, 3–21. [Google Scholar] [CrossRef]
  27. Oti, A.H.; Kurul, E.; Cheung, F.; Tah, J.H.M. A framework for the utilization of Building Management System data in building information models for building design and operation. Autom. Constr. 2016, 72, 195–210. [Google Scholar] [CrossRef] [Green Version]
  28. Ren, Z.; Yang, F.; Bouchlaghem, N.M.; Anumba, C.J. Multi-disciplinary collaborative building design—A comparative study between multi-agent systems and multi-disciplinary optimisation approaches. Autom. Constr. 2011, 20, 537–549. [Google Scholar] [CrossRef]
  29. Voordt, D.J.M.; Wegen, H.B.R.V. Architecture in Use: An Introduction to the Programming, Design and Evaluation of Buildings; Routledge: Oxford, UK, 2005. [Google Scholar]
  30. O’Brien, W.; Gaetani, I.; Carlucci, S.; Hoes, P.J.; Hensen, J.L. On occupant-centric building performance metrics. Build. Environ. 2017, 122, 373–385. [Google Scholar] [CrossRef]
  31. Arayici, Y.; Fernando, T.; Munoz, V.; Bassanino, M. Interoperability specification development for integrated BIM use in performance based design. Autom. Constr. 2018, 85, 167–181. [Google Scholar] [CrossRef]
  32. Oxman, R. Performance-based design: Current practices and research issues. Int. J. Arch. Comp. 2008, 6, 1–17. [Google Scholar] [CrossRef]
  33. Ercan, B.; Elias-Ozkan, S.T. Performance-based parametric design explorations: A method for generating appropriate building components. Des. Stud. 2015, 38, 33–53. [Google Scholar] [CrossRef]
  34. Bynum, P.; Issa, R.R.; Olbina, S. Building information modeling in support of sustainable design and construction. J. Const. Eng. Manag. 2013, 139, 24–34. [Google Scholar] [CrossRef]
  35. Neuman, W.L. Social Research Methods: Qualitative and Quantitative Approaches, 7th ed.; Pearson Education Limited: London, UK, 2014. [Google Scholar]
  36. Zhou, C.; Wang, Z.; Chen, Q.; Jiang, Y.; Pei, J. Design optimization and field demonstration of natural ventilation for high-rise residential buildings. Energy Build. 2014, 82, 457–465. [Google Scholar] [CrossRef]
  37. Tong, Z.; Chen, Y.; Malkawi, A.; Liu, Z.; Freeman, R.B. Energy saving potential of natural ventilation in China: The impact of ambient air pollution. Appl. Energy 2016, 179, 660–668. [Google Scholar] [CrossRef] [Green Version]
  38. Indraganti, M. Adaptive use of natural ventilation for thermal comfort in Indian apartments. Build. Environ. 2010, 45, 1490–1507. [Google Scholar] [CrossRef]
  39. Sdino, L.; Rosasco, P.; Torrieri, F.; Oppio, A. (Eds.) A Mass Appraisal Model Based on Multi-Criteria Evaluation: An Application to the Property Portfolio of the Bank of Italy. In International Symposium on New Metropolitan Perspectives; Springer: Cham, Switzerland, 2018; pp. 507–516. [Google Scholar]
  40. Hair, J.F., Jr.; William, C.B.; Babin, B.J.; Rolph, E.A. Multivariate Data Analysis; Pearson Education Limited: New York, NY, USA, 2013. [Google Scholar]
  41. Mvududu, N.H.; Sink, C.A. Factor Analysis in Counseling Research and Practice. Couns. Outcome Res. Eval. 2013, 4, 75–98. [Google Scholar] [CrossRef]
  42. Tabachnick, B.G.; Fidell, L.S. Using Multivariate Statistics, 7th ed.; Pearson: Boston, MA, USA, 2012. [Google Scholar]
  43. Wen, C.H.; Lin, W.W. Customer segmentation of freight forwarders and impacts on the competitive positioning of ocean carriers in the Taiwan–southern China trade lane. Mar. Pol. Manag. 2016, 43, 420–435. [Google Scholar] [CrossRef]
  44. Sekaran, U.; Bougie, R. Research Methods for Business: A Skill Building Approach; John Wiley & Sons Inc.: Hoboken, NJ, USA, 2016. [Google Scholar]
  45. Soetanto, R.; Brown, C.; Gorgolewski, M. Assessing occupant satisfaction and energy behaviours in Toronto’s LEED gold high-rise residential buildings. Int. J. Energy Sect. Manag. 2014, 8, 492–505. [Google Scholar]
  46. Hui, E.Y. Key success factors of building management in large and dense residential estates. Facilities 2005, 23, 47–62. [Google Scholar] [CrossRef]
  47. Ramesh, T.; Prakash, R.; Shukla, K.K. Life cycle energy analysis of buildings: An overview. Energy Build. 2010, 42, 1592–1600. [Google Scholar] [CrossRef]
  48. Menezes, A.C.; Cripps, A.; Bouchlaghem, D.; Buswell, R. Predicted vs. actual energy performance of non-domestic buildings: Using post-occupancy evaluation data to reduce the performance gap. Appl. Energy 2012, 97, 355–364. [Google Scholar] [CrossRef] [Green Version]
  49. Cheung, C.K.; Fuller, R.J.; Luther, M.B. Energy-efficient envelope design for high-rise apartments. Energy Build. 2005, 37, 37–48. [Google Scholar] [CrossRef] [Green Version]
  50. GhaffarianHoseini, A.; Zhang, T.; Nwadigo, O.; Naismith, N.; Tookey, J.; Raahemifar, K. Application of nD BIM Integrated Knowledge-based Building Management System (BIM-IKBMS) for inspecting post-construction energy efficiency. Renew. Sust. Energy Rev. 2017, 72, 935–949. [Google Scholar] [CrossRef] [Green Version]
  51. Rezgui, Y.; Boddy, S.; Wetherill, M.; Cooper, G. Past, present and future of information and knowledge sharing in the construction industry: Towards semantic service-based e-construction? Comp. Aid. Des. 2011, 43, 502–515. [Google Scholar] [CrossRef] [Green Version]
  52. Sebastian, R. Evaluating a proposed approach for managing collaborative design in the conceptual design phase. Arch. Eng. Des. Manag. 2006, 2, 216–224. [Google Scholar] [CrossRef]
  53. Kalantari, S.; Shepley, M.M.; Rybkowski, Z.K.; Bryant, J. Designing for operational efficiency: Facility managers’ perspectives on how their knowledge can be better incorporated during design. Arch. Eng. Des. Manag. 2017, 13, 457–478. [Google Scholar] [CrossRef]
  54. Erdener, E. Linking programming and design with facilities management. J. Perf. Constr. Facil. 2003, 17, 4–8. [Google Scholar] [CrossRef]
  55. Meng, X. Involvement of facilities management specialists in building design: United Kingdom experience. J. Perf. Constr. Facil. 2013, 27, 500–507. [Google Scholar] [CrossRef]
  56. Patel, D.A.; Jha, K.N. Structural equation modeling for relationship-based determinants of safety performance in construction projects. J. Manag. Eng. 2016, 32. [Google Scholar] [CrossRef]
  57. Hinze, J.; Thurman, S.; Wehle, A. Leading indicators of construction safety performance. Saf. Sci. 2013, 51, 23–28. [Google Scholar] [CrossRef]
  58. Thompson, B.P.; Bank, L.C. Risk perception in performance-based building design and applications to terrorism-resistant design. J. Perf. Constr. Facil. 2007, 21, 61–69. [Google Scholar] [CrossRef]
  59. Khalil, N.; Kamaruzzaman, S.N.; Baharum, M.R. Ranking the indicators of building performance and the users’ risk via Analytical Hierarchy Process (AHP): Case of Malaysia. Ecol. Indic. 2016, 71, 567–576. [Google Scholar] [CrossRef]
Figure 1. Map of Surabaya location.
Sustainability 12 07103 g001
Figure 2. Concepts of variables.
Sustainability 12 07103 g002
Figure 3. Flowchart of research methods. PBBD—Performance-based building design.
Sustainability 12 07103 g003
Figure 4. Scatter plot analysis of factors in the implementation of PBBD.
Sustainability 12 07103 g004
Table 1. Background of respondents.
ItemsSub-itemsN%
PositionProject manager
Project officer
Design manager
Design engineer
Others
5
2
3
48
10
7.3
2.9
4.4
70.5
14.7
Architectural design consultant3450.0
Role in design processBuilding structural consultant3044.1
Construction management consultant45.8
Working experience<1 years
5 years
6–10 years
13
36
19
19.1
52.9
27.9
Total 100
Table 2. Distribution data of variables.
CodeVariableMeanStandard Deviation
X1Accessibility4.490.72
X2Indoor air quality4.410.88
X3Visual comfort4.180.77
X4Acoustic comfort4.280.77
X5Structural safety4.760.52
X6Fire safety4.680.56
X7Sustainability of building4.190.76
X8Energy load3.970.85
X9Business process4.060.83
X10Involvement of another design consultant4.540.76
X11Building operation4.280.75
X12Cost effectiveness4.220.75
X13Building quality4.620.57
X14Ease of maintenance4.500.61
Table 3. Most important variables.
CodeVariableQuadrantRank
X5Structural safetyI1
X6Fire safetyI2
X13Building qualityI3
X10Involvement of another design consultantI4
X14Ease of maintenanceII5
X1AccessibilityII6
X2Indoor air qualityII7
X4Acoustic comfortIII8
X11Building operationIII9
X12Cost effectivenessIII10
X7Sustainability of buildingIII11
X3Visual comfortIII12
X9Business processIII13
X8Energy loadIII14
Table 4. Anti-image matrices.
X1X2X3X4X5X6X7X8X9X10X11X13X14
Anti−image correlationX10.840 a−0.350−0.3100.065−0.199−0.187−0.1710.148−0.120−0.0310.0660.081−0.216
X2−0.3500.879 a−0.077−0.2280.007−0.0520.125−0.1330.0480.103−0.046−0.101−0.233
X3−0.310−0.0770.772 a−0.3460.1890.1810.0670.132−0.110−0.241−0.048−0.3200.127
X40.065−0.228−0.3460.868 a−0.061−0.286−0.222−0.0940.0010.156−0.003−0.094−0.118
X5−0.1990.0070.189−0.0610.706 a−0.187−0.186−0.0890.215−0.100−0.086−0.2100.211
X6−0.187−0.0520.181−0.286−0.1870.819 a0.047−0.1310.113−0.143−0.0180.0230.028
X7−0.1710.1250.067−0.222−0.1860.0470.849 a−0.341−0.173−0.112−0.0160.096−0.192
X80.148−0.1330.132−0.094−0.089−0.131−0.3410.794 a−0.2800.224−0.1850.009−0.095
X9−0.1200.048−0.1100.0010.2150.113−0.173−0.2800.846 a−0.059−0.217−0.0890.004
X10−0.0310.103−0.2410.156−0.100−0.143−0.1120.224−0.0590.659 a−0.502−0.0550.031
X110.066−0.046−0.048−0.003−0.086−0.018−0.016−0.185−0.217−0.5020.793 a−0.0380.032
X130.081−0.101−0.320−0.094−0.2100.0230.0960.009−0.089−0.055−0.0380.870 a−0.223
X14−0.216−0.2330.127−0.1180.2110.028−0.192−0.0950.0040.0310.032−0.2230.866 a
a. measures of sampling adequacy (MSA).
Table 5. Factor analysis result.
CodeVariableCommunalitiesVarimax-Rotated Loading Factor
1234
X2Indoor air quality0.7160.785
X3Visual comfort0.7760.746
X1Accessibility0.6640.734
X4Acoustic comfort0.6890.692
X13Building quality0.5740.683
X14Ease of maintenance0.6460.663
X8Energy load0.7890.850
X7Sustainability of building0.6960.722
X9Business process0.7370.647
X10Involvement of another design consultant0.7970.871
X11Building operation0.7490.776
X5Structural safety0.7240.822
X6Fire Safety0.6420.732
Eigenvalues5.1321.5521.3381.178
% variance25.87117.18915.03912.669
Cum % variance25.87143.06058.09970.768
Cronbach α0.8580.7480.7440.671