Article

Experimental Investigation of the Potential of a New Fabric-Based Evaporative Cooling Pad

by
Eloy Velasco-Gómez
,
Ana Tejero-González
*,
Javier Jorge-Rico
and
F. Javier Rey-Martínez
Research Group in Thermal Engineering, Department of Energy and Fluidmechanics, School of Engineering, Universidad de Valladolid, 47011 Valladolid, Spain
*
Author to whom correspondence should be addressed.
Sustainability 2020, 12(17), 7070; https://doi.org/10.3390/su12177070
Submission received: 6 August 2020 / Revised: 21 August 2020 / Accepted: 27 August 2020 / Published: 30 August 2020

Abstract

:
Direct evaporative coolers are energy-efficient, economic solutions to supplying cooling demand for space conditioning. Since their potential strongly depends on air hygrothermal conditions, they are traditionally used in dry and hot climates, though they can be used in many applications and climates. This work proposes a new direct evaporative cooling system with a fabric-based pad. Its design enables maximum wetted surface with minimum pressure drop. Its performance has been experimentally characterized in terms of saturation efficiency, air humidification, pressure drop, and level of particles, based on a full factorial Design of Experiments. Factors studied are air dry bulb temperature, specific humidity, and airflow. Saturation efficiencies obtained for a 25 cm pad are above the values achieved by other alternative evaporative cooling (EC) pads proposed in the literature, with lower pressure drops.

1. Introduction

Evaporative cooling is a phenomenon that occurs in nature when water comes into contact with unsaturated air, hence its occurrence near water bodies like waterfalls or the sea, after a storm, or due to sweat evaporation from skin. Its applicability for human comfort dates back to ancient Egypt [1]. The consequent simplicity of evaporative cooling systems makes them cost-effective, energy-efficient, and environmentally friendly solutions for a wide range applications and climates [2]. They permit achieving appropriate indoor conditions in otherwise non-conditioned indoor spaces such as greenhouses, storehouses, factories, and farms, where ventilation during the cooling season is insufficient, and mechanical cooling is unfeasible. However, their use for indoor comfort is also crucial. On the path to Net Zero Energy Buildings, they can either substitute, improve the performance of, or complement conventional mechanical compression cooling systems.
Direct Evaporative Coolers (DEC) enable air cooling as it passes through wetted pads or sprayed water. As water evaporates in air, heat and mass transfer transforms the sensible heat of air into latent heat in an adiabatic process, lowering the air Dry Bulb Temperature (DBT) of treated air towards its Wet Bulb Temperature (WBT), while its specific humidity increases. Materials of commercialized pads range from aspen wood or absorbent plastic foams to “rigid-media” pads made of corrugated materials including cellulose, plastic, and fiberglass [3].
Cellulose commercialized pads are extensively studied in the literature, both experimentally and theoretically, through mathematical models. Sheng & Nanna [4] characterize the saturation efficiency and humidity increase in the treated air of a cellulose corrugated panel in terms of inlet air DBT, air velocity and pad thickness. Besides saturation efficiency and humidification increase, Malli et al. [5], Franco et al. [6] and Warke & Deshmukh [7] characterize the pressure drop generated.
Barzegar et al. [8] compare the performance of cellulose pads from two different manufacturers, though only in terms of air velocity. Al-Badri & Al-Waaly [9] compare the saturation efficiency of three different cellulose pads in terms of inlet air DTB, air WBT and water temperature and ratio. He et al. [10] compare the performance of a Munters CELdek® cellulose pad to a PVC fibre pad, while Franco et al. [11] compares a cellulose pad to a plastic mesh-based pad. The latter also approaches the study of heat and mass coefficients, and so do Al-Badri and AlWaaly [9]. To the knowledge of the authors, only He et al. [10] provide detailed observations on water entrainment.
There exists wide research on the use of alternative materials for DEC media. Most works focus on pads made of locally available vegetable fibres such as coconut [12,13,14,15,16], jute [12,17,18], luffa [17,19] and palash [13,14], as well as wood fibres [17,20].
Some research also considers the use of porous stones [20,21] and ceramics [22] as DEC media. More unusual EC medias are made of bulk charcoal [18,23], sliced wood [24], perforated bamboo [25], composite material with rice byproducts [26] or shredded latex foam, palm fruit fibre, etc. [18].
However, existing literature barely approaches the use of textiles for evaporative cooling, despite the advantage of their wicking ability, as studied by Xu et al. [27] for indirect evaporative cooling systems. They analysed six different fabrics compared to Kraft paper, with favourable results, but nonetheless observed that the use of fabrics may cause mechanical problems, as wet surfaces distort if adhered to a support sheet.
Liao et al. [28] studied nonwoven fabric and coir as alternatives to EC pads, providing correlations for saturation efficiency and pressure drop in terms of pad thickness. Alam et al. [12] also studied coir, together with sackcloth, with the former performing better due to a maximum temperature drop of 4 °C. Both studies highlight the energy efficiency and low cost of the solution proposed. Liao and Chiu [29] experimentally studied a new pad made of coarse and fine fabric PVC sponge mesh, obtaining efficiencies of up to 86.32% and 85.5% for 15 cm thickness pads, respectively.
Fabrics have occasionally been considered in combination with passive cooling solutions for buildings. Ghosal et al. [30] studied the cooling effect of a wetted shade fabric installed in a green house, achieving up to 6 °C temperature drop. Esparza et al. [31] designed a fabric-based evaporative cooling system with a 3 mm thick wool and polyester membrane as an alternative to water roof ponds. Their solution achieved the lowest temperatures under the three climate conditions studied: hot sub-humid, warm sub-humid and hot humid.
Together with capillary diffusion and wicking ability, the main assets of the use of fabrics relies on their low cost, it being possible to reuse discarded clothes. Microbial growth is the main concern shared by all evaporative cooling equipment but specially noticed for pads based on organic materials, both conventional and alternative. Proper maintenance based on bleedoff, makeup water quality and complete emptying of the sump during non-operating periods would avoid this issue [32,33]. As usually found in commercial systems, fabric-based EC can also include ozonisers or UV lamps for pathogen inactivation in working water. Moreover, simple pad configurations made with fabrics can be easily disassembled and washed, facilitating the maintenance of the media.
Organic fibres may also be disregarded due to concerns about system durability. For instance, Jute, Luffa, Comm and Palm show cooling efficiency degradation with time. Deterioration is mainly due to bio-degradation, and among the previous materials, jute fibres show the worst performance [17]. Nonetheless, replacement of media in non-elaborated pads made of organic, widely available materials would be cost-effective.
The aim of this work is to design, build and experimentally characterize a new Evaporative Cooling Pad made of cotton fabric as an alternative to conventional pads, which is different from the proposals already studied in the literature. Saturation efficiency, air humidification, pressure drop and particles are presented and contrasted with results obtained in existing research.

2. Materials and Methods

This section describes the design, construction and experimental characterization of the target evaporative cooling system.

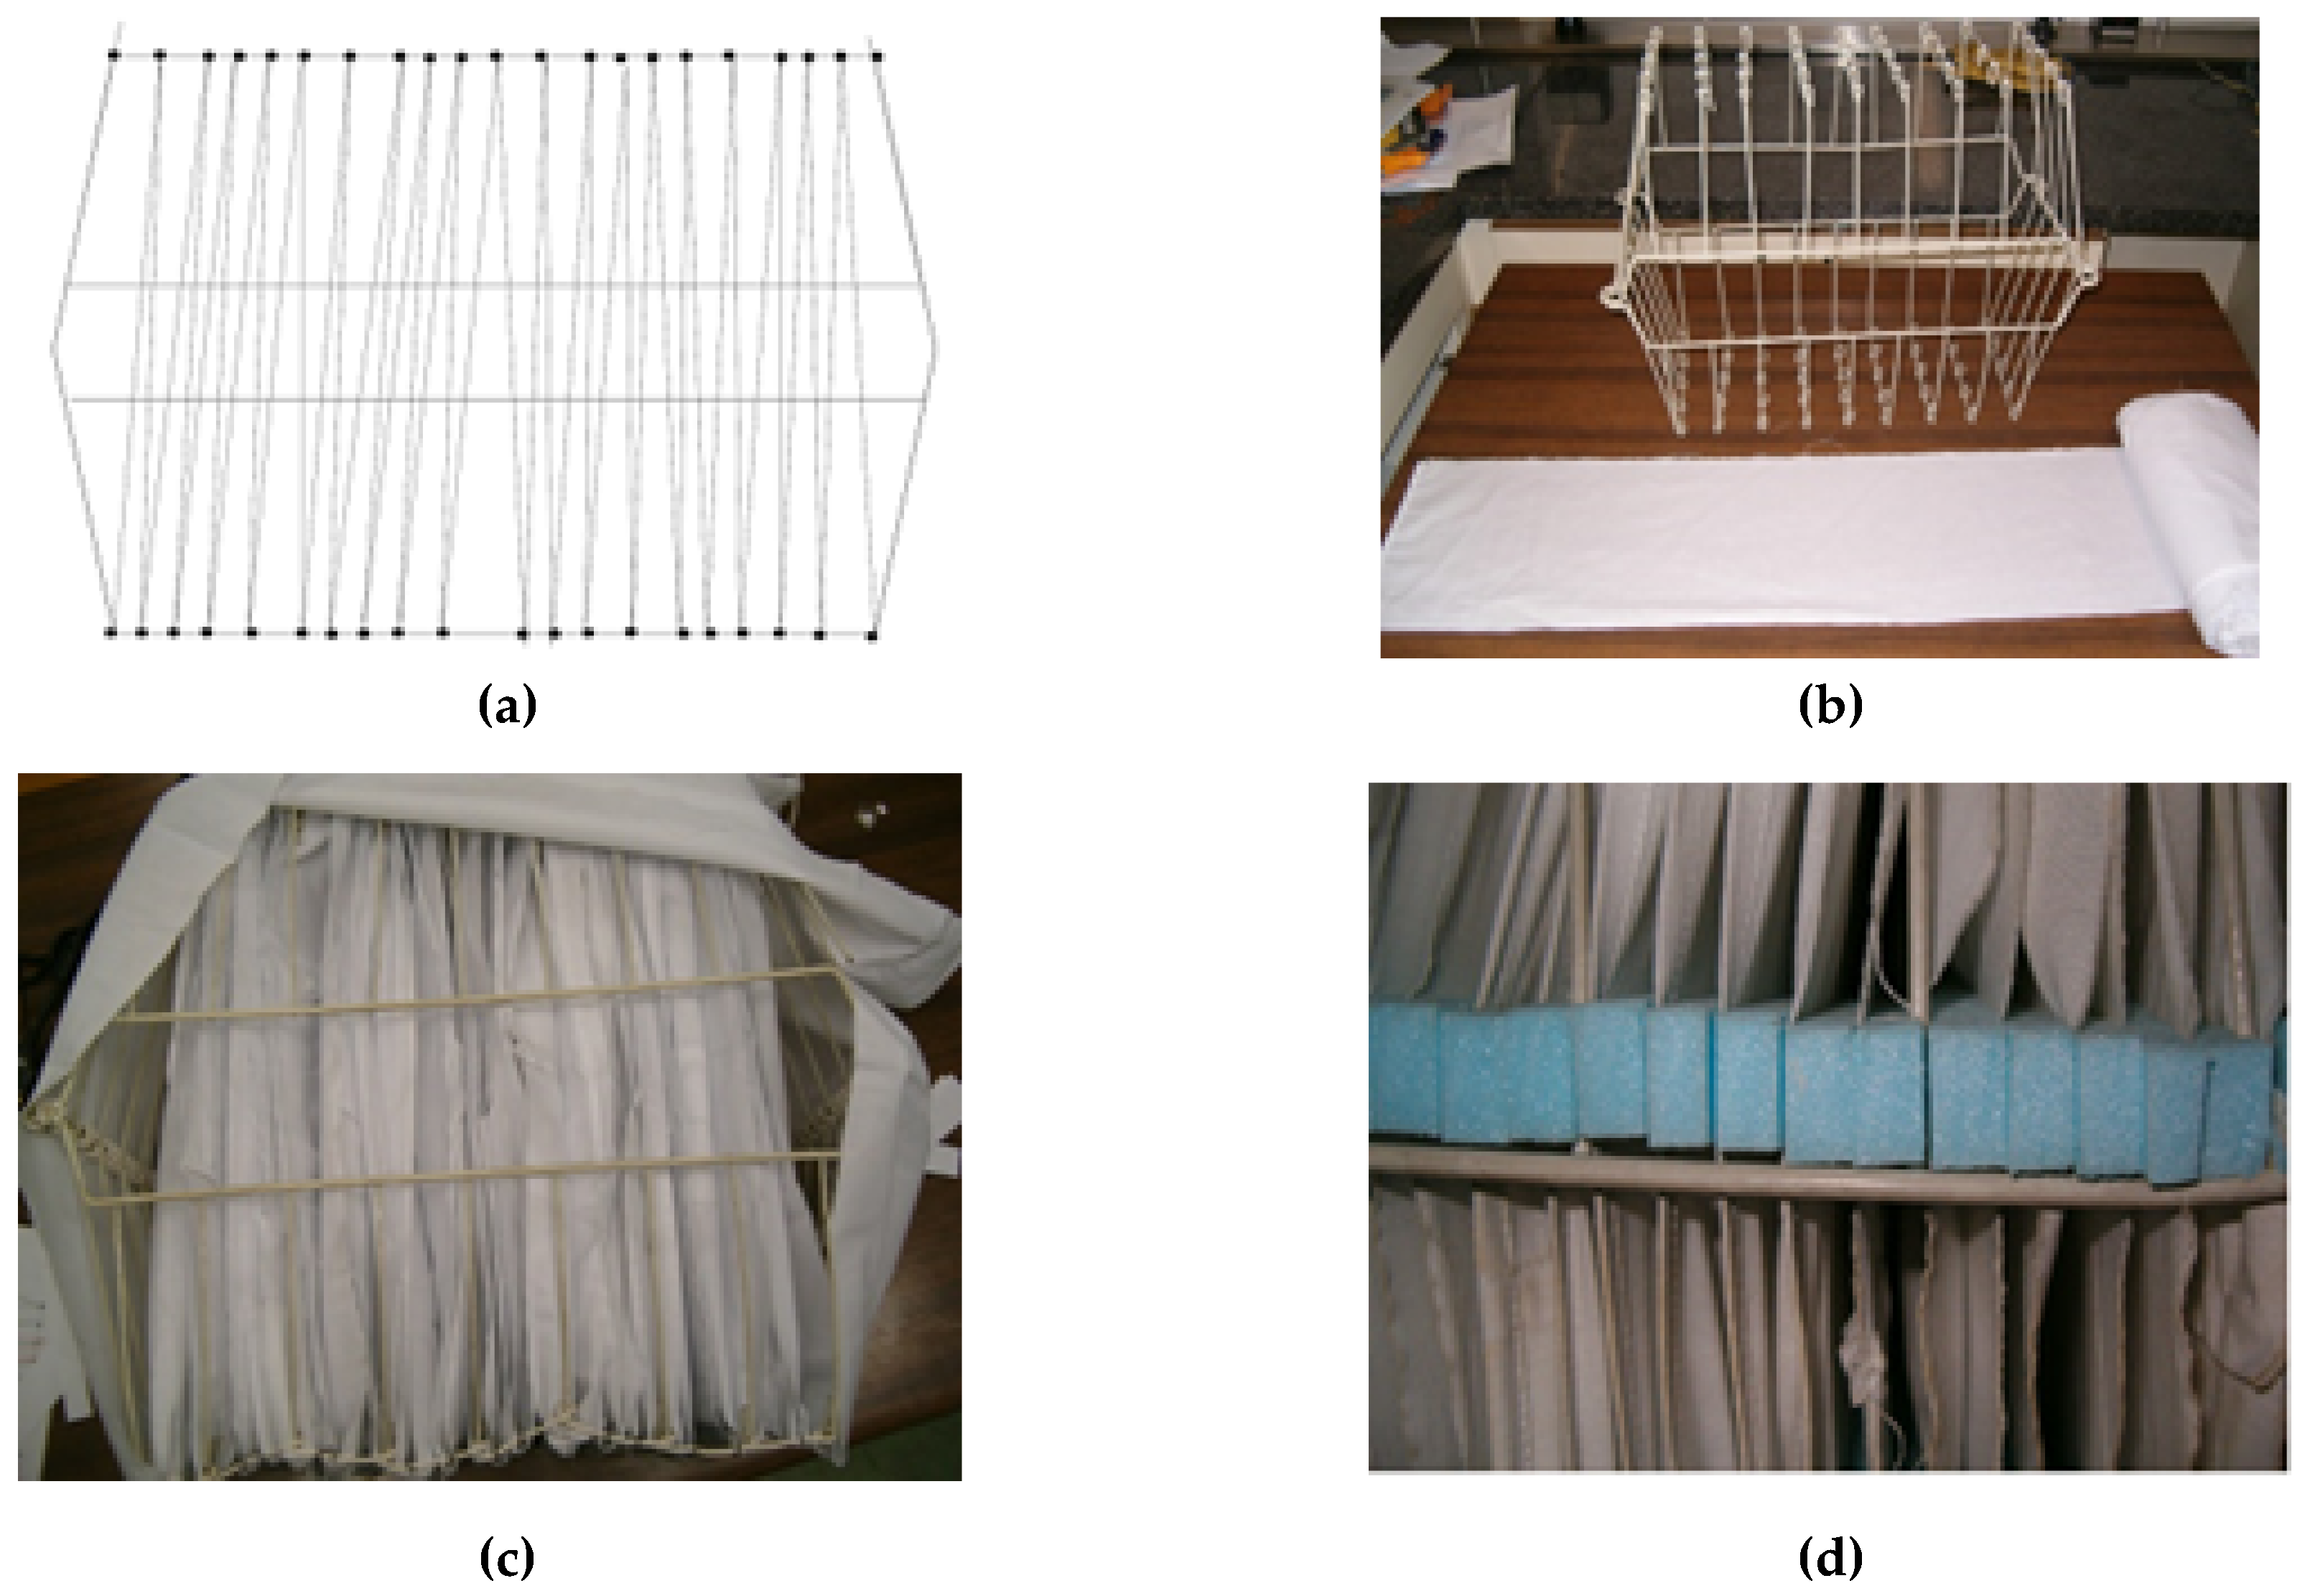
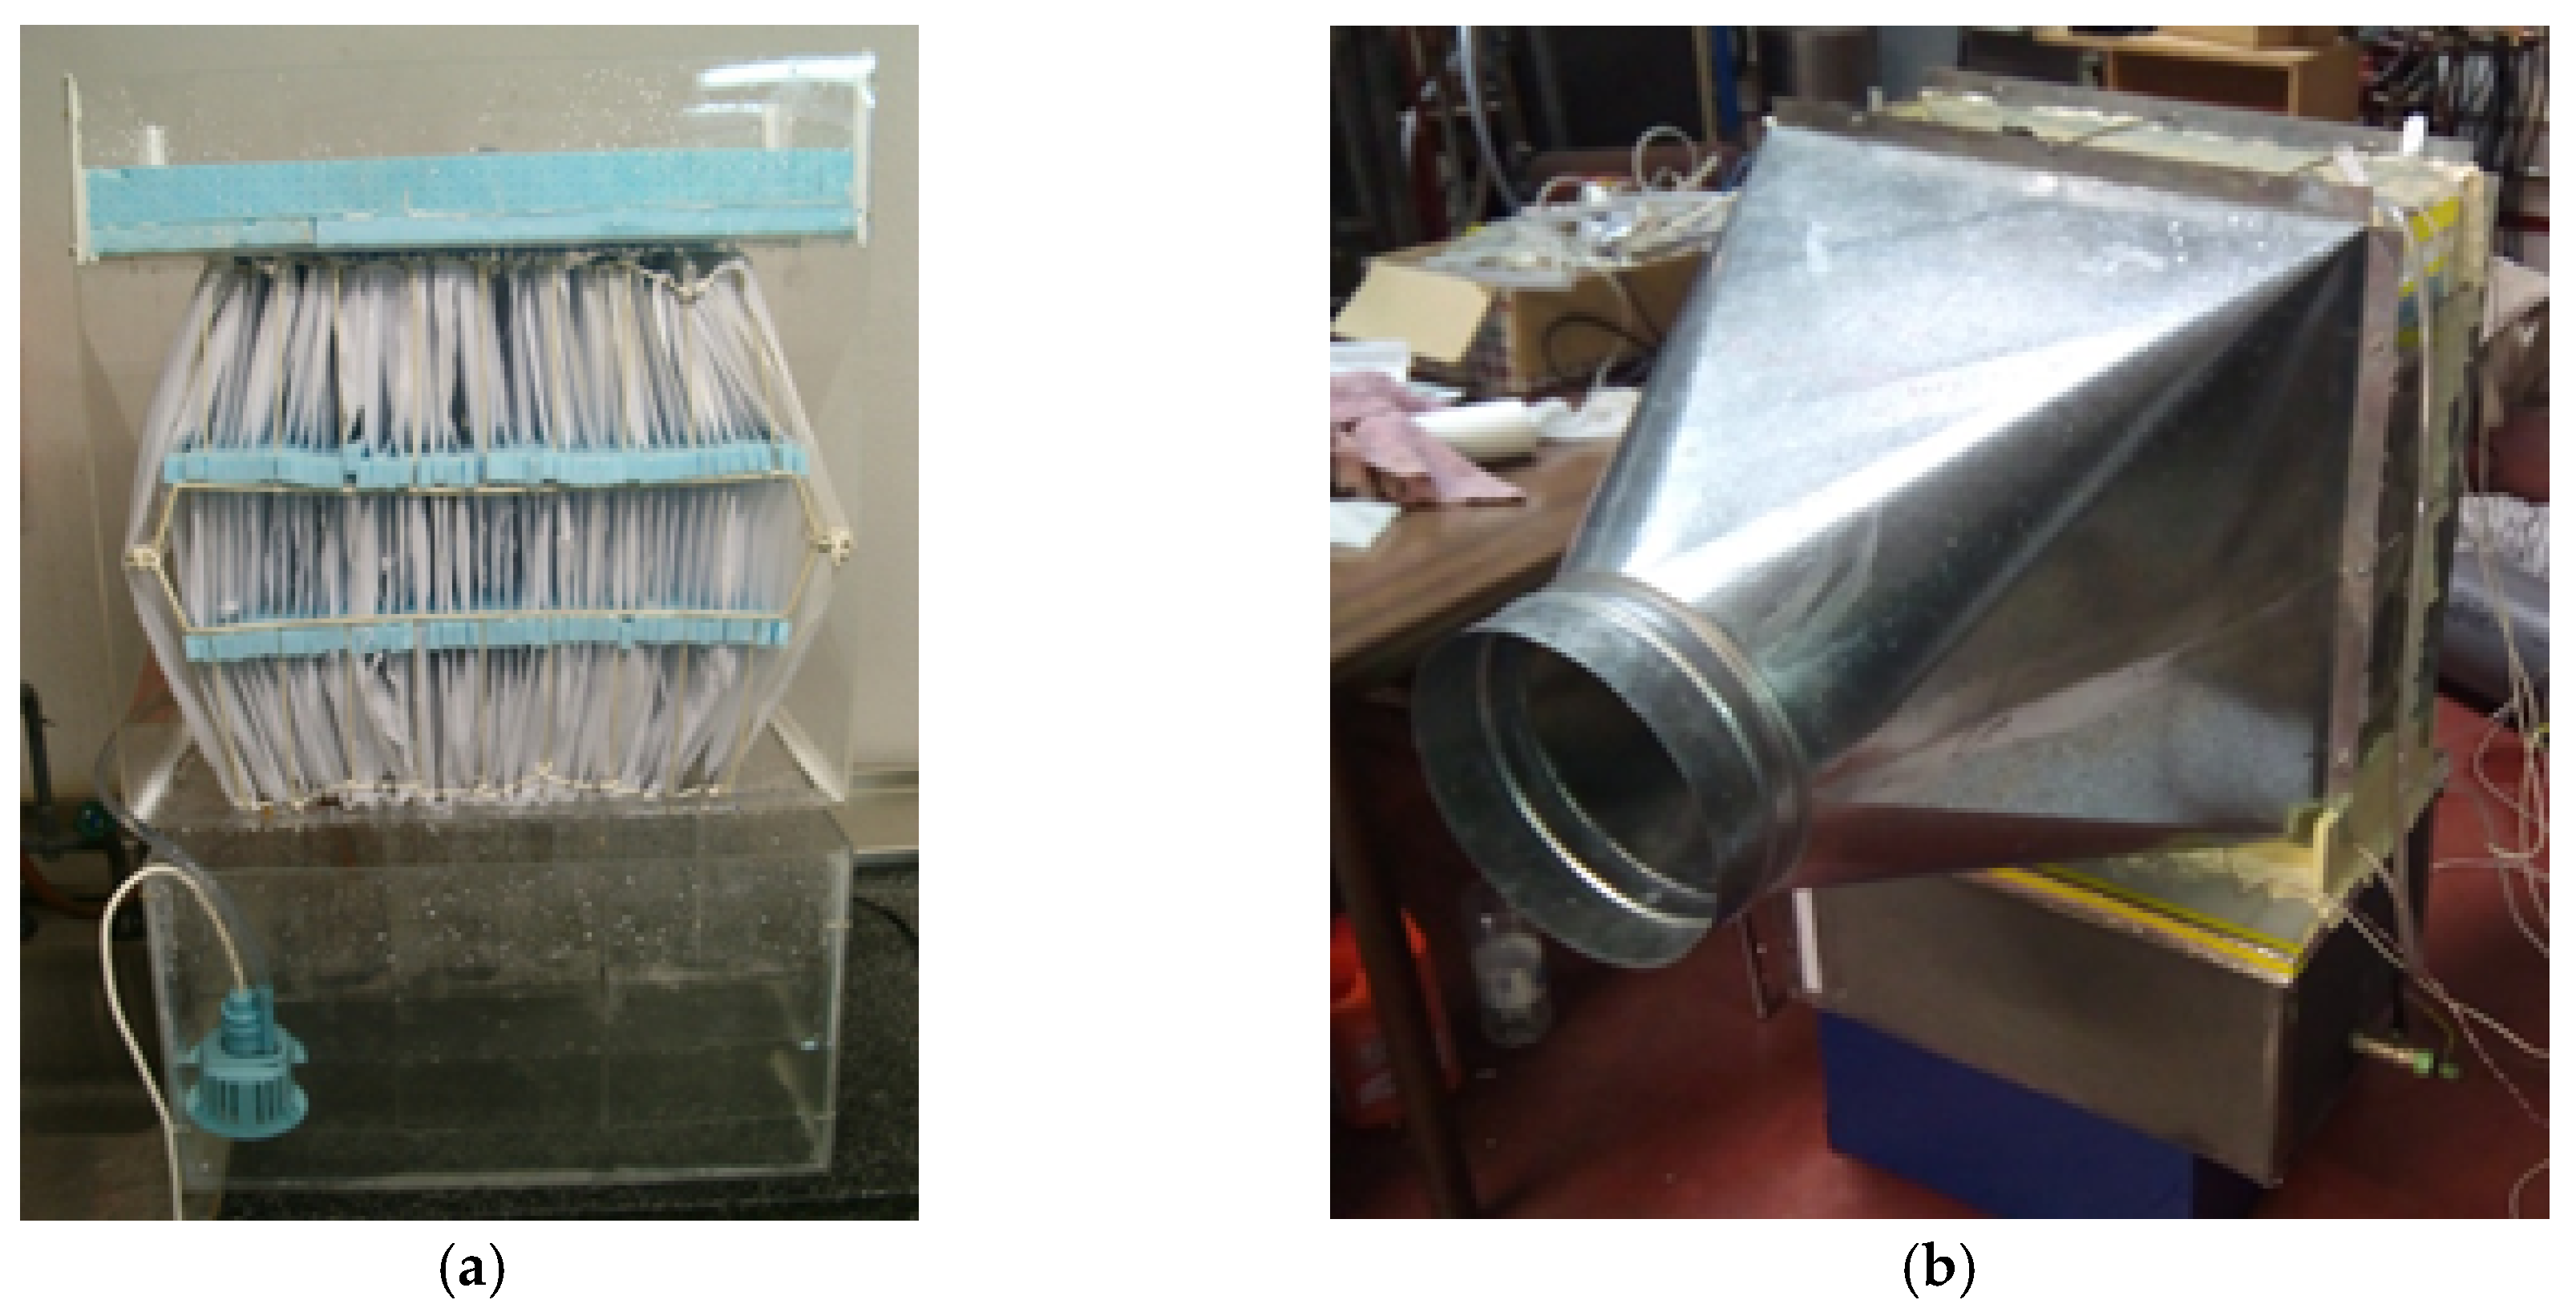
2.1. Design and Construction of the Fabric EC System

A fabric-based evaporative cooling (EC) pad has been designed and built with a 25 x 1600 cm2 piece of cotton fabric. It was obtained from a 200 x 200 cm2 cloth cut into eight pieces, then sewed. The cloth has been arranged and stretched on a wire structure, creating a 25 cm thick hexagonal pad with homogeneous air paths separated with the aid of spacers (Figure 1). The cross section is 0.18 m2. This design aims at avoiding any mechanical issues related to problems observed in the literature [27]. Since the cloth does not excessively tighten, in case of slight deterioration of the cotton fibres the system would not dismantle.
The pad is installed within a methacrylate case 45 cm wide, 45 cm high and 25 cm deep. Since the pad is hexagonal, non-useful areas are blocked with additional methacrylate plates to avoid air bypass. Water is pumped from a lower deposit to an upper distributor. The water pump provides 9.5 l/min and requires 9 W. The whole system is connected to air inlet and outlet plenums. These plenums are pyramidal shaped and 60 cm long to favour uniform airflow through the pad. (Figure 2).

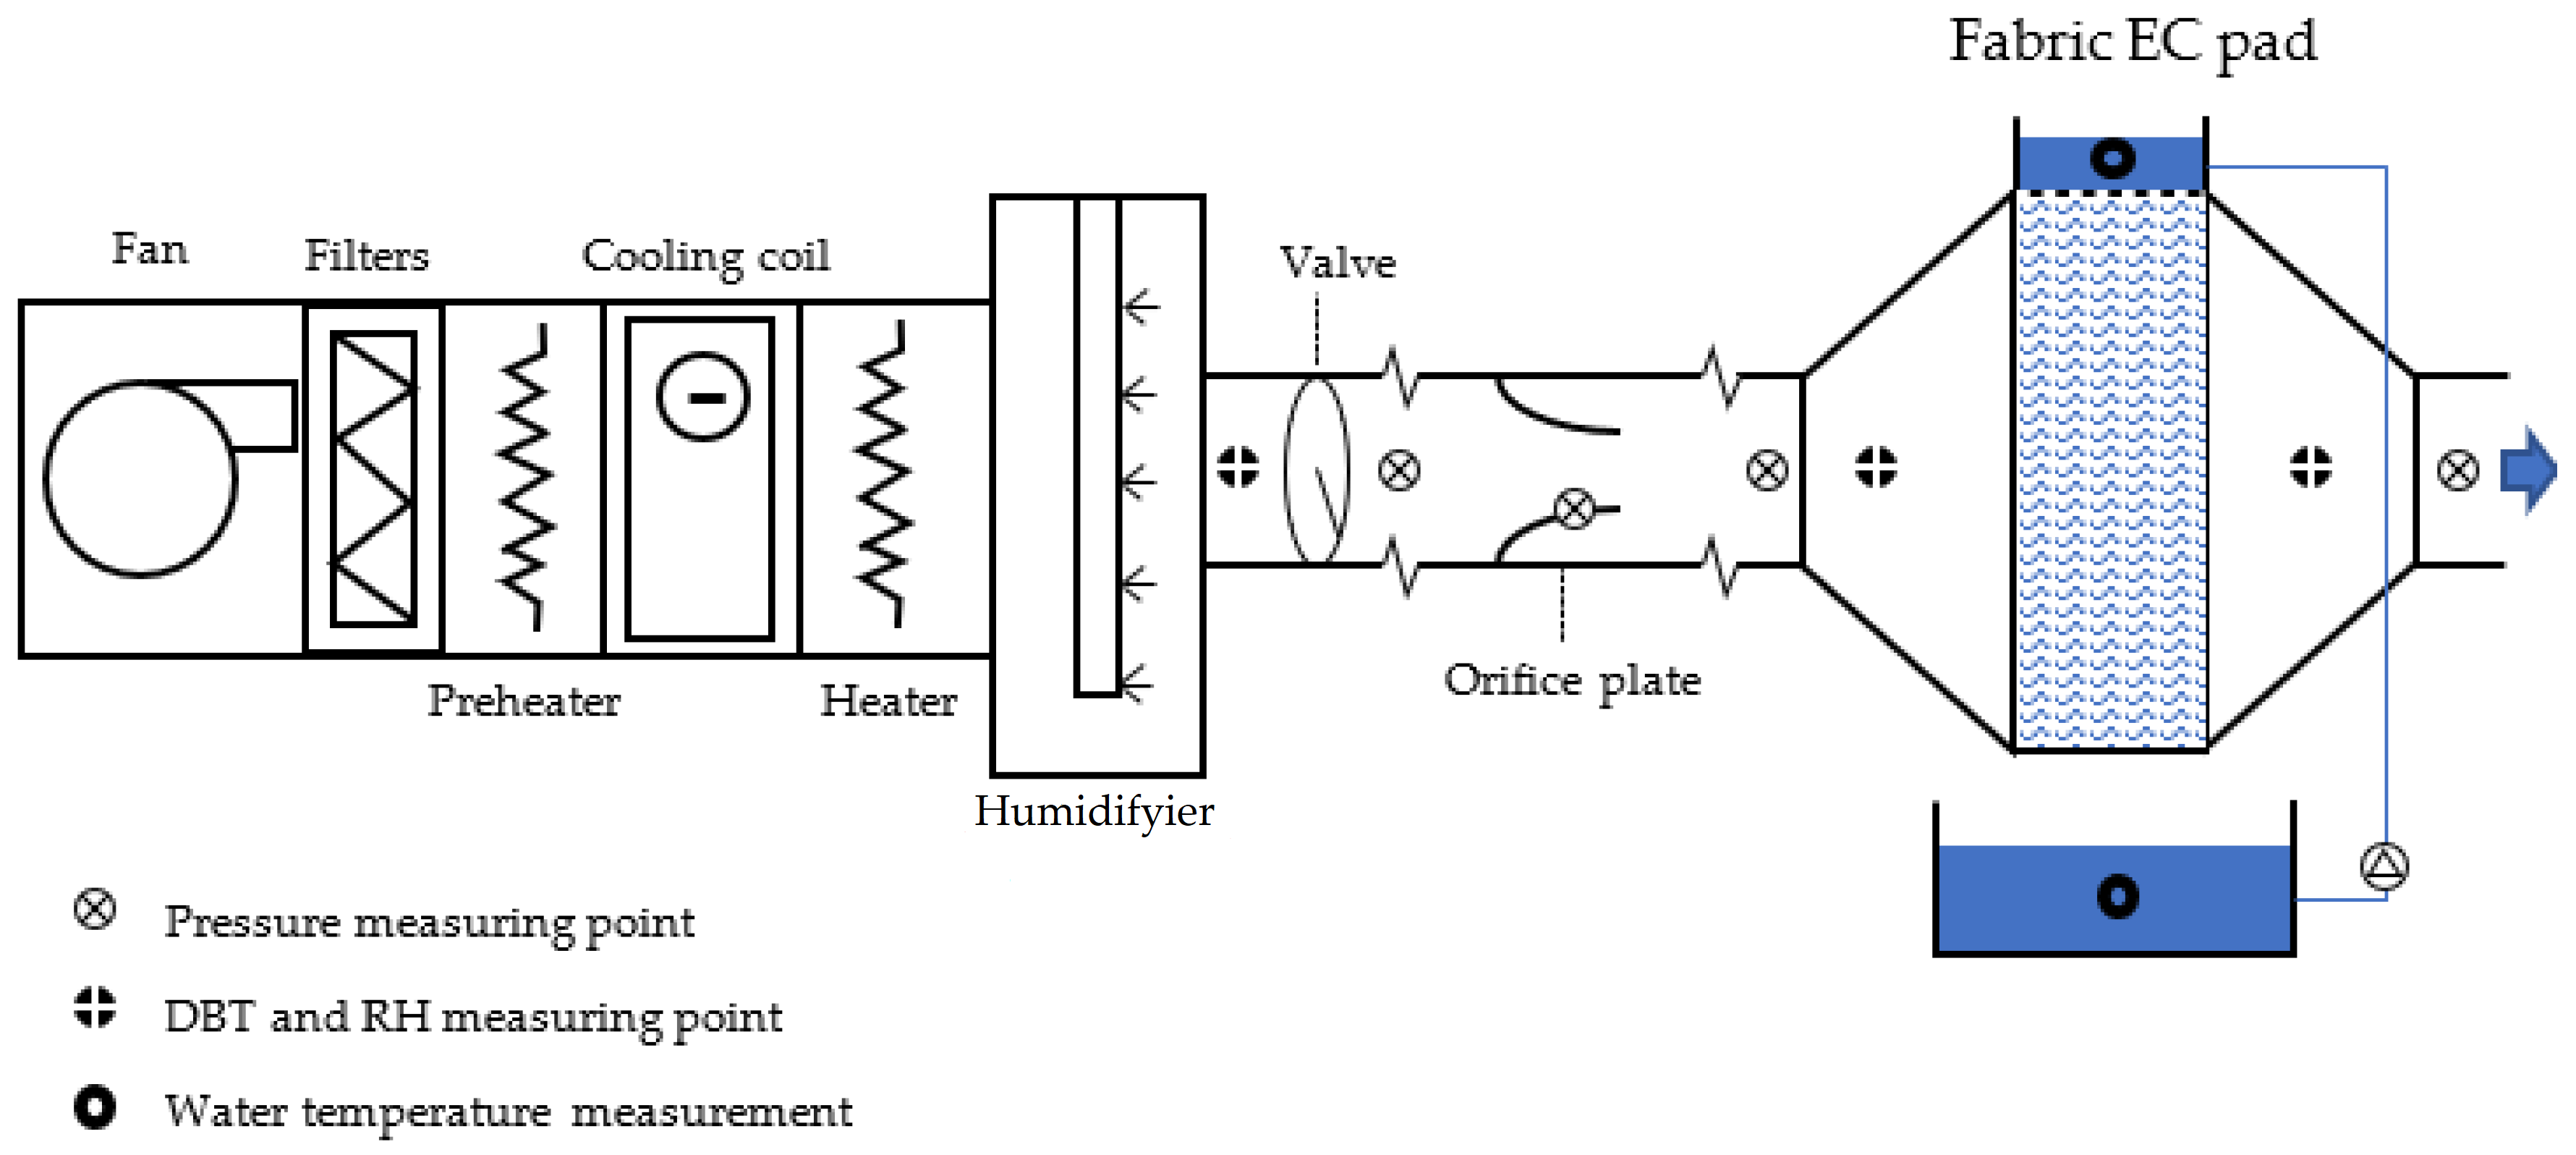
2.2. Experimental Setup

The system is connected through flexible ducts to an Air Handling Unit (AHU) that provides the desired conditions of air Dry Bulb Temperature (DBT), Relative Humidity (RH) and volume flow (Figure 3). DBT and RH sensors at the outlet enable control of the AHU. The Airflow is measured with an orifice plate, by differential pressure measurements in the nozzle and six diameters far upstream. Pressure drop is also measured in the fabric EC system.
DBT and RH are measured in triplicate at the fabric EC system inlet and outlet with 4-wire Pt100 and capacity sensors. The system characterization is based on the average measurements of these three-sensor measuring points. This triple measurement at each section also enables the checking of any possible stratification. At the air inlet, DBT standard deviation ranges from 0.52 to 0.57 °C, while RH standard deviation ranges from 0 to 2.4%. At the air outlet, DBT standard deviation ranges from 0.12 to 0.54 °C, and RH standard deviation ranges from 2.5 to 5.3%. Comparing these values to the uncertainty of the measurement given later (Section 3), it demonstrates that no representative stratification occurs.
Water temperature in both the lower tank and the upper distributor is measured in duplicate with ceramic Pt100 sensors. Temperature Pt100 sensors’ accuracy is ± 0.1 °C, and they are calibrated with a Fluke 9103 dry well, while RH capacity sensors’ accuracy is ± 2%, and they are calibrated with a Vaisala Humidity Calibrator HMK15. Pressure drop was measured with a Honeywell 163PC01D75 (160 PC series). The orifice plate was previously calibrated with a nozzle, using a Testo 435-4 for pressure drop measuring. Temperature, RH and differential pressure sensors are connected to an Agilent 34972A data acquisition system.
Additionally, airborne particles at the system outlet are characterized with a Lasair II Air particle counter. Measurements have been performed in duplicate at the three airflow levels and for the media wetted and dry (total of 12 tests).

2.3. Design of Experiments

To characterize the behaviour of the system, this work proposes a full factorial design of experiments. Target factors are three-level air volume flow (V), six-level DBT (T) and three-level specific humidity (w), the latter in kilograms of vapor to kilograms of dry air (kgv / kgda). Air DBT ranges from 25 to 50 °C to cover the most common summer conditions worldwide. Airflow and specific humidity are limited by the experimental setup: the air volume flow rate studied ranges from the lowest limit of the orifice plate accuracy and the maximum airflow provided by the AHU, while the minimum and maximum specific humidity considered are the air specific humidity at the laboratory and the maximum humidity achievable with the humidifier at 25 °C.
Tests are performed in Valladolid, Spain (approximately 700 m.a.s.l.). The experimental runs are performed once, randomized. Tests that did not reach a steady state were disregarded and repeated. Table 1 gathers the levels of the factors studied, tests performed, and their order.

3. Results

Actual DBT and RH conditions of inlet air achieved in the AHU for the Design of Experiments shown in Table 1 are gathered in Table 2.
Outlet conditions and water temperatures are given in Table 3 and Table 4, respectively.
Values provided in Table 2, Table 3 and Table 4 are the average values measured during the steady state periods for each test. The uncertainty of these values can be determined as the sum of the sensor accuracy (Section 2.2) and the standard deviation of the measured value along the period considered. The standard deviation of the DBT and RH measurements during steady state conditions is below ± 0.2 °C and ± 3% at the system inlet, respectively. These are larger than the DBT and RH standard deviations at the system outlet (± 0.1 °C and ± 1%, respectively), which is due to the effect of the AHU control. Consequently, uncertainty would be ± 0.3 °C for the DBT and ± 5% for the RH.
Next, the results of the obtained target parameters are described and discussed within existing research.

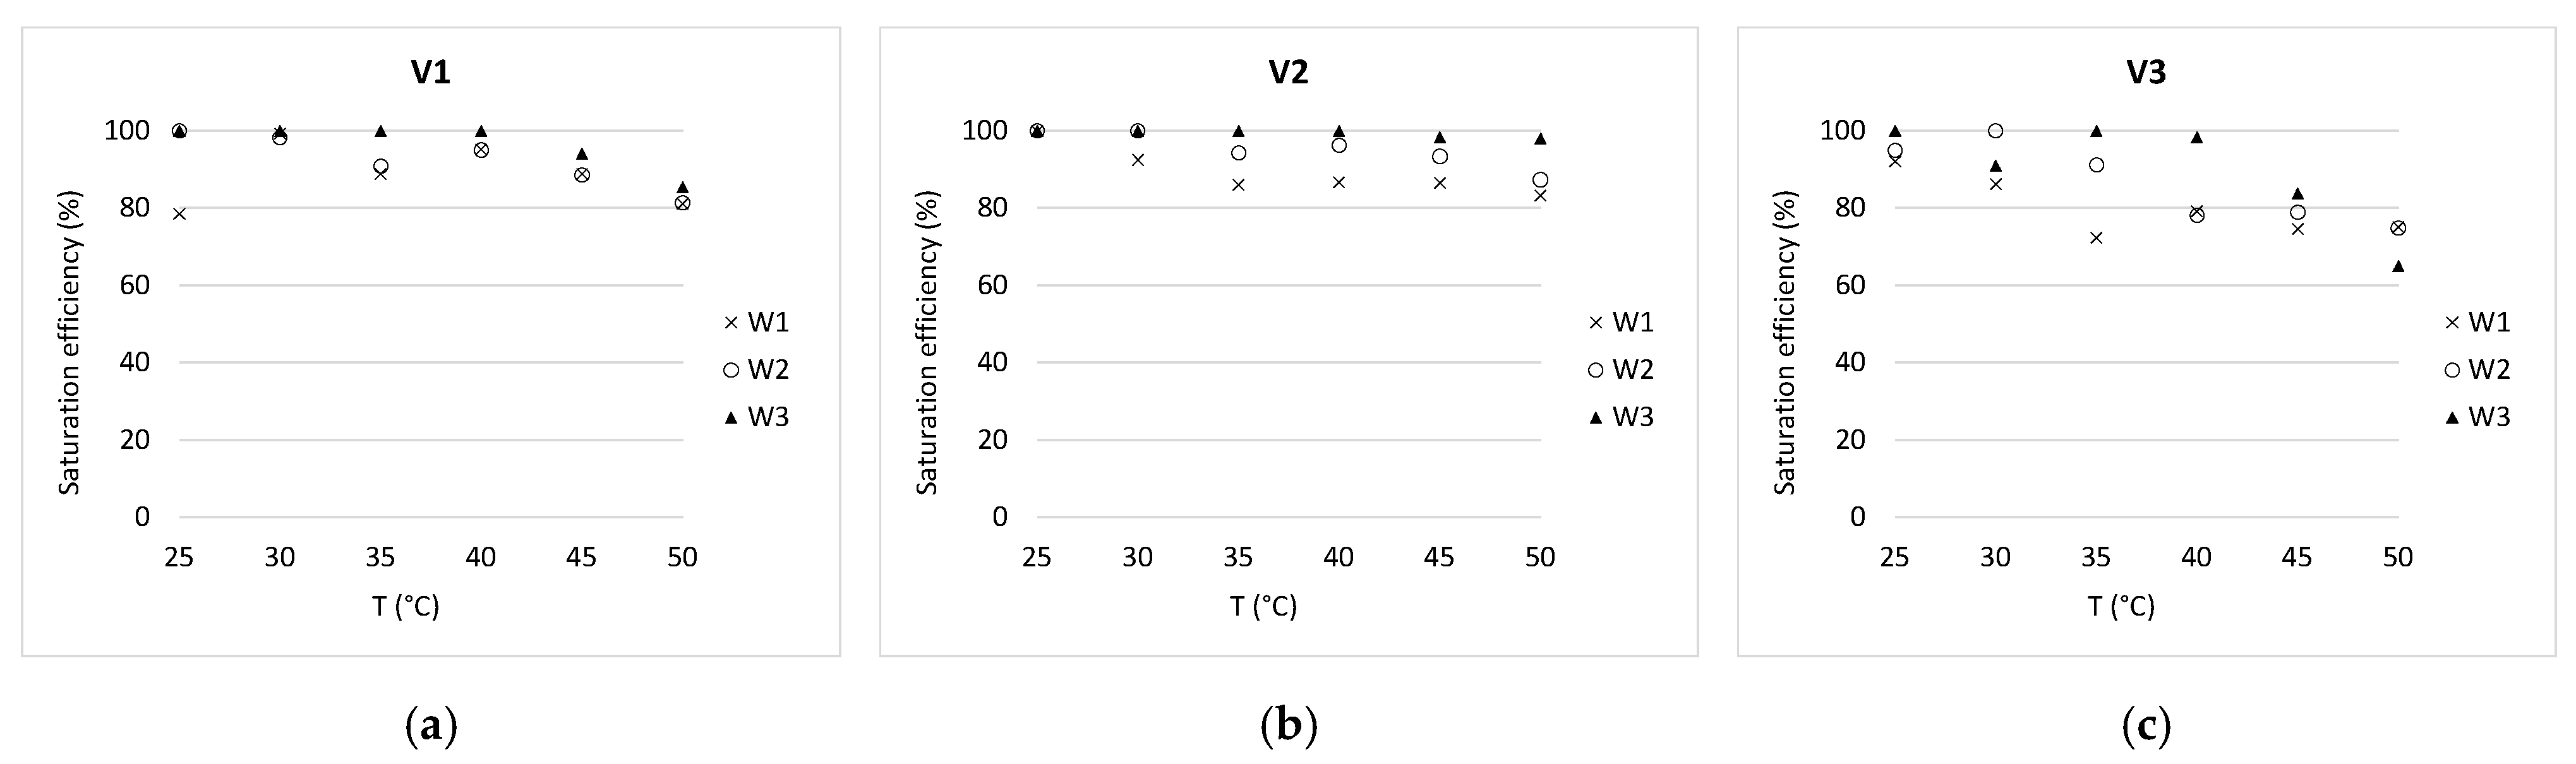
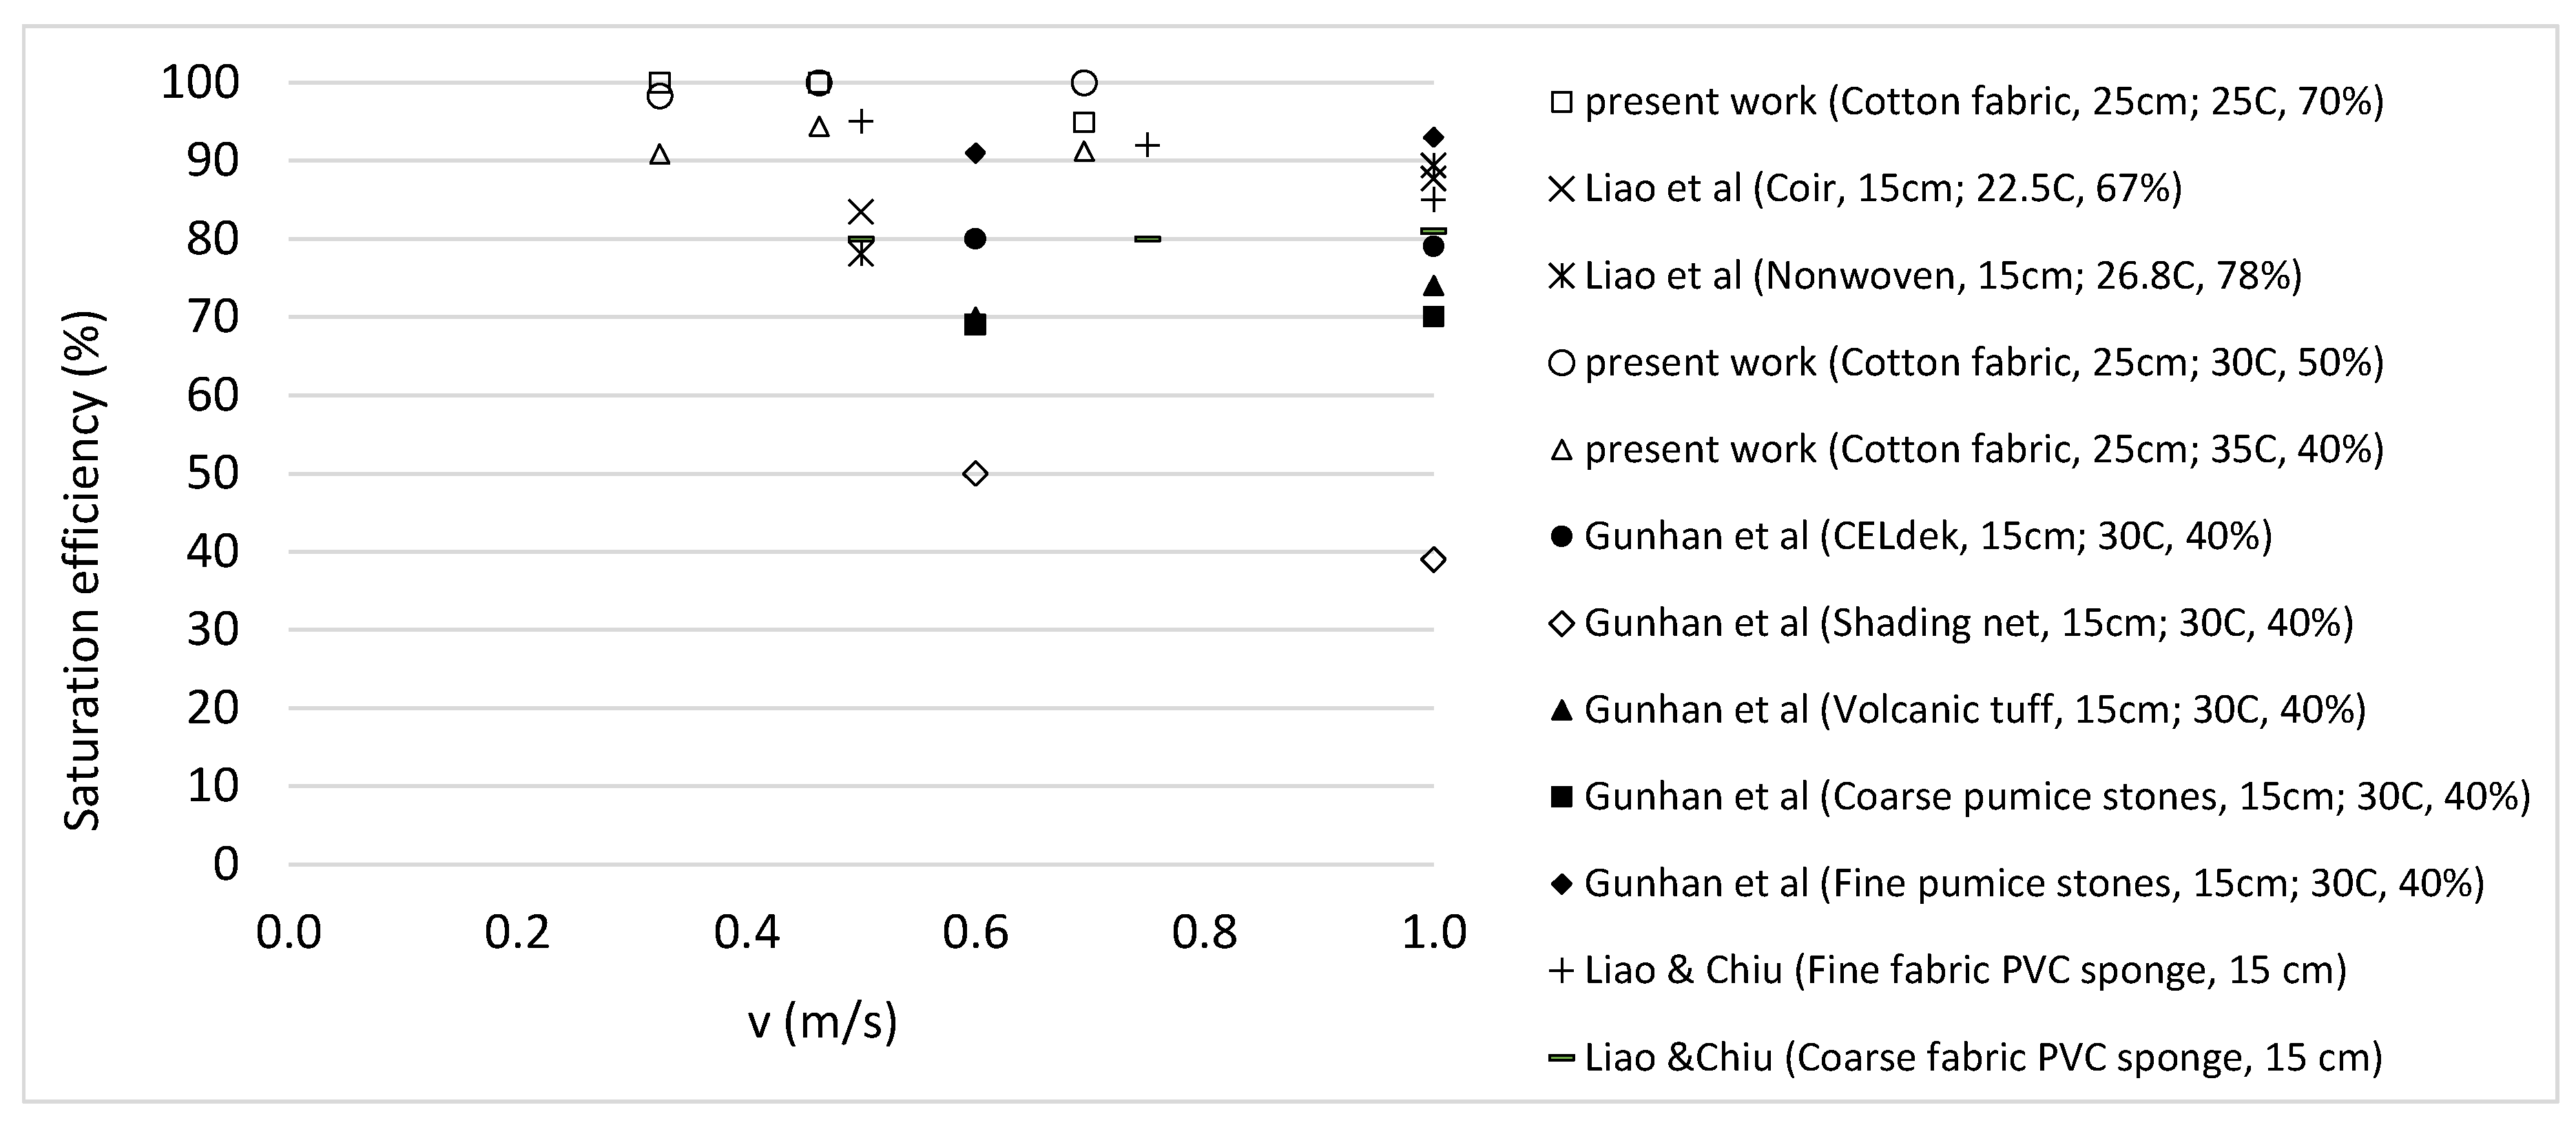
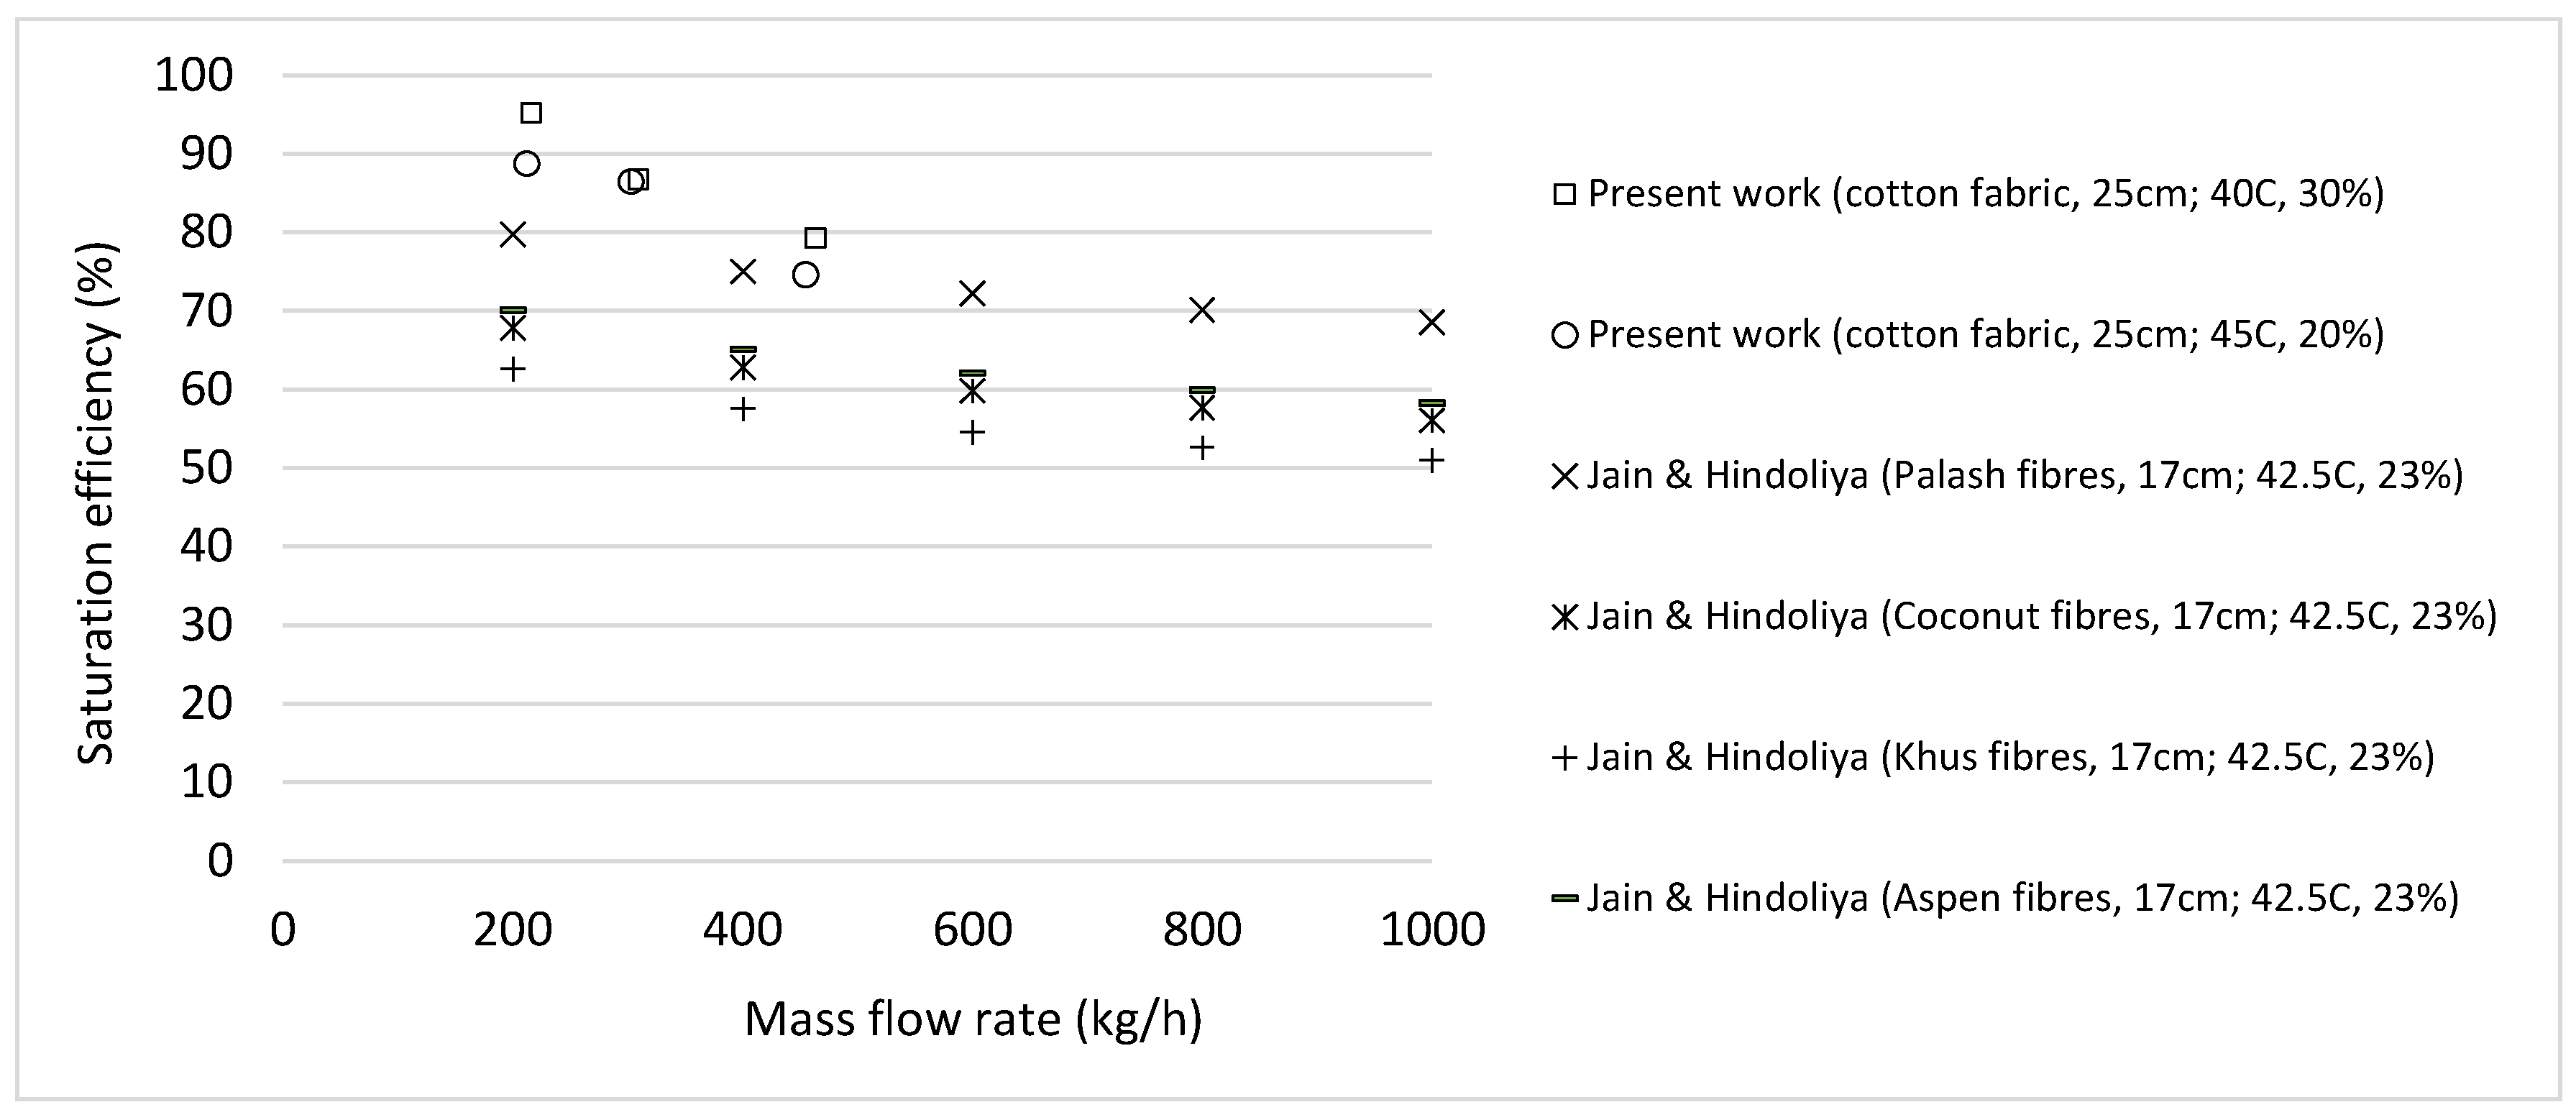
3.1. Saturation Efficiency

Saturation efficiency, ε, relates the temperature drop achieved in the air between the inlet (Tin) and outlet (Tout) to the maximum temperature drop achievable, the latter being considered in terms of the adiabatic saturation temperature of inlet air (Tas in), as expressed in Equation (1):
ε = T i n T o u t T i n T a s   i n
Results obtained for the saturation efficiency are shown in Figure 4.
Saturation efficiency is almost constant with the inlet air DBT, though for extreme temperatures (over 40 °C) it decreases. Inlet air humidity level has also a minor effect. Saturation efficiency can be expected to be almost constant for the common range of inlet air hygrometric conditions. Nonetheless, the effect of the airflow level is more noticeable, as larger airflows incur into lower saturation efficiencies. A more detailed analysis of this dependency is approached in the discussion section in comparison to existing research.

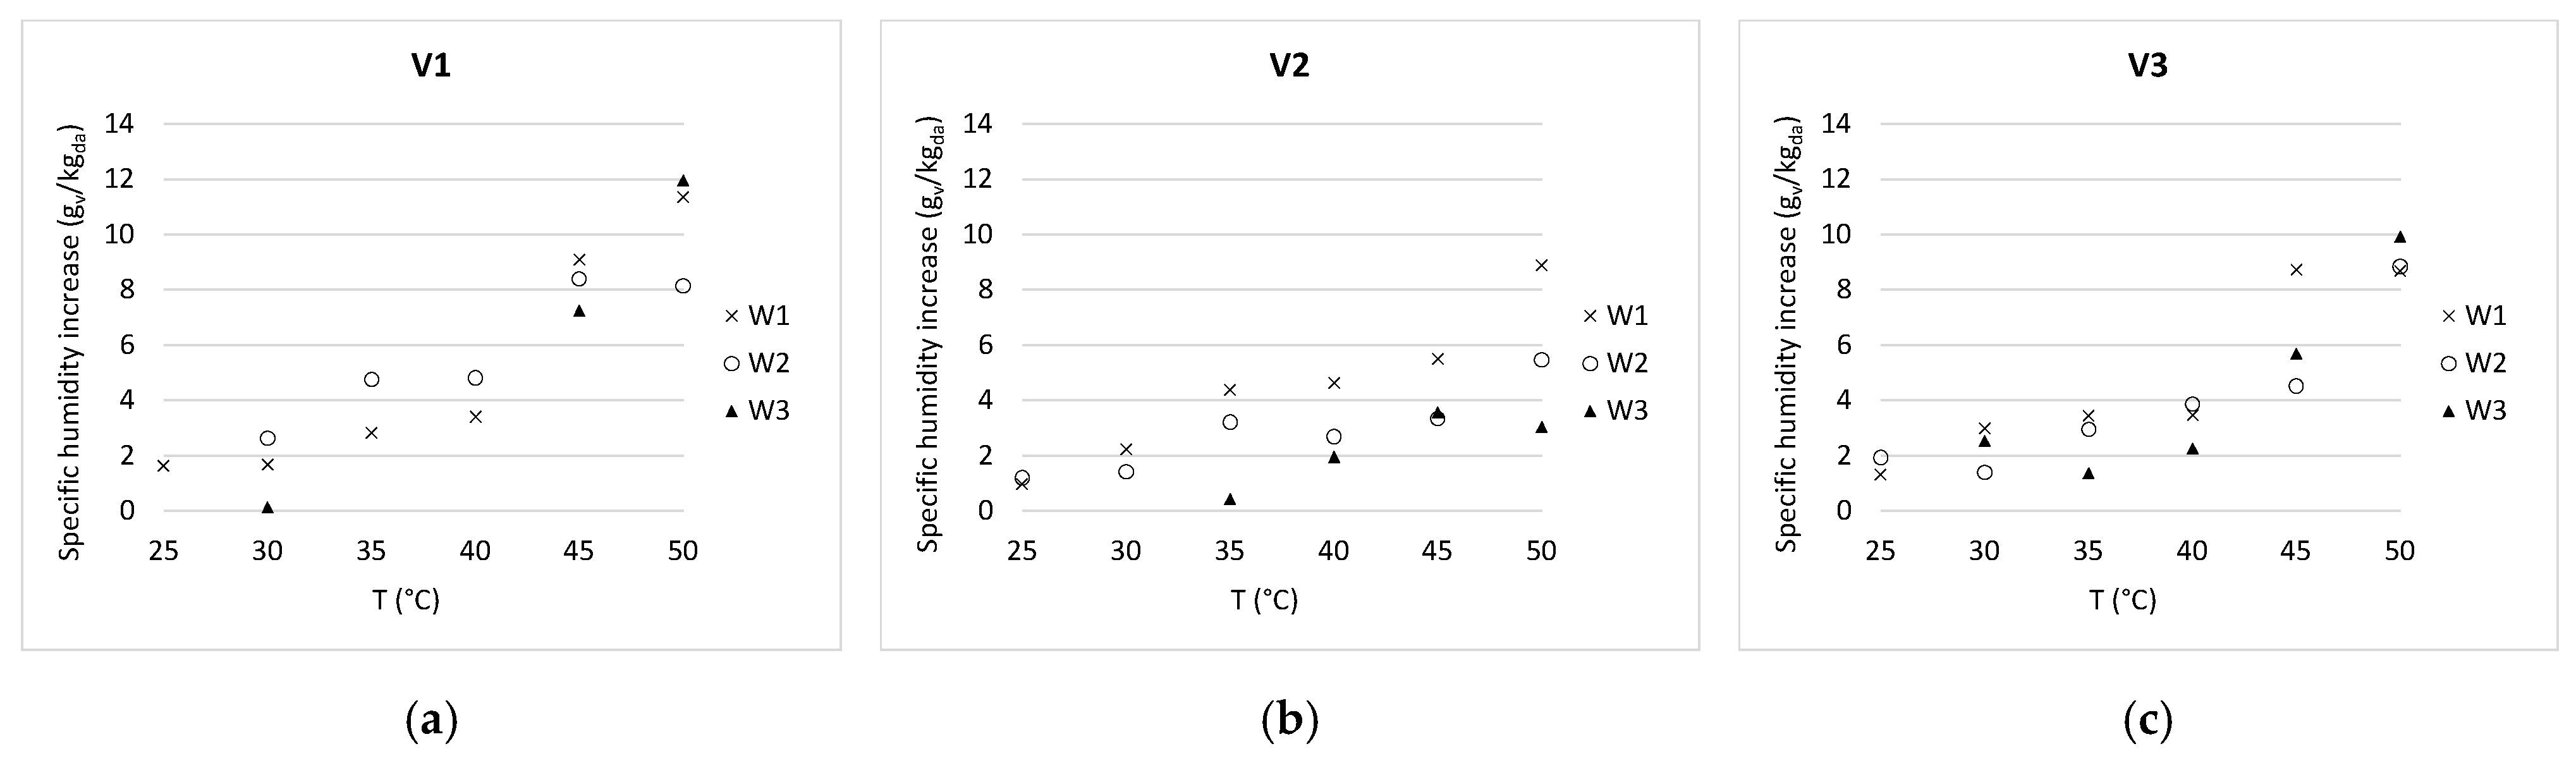
3.2. Air Humidification
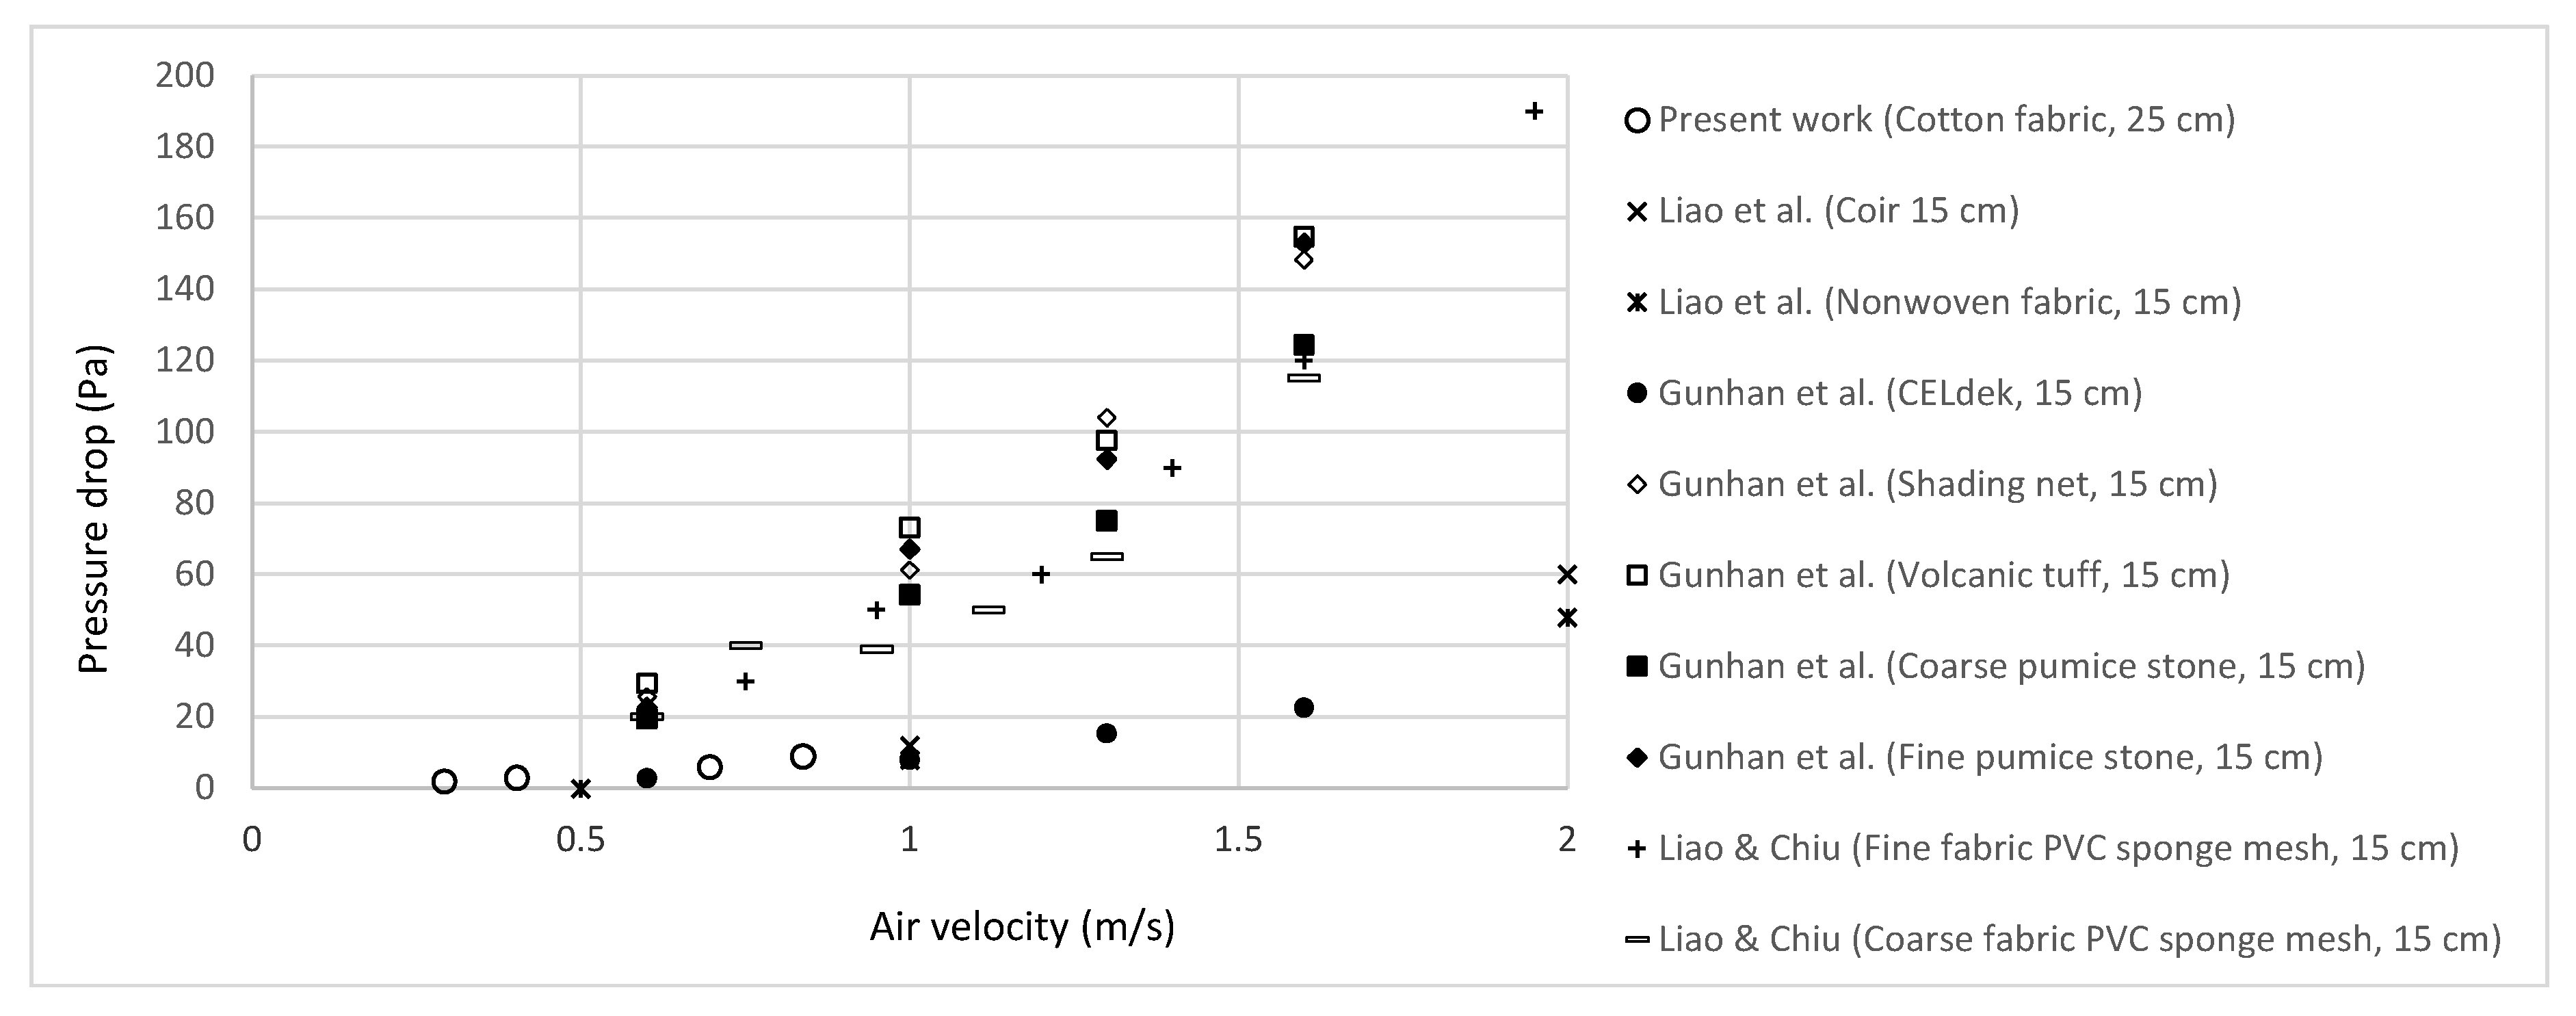
Air humidification is studied through the increment of the specific humidity, w, as demonstrated in Equation (2):
Δ w = w o u t w i n
Results shown in Figure 5 illustrate how the increment of the specific humidity strongly depends on the inlet air DBT. Higher inlet specific humidity slightly conditions a lower increment. Both results are due to the larger Wet Bulb Depression (WBD), this being the difference between the DBT and the Wet Bulb Temperature (WBT). Since saturation efficiency is fairly maintained for a particular design operating at a particular airflow, larger WBD also involves larger humidity increments.
Some tests (V1T1W2, V1T1W3, V2T1W3, V2T2W3 and V3T1W3) showed air slight dehumidification. This is because water temperatures (Table 2) did not reach the air saturation temperature of inlet air. Consequently, under inlet air conditions corresponding to high relative humidity, when adiabatic saturation and dew point (DPT) temperatures were similar, water temperature was slightly below air DPT. Tests V1T3W3 and V1T4W4 show the same behaviour, though inlet air relative humidity is low. In this case, water temperature remained far from the target adiabatic saturation temperature due to the thermal inertia of the 50 l water tank, thus not being representative.

3.3. Pressure Drop

Pressure drop in the fabric EC pad has been calculated through the experimental procedure shown in Figure 3, varying the potentiometer of the fan in four positions. Measurement of the pressure drop in the calibrated orifice plate enables determination of the air volume flow through the system (Table 5). Pressure drops obtained are low, as expected due to the design of the system and the low Reynolds numbers achievable under the air velocities tested for the airpath between wetted surfaces. Comparison to values obtained in the literature for conventional and other alternative pads is discussed in the next section.

3.4. Airborne Particles

DEC systems are known to perform some cleaning of treated air [2]. The study of particles airborne through the system provide insight into this issue and also into the water entrainment that can involve risk of dispersion of Legionella bacteria. To analyse the latter issue, special attention must be paid to 5 µm aerosols. This sizing is determinant because they are breathable aerosols of enough size to contain rod shaped 1 x 3 µm size bacteria [33]. Table 6 gathers the number of particles registered for all tests performed at each airflow level, with the dry and then wetted media.
The smallest registered particles of 0.3 µm account for 60 to 70% of the total number of particles counted. As well as this, almost all particles registered (99.6 to 99.9%) are equal to or smaller than 1 µm and therefore cannot contain Legionella bacteria.
Concerning air cleaning, the number of particles decreases through the wetted media in about 15–17% for 0.5 µm, 22–30% for 1 µm, 25–45% for 5 µm, and above 60% for the largest particles. However, the number of the smallest 0.3 µm particles increases in 9 to 14%. This demonstrates that wetted media actually performs air cleaning of particles equal to or above 0.5 µm. Water entrainment may also be restricted to small aerosols that cannot contain Legionella, though this needs further study using other measuring methods that distinguish between particles and aerosols. Nonetheless, proper maintenance of the system is strictly necessary to avoid proliferation of Legionella.

4. Discussion

Results for the air specific humidity increase correspond to those in existing research. Sheng & Nnanna [4] registered increments of the air specific humidity from 3. 4 gv/kgda at 25.5 °C to 7.4 gv/kgda at 45 °C, thus being of the same order of magnitude than the ones obtained in the present work.
Figure 6 shows the saturation efficiencies in terms of air velocity in comparison to previous results in existing literature on alternative pads [21,28,29]. For clarity and correspondence to the air hygrothermal conditions studied in the referred works, it only presents results obtained for the first three levels of temperature (T1, T2 and T3) at the intermediate humidity level (W2). Corresponding relative humidity is 70%, 50% and 40%, approximately. Only results for the largest thicknesses studied in the referred works are considered (15 cm). No information was given in the referred works as to the errors expected.
Comparison to results obtained by Jain and Hindoliya [14] is given in Figure 7. To compare results obtained under the closest air conditions to the referred work, Figure 7 shows results from the present work obtained only at temperature levels T4 and T5, at the lowest humidity level (W1). No information was given in the referred work as to the errors expected. It can be observed that the proposed system using woven fabric can achieve larger saturation efficiencies than using other alternative materials made from vegetable fibres.
Regarding the results compared in Figure 6 and Figure 7, the new fabric-based EC cooling pad can achieve larger saturation efficiencies. This could be due to the larger thickness (25 cm) compared with the commonly largest thickness studied (15 cm) but also because of the wicking and capillary diffusion properties of the fabric used.
Taking a look at the results compared in Figure 8, larger thicknesses, in this case, does not incur excessive pressure drops. Pressure drops obtained by the new fabric 25 cm thick EC pad is of the same order of magnitude as that expected for conventional 15 cm cellulose pads [21] and other fabric-type pads in the literature [28]. This fact would be due to clearer air paths through the proposed pad compared with the compacity of the commercial CELdek® and configurations with coir and nonwoven fabric 15 cm pads.
Indeed, pressure drop is much lower than that obtained for alternative pads made of different stones [21] or fabric PVC sponge mesh [29]. Much larger pressure drops can be expected in pads made of different available fibres, such as khus, palash, coconut or aspen involve [13], and thus are not represented in Figure 8.
Concerning results for airborne particles, and to the knowledge of the authors, no previous research has approached this issue. Water entrainment is analysed in terms of the air velocity of cellulose and PVC pads by He et al. [10] by means of water-sensitive papers. They concluded that cellulose pads and low air velocities avoided risk of water entrainment.

5. Conclusions

Existing literature on the use of wetted fabrics for Evaporative Cooling purposes is scarce, despite demonstrated interest in these materials in terms of capillary diffusion and wicking ability. Related previous research has focused on its combination with passive architecture, and fabric-based EC pads are anecdotic among the large number of new pads built with alternative materials that can be found in the literature.
The present work designed and built an alternative EC pad using cotton fabric. The detailed description given of the system construction permits its reproduction.
The saturation efficiency registered is barely affected by air inlet hygrometric conditions, though larger airflows involve lower efficiencies. The values obtained are above those for other alternative pads studied in the literature. This could be due to both the pad design and the cotton fabric wicking ability and capillary diffusion.
Air humidification increases notably with inlet air DBT, slightly affecting specific humidity. This is due to larger Wet Bulb Depressions and stable saturation efficiencies in the same airflow.
The pressure drop generated for the 25 cm pad is of the same order of magnitude as results in existing research found for 15 cm conventional cellulose pads and 15 cm fabric-based pads, and much lower than other alternative pads made of vegetable fibres and different stones. Further research on the aerodynamic resistance of the pads could illustrate the optimum configuration.
Particle counting demonstrates that the wetted media performs air cleaning for particles above 0.3 µm. As well as this, more than 99.6% of the airborne particles counted cannot contain the Legionella bacteria, both for dry and wet media. However, proper maintenance of the system is strictly necessary to avoid microbial growth, as well as any risk of Legionella dispersion. In this sense, fabrics used as wetting media in simple configurations can be easily dismantled and washed for maintenance. Replacement of the media would be cost-effective. Further research on the durability of organic-based EC media would be necessary to enhance the use of these alternative systems.
The better performance obtained for the cotton fabric in this particular design, compared with other materials, can enhance the use, or reuse, of common fabrics for EC purposes.

Author Contributions

Conceptualization E.V.-G. and F.J.R.-M.; methodology, E.V.-G.; formal analysis, E.V.-G. and J.J.-R.; investigation, E.V.G., J.J.-R. and A.T.-G.; validation, visualization and writing, A.T.-G.; supervision, project administration and funding acquisition, F.J.R.-M. All authors have read and agreed to the published version of the manuscript.

Funding

This research was funded by the Education Department of the Regional Government of Castile and Leon and the European Regional Development Fund (ERDF) through the research project: “Análisis de tecnologías energéticamente eficientes para la sostenibilidad de los edificios” (Ref.: VA272P18).

Conflicts of Interest

The authors declare no conflict of interest. The funders had no role in the design of the study; in the collection, analyses, or interpretation of data; in the writing of the manuscript, or in the decision to publish the results.

References

  1. Watt, J.R. Evaporative Air Conditioning Handbook; 2.; Chapman and Hall: New York, NY, USA, 1986. [Google Scholar]
  2. Chapter 53 Evaporative Cooling. In ASHRAE Handbook. HVAC Applications; 2019. Available online: https://www.ashrae.org/technical-resources/ashrae-handbook/ashrae-handbook-online (accessed on 29 August 2020).
  3. Chapter 41 Evaporative Air-Cooling Equipment. In ASHRAE Handbook-Systems and Equipment; 2020. Available online: https://www.ashrae.org/technical-resources/ashrae-handbook/description-2020-ashrae-handbook-hvac-systems-and-equipment (accessed on 29 August 2020).
  4. Sheng, C.; Agwu Nnanna, A.G. Empirical correlation of cooling efficiency and transport phenomena of direct evaporative cooler. Appl. Therm. Eng. 2012, 40, 48–55. [Google Scholar] [CrossRef]
  5. Malli, A.; Seyf, H.R.; Layeghi, M.; Sharifian, S.; Behravesh, H. Investigating the performance of cellulosic evaporative cooling pads. Energy Convers. Manag. 2011, 52, 2598–2603. [Google Scholar] [CrossRef]
  6. Franco, A.; Valera, D.L.; Madueño, A.; Peña, A. Influence of Water and Air Flow on the Performance of Cellulose Evaporative Cooling Pads Used in Mediterranean Greenhouses. Trans. ASABE 2010, 53, 565–576. [Google Scholar] [CrossRef]
  7. Warke, D.A.; Deshmukh, S.J. Experimental Analysis of Cellulose Cooling Pads Used in Evaporative Coolers. Int. J. Energy Sci. Eng. 2017, 3, 37–43. [Google Scholar]
  8. Barzegar, M.; Layeghi, M.; Ebrahimi, G.; Hamzeh, Y.; Khorasani, M. Experimental evaluation of the performances of cellulosic pads made out of Kraft and NSSC corrugated papers as evaporative media. Energy Convers. Manag. 2012, 54, 24–29. [Google Scholar] [CrossRef]
  9. Al-Badri, A.R.; Al-Waaly, A.A.Y. The influence of chilled water on the performance of direct evaporative cooling. Energy Build. 2017, 155, 143–150. [Google Scholar] [CrossRef]
  10. He, S.; Guan, Z.; Gurgenci, H.; Hooman, K.; Lu, Y.; Alkhedhair, A.M. Experimental study of film media used for evaporative pre-cooling of air. Energy Convers. Manag. 2014, 87, 874–884. [Google Scholar] [CrossRef]
  11. Franco, A.; Valera, D.L.; Peña, A. Energy efficiency in greenhouse evaporative cooling techniques: Cooling boxes versus cellulose pads. Energies 2014, 7, 1427–1447. [Google Scholar] [CrossRef]
  12. Alam, M.F.; Sazidy, A.S.; Kabir, A.; Mridha, G.; Litu, N.A.; Rahman, M.A. An experimental study on the design, performance and suitability of evaporative cooling system using different indigenous materials. AIP Conf. Proc. 2017, 1851, 020075. [Google Scholar] [CrossRef]
  13. Jain, J.K.; Hindoliya, D.A. Experimental performance of new evaporative cooling pad materials. Sustain. Cities Soc. 2011, 1, 252–256. [Google Scholar] [CrossRef]
  14. Jain, J.K.; Hindoliya, D.A. Correlations for Saturation Efficiency of Evaporative Cooling Pads. J. Inst. Eng. Ser. C 2014, 95, 5–10. [Google Scholar] [CrossRef]
  15. Anyanwu, E.E. Design and measured performance of a porous evaporative cooler for preservation of fruits and vegetables. Energy Convers. Manag. 2004, 45, 2187–2195. [Google Scholar] [CrossRef]
  16. Rawangkul, R.; Khedari, J.; Hirunlabh, J.; Zeghmati, B. Performance analysis of a new sustainable evaporative cooling pad made from coconut coir. Int. J. Sustain. Eng. 2008, 1, 117–131. [Google Scholar] [CrossRef]
  17. Al-Sulaiman, F. Evaluation of the performance of local fibers in evaporative cooling. Energy Convers. Manag. 2002, 43, 2267–2273. [Google Scholar] [CrossRef]
  18. Ndukwu, M.C.; Manuwa, S.I. A techno-economic assessment for viability of some waste as cooling pads in evaporative cooling system. Int. J. Agric. Biol. Eng. 2015, 8, 151–158. [Google Scholar]
  19. De Melo, J.C.F.; Bamberg, J.V.M.; MacHado, N.S.; Caldas, E.N.G.; Rodrigues, M.S. Evaporative cooling efficiency of pads consisting of vegetable loofah. Comun. Sci. 2019, 10, 38–44. [Google Scholar] [CrossRef] [Green Version]
  20. Doğramacı, P.A.; Aydın, D. Comparative experimental investigation of novel organic materials for direct evaporative cooling applications in hot-dry climate. J. Build. Eng. 2020, 30. [Google Scholar] [CrossRef]
  21. Gunhan, T.; Demir, V.; Yagcioglu, A.K. Evaluation of the Suitability of Some Local Materials as Cooling Pads. Biosyst. Eng. 2007, 96, 369–377. [Google Scholar] [CrossRef]
  22. Laknizi, A.; Ben Abdellah, A.; Faqir, M.; Essadiqi, E.; Dhimdi, S. Performance characterization of a direct evaporative cooling pad based on pottery material. Int. J. Sustain. Eng. 2019, 00, 1–11. [Google Scholar] [CrossRef]
  23. Korese, J.K.; Hensel, O. Experimental evaluation of bulk charcoal pad configuration on evaporative cooling effectiveness. Agric. Eng. Int. CIGR J. 2016, 18, 11–21. [Google Scholar]
  24. Ahmed, E.M.; Abaas, O.; Ahmed, M.; Ismail, M.R. Performance evaluation of three different types of local evaporative cooling pads in greenhouses in Sudan. Saudi J. Biol. Sci. 2011, 18, 45–51. [Google Scholar] [CrossRef] [PubMed] [Green Version]
  25. Inamdar, S.J.; Junghare, A.; Kale, P. Performance enhancement of evaporative cooling by using bamboo. Int. J. Eng. Adv. Technol. 2019, 8, 856–860. [Google Scholar]
  26. Sudprasert, S.; Sankaewthong, S. Utilization of rice husks in a water-permeable material for passive evaporative cooling. Case Stud. Constr. Mater. 2018, 8, 51–60. [Google Scholar] [CrossRef]
  27. Xu, P.; Ma, X.; Zhao, X.; Fancey, K.S. Experimental investigation on performance of fabrics for indirect evaporative cooling applications. Build. Environ. 2016, 110, 104–114. [Google Scholar] [CrossRef]
  28. Liao, C.M.; Singh, S.; Wang, T. Sen Characterizing the performance of alternative evaporative cooling pad media in thermal environmental control applications. J. Environ. Sci. Health-Part A Toxic/Hazardous Subst. Environ. Eng. 1998, 33, 1391–1417. [Google Scholar]
  29. Liao, C.M.; Chiu, K.H. Wind tunnel modeling the system performance of alternative evaporative cooling pads in Taiwan region. Build. Environ. 2002, 37, 177–187. [Google Scholar] [CrossRef]
  30. Ghosal, M.K.; Tiwari, G.N.; Srivastava, N.S.L. Modeling and experimental validation of a greenhouse with evaporative cooling by moving water film over external shade cloth. Energy Build. 2003, 35, 843–850. [Google Scholar] [CrossRef]
  31. Esparza L., C.J.; Escobar del Pozo, C.; Gómez A., A.; Gómez A., G.; Gonzalez C., E. Potential of a wet fabric device as a roof evaporative cooling solution: Mathematical and experimental analysis. J. Build. Eng. 2018, 19. [Google Scholar] [CrossRef]
  32. Brown, W.K. Operation and Maintenance of Evaporative Coolers. ASHRAE J. 2000, 42, 27–31. Available online: https://technologyportal.ashrae.org/Journal/ArticleDetail/545 (accessed on 29 August 2020).
  33. Puckorius, P.R.; Thomas, P.T.; Augspurger, R.L. Why Evaporative Coolers have not caused Legionnaires’ disease. ASHRAE J. 1995, 1, 29–33. [Google Scholar]
Figure 1. Construction of the fabric evaporative cooling (EC) pad: (a) scheme, (b) wire structure and cotton cloth, (c) cloth arrangement within the structure, and (d) detail of the spacers.
Sustainability 12 07070 g001
Figure 2. View of the fabric EC pad: (a) upper water distributor, lower deposit, and water pump; and (b) connection to air inlet and outlet plenums.
Sustainability 12 07070 g002
Figure 3. Scheme of the system connected to the Air Handling Unit (AHU) and position of measuring sensors.
Sustainability 12 07070 g003
Figure 4. Values of the saturation efficiency in terms of inlet air Dry Bulb Temperature (DBT) (Tin) and specific humidity (W) for airflow levels: (a) V1, (b) V2, and (c) V3.
Sustainability 12 07070 g004
Figure 5. Air specific humidity increase in terms of inlet air DBT (Tin) and specific humidity (W) for airflow levels: (a) V1, (b) V2, and (c) V3.
Sustainability 12 07070 g005
Figure 6. Saturation efficiencies obtained in the present work compared to existing studies [21,28,29].
Sustainability 12 07070 g006
Figure 7. Saturation efficiencies obtained in the present work compared to existing studies [14].
Sustainability 12 07070 g007
Figure 8. Pressure drop for the new fabric EC pad compared to existing studies [21,28,29].
Sustainability 12 07070 g008
Table 1. Factors, levels, and test code. Order of the test run is in parenthesis.
Airflow [m3/h]Specific Humidity [kgv/kgda]DBT [°C]
T1
25 °C
T2
30 °C
T3
35 °C
T4
40 °C
T5
45 °C
T6
50 °C
V1
210
W1
0.0115
V1T1W1
(1)
V1T2W1
(8)
V1T3W1
(16)
V1T4W1
(10)
V1T5W1
(6)
V1T6W1
(13)
W2
0.0150
V1T1W2
(9)
V1T2W2
(3)
V1T3W2
(5)
V1T4W2
(12)
V1T5W2 (14)V1T6W2
(17)
W3
0.0195
V1T1W3
(11)
V1T2W3
(7)
V1T3W3
(2)
V1T4W3
(4)
V1T5W3
(15)
V1T6W3
(18)
V2
300
W1
0.0115
V2T1W1
(43)
V2T2W1
(49)
V2T3W1
(37)
V2T4W1
(47)
V2T5W1
(52)
V2T6W1
(40)
W2
0.0150
V2T1W2
(42)
V2T2W2
(39)
V2T3W2
(46)
V2T4W2
(50)
V2T5W2
(45)
V2T6W2
(53)
W3
0.0195
V2T1W3
(54)
V2T2W3
(48)
V2T3W3
(51)
V2T4W3
(38)
V2T5W3
(44)
V2T6W3
(41)
V3
450
W1
0.0115
V3T1W1
(32)
V3T2W1
(22)
V3T3W1
(19)
V3T4W1
(27)
V3T5W1
(24)
V3T6W1
(30)
W2
0.0150
V3T1W2
(36)
V3T2W2
(34)
V3T3W2
(21)
V3T4W2
(31)
V3T5W2
(26)
V3T6W2
(28)
W3
0.0195
V3T1W3
(23)
V3T2W3
(33)
V3T3W3
(35)
V3T4W3
(20)
V3T5W3
(29)
V3T6W3
(25)
Table 2. Measured inlet conditions for each test.
Airflow [m3/h]Specific Humidity [kgv/kgda]DBT [°C]
T1
25 °C
T2
30 °C
T3
35 °C
T4
40 °C
T5
45 °C
T6
50 °C
V1
210
W1
0.0115
25.2 °C 55.0%29.6 °C
45.3%
36.4 °C
30.6%
39.7 °C
30.3%
46.5 °C
17.7%
48.5 °C
15.4%
W2
0.0150
24.6 °C
84.8%
30.5 °C
55.9%
35.9 °C
43.0%
40.0 °C
32.3%
46.0 °C
21.9%
48.5 °C
17.1%
W3
0.0195
25.2 °C
100 %
29.2 °C
71.4%
36.3 °C
55.0%
39.6 °C
48.8%
46.6 °C
29.2%
50.2 °C
22.3%
V2
300
W1
0.0115
25.8 °C
55.8%
30.0 °C
44.8%
34.6 °C
33.7%
39.9 °C
27.4%
45.3 °C
22.0%
51.5 °C
14.6%
W2
0.0150
25.2 °C
71.7%
30.3 °C
60.2%
34.9 °C
45.5%
40.0 °C
39.5%
45.2 °C
29.8%
50.9 °C
20.2%
W3
0.0195
25.3 °C
81.4%
30.0 °C
72.5%
34.9 °C
63.1%
40.8 °C
48.6%
45.9 °C
36.1%
51.6 °C
28.5%
V3
450
W1
0.0115
25.2 °C
58.0%
30.4 °C
43.9%
35.9 °C
31.5%
41.5 °C
30.6%
45.9 °C 16.9%52.0 °C
18.6%
W2
0.0150
25.0 °C
69.7%
30.0 °C
61.6%
35.7 °C
45.3%
41.5 °C
31.6%
46.8 °C
28.8%
48.0 °C
20.8%
W3
0.0195
25.2 °C
93.0%
30.0 °C
69.2%
35.0 °C
58.7%
41.4 °C
47.4%
43.2 °C
39.3%
51.1 °C
23.3%
Table 3. Measured air outlet conditions for each test.
Airflow [m3/h]Specific Humidity [kgv/kgda]DBT [°C]
T1
25 °C
T2
30 °C
T3
35 °C
T4
40 °C
T5
45 °C
T6
50 °C
V1
210
W1
0.0115
20.1 °C 86.0%20.5 °C
87.9%
23.7 °C
77.0%
25.2 °C
83.8%
27.0 °C
87.7%
29.3 °C
83.1%
W2
0.0150
20.1 °C
100%
23.4 °C
97.8%
26.0 °C
95.7%
26.0 °C
91.1%
28.2 °C
88.7%
29.8 °C
74.4%
W3
0.0195
22.7 °C
100%
23.6 °C
100%
26.6 °C
94.0%
27.7 °C
94.1%
30.2 °C
94.5%
32.0 °C
93.4%
V2
300
W1
0.0115
18.8 °C
91.9%
21.4 °C
87.3%
23.5 °C
85.8%
25.9 °C
80.1%
28.2 °C
76.6%
30.3 °C
74.0%
W2
0.0150
20.9 °C
100%
22.9 °C
100%
25.3 °C
92.8%
27.8 °C
88.2%
29.4 °C
81.8%
31.3 °C
74.0%
W3
0.0195
21.6 °C
100%
24.3 °C
100%
27.1 °C
100%
29.0 °C
100%
31.2 °C
90.8%
32.8 °C
84.7%
V3
450
W1
0.0115
19.6 °C
90.0%
22.2 °C
87.6%
25.9 °C
70.5 %
29.1 °C
72.8 %
29.5 °C
71.7 %
34.2 °C
69.5%
W2
0.0150
21.0 °C
100%
23.8 °C
95.8 %
26.3 °C
89.7 %
29.5 °C
74.4 %
32.8 °C
73.5 %
32.1 °C
74.4%
W3
0.0195
23.1 °C
99%
25.7 °C
100%
27.0 °C
98.1 %
30.7 °C
92.1 %
32.0 °C
89.0 %
37.4 °C
68.9%
Table 4. Measured water temperatures for each test.
Airflow [m3/h]Specific Humidity [kgv/kgda]DBT [°C]
T1
25 °C
T2
30 °C
T3
35 °C
T4
40 °C
T5
45 °C
T6
50 °C
V1
210
W1
0.0115
17.1 °C17.7 °C20.0 °C20.9 °C21.6 °C22.1 °C
W2
0.0150
19.9 °C21.3 °C22.0 °C22.6 °C23.5 °C23.7 °C
W3
0.0195
22.2 °C22.7 °C23.0 °C24.4 °C26.0 °C26.7 °C
V2
300
W1
0.0115
16.7 °C18.0 °C19.2 °C20.4 °C21.8 °C22.4 °C
W2
0.0150
20.0 °C20.4 °C21.6 °C22.9 °C22.7 °C24.3 °C
W3
0.0195
21.1 °C21.8 °C23.8 °C24.6 °C24.5 °C25.6 °C
V3
450
W1
0.0115
16.9 °C19.3 °C19.6 °C20.7 °C21.4 °C23.5 °C
W2
0.0150
19.5 °C20.7 °C22.1 °C22.3 °C23.7 °C23.7 °C
W3
0.0195
21.1 °C22.7 °C22.9 °C25.9 °C24.9 °C25.4 °C
Table 5. Airflow and pressure drop registered in the system.
Pressure Drop in the Orifice Plate (Pa)Air volume Flow (m3/h)Pressure Drop in the Fabric EC System (Pa)
7665439
5314516
1792613
951902
Table 6. Airborne particles counted at the fabric EC pad outlet.
MediaAirflow (m3/h)Test No.Particle Size
0.3 µm0.5 µm1 µm5 µm10 µm25 µmTotal
DryV1130049313714958035170429018497689
63047871285045395516942297489176
V222973481296435079512271976479216
42949701225894575010541403464506
V332985921331345299710101039485845
529426812113344317783887460596
WetV173302271125324230511111246486305
83321271117344268812091347487899
V2932756410163433258658704463188
1234676810648534215598722488140
V31033392411025440466798864485532
1133466410543535631553572476342

