Article

Regional Green Eco-Efficiency in China: Considering Energy Saving, Pollution Treatment, and External Environmental Heterogeneity

1
School of Business, Anhui University, Hefei 230000, China
2
School of Economics, Hefei University of Technology, Hefei 230000, China
3
School of Management, University of Science and Technology of China, Hefei 230000, China
*
Author to whom correspondence should be addressed.
Sustainability 2020, 12(17), 7059; https://doi.org/10.3390/su12177059
Submission received: 28 July 2020 / Revised: 22 August 2020 / Accepted: 27 August 2020 / Published: 29 August 2020

Abstract

:
The economy in China has gradually transformed from a stage of high-speed development into one of high-quality development. The current study considers the economic environment, energy saving, and pollution treatment in an integrated way to measure eco-efficiency and external environmental heterogeneity. A modified three-phase data envelopment analysis (DEA) model is constructed to measure ecological efficiency while eliminating interference from both statistical noise and the external environment. The first phase uses a two-stage production structure DEA model considering nondiscretionary input and undesirable output. The model was applied to data for the year 2015 in 30 administrative regions in China, including municipalities, provinces, and autonomous regions. The results of this study show that many factors influence these regions’ eco-efficiency in China, including the levels of economic development, technological innovation, environmental regulation, and industrial structure. Finally, implications and suggestions are given to provincial governments from the perspectives of different industries and of provincial ecological–economic development.

1. Introduction

China’s social economy has developed rapidly since the country’s reform and opening in 1979, development which depends excessively on the inputs of energy and resources, and the expansion of production scale [1]. In 2019, the total energy consumption reached 4.86 billion tons of standard coal in China, and the annual average growth rate of energy consumption rose 3.39% between 2010 and 2019 [2]. This extensive growth pattern caused serious damage to the environment and ecosystems [3]. During 2010–2017, the annual average emissions of sulfur dioxide (SO2) reached 17.97 million tons, and the discharge amount of wastewater and solid waste reached 68.99 billion tons and 1.78 million tons, respectively. Although the SO2 emission is falling at an average rate of 11% a year, the investment in environmental governance is growing at an annual average rate of 3.58% and has reached RMB 953.9 billion Yuan (USD 138.2 billion) [2,4]. This combination of excessive energy consumption and huge waste discharge is forcing China to address energy conservation and pollution treatment [5].
To promote green growth and ecologically sound economic development, the Chinese government has paid increasing attention to both energy conservation and pollution treatment [6]. The Chinese government proposed an “ecological civilization” strategy in 2007, and this national development direction is further emphasized in the 13th Five-Year Plan (2016–2020) [7]. Meanwhile, the economy in China has entered a stage featuring high-quality development rather than the previous high-speed development [8]. Accordingly, people attach more attention to the harmonization of energy saving, pollution treatment, and economic development, striving to maximize production while minimizing resource consumption and environmental pollution, which can be measured by eco-efficiency. According to [9], eco-efficiency is a comprehensive indicator to measure the performance of a production system in terms of economic development, resource use, and environmental impact. Likewise, other papers [10,11] stated that higher eco-efficiency means less resource input and less pollution discharge when generating the same products. By measuring the eco-efficiency of production units and taking into account both resource utilization and pollution treatment, eco-efficiency is a pivotal approach to saving energy and improving pollution treatment [12].
Meanwhile, eco-efficiency has aroused wide concern in academic discussion over the past few decades. The term eco-efficiency was proposed by [13], emphasizing that sustainable development should consider both economics and environmental protection [14]. Eco-efficiency is one of the main criteria to measure green performance, and it works as a valuable tool for achieving sustainable development [15,16]. Since then, many studies have focused on eco-efficiency evaluations in different aspects, such as air eco-efficiency and water-cycle eco-efficiency [17,18]. More generally, eco-efficiency assessment is applied to a wider range at the regional level so that it can represent a region’s competitive advantages [19,20]. However, there is currently a lack of research considering both external environmental heterogeneity and internal structural heterogeneity in China when evaluating the eco-efficiency. Ignoring external environmental heterogeneity can lead to untargeted regional development, and ignoring internal structural heterogeneity fails to adequately investigate either energy saving or pollution treatment. Evaluating eco-efficiency can help regional governments precisely target specific problems [21], such as energy saving or pollution treatment; such evaluations are important prerequisites for policymaking. It is of great significance for China’s environmental protection strategy to explore the causes of low ecological efficiency in different regions and to ensure the smooth implementation of specific measures for sustainable economic development [22].
The purpose of the current study is to measure the green eco-efficiency of China at the provincial level considering the economic environment, energy consumption, and pollution treatment. More specifically, we decompose the green eco-efficiency into energy consumption efficiency and pollution treatment efficiency, and further investigate the influence of government support, urbanization level, industrial structure, and energy consumption structure on eco-efficiency.
As the noteworthy contributions of the current study, we can highlight several points as follows. At the practical level, the current study investigates green eco-efficiency and decomposes it into energy saving efficiency and pollution treatment efficiency by using a two-stage data envelopment analysis (DEA) technique. The decomposition of eco-efficiency can further clarify the task of energy saving and emission reduction. Furthermore, the current study estimates the effects of different factors on redundant resources and eco-efficiency. There are few previous studies in this regard, and this study can help the government to identify the factors that affect the eco-efficiency. This step of identification is an important task to understand the current environment and further to improve the management of these aspects.
At the methodological level, while the three-phase DEA approach is often applied to study environmental heterogeneity, we propose a two-stage structure in the first phase since pollutants are produced and treated in different stages. The new combination of these two approaches allows the investigation of internal production processes and the external environment at the same time. Moreover, this study classes the input resources into nondiscretionary ones and discretionary ones, which is better for dealing with practical problems since, in practical operation, not all inputs can be reduced at will. Finally, a novel two-dimensional and efficiency-change-based matrix diagram is presented to evaluate the influence of environmental factors on provincial eco-efficiency in China. The results of the current study can provide policy guidelines for decision makers of provincial governments and help improve provincial eco-efficiency from a macroperspective.
Section 2, Section 3, Section 4, Section 5 and Section 6 of the current study are organized as follows. A literature review regarding eco-efficiency is put forward in Section 2, and research hypotheses are given based on the literature. Section 3 proposes the methodology of an improved three-phase DEA model. Section 4 selects the input and output variables, and considers the influencing factors. Section 5 presents the results and findings of empirical analysis, and the discussion and conclusions are presented in Section 6.

2. Literature Review and Hypotheses

2.1. Overview of Eco-Efficiency

While [13] first proposed the meaning of eco-efficiency, the concept defined by [23] is more popular in studies, the meaning of which is that achieving the development of economy and ecology is as important as reducing resource consumption and environmental pollution. Additionally, Reference [24] considered eco-efficiency as a very important index to reflect the green performance of a production unit; Reference [25] used an eco-efficiency indicator to examine the relationship between environmental protection and economic development. Meanwhile, Reference [26] investigated green economic development by using an eco-efficiency indicator, aiming to promote economic development and environmental improvement in China. The eco-efficiency of different industrial sectors has been increasingly investigated, including the steel industry sector [27], paper industry [28], and wastewater treatment facilities [17]. These studies on sectoral eco-efficiency first determined the sectoral benchmark in terms of the ratio of output to input and then compared other production units to the benchmark to obtain the eco-efficiency value of the production unit to be evaluated [7]. From the perspective of regional level, eco-efficiency will shed light on the competitive advantages of production units in a region [19], thereby helping government target and solve region-specific problems [29].
As one of the most common tools to evaluate efficiency, DEA is a linear mathematical programming approach using a production frontier to measure the efficiency of a group of decision making units (DMUs) [30]. This approach was first proposed by [31], and we identify their original technique as CCR-DEA (Charnes, Cooper, and Rhodes). In some DEA models, both desirable and undesirable outputs are included as output variables [32]. One effective way to build new DEA models is the slack-based measure (SBM) approach, which is used to incorporate analysis of undesirable outputs [33,34]. Much previous research exists to evaluate eco-efficiency based on SBM, such as [35,36]. More precisely, [37] and [38] employed the DEA approach to assess industrial eco-efficiency in different regions. Some scholars studied the industrial eco-efficiency in some specific provinces, such as Anhui province [39] and Fujian province [35]. However, most classical DEA models regard the production system to be a black box, which means that there is a lack of performance analysis on the possible subsystems [40]. Therefore, based on the network production process, two-stage production structure DEA models have been proposed to open the black box of DMUs [41,42]. Two-stage production structure SBM models have also been proposed, aiming to access the eco-efficiency of production and pollution treatment processes, respectively [43,44].
Although the DEA model has a very wide range of applications in research on regional and sectoral eco-efficiency assessment [45,46], a few studies have adopted a two-stage production structure DEA approach [46,47]. In fact, internal mismanagement and external environmental factors are the two reasons that lead to the inefficiency of systems [48,49]. A three-phase DEA model, combining a basic, nonparametric DEA model with a parametric approach (stochastic frontier analysis (SFA)) was developed to reveal the real efficiency level [7], because it not only could eliminate the impacts of the exterior environment but also could remove the influence of statistical noise on the efficiency measurement. The current paper uses a similar three-phase model, but one which considers the internal structure of each DMU in the first phase.
Meanwhile, many researchers have studied the characteristics of input variables [49]. Usually, an input variable in a DEA model is used to indicate the use of a resource, so smaller values of the input variable are always considered to be better. It is more realistic, however, to divide the input variables in DEA models into different kinds, because some inputs need not or cannot be reduced, such as fixed assets. When evaluating economic development efficiency, the labor resource is always used as an input variable, but managers are not supposed to decrease it arbitrarily because decreasing the labor input might bring social problems such as unemployment [50]. Considering this situation, input variables should be classified as discretionary (also called disposable) if they can be reduced and nondiscretionary otherwise. Most previous research efforts focused on how to dispose of various outputs in the midst of evaluating environmental efficiency, rather than the characteristics of input variables.
To date, research on DEA and eco-efficiency index has made great progress in theory and practice. However, the current literature does not fully consider the combination of the above issues. While some studies have employed a three-phase DEA model [51], few such studies have considered the features of the input variables. Because of the differences of regions in economic structure and input variable features, the traditional methods can neither avoid the impacts of statistical noise and exterior environment on eco-efficiency assessment nor distinguish different input resources. As a result, there is a lack of Chinese provincial eco-efficiency evaluations considering both internal structure and external environmental influence factors. To fill this gap in the literature, the current study uses the three-phase DEA approach, with the first phase using a two-stage production structure DEA model that considers both discretionary and nondiscretionary inputs.

2.2. Hypotheses

In addition to the relevant variables contained in the previous indicator systems, ecological efficiency is also affected by other factors [52,53]. A broad literature review shows that environmental regulation, industrial structure, economic development, and technological progress all affect eco-efficiency [54,55]. Considering the regional factors, environmental factors that have been proven to affect regional eco-efficiency include government support and urbanization level [56,57]. Therefore, the scope of environmental influence factors that may affect eco-efficiency should be determined. According to [57], the exterior environment, random events, and internal management are the main factors that cause DMU inefficiency in the scenario of our three-phase DEA evaluation. Internal management mainly affects the inside situation of the DMU, and random events cannot be manipulated by the DMU’s decision maker. Therefore, the analysis of the factors affecting eco-efficiency should focus on the macroeconomic environmental variables. The current paper discusses the influencing factors according to different production stages.
Based on [58] and the different production stages, the following influence factors are selected: government support, urbanization level, industrial structure, energy consumption structure, scientific and technological progress, economic development level, and environmental regulation. Furthermore, following [59], the influence factors are set as explanatory variables, and the input resource redundancies are set as explained variables, when the regression part of the three-phase DEA model, namely the SFA model, is established. The government support, industrial structure, and urbanization level mainly affect eco-efficiency in the production stage, whereas technological progress, environmental regulation, and economic development mainly affect eco-efficiency during the process of pollution treatment. In addition, the energy consumption structure affects the undesirable output in the first production stage, but it also influences the industry’s investment in technology for the pollution treatment stage.
  • Hypothesis 1 on Government Support and Resource Utilization
Government support refers to the contribution of local financial expenditure in economic development [60], which is represented in our study by the rate of local financial expenditure to GDP. Moreover, the financial expenditure is of importance in investing in the high-tech sector and infrastructure construction. The investment in sectors related to high-tech and infrastructure construction can promote input resource utilization, technological progress, and efficiency improvement [61]. Accordingly, a hypothesis about government support and energy saving efficiency is proposed as below:
Hypothesis 1 (H1).
Greater government support promotes resource utilization and brings a higher level of energy saving efficiency.
  • Hypothesis 2 on Urbanization Level and Resource Utilization
The rapid development of urbanization plays an important role in the ecological environment of China. According to [62], urbanization can improve environments because of environmental protection and urban green construction. However, [63] stated that rapid urbanization can bring greater energy consumption and lead to ecological–environmental problems. Since urbanization can influence the input of resource utilization in different ways, we should test the influence of urbanization on resource utilization, and therefore we develop the hypothesis below:
Hypothesis 2 (H2).
A higher urbanization level improves resource utilization and brings a higher level of energy saving efficiency.
  • Hypothesis 3 on Industrial Structure and Resource Utilization
The regional industrial structure refers to the proportion of different industries in the national economy development. It has a key impact on the environment by consuming energy [64,65], but it also can reflect the regional environmental quality [7]. Accordingly, the environmental quality will change when the industrial structure changes. Research described in [35] ascertains that high consumption of resources in the secondary industry has an inhibitory effect on energy saving efficiency. Therefore, the following hypothesis is proposed:
Hypothesis 3 (H3).
A smaller proportion of secondary industry improves resource utilization and brings a higher level of energy saving efficiency.
  • Hypothesis 4 on Energy Consumption Structure and Resource Utilization
The utilization of clean energy plays an important role in energy consumption and pollutant discharge. Using clean energy and reducing pollutant discharge has become an inevitable trend accompanying the increasing demand for environmental protection [66,67]. Clean energy resources will do wonders for environmental protection in the future. According to [67], a higher proportion of clean energy consumption leads to higher eco-efficiency values. Therefore, we infer that the utilization of clean energy will promote both energy saving and pollutant treatment, and propose the following hypothesis:
Hypothesis 4 (H4).
A larger proportion of clean energy consumption improves resource utilization and brings a higher level of energy saving efficiency and pollution treatment efficiency.
  • Hypothesis 5 on Technological Progress and Resource Utilization
Technological progress means the improvement of production technology and green manufacturing [68]. Technological innovation is playing an important role in improving environmental performance in terms of efficiency [48], and it also promotes pollution treatment [36]. According to [7], the technological progress in emission reduction is a key driving factor that promotes sustainable development. Therefore, the following hypothesis linking technological progress and pollution treatment efficiency is proposed:
Hypothesis 5 (H5).
Technological progress reduces investment in industrial pollution control and improves pollution treatment efficiency.
  • Hypothesis 6 on Environmental Regulation and Resource Utilization
According to [69], environmental policy is a critical way to promote the green development of regional industries. These policies are made to protect the environment and prevent pollution discharge by restricting the production activities in economic development. Such policy measures are called environmental regulation, and it includes legal regulations, market guidance, and other management measures [70]. The regulation can promote the improvement of environmental quality [71]. Considering these studies, we propose a hypothesis linking environmental regulation and pollution treatment efficiency:
Hypothesis 6 (H6).
Less environmental regulation reduces investment in industrial pollution control and degrades pollution treatment efficiency.
  • Hypothesis 7 on Economic Development and Resource Utilization
Chinese people have been paying increasing attention to the pursuit of a beautiful living environment, along with the rapid development of the economy [72]. The more the economy develops, the more technological progress will be applied, and the more beautiful the living environment will become. People’s pursuit of a better living environment is conducive to the improvement of pollution treatment efficiency [73]. Therefore, the following hypothesis is developed:
Hypothesis 7 (H7).
A higher economic development level leads to better resource utilization.
All the environmental influence factors relating to these hypotheses are measured in Section 4.2.

3. Methodology

Three phases constitute this method of performance evaluation while compensating for statistical noise and environmental effects. In phase one, a two-stage production structure DEA model is used to process the input and output data and acquire an initial eco-efficiency evaluation of the provinces, containing the efficiency of energy conservation and pollution control in two stages. This assessment does not consider factors such as the operating environment and statistical noise on the two-stage production process. In phase two, the SFA model indicates if factors in the process of the energy saving and pollution treatment, including the impact of environment, inefficiency of management, and statistical noise, caused variations in the initial eco-efficiency evaluation. In phase three, based on the result in phase two, the DMUs’ inputs are adjusted, after which the first-phase analysis is repeated using the adjusted data. Improvement suggestions for management efficiency can be provided after the third-phase re-evaluation of eco-efficiency since the effect of other factors has been eliminated in the second phase’s SFA regression. This paper uses this three-phase DEA approach, with the two-stage production structure DEA model, to research energy saving and pollution treatment because it considers exterior environmental heterogeneity affecting eco-efficiency.

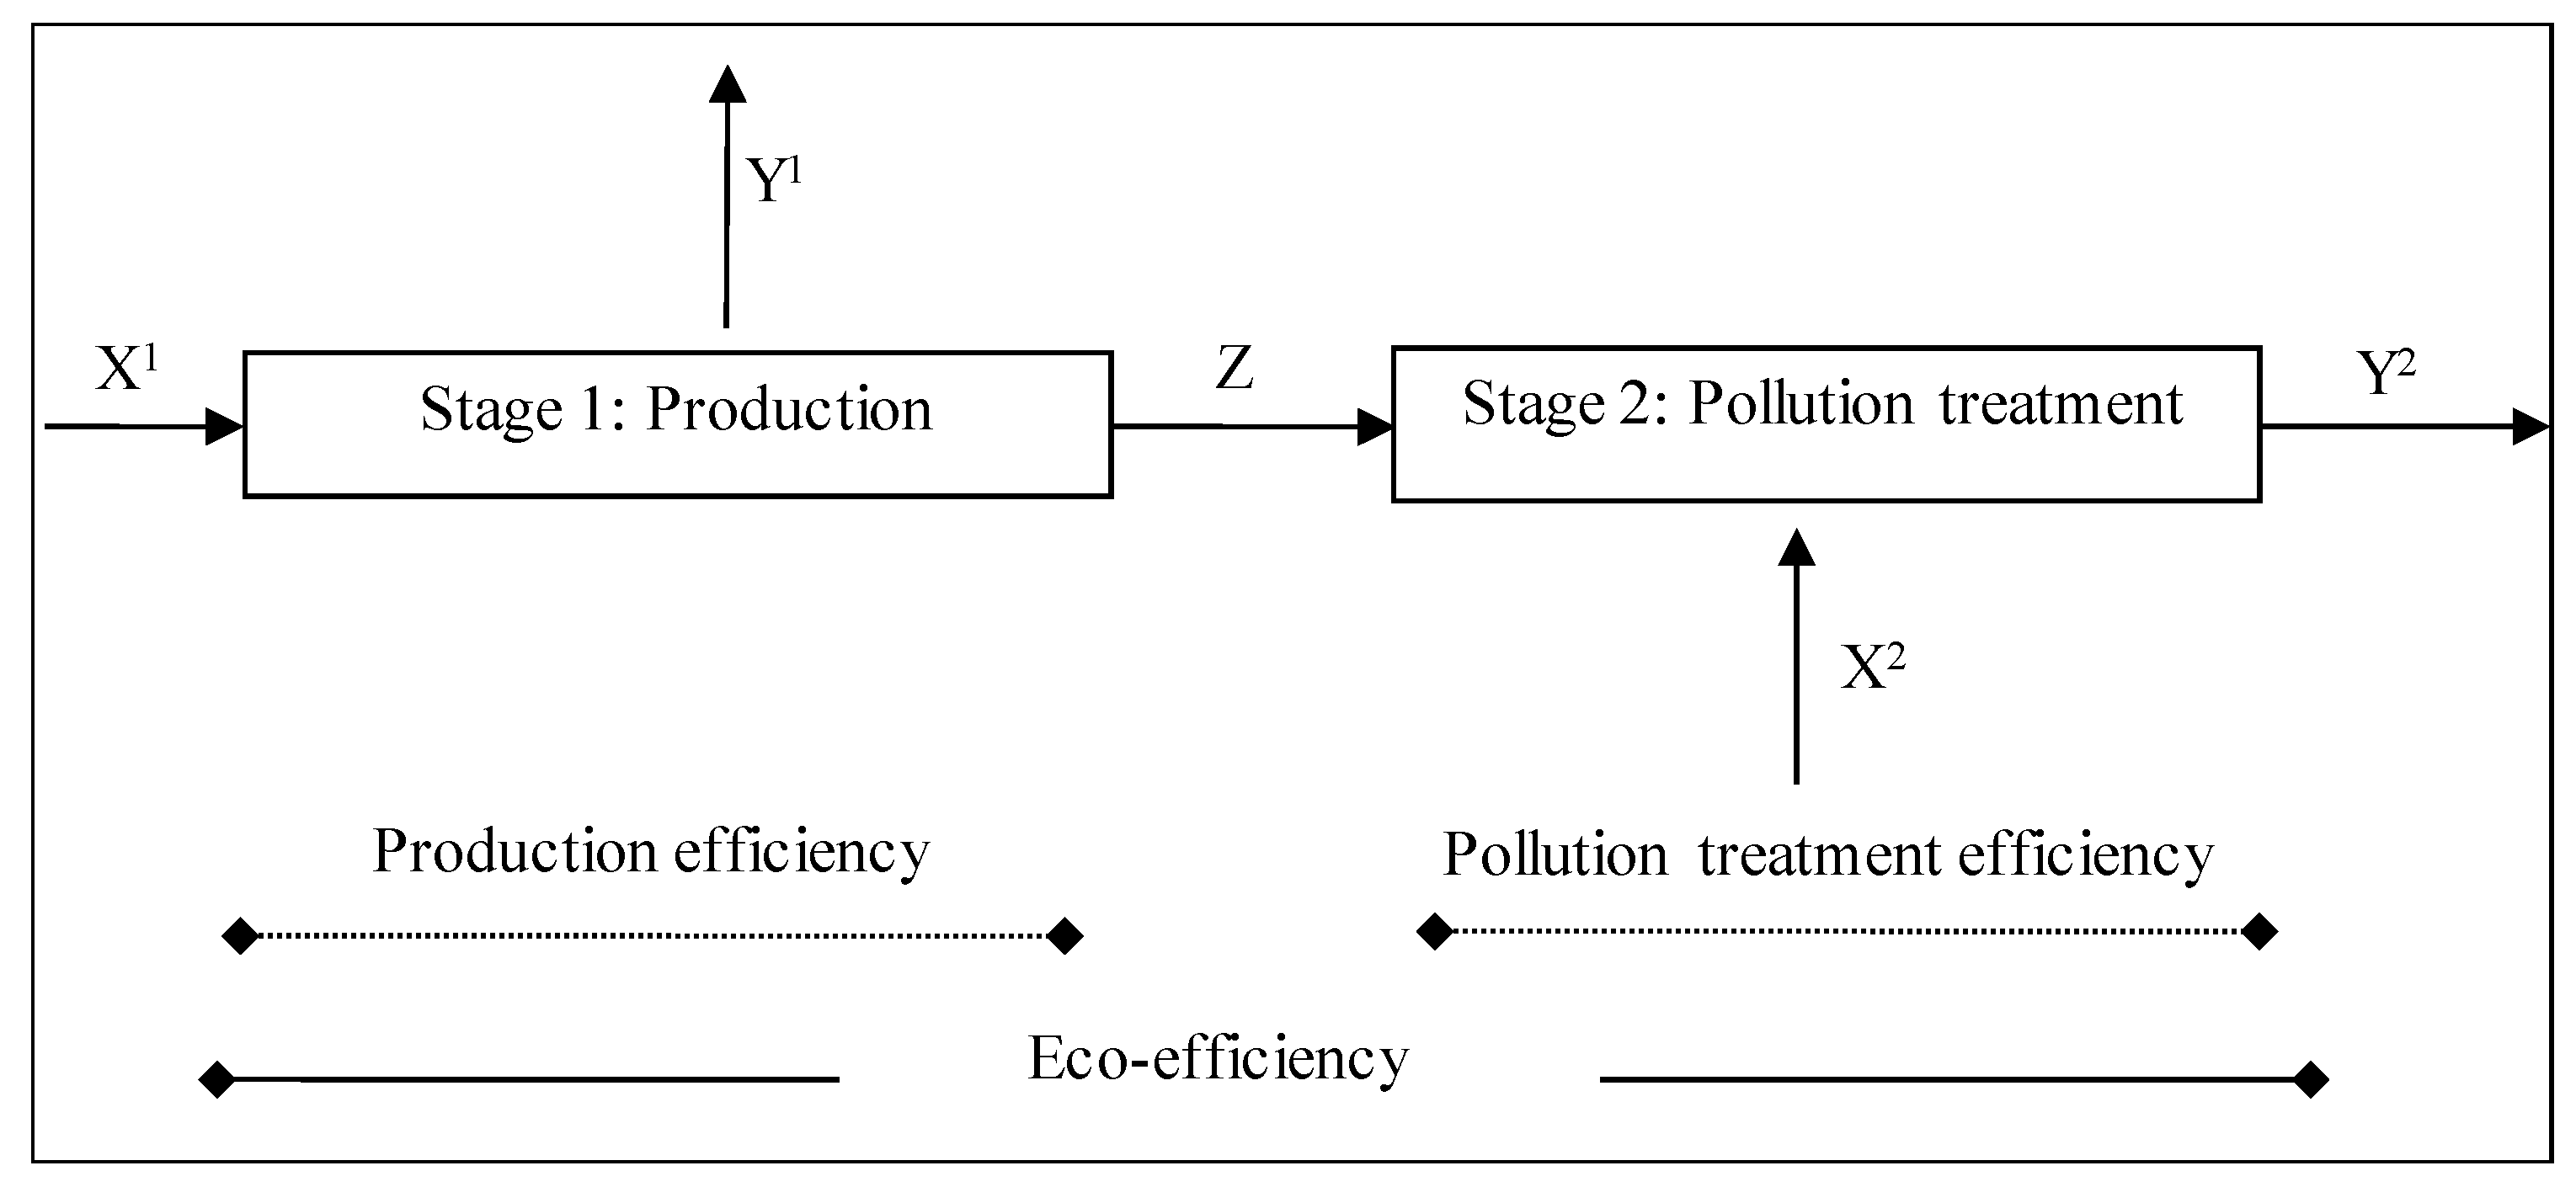
3.1. Phase One: Initial Eco-Efficiency Evaluation Using a Two-Stage Production Structure DEA Model

The process of ecological, economic activity should be divided into two stages, as suggested by [52], with the production and treatment of pollutants considered to be in different stages. Desired outputs are obtained via energy and other inputs, accompanied by undesirable outputs during the production stage, while the intermediate output and the undesirable outputs produced in the production stage are regarded as inputs in the pollution treatment stage, as depicted in Figure 1.
Assume that there are n DMUs. In the production stage, R desirable outputs are produced by M discretionary inputs, while I undesirable outputs are produced by H nondiscretionary inputs. The mth discretionary input, hth nondiscretionary input, pth undesirable output, and rth desirable output of the DMUj are denoted by xmj, x h j n , zpj, and yrj, respectively. In the process of pollution treatment, the input to this stage is the undesirable output that is produced in the production stage, and the undesirable output of the production stage is handled by using L additional inputs to produce U outputs. The formula for the production possibility set (PPS) of all the DMUs to be evaluated is defined as:
T D E A = ( ( X , X N , Y , Y b ) + m + s | X j = 1 n u j X j , X N = j = 1 n u j X j N , Y j = 1 n u j Y j , Y b j = 1 n u j Y j b ; j = 1 n u j = 1 , u j 0 )
Using this PPS, models are constructed based on an SBM approach to evaluate the production and pollution treatment stages. Our SBM model for the first production stage is constructed using Formula (1):
min 1 1 M i = 1 I s m 1 / x m o 1 1 P p = 1 P s p 1 / z p o 1 + 1 H h = 1 H s h 1 + / y h o 1 s . t . j = 1 n x m j 1 λ j 1 + s m 1 = x m 0 1 , m = 1 , , M . j = 1 n y r j 1 λ j 1 s r 1 + = y r 0 1 , r = 1 , , R . j = 1 n x h j 1 N λ j 1 = x h 0 1 N , h = 1 , , H . j = 1 n z p j λ j 1 + s p 1 = z p 0 , p = 1 , , P . j = 1 n λ j 1 = 1 , j = 1 , , n .
Formula (1) is used to compute the efficiency score in the production stage, which is called the energy saving efficiency and is at most 1. All of the outputs, including both undesirable and desirable outputs, are generated by the resources and other inputs in this stage. Letting “0” denote the DMU being evaluated, DMU0 is efficient in the energy saving stage if and only if the optimal result value is equal to 1, which signifies all the slack variables equal zero. Any inefficient DMU should decrease discretionary inputs or undesirable outputs and increase desirable outputs to improve performance; these are the only options since the nondiscretionary inputs are unchangeable. Undesirable output produced in the production stage is regarded as input in the pollution treatment stage. The model to calculate the performance of pollution treatment stage is given as Formula (2):
min 1 1 L i = 1 L s l 2 / x l o 2 1 + 1 U u = 1 U s u 2 + / y u o 2 s . t . j = 1 n x t l 2 λ j 2 + s l 2 = x l 0 2 , l = 1 , , L . j = 1 n y u j 2 λ j 2 s q 2 + = y u 0 2 , u = 1 , , U . j = 1 n z k j λ j 2 = z k 0 , k = 1 , , K . j = 1 n λ j 2 = 1 , j = 1 , , N .
In the pollution treatment process, the undesirable output produced in the first stage is regarded as nondiscretionary input because of the fixed amount in the treatment stage. The efficiency result of Model (2) is called the “pollution treatment efficiency.” Referring to the solution results of Model (1), we can derive that DMU0 is efficient on the condition of the optimal result of Model (2) equals 1, and the smaller the result value of Model (2), the more effective the evaluated DMU.
Using the “fixed-link” method between the production and pollution treatment stages, a combined model of the overall eco-efficiency of DMU can be established, as shown in Formula (3). The overall eco-efficiency score is the optimal result of Formula (3).
min 1 1 M i = 1 I s m 1 / x m o 1 1 P p = 1 P s p 1 / z p o 1 + 1 H h = 1 H s h 1 + / y h o 1 s . t . j = 1 n x m j 1 λ j 1 + s m 1 = x m 0 1 , m = 1 , , M . j = 1 n y r j 1 λ j 1 s r 1 + = y r 0 1 , r = 1 , , R . j = 1 n x h j 1 N λ j 1 = x h 0 1 N , h = 1 , , H . j = 1 n z p j λ j 1 = j = 1 n z k j λ j 2 = z k 0 , p = 1 , , P . j = 1 n x t l 2 λ j 2 + s l 2 = x l 0 2 , l = 1 , , L . j = 1 n y u j 2 λ j 2 s q 2 + = y u 0 2 , u = 1 , , U . j = 1 n λ j 1 = 1 , j = 1 n λ j 2 = 1 , j = 1 , , N .

3.2. Phase Two: External Environment and Statistical Noise Elimination by Applying SFA

Two slack variables, s m 1 and s l 2 , reflect the original management inefficiency [53]. Nevertheless, these slack variables are composed of three effects: impacts of the environment, management inefficiency, and statistical noise generated by measurement errors in the first phase. We use the SFA model to decompose these slack variables. In this phase, the observable environmental variables and a composed error term are regressed with slack variables so that the impacts of management inefficiency and statistical noise can be captured and distinguished. The general SFA regression form is expressed in Model (4):
s c j = f c ( z j ; β c ) + ν c j + μ c j , c = 1 ,   2 ,   ,   m + l ;   j = 1 , 2 , , n ,
where s c j denotes that the c-th input redundancy of the DMUj. The f c ( z j ; β c ) are deterministic feasible slack frontiers with parameter vectors β c to be estimated. The error item is represented by ( ν c j + μ c j ). The z j are the observable environmental variables. Consistent with a stochastic frontier formulation, we assume that ν c j N ( 0 , σ v 2 ) reflects statistical noise and managerial inefficiency is represented by μ c j N + ( 0 , σ μ 2 ) . The ν c j and μ c j are two mutually independent random variables. In addition, based on maximum likelihood techniques, the m + l regressions in Model (4) can be assessed. The m + l input slack regressions allow all parameters change in this process, which means the inputs can be affected by every environmental variable, the statistical noise, and managerial inefficiency in various ways.
After the regression, the inputs can be adjusted, as shown in Model (5):
x ^ c j = x c j + [ max j { z j β ^ c } z j β ^ c ] + [ max j { v ^ c j } v ^ c j ] ,
c = 1, 2, …, m + l; j = 1, 2, …, n,
where x ^ c j and x c j are the adjusted and observed input quantities, respectively. There are some adjustments in this model, represented by the two bracketed parts in the right-hand side of Model (5). The initial adjustment process places all DMUs in the same operating environment, which is the worst case observed in the sample. In the second adjustment, all DMUs are assumed to be in a natural, general situation, which is undesirable in the sample. These adjustments are different among DMUs and inputs [50].

3.3. Phase Three: Eco-Efficiency Evaluation by Using Formulas (1)–(3) with the Adjusted Inputs

Phase three repeats phase one, with the observed input data x c j replaced by x ^ c j , which have been adjusted in order to compensate for the effects caused by observable environmental factors and statistical noise. The output of the third stage is the performance evaluation based on this paper’s DEA model, which takes into account the actual eco-efficiency, the impact of the operating environment, and the statistical noise.

4. Variables and Data

4.1. Input and Output Variables and Data Description

In this section, the eco-efficiency of 30 DMUs, including provinces, autonomous regions, and municipalities in mainland China are measured by the new models using data from 2015. There are five input variables and five output variables in the evaluation of energy saving efficiency, including two nondiscretionary inputs, three discretionary inputs, two desirable outputs, and three undesirable outputs. In the pollution treatment efficiency evaluation, nondiscretionary inputs are the undesirable outputs during the production process, along with one additional discretionary input and two additional desirable outputs. All the data are collected from the “China Environmental Statistics Yearbook (2016)”. All variables are described in Table 1.

4.2. Influence Factors Indexes and Data Description

All the environmental variables are measured as follows. Government support is represented by the rate of local financial expenditure to GDP. The percentage of city population to total population is the index of urbanization level. The ratio of secondary industry’s added value to GDP is used to measure industrial structure. The rate of nonclean energy consumption to total energy consumption represents the energy consumption structure. The proportion of research and experimental development funds to GDP is the index of technological progress. Finally, the ratio of local fiscal environmental protection expenditure to GDP represents environmental regulation. All the sample data adopted in this article come from the China Statistical Yearbook 2016. Table 2 describes the data statistically.

5. Empirical Results Analysis

In the second phase of our three-phase DEA approach, the SFA method for regression is applied, in which the labor, total fixed assets investment, energy consumption, industrial water consumption, total electricity consumption, and investment in industrial pollution control are treated as explained variables, and the explanatory variables are environmental factors. If the regression coefficient is positive, then the slack quantity of the corresponding dependent variable will increase, leading to an increase of resource redundancy, which may reduce the efficiency score of the DMU. On the contrary, a negative regression result of an independent variable will improve the efficiency score.
As shown in Table 3, the regression values γ of input variables are all close to one, indicating the existence of inefficiency. In addition, environmental factors affect most of the inputs significantly, although they have no significant effect on the resource redundancy of some input variables. The specific analysis follows.

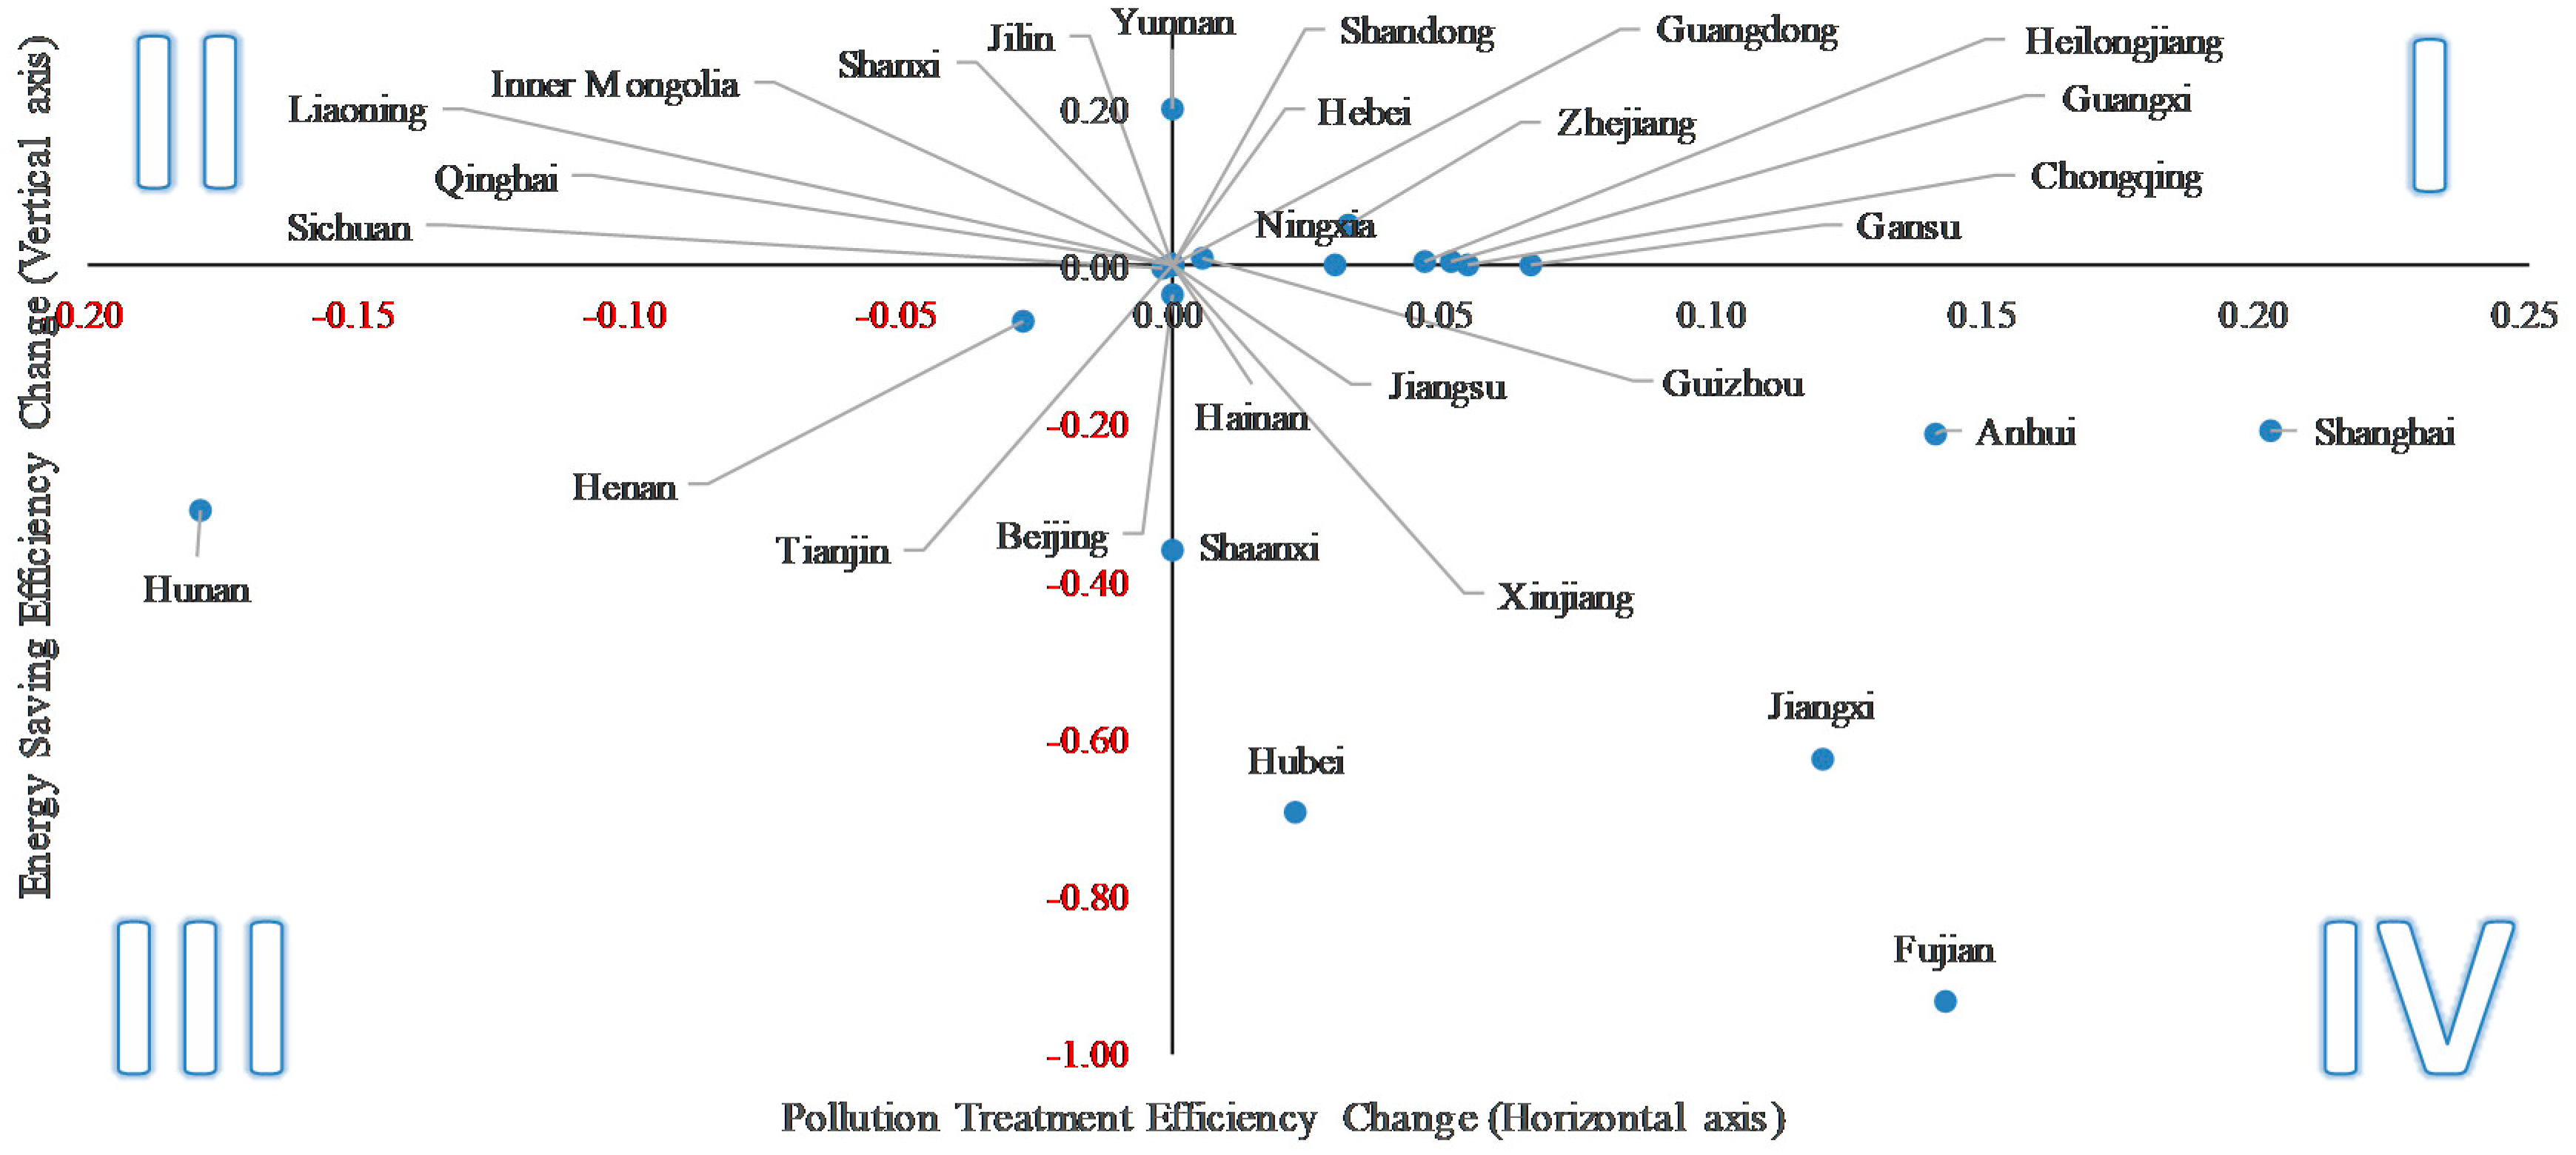
5.1. Effect of External Environment on Energy Saving Efficiency

Government support: The regression coefficients of government support relating to labor, industrial water consumption, and total electricity consumption are negative, negative, and positive, respectively, and significant at the 1%, 10%, and 5% levels. These results show that enhanced government support will cause personnel redundancy to increase, water redundancy to decrease, and electricity consumption redundancy to increase.
Urbanization level: The regression coefficients relating to labor, total fixed asset investments, and energy consumption are all negative but not significant except for labor (significant at 1%), implying that improving the urbanization process can significantly reduce redundancy in employees. Meanwhile, the coefficient of annual electricity consumption redundancy is positive and significant at 1%, implying that improving the urbanization process will save electricity significantly.
Industrial structure: The regression results of labor and industrial water consumption are significant at the 1% level, and the coefficient is positive, suggesting that increasing the percentage of the secondary industry will raise the redundancy of employees and industrial water consumption, which may adversely affect eco-efficiency.
Energy consumption structure: The regression result of labor and industrial water consumption are significant at 1% and 5%, respectively, and the coefficient is negative, suggesting that energy consumption negatively influences both the redundancy of staff and consumption of industrial water, which could reduce the eco-efficiency. In addition, the coefficient for total electricity consumption is positive and significant at the 5% level, indicating that growth in the percentage of nonclean energy will increase the annual electricity consumption redundancy. There is mutual substitution between nonclean energy and electricity, which is consistent with the classification of energy structure in this paper.

5.2. Effect of the External Environment on Pollution Treatment Efficiency

The exterior environment analysis mainly focuses on the factors affecting input resources in the pollution treatment process, including technological progress, environmental regulation, economic development, and energy consumption structure. As seen in Table 3, the regression coefficients of technological progress, economic development, and energy consumption structure to pollution control investment redundancy are positive, negative, and positive, respectively (significant at 5%, 1%, and 10%). These results indicate that: (a) technological progress can effectively improve the utilization of various resources, and make the current investment more redundant; (b) economic development will increase the demand for self-benefiting investment in pollution and improve the utilization of current resources; and (c) the energy consumption structure can increase the investment redundancy of pollutant treatment to a certain extent, that is, a higher ratio of nonclean energy forces the technology to progress further and improve the level of pollutant treatment.

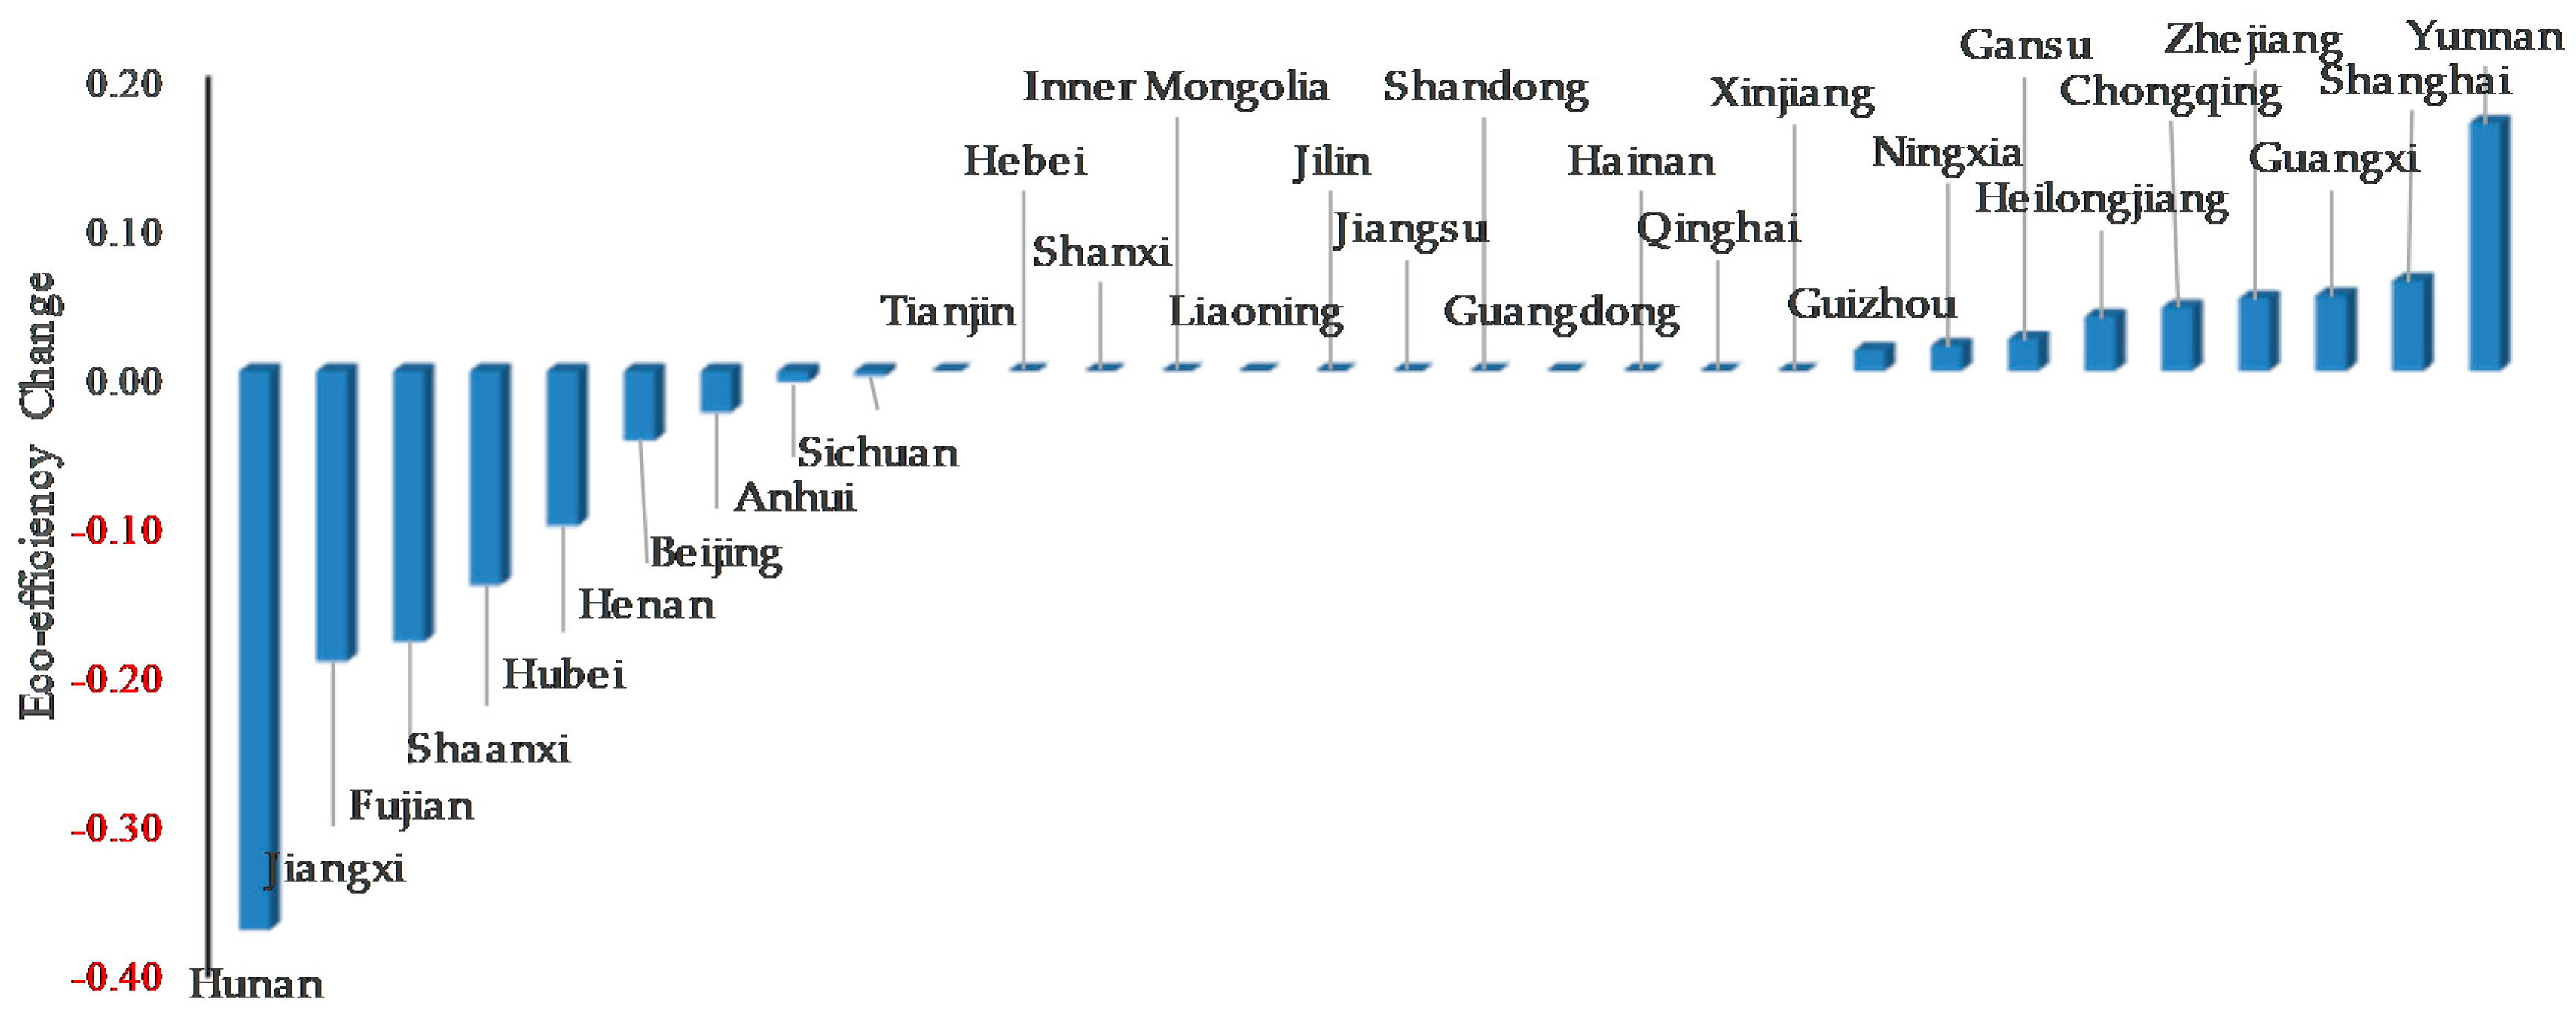
5.3. The Analysis of Initial and Adjusted Eco-Efficiency

The initial and adjusted provincial eco-efficiencies of 30 provinces in China are shown in Table 4, which contains two parts: energy saving efficiency and pollution treatment (control) efficiency. By eliminating the influence of the external environment and statistical noise, the adjusted efficiency score results can be obtained.
The last row of Table 4 shows that the mean energy saving efficiency rose from 0.9186 to 0.9421 due to the adjustment, reflecting an increase of 3.35%. We can conclude that the exterior environmental factor increased the redundancy of energy input and resulted in a lower energy saving efficiency. Meanwhile, the average value of pollution treatment efficiency has a downward trend, from 1.3011 to 1.4073, indicating that the exterior macroenvironment had a positive influence on the efficiency of pollution treatment. The eco-efficiency is derived from the joint action of the efficiency of pollution treatment and energy saving, which decreased from 0.7773 to 0.7565 after the adjustment that resulted from the decline of pollution treatment efficiency. Although compensating for the exterior environmental factors improved the overall efficiency by improving the pollution treatment efficiency, some environmental factors are negatively correlated to the energy saving efficiency; for instance, an increase in the proportion of the secondary industry leads to a decline in the utilization of energy investment.
In order to analyze the contrasts after the adjustment, the variation trends of energy saving efficiency and pollution treatment efficiency are portrayed in four quadrants in Figure 2.
Provinces where both energy-conserving efficiency and pollution control efficiency increase after adjustment are in Quadrant I (top right). For example, the energy saving and pollution treatment efficiency of Zhejiang province rise when the influence caused by environmental factors is eliminated. Provinces where the energy saving efficiency increases but pollution treatment efficiency decreases are in Quadrant II (top left), but there are no provinces in the interior of this quadrant. Provinces where both energy saving efficiency and pollution treatment efficiency decrease are in Quadrant III (bottom left). The energy saving efficiency and pollution treatment efficiency have a downward trend after the adjustment, indicating that the macroenvironmental factors in, for example, Hunan province, actively promoted the eco-efficiency from the perspectives of both energy saving and pollution treatment. Quadrant IV (bottom right) includes provinces for which the energy saving efficiency increases, but pollution treatment efficiency decreases. There are many provinces in this quadrant. The pollution treatment efficiency changes of Anhui, Jiangxi, Hubei, Fujian, and Shanghai are obvious. Furthermore, the pollution treatment efficiency in Fujian province declined the most. In other words, the macropolicy plays a remarkably positive role in promoting pollution treatment efficiency in Fujian province.
Furthermore, the changing of provincial eco-efficiency is described in Figure 3. As can be seen, after eliminating the macroenvironmental effect, the eco-efficiencies of Yunnan, Shanghai, and Guangxi increased, and the eco-efficiency in Hunan, Jiangxi, Fujian, Shanxi, Hubei, and Henan decreased. That is to say, the macroenvironmental influence factors in this investigation improved the eco-efficiencies of Hunan, Jiangxi, and other provinces where the efficiency change is negative in Figure 3.

5.4. Implications and Suggestions

As analyzed previously, Chinese provincial eco-efficiency (incorporating energy saving efficiency and pollution treatment efficiency) has room for improvement. Based on our empirical research results, we point out several implications for provincial governments and give directions for future policymaking as follows.
First, government support should be focused on local fiscal expenditure. This measure can effectively reduce the redundancy of labor and fixed assets while also providing more jobs to improve the provincial eco-economy. Furthermore, the provincial government should control power conservation to improve energy saving efficiency.
Second, the urbanization process should be accelerated. The acceleration of urbanization provides more jobs and increases the saving of electricity consumption. Therefore, urbanization can effectively improve the provincial eco-efficiency by reducing electricity consumption.
Third, the industrial structure should be adjusted. Specifically, the proportion of the secondary industry in the national economy should be reduced. Any increase in the ratio of secondary industry could reduce the eco-efficiency because of the positive impact of industrial structure on the redundancy of labor and industrial water consumption. With the continuous improvement of artificial intelligence, industry in China is gradually changing from labor-intensive to technology-intensive, leading to an increase of redundancy. Thus, redundant resources could be transferred from secondary industry to other industries.
Fourth, the empirical results show that the ratio of nonclean energy consumption positively impacts the industrial water consumption and labor, thereby implying that provincial governments should actively improve the utilization of clean energy through multiple measures such as technological innovation, regulation of the structure of energy consumption, and reduction of the ratio of nonclean energy. The development of reliable and clean energy carriers is a prerequisite for the effective utilization of resources, environmental improvement, and economic and social development.
Finally, the provinces where eco-efficiency declines after compensating for the environmental impact are all situated in the central and western regions of China, with Beijing as an exception. From this point of view, it seems that the environment plays a crucial positive role in raising the level of eco-efficiency of provinces with relatively underdeveloped economies. Therefore, provincial governments should continue to increase their support in line with current policies.

6. Discussion and Conclusions

6.1. Discussion

Many previous studies have pointed out the importance of sustainable development, and ecological efficiency is the main standard to measure sustainable green development. On this basis, many scholars (e.g., [11,38]) use DEA methods to calculate ecological efficiency and evaluate the impact of different environmental factors on ecological efficiency. While the DEA models they proposed can improve discrimination of efficiency, they are insufficient to investigate realistic problems. Furthermore, the methods used have many deficiencies that are not conducive to the formulation of policy by local governments, such as a lack of performance analysis of possible subsystems and little analysis of provincial ecological efficiency. Therefore, this paper uses a modified three-phase DEA method to evaluate the eco-efficiency from the provincial point of view, evaluating the impact of environmental factors on eco-efficiency. The current research results are consistent with those of some previous scholars [7], confirming that environmental factors have various impacts on the eco-efficiency of each province. The current study also reveals that the efficiency of pollution control in each province is affected by environmental factors. The results also show that after eliminating the environmental impact, the eco-efficiency level of each province varies greatly. Looking at the data as a whole, eco-efficiency still has potential for improvement in order to achieve green development, and all regions should formulate development strategies based on their individual characteristics.
The limitations of this study are as follows: (1) Due to the limited availability of data, only 30 provinces were selected, omitting analysis of other regions in China. (2) The ecological efficiency was measured with data from 2015—data that does not allow dynamic analysis—so it is difficult to estimate future development trends. In future research, panel data and more parts of China can be selected to measure ecological efficiency and estimate change trends.

6.2. Conclusions

A three-phase DEA approach is applied to calculate the eco-efficiency of 30 Chinese provinces (including autonomous regions and municipalities) in order to evaluate their green growth. In phase one, a two-stage production structure DEA model is used to obtain an initial eco-efficiency, which is composed of the energy saving efficiency and pollution treatment efficiency. In phase two, an SFA model is used to attribute variations in initial eco-efficiency evaluation to environment effects, low management efficiency, and statistical noise. In phase three, the DMUs’ inputs are adjusted on the basis of the effects of environment and statistical noise uncovered in the second phase. Then the first-stage method was applied again but utilizing the adjusted input and output data, aiming to obtain more objective and realistic eco-efficiency values. The third phase of the eco-efficiency reassessment provides improved management efficiency measures because the environmental impact and statistical noise influences were eliminated through the SFA regression.
The current paper investigates regional eco-efficiency, focusing on Chinese provinces, and how environmental factors influence the efficiency. According to the research findings, the conclusions are as follows: (1) Macroenvironmental factors have varying impacts on energy saving efficiency in different provinces. Firstly, while the energy saving efficiency of each province improved after removing the macroenvironmental impact, the degree of efficiency improvement was not uniform. Secondly, the SFA regression results indicate that macroenvironmental factors had a significant effect on labor (significant at the 1% level), but no significant impact on fixed-asset investment. These two findings indicate that jobs are greatly affected by the macroenvironment, while fixed-asset investment in various provinces is not correlated to macroenvironmental factors. (2) The pollution treatment efficiency of each province is also affected by macroenvironmental factors. Firstly, the pollution treatment efficiency in each province decreased after eliminating the macroenvironmental impact. Secondly, the results of the SFA regression analysis show that technological progress, economic development, and energy consumption structure greatly impact the investment amount of pollution control (significant at 5%, 1%, and 10%, respectively). The pollution treatment efficiency can be improved by raising the economic development level. (3) The eco-efficiency of each province varies greatly after eliminating the environmental impact. From a national perspective, the average eco-efficiency declined after eliminating the environmental impact, which illuminates the fact that macroenvironmental factors in various provinces play a positive role in improving eco-efficiency.
This study contributes in several ways. In the first place, a two-stage production structure DEA model considering nondiscretionary inputs and undesirable output is developed and embedded in a three-phase DEA approach. In the second place, this study measures provincial eco-efficiency, including energy saving efficiency and pollution disposal efficiency, and the influence of exterior environmental heterogeneity on these, which extends the scope of efficiency evaluation to macro-socioeconomic environments. Moreover, a novel, two-dimensional, and efficiency change-based matrix diagram is presented to evaluate the influence of environmental factors on provincial eco-efficiency in China. Finally, the results of this study can provide policy guidelines for decision makers of provincial governments and help improve provincial eco-efficiency from a macro perspective.

Author Contributions

H.L. and Z.Z. conceived and designed the research; H.L. and R.Y. wrote the manuscript and prepared figures; D.H. and Z.Z. participated in the discussion of the results. The release of this version of the manuscript was unanimously agreed to by all authors. All authors have read and agreed to the published version of the manuscript.

Funding

This research was funded by the National Natural Science Foundation of China (Nos. 71801001 and 71701059); Anhui University Doctoral Research Fund No. Y040418169, the Fundamental Research Funds for the Central Universities No. JZ2019HGTB0095, and the Anhui Province Philosophy and Social Science Planning Project No. SK2017A0016.

Conflicts of Interest

The authors declare no conflict of interest.

References

  1. Song, M.; Cao, S.; Wang, S. The impact of knowledge trade on sustainable development and environment-biased technical progress. Technol. Forecast. Soc. Chang. 2019, 144, 512–523. [Google Scholar] [CrossRef]
  2. National Bureau of Statistics. National Data. Available online: http://data.stats.gov.cn/easyquery.htm?cn=C01 (accessed on 15 August 2020).
  3. Jiang, Y.; Chen, X.; Valdmanis, V.; Baležentis, T. Evaluating economic and environmental performance of the Chinese industry sector. Sustainability 2019, 11, 6804. [Google Scholar] [CrossRef] [Green Version]
  4. Energy Division of National Bureau of Statistics. China Statistical Yearbook on Environment (2011–2018); China Statistical Press: Beijing, China, 2012–2019.
  5. Ouyang, X.; Wei, X.; Sun, C.; Du, G. Impact of factor price distortions on energy efficiency: Evidence from provincial-level panel data in China. Energy Policy 2018, 118, 573–583. [Google Scholar] [CrossRef]
  6. Wu, J.; Huang, D.; Zhou, Z.; Zhu, Q. The regional green growth and sustainable development of China in the presence of sustainable resources recovered from pollutions. Ann. Oper. Res. 2019, 1–19. [Google Scholar] [CrossRef]
  7. Zhang, J.; Liu, Y.; Chang, Y.; Zhang, L. Industrial eco-efficiency in China: A provincial quantification using three-stage data envelopment analysis. J. Clean. Prod. 2017, 143, 238–249. [Google Scholar] [CrossRef]
  8. Yang, X.; Zhang, Z.; Luo, W.; Tang, Z.; Gao, X.; Wan, Z.; Zhang, X. The impact of government role on high-quality innovation development in mainland China. Sustainability 2019, 11, 5780. [Google Scholar] [CrossRef] [Green Version]
  9. Lin, B.; Zhu, J. Impact of energy saving and emission reduction policy on urban sustainable development: Empirical evidence from china. Appl. Energy 2019, 239, 12–22. [Google Scholar] [CrossRef]
  10. Dincer, I.; Rosen, M.A. A worldwide perspective on energy, environment and sustainable development. Int. J. Energy Res. 1998, 22, 1305–1321. [Google Scholar] [CrossRef]
  11. Geng, Z.; Zeng, R.; Han, Y.; Zhong, Y.; Fu, H. Energy efficiency evaluation and energy saving based on dea integrated affinity propagation clustering: Case study of complex petrochemical industries. Energy 2019, 179, 863–875. [Google Scholar] [CrossRef]
  12. Song, M.; Peng, J.; Wang, J.; Zhao, J. Environmental efficiency and economic growth of China: A Ray slack-based model analysis. Eur. J. Oper. Res. 2018, 269, 51–63. [Google Scholar] [CrossRef]
  13. Schaltegger, S.; Sturm, A. Ecological rationality: Approaches to design of ecology-oriented management instruments. Die Unt. 1990, 4, 273–290. [Google Scholar]
  14. Xing, Z.; Wang, J.; Zhang, J. Total-factor ecological efficiency and productivity in Yangtze River Economic Belt, China: A non-parametric distance function approach. J. Clean. Prod. 2018, 200, 844–857. [Google Scholar] [CrossRef]
  15. Charmondusit, K.; Phatarachaisakul, S.; Prasertpong, P. The quantitative ecoefficiency measurement for small and medium enterprise: A case study of wooden toy industry. Clean Technol. Environ. Policy 2014, 16, 935–945. [Google Scholar] [CrossRef]
  16. Zhou, Z.; Guo, X.; Wu, H.; Yu, J. Evaluating air quality in China based on daily data: Application of integer data envelopment analysis. J. Clean. Prod. 2018, 198, 304–311. [Google Scholar] [CrossRef]
  17. Molinos-Senante, M.; Gémar, G.; Gómez, T.; Caballero, R.; Sala-Garrido, R. Eco-efficiency assessment of wastewater treatment plants using a weighted Russell directional distance model. J. Clean. Prod. 2016, 137, 1066–1075. [Google Scholar] [CrossRef]
  18. Zhu, W.; Xu, L.; Tang, L.; Xiang, X. Eco-efficiency of the Western Taiwan Straits Economic Zone: An evaluation based on a novel eco-efficiency model and empirical analysis of influencing factors. J. Clean. Prod. 2019, 234, 638–652. [Google Scholar] [CrossRef]
  19. Koskela, M.; Vehmas, J. Defining eco-efficiency: A case study on the Finnish forest industry. Bus. Strategy Environ. 2012, 21, 546–566. [Google Scholar] [CrossRef]
  20. Song, M.; Fisher, R.; Wang, J.L.; Cui, L.B. Environmental performance evaluation with big data: Theories and methods. Ann. Oper. Res. 2018, 270, 459–472. [Google Scholar] [CrossRef]
  21. Ren, S.; Li, X.; Yuan, B.; Li, D.; Chen, X. The effects of three types of environmental regulation on eco-efficiency: A cross-region analysis in China. J. Clean. Prod. 2018, 173, 245–255. [Google Scholar] [CrossRef]
  22. Zhang, B.; Bi, J.; Fan, Z.; Yuan, Z.; Ge, J. Eco-efficiency analysis of industrial system in China: A data envelopment analysis approach. Ecol. Econ. 2008, 68, 306–316. [Google Scholar] [CrossRef]
  23. World Business Council for Sustainable Development. Eco-Efficient Leadership for Improved Economicand Environmental Performance; World Business Council for Sustainable Development: Geneva, Switzerland, 1998. [Google Scholar]
  24. Qiu, S.F. Research on ecological efficiency in Fujian province. J. Minjiang Univ. 2009, 30, 69–73. [Google Scholar]
  25. Mao, J.S.; Lu, Z.W.; Yang, Z.F. Preliminary study on the basic characteristics of environmental management. Environ. Sustain. Dev. 2004, 4, 6–9. [Google Scholar]
  26. Dai, Y.C. Environmental efficiency—One of the paths for developing circular economy. Environ. Sustain. Dev. 2005, 1, 20–22. [Google Scholar]
  27. Dahlström, K.; Ekins, P. Eco-efficiency trends in the UK steel and aluminum industries: Differences between resource ef fi ciency and resource productivity. J. Ind. Ecol. 2005, 9, 171–188. [Google Scholar] [CrossRef]
  28. Yu, C.; Shi, L.; Wang, Y.; Chang, Y.; Cheng, B. The eco-efficiency of pulp and paper industry in China: An assessment based on slacks-based measure and Malmquiste Luenberger index. J. Clean. Prod. 2016, 127, 511–521. [Google Scholar] [CrossRef]
  29. Mickwitz, P.; Melanen, M.; Rosenström, U.; Seppälä, J. Regional eco-efficiency indicators—A participatory approach. J. Clean. Prod. 2006, 14, 1603–1611. [Google Scholar] [CrossRef]
  30. Liu, H.; Tsai, H.; Wu, J. Regional hotel performance and benchmarking in the Pearl River Delta: An input and output efficiency analysis. Int. J. Contempor. Hosp. Manag. 2018, 30, 855–873. [Google Scholar] [CrossRef]
  31. Charnes, A.; Cooper, W.; Rhodes, E. Measuring the efficiency of decision making units. Eur. J. Oper. Res. 1978, 2, 429–444. [Google Scholar] [CrossRef]
  32. Liu, W.; Zhou, Z.; Ma, C.; Liu, D.; Shen, W. Two-stage DEA models with undesirable input-intermediate-outputs. Omega 2015, 56, 74–87. [Google Scholar] [CrossRef]
  33. Tone, K. Dealing with Undesirable Outputs in DEA: A Slacks-Based Measure (SBM) Approach. 2003. Available online: https://www.researchgate.net/publication/284047010_Dealing_with_undesirable_outputs_in_DEA_a_Slacks-Based_Measure_SBM_approach (accessed on 18 August 2020).
  34. An, Q.; Chen, H.; Wu, J.; Liang, L. Measuring slacks-based efficiency for commercial banks in China by using a two-stage DEA model with undesirable output. Ann. Oper. Res. 2015, 235, 13–35. [Google Scholar] [CrossRef]
  35. Wang, X.; Wu, Q.; Majeed, S. Fujian’s industrial eco-efficiency: Evaluation based on SBM and the empirical analysis of lnfluencing factors. Sustainability 2018, 10, 3333. [Google Scholar] [CrossRef] [Green Version]
  36. Long, X.; Zhao, X.; Cheng, F. The comparison analysis of total factor productivity and eco-efficiency in China’s cement manufactures. Energy Policy 2015, 81, 61–66. [Google Scholar] [CrossRef]
  37. Wang, D.; Zhu, T. Research on regional industrial eco-efficiency in china based on data envelopment analysis theory. Ecol. Econ. 2011, 4, 24–28. [Google Scholar]
  38. Wang, K.L.; Zhang, C.Y. The heterogeneity of industrial eco-efficiency in China from the perspective of environmental pressure. Sci. Technol. Manag. Res. 2016, 10, 243–248. [Google Scholar]
  39. Zhang, W.M.; Fang, M.Q. Evaluation of urban eco-economy efficiency: Taking Hunan province as an example. Urban Issues 2015, 3, 62–66. [Google Scholar]
  40. Liu, H.; Zhang, Y.; Zhu, Q.; Chu, J. Environmental efficiency of land transportation in China: A parallel slack-based measure for regional and temporal analysis. J. Clean. Prod. 2017, 142, 867–876. [Google Scholar] [CrossRef]
  41. An, Q.; Meng, F.; Ang, S. A new approach for fair efficiency decomposition in two-stage structure system. Oper. Res. 2018, 18, 257–272. [Google Scholar] [CrossRef]
  42. Kao, C.; Hwang, S.N. Efficiency decomposition in two-stage data envelopment analysis: An application to non-life insurance companies in Taiwan. Eur. J. Oper. Res. 2008, 185, 418–429. [Google Scholar] [CrossRef]
  43. Song, M.; Wang, S.; Liu, W. A two-stage DEA approach for environmental efficiency measurement. Environ. Monit. Assess. 2014, 186, 3041–3051. [Google Scholar] [CrossRef]
  44. Liu, J.; Lu, L.; Lu, W.; Lin, B. A survey of DEA applications. Omega 2013, 41, 893–902. [Google Scholar] [CrossRef]
  45. Pang, J.; Chen, X.; Zhang, Z. Measuring Eco-Efficiency of Agriculture in China. Sustainability 2016, 8, 398. [Google Scholar] [CrossRef] [Green Version]
  46. Masuda, K. Eco-Efficiency Assessment of Intensive Rice Production in Japan: Joint Application of Life Cycle Assessment and Data Envelopment Analysis. Sustainability 2019, 11, 5368. [Google Scholar] [CrossRef] [Green Version]
  47. Drake, L.; Hall, M.J.; Simper, R. The impact of macroeconomic and regulatory factors on bank efficiency: A non-parametric analysis of Hong Kong’s banking system. J. Bank Financ. 2006, 30, 1443–1466. [Google Scholar] [CrossRef] [Green Version]
  48. Fried, H.; Lovell, C.; Schmidt, S.; Yaisawarng, S. Accounting for environmental effects and statistical noise in data envelopment analysis. J. Prod. Anal. 2002, 17, 157–174. [Google Scholar] [CrossRef]
  49. Zhou, X.; Luo, R.; Yao, L.; Cao, S.; Wang, S.; Lev, B. Assessing integrated water use and wastewater treatment systems in China: A mixed network structure two-stage SBM DEA model. J. Clean. Prod. 2018, 185, 533–546. [Google Scholar] [CrossRef]
  50. Wu, J.; Zhu, Q.; Chu, J.; Liang, L. Two-stage network structures with undesirable intermediate outputs reused: A DEA based approach. Comput. Econ. 2015, 46, 455–477. [Google Scholar] [CrossRef]
  51. Li, K.; Lin, B. Impact of energy conservation policies on the green productivity in China’s manufacturing sector: Evidence from a three-stage DEA model. Appl. Energy 2016, 168, 351–363. [Google Scholar] [CrossRef]
  52. Bian, Y.; Liang, N.; Xu, H. Efficiency evaluation of Chinese regional industrial systems with undesirable factors using a two-stage slacks-based measure approach. J. Clean. Prod. 2015, 87, 348–356. [Google Scholar] [CrossRef]
  53. Cui, Q.; Li, Y. The evaluation of transportation energy efficiency: An application of three-stage virtual frontier DEA. Transp. Res. Part D Transp. Environ. 2014, 29, 1–11. [Google Scholar] [CrossRef]
  54. Chen, S.; Golley, J. ‘Green’ productivity growth in China’s industrial economy. Energy Econ. 2014, 44, 89–98. [Google Scholar] [CrossRef]
  55. Hsu, F.; Hsueh, C. Measuring relative efficiency of government-sponsored R&D projects: A three-stage approach. Eval. Program Plan. 2009, 32, 178–186. [Google Scholar]
  56. Xie, B.; Duan, N.; Wang, Y. Environmental efficiency and abatement cost of China’s industrial sectors based on a three-stage data envelopment analysis. J. Clean. Prod. 2017, 153, 626–636. [Google Scholar] [CrossRef]
  57. Chen, W.; Zhang, L.; Ma, T.; Liu, Q. Research on three-stage DEA model. Syst. Eng. 2014, 32, 144–149. [Google Scholar]
  58. Simar, L.; Wilson, P.W. Estimation and inference in two-stage, semi-parametric models of production processes. J. Econom. 2007, 136, 31–64. [Google Scholar] [CrossRef]
  59. Yue, L.; Wu, C.; Zhang, M. Research on the evaluating method of non-renewable energy efficiency based on China’s provincial data: Green growth perspective. Appl. Mech. Mater. 2015, 733, 303–308. [Google Scholar] [CrossRef]
  60. Liu, M.; Li, S. Innovation efficiency evaluation of hi-tech development zones based on the three stage model. Manag. Rev. 2016, 28, 42–52. [Google Scholar]
  61. Kim, K.T.; Lee, D.J.; Park, S.J.; Zhang, Y.; Sultanov, A. Measuring the efficiency of the investment for renewable energy in Korea using data envelopment analysis. Renew. Sust. Energy Rev. 2015, 47, 694–702. [Google Scholar] [CrossRef]
  62. Speak, A.; Rothwell, J.; Lindley, S.; Smith, C. Urban particulate pollution reduction by four species of green roof vegetation in a UK city. Atmos. Environ. 2012, 61, 283–293. [Google Scholar] [CrossRef]
  63. Bai, Y.; Deng, X.; Jiang, S.; Zhang, Q.; Wang, Z. Exploring the relationship between urbanization and urban eco-efficiency: Evidence from prefecture-level cities in China. J. Clean. Prod. 2018, 195, 1487–1496. [Google Scholar] [CrossRef]
  64. Guo, F.Y.; Lo, K.; Tong, L.J. Eco-efficiency analysis of industrial systems in the Songhua River Basin: A decomposition model approach. Sustainability 2016, 8, 1271. [Google Scholar] [CrossRef] [Green Version]
  65. Menanteau, P.; Finon, D.; Lamy, M.L. Prices versus quantities: Choosing policies for promoting the development of renewable energy. Energy Policy 2003, 31, 799–812. [Google Scholar] [CrossRef]
  66. Paul, A.; Palmer, K.; Woerman, M. Analysis of the Bingaman clean energy standard proposal. Resour. Energy Econ. 2014, 36, 113–129. [Google Scholar] [CrossRef]
  67. Pang, R.Z.; Deng, Z.Q.; Hu, J.L. Clean energy use and total-factor efficiencies: An international comparison. Renew. Sustain. Energy Rev. 2015, 52, 1158–1171. [Google Scholar] [CrossRef]
  68. Wang, S.; Song, M. Influences of reverse outsourcing on green technological progress from the perspective of a global supply chain. Sci. Total Environ. 2017, 595, 201–208. [Google Scholar] [CrossRef]
  69. The Organization for Economic Co-operation and Development. Towards Green Growth: Monitoring Progress; OECD: Paris, France, 2011. [Google Scholar]
  70. Zhang, T.Y. Research on Green Innovation Incentive of Environmental Regulation; Graduate School of Chinese Academy Of Social Sciences: Beijing, China, 2014. [Google Scholar]
  71. Zhang, X.G.; Wang, Y.J. Environment Kuznets curve or regulation results? Financ. Econ. Rev. 2010, 152, 7–12. [Google Scholar]
  72. Zhu, Z.J. Research on the Interactive Relationship between Environmental Quality and Economic Development Based on Trend Analysis. J. Dongbei Univ. Financ. Econ. 2012, 1, 69–72. [Google Scholar]
  73. Zhang, R.B.; Ren, S.G.; Cai, C.Y. Evaluation of industrial eco-efficiency of urban agglomeration in the Yangtze River Delta. Bus. Res. 2017, 6, 163–169. [Google Scholar]
Figure 1. Network structure of ecological–economic activity.
Sustainability 12 07059 g001
Figure 2. Change quadrant of energy saving and pollution treatment efficiencies.
Sustainability 12 07059 g002
Figure 3. Provincial eco-efficiency change.
Sustainability 12 07059 g003
Table 1. Description of input and output variables.
StageTypeVariableUnit
Production stageNondiscretionary input LaborMillion person
Total fixed assets investment100 Billion Yuan
Discretionary inputEnergy consumption100 Million Ton Coal
Industrial water consumption100 Million m3
Total electricity consumption100 Million KWH
Desirable output GDP100 Million Yuan
Industrial added value100 Million Yuan
Undesirable output Industrial wastewater100 Million Ton
Industrial solid waste10 Million Ton
Industrial SO2 emissions10,000 Ton
Pollution treatment stageDiscretionary input Investment in industrial pollution control100 Million Yuan
Desirable output Comprehensive utilization of industrial waste10 Million Ton
Centralized waste gas treatment facilitiesSet
Industrial wastewater treatment capacity100 Million Ton
Table 2. Statistical description of environmental variables.
IndexGovernment SupportUrbanization LevelIndustrial StructureEnergy Consumption StructureTechnological ProgressEnvironmental RegulationEconomic Development
Max2.41811.52101.16691.97504.17324.38771.0718
Min0.50510.72930.45630.26780.18770.41830.9407
Median0.93200.95771.05650.91640.83420.82200.9873
S.D.0.40980.20680.18010.43160.76940.74930.0365
Table 3. Results of regression analysis of influencing factors.
Production Stage (Energy Saving)Pollution Treatment Stage
Environmental VariablesLabor Total Fixed Assets InvestmentIndustrial Water ConsumptionTotal Electricity ConsumptionEnergy Consumption Investment in Industrial Pollution ControlEnvironmental Variables
Government support−79.2744 ***−1.9543−7.0664 *0.2197 **0.00091.8228 **Technological progress
Urbanization level−146.7464 ***−2.79830.83360.7448 ***−0.0177−0.3763Environmental regulation
Industrial structure40.2790 ***0.236317.8169 ***−0.0117−0.0106−29.0912 ***Economic development
Energy consumption structure−94.7909 ***−0.7805−6.3638 **0.2342 **0.00411.9325 *Energy consumption structure
σ239323.36807.9743901.20930.24590.4915284.4505σ2
γ0.99580.99980.99990.99830.99990.9998γ
Log of likelihood function−176.17−56.61−120.26−73.21−108.41−100.37Log of likelihood function
Note: ***, **, and * indicate significance at 1%, 5%, and 10% level, respectively.
Table 4. Provincial eco-efficiency in China in 2015.
ProvincesEnergy Saving EfficiencyPollution Treatment EfficiencyEco-Efficiency
InitialAdjustedInitialAdjustedInitialAdjusted
Beijing0.999711.14861.18680.87040.8426
Tianjin111111
Hebei111111
Shanxi111111
Inner Mongolia111111
Liaoning111111
Jilin112.26992.26990.44050.4405
Heilongjiang0.77450.82081.33891.33490.57850.6149
Shanghai0.69990.90241.87312.08120.37360.4336
Jiangsu111111
Zhejiang0.967711.45311.39930.66600.7146
Anhui0.73070.87151.04041.25460.70230.6947
Fujian0.7520.89441.28822.22270.58370.4024
Jiangxi0.75720.87701.05871.68360.71520.5209
Shandong111111
Henan0.86260.83541.43571.50750.60080.5542
Hubei0.89300.91572.03072.72530.43970.3360
Hunan10.820811.310010.6266
Guangdong111111
Guangxi0.84450.89571.1194 1.11310.75440.8047
Hainan11.00001111
Chongqing0.72020.77481.28541.28540.56030.6028
Sichuan0.95180.95011.10181.10420.86380.8604
Guizhou0.96660.97221.08591.07530.89010.9042
Yunnan111.198710.83431
Shaanxi111.41631.77700.70610.5628
Gansu0.71810.78403.07893.07890.23320.2546
Qinghai111111
Ningxia0.91800.9483 1.80911.80910.50740.5242
Xinjiang111111
Average0.91860.94211.30111.40730.77730.7565

