1. Introduction
Predicting the direction of stock markets or examining whether excess returns exist in stock markets is not only the primary concern of market participants but is also a major research topic for academics. An efficient market hypothesis (EMH) was recognized as the core theory of investment until various anomalies in stock markets were found in the 1980s. The EMH states that asset prices fully reflect all available information and that stocks always trade at their fair value, making it impossible for investors to purchase undervalued stocks or sell stocks for inflated prices. On the other hand, the market anomaly proves that due to inefficiency in the process of reflecting information, stock returns follow a certain pattern and provide excess returns. A representative study for identifying expected stock returns is by Fama-French, where a three-factor model is proposed [
1,
2]. The three factors incorporated in this model are market risk, the outperformance of small versus large companies (SMB, Small Minus Big), and the outperformance of high book/market versus small book/market companies (HML, High Minus Low). Charhart added a momentum factor to the Fama-French three-factor model and showed linear correlations between the momentum factor and stock returns [
3]. A recent study by Ayub et al. also incorporated a momentum factor to propose a new six-factor downside beta capital asset pricing model (CAPM) for asset pricing [
4].
A number of previous studies have focused on momentum investment strategies to sustain competitive advantage for portfolio management. Jegadeesh and Titman demonstrate that a momentum investment strategy of buying a portfolio with good past performance and selling a portfolio with poor past performance can realize significant abnormal returns over a 3- to 12-month holding period [
5]. Rouwenhorst analyzed 12 European countries and proved that the momentum investment strategy is effective within a year in developed countries, as well as emerging countries [
6]. Griffin et al. analyze emerging Asian markets, as well as the U.S. and European markets, using the momentum investment strategy outlined by Jegadeesh and Titman [
7]. The study reports that most countries except Korea, Japan, and Hong Kong have achieved abnormal returns from momentum investment strategies. Moskowitz and Gridblatt show that short-term excess returns from momentum effects could be generated in various portfolios [
8]. On the other hand, Aldieri and Vinci explore the relationship between firm size and sustainable innovation in large international firms [
9]. They found internal as well as external spillover effects on firms’ sizes.
The momentum investment strategy has been a trend-following strategy adopted by many fund managers in the practical field, and these managers have been attempting to improve its performance. Grinold and Kahn use the information ratio (IR) to eliminate the risk of irregularity in the regime transition pattern in the trend-following strategy [
10]. These researchers use the formula of
, where IR measures active management opportunities and squared IR indicates the ability to add value. In this instance, IC (Information Cooperative) represents the management skill, and Breadth represents the number of independent opportunity sets, which is the number of times the skill is used. The trend of investment strategies employed by recent hedge funds is to use a strategy to minimize the risk of regime judgment by increasing the number of independent opportunity sets as much as possible, rather than increasing the IC. Bridgewater Associates, the world’s largest hedge fund, is a prime example. Meanwhile, few efforts to increase IC have been made by practitioners and academics. Researchers have recently reported that scientific methodology can be used to improve the accuracy of transition pattern recognition [
11,
12]. The hidden Markov model (HMM) shows good predictive power for transition pattern recognition [
13]. The HMM based on the Markov chain states that one can observe only the results from the hidden states, and the hidden states are only influenced by the present state and have nothing to do with the past state. Therefore, the HMM is useful for time-series pattern recognition that changes over time. Sasikumar and Abdullah describe a detailed idea about the sequence and state prediction of the stock market using HMM and address inferences regarding stock market trends [
14]. Hassan and Nath employ the HMM for forecasting stock prices for interrelated markets and compare the results with those from an artificial neural network (ANN) [
15]. A recent study by Nguyen determines an optimal number of states for the HMM and predicts monthly closing prices of the S&P 500 index using the selected HMM [
16]. This study shows that the HMM outperforms the buy and hold strategies in predicting and trading stocks. These researchers support the use of the HMM and argue that the HMM offers a new paradigm for stock market forecasting.
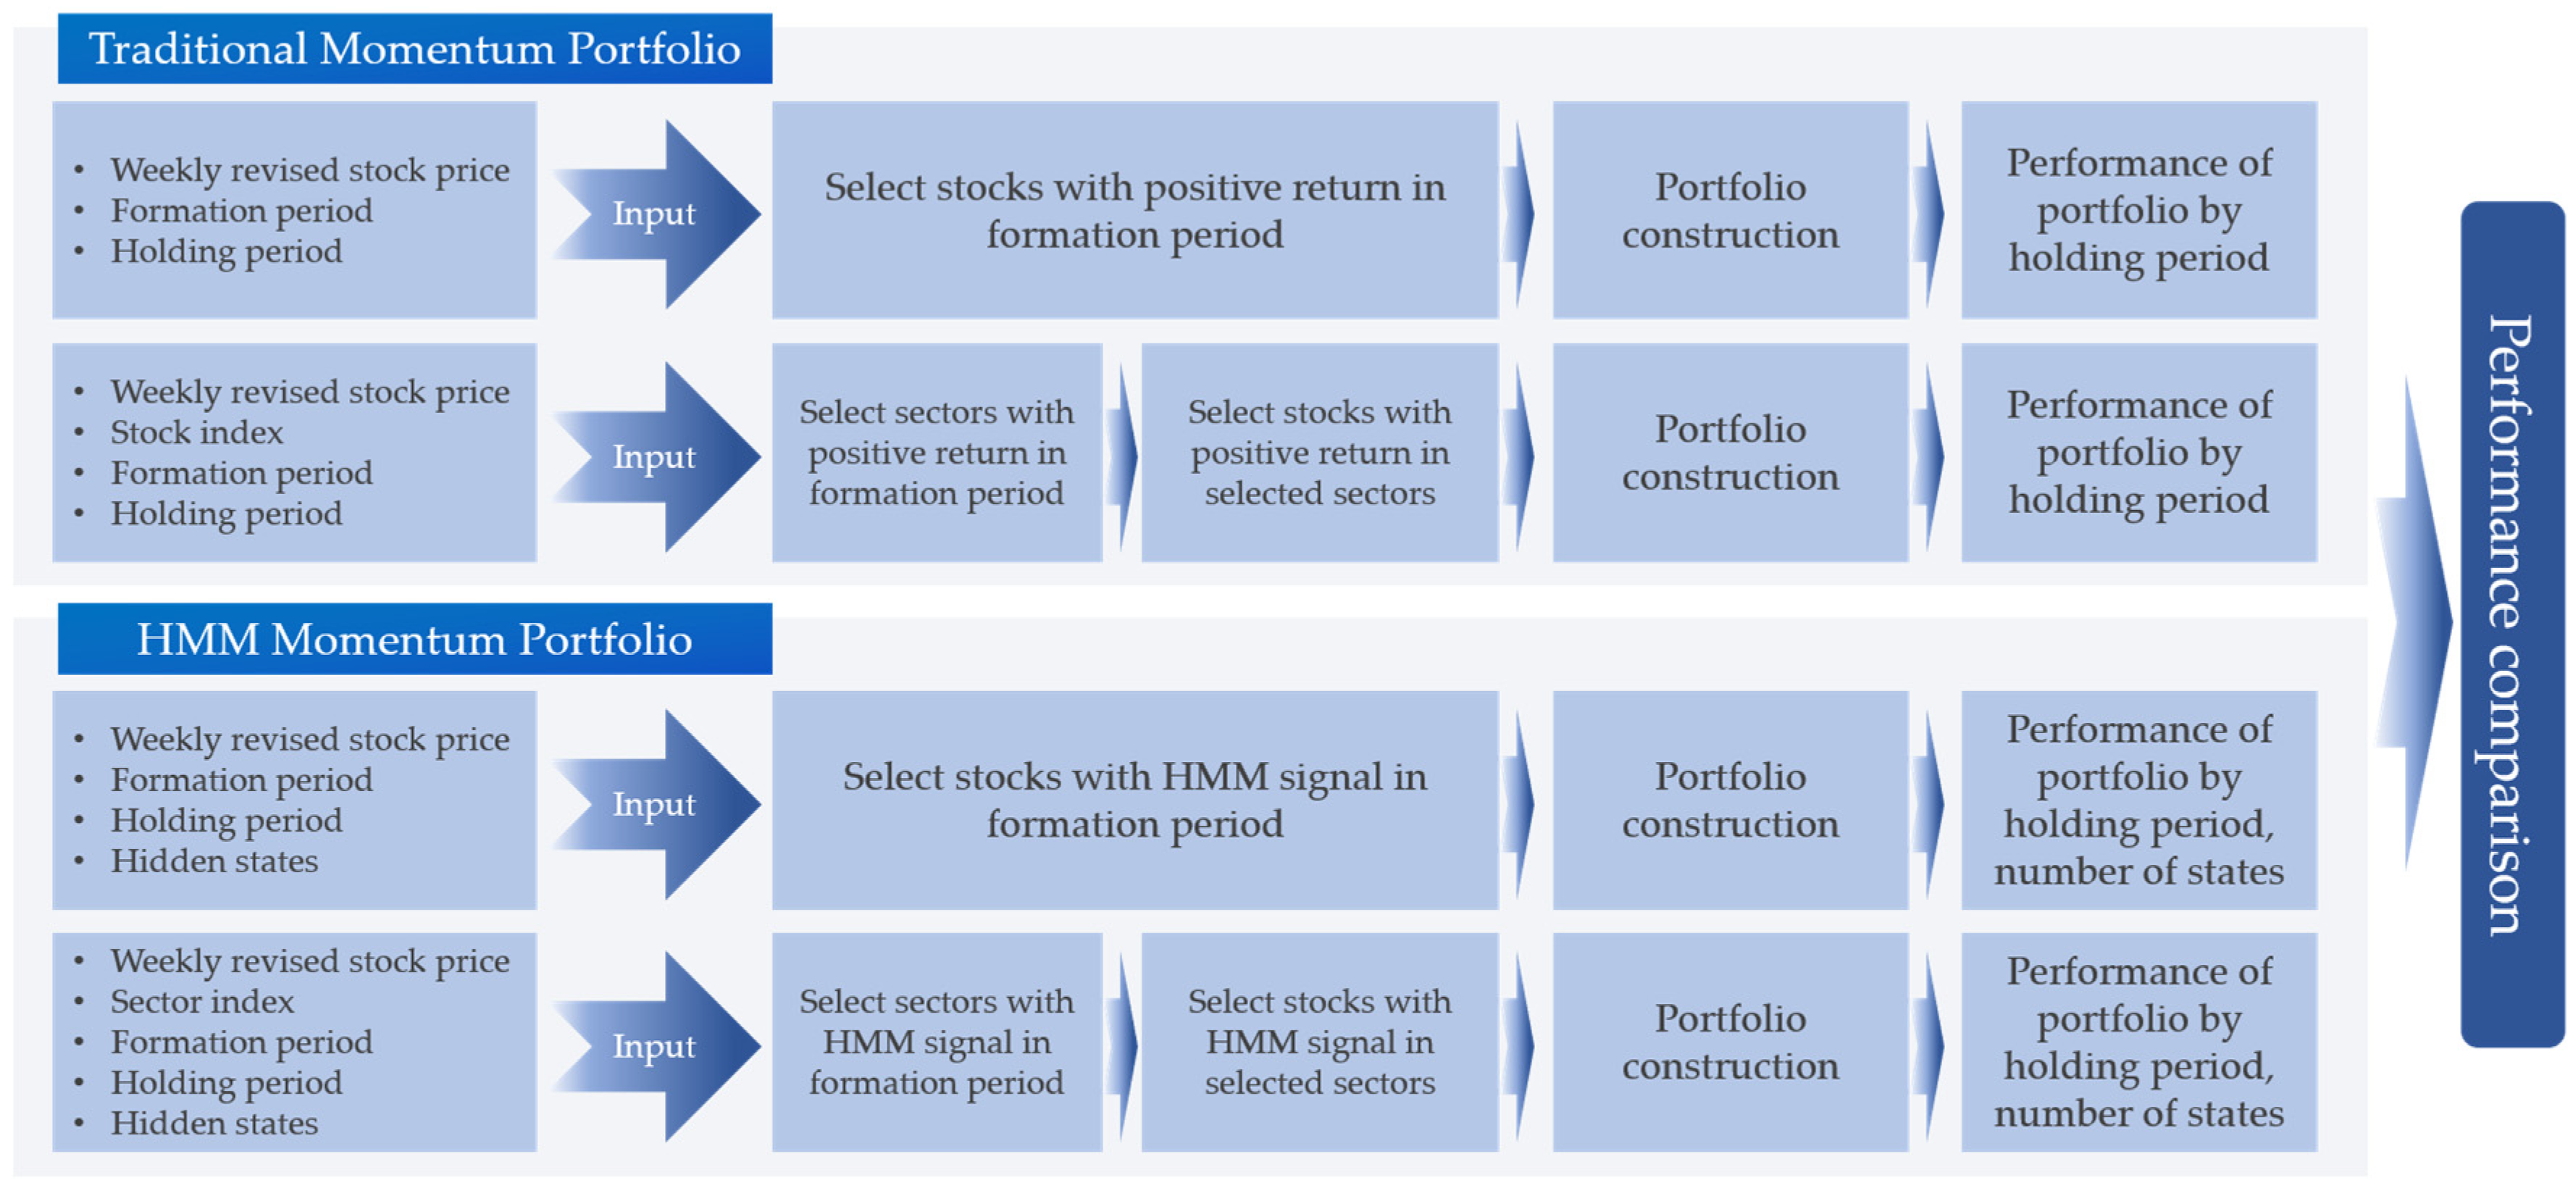
There has been a growing demand for portfolio management using artificial intelligence (AI). To sustain a competitive advantage for portfolio management, stock market investors require a strategic investment decision that can realize better returns. Based upon previous finding that the HMM is useful for time-series pattern recognition, this study proposes a momentum investment strategy using the HMM to select stocks in the rising state. We use the HMM to increase the IC in the formula. We construct an HMM momentum portfolio that includes 890 Korean stocks and analyze the performance over the period from January 2000 to December 2018. Identifying states of stocks, sectors, or markets using the HMM, we construct an HMM momentum portfolio by purchasing shares in the rising state and proceeding with rebalancing after the holding period. The HMM momentum portfolio is found to earn higher returns than traditional momentum portfolios and achieves the best performance under certain conditions of the short holding period (one week) and short formation period (one month). In addition, our strategy shows competitive performance in market and sector index investment against market returns. The experimental results in this study imply that the momentum investment strategy using HMM is useful in the Korean stock market, and the HMM can be used to develop a new AI momentum strategy that can be utilized for other portfolios containing various types of financial assets on the global market.
A large number of models or techniques for creating an efficient portfolio consisting of various types of instruments have been developed by academics and practitioners. Financial instruments, investment techniques, and investors are critical components in the efficiency of financial markets. An effective investment strategy helps investors to achieve efficient investments as well as an efficient financial market, which are well known to play an important role in sustaining economic growth. Portfolio managers are able to make more efficient strategies by using our HMM momentum investment strategy. It helps to sustain a competitive advantage for portfolio management and contributes to the efficiency of financial markets. In this sense, the HMM momentum investment strategy developed in this paper plays a role in sustaining economic growth.
We organize this paper as follows.
Section 2 includes the materials and methods. In this section, we describe the HMM, momentum strategy, and our proposed model. The experimental results and an analysis of the results are presented in
Section 3, and
Section 4 offers a summary and concluding remarks.
4. Summary and Conclusions
This study proposes using HMM in the momentum investment strategy and compares the performance of the HMM momentum portfolio with those of traditional momentum portfolios to demonstrate the usefulness of HMM for the momentum investment strategy. The results of the empirical analysis of this study can be summarized as follows.
First, the HMM stock momentum portfolio (
Section 3.1) and HMM sector-stock momentum portfolio (
Section 3.2) outperform the corresponding traditional momentum portfolio in all combinations of formation and holding periods.
Second, the results for the HMM stock momentum portfolio and HMM sector-stock momentum portfolio show similar characteristics: the portfolios constructed by 6-, 9-, and 12-month formation periods generate higher returns than those constructed by 1- and 3-month formation periods. It is also observed that portfolios with a 1-month holding period achieve the best performance within most formation periods.
Third, the HMM stock momentum portfolio and HMM sector-stock momentum portfolio with weekly rebalancing improve their performance and generate their best returns with a 1-month formation period.
Fourth, the HMM index momentum investment strategy significantly outperforms the buy and hold strategy for all indices.
In summary, the HMM improves the performance of the momentum strategy for stock portfolios, sector-stock portfolios, industry index portfolios, and KOSPI index portfolios over the period from January 2000 to December 2018. In addition, our experimental results suggest using a 1-month formation period and a 1-week holding period for the HMM momentum investment strategy.
A large number of models or techniques for creating an efficient portfolio consisting of various types of instruments have been developed by academics and practitioners. An effective investment strategy helps investors to achieve efficient investments as well as an efficient financial market, which is well known to play an important role in sustaining economic growth. To sustain a competitive advantage for portfolio management, stock market investors require a strategic investment decision that can maximize returns or minimize losses. The HMM momentum investment strategy can be used by portfolio managers for more efficient portfolios, and it contributes to the efficiency of financial markets. In this sense, the HMM momentum investment strategy developed in this paper plays a role in sustaining economic growth.
While the traditional momentum strategy theorized by Jegadeesh and Titman [
4] has been widely used in many studies, the effectiveness of the momentum strategy in the Korean stock market has not been determined. This study indicates that the momentum investment strategy using HMM is useful in the Korean stock market. However, this study has possible limitations. For instance, the experimental results are limited to the long-only momentum portfolio of Korean market assets. Based on our HMM momentum strategy, future research can be enriched by applying the HMM to the long-short momentum strategy or developing a new AI momentum strategy that can be utilized for other portfolios containing various types of financial assets on the global market.


