Article

Approaching Bike Hazards via Crowdsourcing of Volunteered Geographic Information

Physical Geography, University of Freiburg, Schreiberstraße 20, 79085 Freiburg, Germany
*
Author to whom correspondence should be addressed.
These authors contributed equally to this work.
Sustainability 2020, 12(17), 7015; https://doi.org/10.3390/su12177015
Submission received: 3 August 2020 / Revised: 17 August 2020 / Accepted: 25 August 2020 / Published: 28 August 2020

Abstract

:
Information on individual hazard perception while cycling and the associated feeling of safety are key aspects to foster sustainable urban cycling mobility. Although cyclist’s perceptions must also be critically reviewed, such crowdsourced Volunteered Geographic Information (VGI) provides wide-ranging insights on diverse hazard categories in cycling. In this case study in the city of Freiburg, Germany, hazard perceptions, information about lane types, and the underlying routes were crowdsourced via an open source smartphone application by a small group with the aim of providing cyclists with effective solutions. By dealing with levels of reliability, we show that even a small group of laypersons can generate an extensive and valuable set of VGI consisting of comprehensive hazard categories. We demonstrate that (1) certain hazards are interlinked to specific lane types, and (2) the individual hazard perceptions and objective parameters, i.e., accident data, are often congruent spatially; consequently, (3) dangerous hot spots can be derived. By considering cyclists’ needs, this approach outlines how a people-based perspective can supplement regional planning on the local scale.

1. Introduction

In their daily routines, cyclists are often confronted with dangerous situations while commuting in an urban context. Based on previous experience, they are usually able to localize hazards, which may lead to an adaption of cycling activities. Local cyclists utilize everyday experience as an extensive source of information, which is often neglected in more place-based driven studies.
In general, crowdsourcing approaches can provide essential information for research into how society perceives and evaluates spatial structures on the local scale, which in turn can be relevant for regional planning and the design of infrastructures for human activities. If the conditions for safe cycling are to be improved, the question must also be addressed as to which safety concerns prevent people from using bicycles [1]. In particular, for the development of sustainable mobility or future transport systems, such as cycling in this case study, an effective crowdsourcing of Volunteered Geographic Information (VGI) of risk and hazard perceptions can provide useful complementary findings for regional planning [2]. Furthermore, VGI referencing individual perceptions can extend a place-based perspective by a people-based perspective in GIScience [3].

1.1. Trends in Participatory Mapping

Presumably, the most famous initiative in the field of participatory mapping by many collaborative volunteers is the OpenStreetMap (OSM) project. The information crowdsourced in this way is presented to the public as open data. Since the start of the project in 2004, an enormous amount of data on a wide range of spatially related phenomena has grown. Meanwhile, due to the very high data density and high spatial resolution in many areas of the world, the data of the OSM project have become an important archive of geospatial data for map production and analysis of spatial patterns in GIScience. As a consequence of this development and the active participation of many contributors, it represents one of the most important sources for collaboratively mapped geospatial data [4].
As the popular example from the OSM project shows, the approach of crowdsourcing georeferenced information can provide a broad data basis for decision making in many contexts. Nevertheless, concerning the benefits of crowdsourced data on questions of mobility, Zourlidou and Sester’s recent literature review emphasizes the need for further research [5]. It can be an efficient method of data collection, especially for research work that involves the collection of data, perceptions, and evaluations of single individuals, i.e. focusing on the perspective of the data producers themselves.
If this type of data collection is intrinsically motivated, the information generated is often called VGI according to Goodchild [6], especially in the GIScience domain or within the framework of citizen science initiatives in which spatial phenomena are systematically mapped [7]. Authors who increasingly emphasize the organizational structure based on the division of labour during collaborative gathering of georeferenced data also call them crowdsourced geospatial data [8]. Others, who particularly emphasize the technological possibilities of networked Web 2.0, only refer to the geospatial data produced by a large number of users as user-generated geographic content [9].
Due to the manifold possibilities of data acquisition methods through the new media and especially through the ubiquitous use of smartphones, a number of new data sources are emerging for a variety of research fields. With regard to the various data sources and applications that exist today, it becomes clear that modern techniques for tracking and positioning are emerging. Especially for the purposes of monitoring bicycle traffic and investigating the behavior of cyclists, this category of data is growing in importance [10].
In line with these terms, the concepts behind them and their technological frameworks, citizens can thus be understood as promising sensors for the occurrence of specific phenomena whose spatial patterns are to be investigated. However, data and information resulting from participatory mapping practices are also viewed critically and are critically viewed in the literature, too [11,12,13]. Nevertheless, it can be stated that the data basis generated by approaches of participatory mappings also changes the authority to interpret spatial structures of public space and ultimately cannot anymore be assessed exclusively on the basis of official geospatial data [14].

1.2. Cycling Hazards and Their Perception

With regard to the research landscape on hazards in cycling, many studies can be identified that deal with the evaluation of accident data and derive spatio-temporal conclusions from it, and these studies sometimes take highly contextualized regional characteristics into account. On the other hand, there are also works that focus on questions of perception and the individual feeling of safety.
For the assessment of hazards and accidents in cycling, there are various investigations that examine the influence of infrastructure on accident occurrence. Most of them link road type, intersections, and bicycle facilities, e.g., the presence of bike lanes, to the risk of crash events and or injuries. This is commonly phrased as risk. Fewer also highlight the relevance of temporal dynamics to the understanding of variability of risk.
Concerning the identification of particularly dangerous elements in the road network, a broad spectrum of works exists, and they have identified a number of relevant factors for the evaluation of hazards for bicycle traffic. Infrastructure has been dominantly pointed out as a major factor influencing injury and crash risk [15]. Infrastructure in this sense often refers to bicycle facilities [16,17,18,19], such as on-road track routes, on-road marked bike lanes, and off-road bike paths. Often it also refers to the condition and type of lane, e.g., road size and speed limit [20,21,22]. Furthermore, zones of multiple use, such as intersections, shared pathways, or parking lot entrances, are identified as contributing to bike hazards [19,23,24].
Temporal studies usually underpin the relationship between safety on the one hand and traffic volume on the other. They follow the assumption that safety is related to traffic volume in such a way that safety increases with higher traffic volume—the so-called safety-in-numbers (SiN) effect. The existence of this effect is ambiguously debated in the literature [25]. Lücken and Wagner [26] have also shown that the effect is dependent on the underlying time scale or that a corresponding scale-dependent emergence can be observed; with higher temporal resolutions, risks increase with traffic volume. Accordingly, a consideration of the daily and sub-annual traffic volume is relevant for the general understanding of accident patterns. Loidl et al. [27], for example, show spatial and temporal patterns of bicycle crashes over a 10-year period in the city of Salzburg, Austria, with temporal variations of bike crashes on several time axes.
In addition to studies on hazard patterns, insights into perceived safety, i.e., the individual and social perception of hazards, are also relevant. Firstly, they can serve as predictors for actual hazard situations, such as dangerous intersections or high traffic volumes. This ex-ante approach, identifying hazards before they lead to harm, stands in contrast to the ex-post analysis of accidents. Even though these phenomena are hard to quantify or measure, which is due to their intangible nature, still, society has a keen awareness of what constitutes hazards for cyclists [28]. Secondly, in combination with the above predictors, they provide insights into why people are discouraged from using a bicycle despite the intention to use it. On this, Useche et al. [29] point out that perceived risks are among the key factors discouraging cycling.
Naturally, approaches on individual perception are also influenced by a number of inherent aspects, i.e., the degree of risk perception depends on specific pre-conditionings and varies between individuals. According to this, the sensitivity to perceive risks in cycling depends on external and intrinsic factors [30]. Bazilinskyy et al. [31] cite individual experience in bicycle use and the regional context as factors for risk perception. They also point out that social parameters have a decisive influence on the individual assessment of hazards and risks in cycling.
These psychological aspects, such as the amount of stress in certain traffic situations [32], have been investigated in many studies which primarily focus on perceptions of risks and hazards. Relevant research on this is being carried out in the field of cognitive sciences, where the perception of space while cycling is examined [28]. The study of Zeile and Resch [33] also shows that the emotional variations during cycling in the urban contexts depends on the traffic situation and street conditions. Using bio-sensing technologies, consequently, they quantify the extent to which society perceives hazards.
Although the subject of cycling is being intensively researched on the basis of accidents that have actually occurred or perceived dangers, open questions and ambiguities remain. In general, more in-depth analysis is needed to understand temporal dynamics and types of crashes involving cyclists [27]. Additionally, causal factors and social parameters require further investigation, and there is a need for more empirical evidence relating to the benefits and costs of planning activities [34].
Many of these research needs can only be clarified comprehensively based on a local case study scale. The synopsis of locally contextualized findings can contribute inductively to further insights. To provide further empirical evidence for the local scale, this study aims to make a contribution to the understanding of the nexus between perceived hazards and documented accidents on the local scale.

2. Material and Methods

2.1. Cycling in the City of Freiburg

The city of Freiburg, Germany, is particularly well suited to pursue such questions in the context of a pilot study, since on the one hand, cycling is of great importance in urban traffic, but on the other hand, the proportion of cyclists involved in accidents is over-represented. An even greater number of unreported cases can be assumed, since data is only available for accidents recorded by the police or insurance. For example, Utriainen [22] pointed out for Finland that only 21% of bicycle accidents are officially documented. For Freiburg, bicycle traffic accounts for 26% of the total traffic volume [35]. This, and in comparison with other cities of this size, means that bicycle traffic is highly present in Freiburg all over the year. Thus, the high amount of bicycle traffic corresponds with high rates of bicycle-related accidents. During the years 2016-2018, on average 447 accidents p.a. occurred, which means 50.35% of all traffic accidents (Table 1).
With regard to the temporal patterns in the official accident data, it is noticeable that accidents involving cyclists are subject to strong seasonal fluctuations. While, on the one hand, better weather conditions in the summer months lead to a higher number of cyclists, which is also reflected in a higher frequency of accidents, in the autumn and winter months, poorer light and road conditions in particular contribute to an increase in accidents. Nevertheless, most accidents occur under good external conditions, i.e., with sufficient daylight and a dry road surface. Therefore, these external conditions can be disregarded when evaluating bike accidents. An analysis of traffic situations in the occurrence of accidents involving bicycles and an examination of the underlying types of accidents makes it clear that most accidents happen while leaving or crossing traffic lanes. According to Crucitti [37], the centrality of a road network plays a major role for understanding spatial patterns of bicycle accidents, which von Stülpnagel and Lucas [38] also emphasize for Freiburg.
As noted above, the issue is the under-reporting of bicycle accidents, especially in the case of minor accidents [1,39,40,41]. In this sense, we suspect a much higher rate of bicycle-related accidents for the city of Freiburg, although we are unable to quantify it.
All these aspects, in particular the fact that bicycle accidents are over-represented in accident statistics against the emergence of other means of transport, lead to the city being predestined to investigate the dangers of bicycle traffic using crowdsourcing methods. Although Freiburg has an extensive network of paths and cycle priority routes, there is no known data on which routes are actually chosen when typical connecting daily routes between two points of interest are crossed by a bicycle. There is also little empirical work on data on the perceived hazards or risks on these routes.

2.2. Objectives and Research Questions

Urban mobility, especially by bicycles, is extensively being analyzed in various scientific fields with the aforementioned gaps in knowledge. However, the example of the so-called cycling-friendly city of Freiburg shows the continued need for a deeper understanding in order to identify actions to be prioritized in regional planning on a local scale. Taking this into account and with the need of locally contextualized field studies, here the objective is to introduce crowdsourced VGI as a promising and low-cost approach for regional planning. This is intended to give planners complementary information and to consider the needs of cyclists. Thus, the paper also shows how a paradigm shift from an exclusively placed-based to a people-based analysis can be implemented in practice.
The literature has shown promising findings on the scientific usage of VGI, but data quality issues as well as local specifics still need to be addressed. Hence, we aim to clarify whether a crowd of non-professionals is able to accurately map hazards based on their individual perceptions. According to that statement, firstly, an investigation is conducted into whether laypersons are able to identify past accident sites, e.g., they suspect dangers where accidents involving bicycles have already occurred in the past, and whether hot spots can be derived from that kind of mapping. Once the spatial patterns of hazards have been found, secondly, questions as to the classification of perceived hazard types as well as whether they can be attributed to specific lane types arise. While the first question asks for spatial dimension, the second additionally differentiates between content-related aspects of perceived hazards.

2.3. Collaborative Research Design

According to citizen science initiatives, in which participants not only take on the task of collecting data but also actively define the object of investigation from the very beginning, the contributors, a small crowd of 30 students, was directly involved in the design of the project. In line with this idea, in late 2019, there was an open discussion about relevant categories for the assessment of cycling hazards among the contributors. The crowd can be characterized as homogeneous in terms of age (21–33 years, mean = 24.3) and education (university undergraduates). Conversely, the familiarity with the local context (mental maps and traffic volume) is more diverse; cycling experience ranges from daily users (>1 trip per day; n = 53.3%) to regular users (1–3 trips per week; n = 33.3%) to non-periodic cyclists who rarely utilize bikes in everyday life (<1 trips per week; n = 13.3%).
These diverse perspectives resulted in categories as to what constitutes a hazard for cyclists. Conducting a pretest these initial categories were tried out in the field, which lead to minor adjustments and specifications of two main objects of investigation, namely hazards and lane types (Figure 1).
In order to collect and store data on perceptions towards hazards, we used the open source application KoBo Toolbox (kobotoolbox.org). This software solution offers a user-friendly way to systematically gather VGI via a smartphone using a standardized input format. By accessing the GPS signal of the device, the individual VGI were georeferenced in-situ, and traveled routes were tracked. Additionally, geotagged images were taken as a visual supporting description. By using this technology, the crowd’s entries were transferred directly to a central database on a server in real time.
During the data collection campaign, the crowd generated a dataset consisting of tracked routes with a length of approximately 1000 km throughout the urban area. Alongside these tracks, VGI relating to 2081 hazards and 1120 lane types was mapped, and 577 photographs provide additional visual documentation. For the broadest possible investigation, points of interest were randomly distributed throughout the city area, and these in turn were connected by individual routes.

2.4. Analyzing Uncertainties

Due to the fact that laypersons contributed VGI, several uncertainties need to be addressed by conducting further data analysis. Specifically, we identified issues related to positional ambiguities, e.g., GPS inaccuracies and the difficulty linking areal features, such as lane sections, to point geometries. Since the coverage throughout the study area differs, questions of reliability need to be considered during data analysis.
In contemplation of this vagueness and ambiguity, an approach for the aggregation of data is necessary. Usually, administrative units or rectangular grids serve as super-ordinate scale of analysis. Zoning and aggregation effects tend to induce spatial biases, phenomena often referred to as a Modifiable Areal Unit Problem (MAUP) and an ecological fallacy. Here, we address this by using hexagons with an edge length of 250 meters as a unit of aggregation, because a low perimeter-to-area ratio and the compactness of their shape decrease the sampling bias due to edge effects and make it mathematically more accurate to identify neighbours vis-à-vis other shapes [42]. Furthermore, the aggregation offers promising techniques for cross-validation and identification of similarities between neighbouring VGI. Likewise, Loidl et al. [1] point out in their aggregation of cycling accidents that hexagon grids have the lowest zoning effects compared to other geometries. They argue, however, that the specification depends on the purpose of the analysis.
Once all tracked routes and the relating VGI were aggregated onto hexagons, a systematic reliability control was conducted. The density of traveled routes per hexagon was applied as a measure for the quality of the VGI derived from traveled distances. In the course of further investigations, the reliability classes formalized the inherent uncertainties.
Consequently, all hexagons within the study area were classified according to a scale of reliability (Figure 2). This follows the assumption that the VGI that comes from hexagons that have been examined more intensively by the crowd also shows a higher quality. Accordingly, only areas that were actually investigated were taken into account. Therefore, plausibility can be verified by multiple pieces of VGI within one hexagon. Additionally, the amount of VGI is an indication of a hazardous hot spot.

3. Results

As cycling does not take place exclusively on designated cycle paths, but more generally in urban areas, especially along the shortest or fastest route, hazards were mapped between points of interest on all lane types. An overview of all crowdsourced VGI and the corresponding tracked routes clarified that dangers are concentrated particularly alongside major access roads and their intersections. Conversely, areas that are assessed as largely safe due to high coverage and missing or low hazard reports can also be identified (Figure 3).

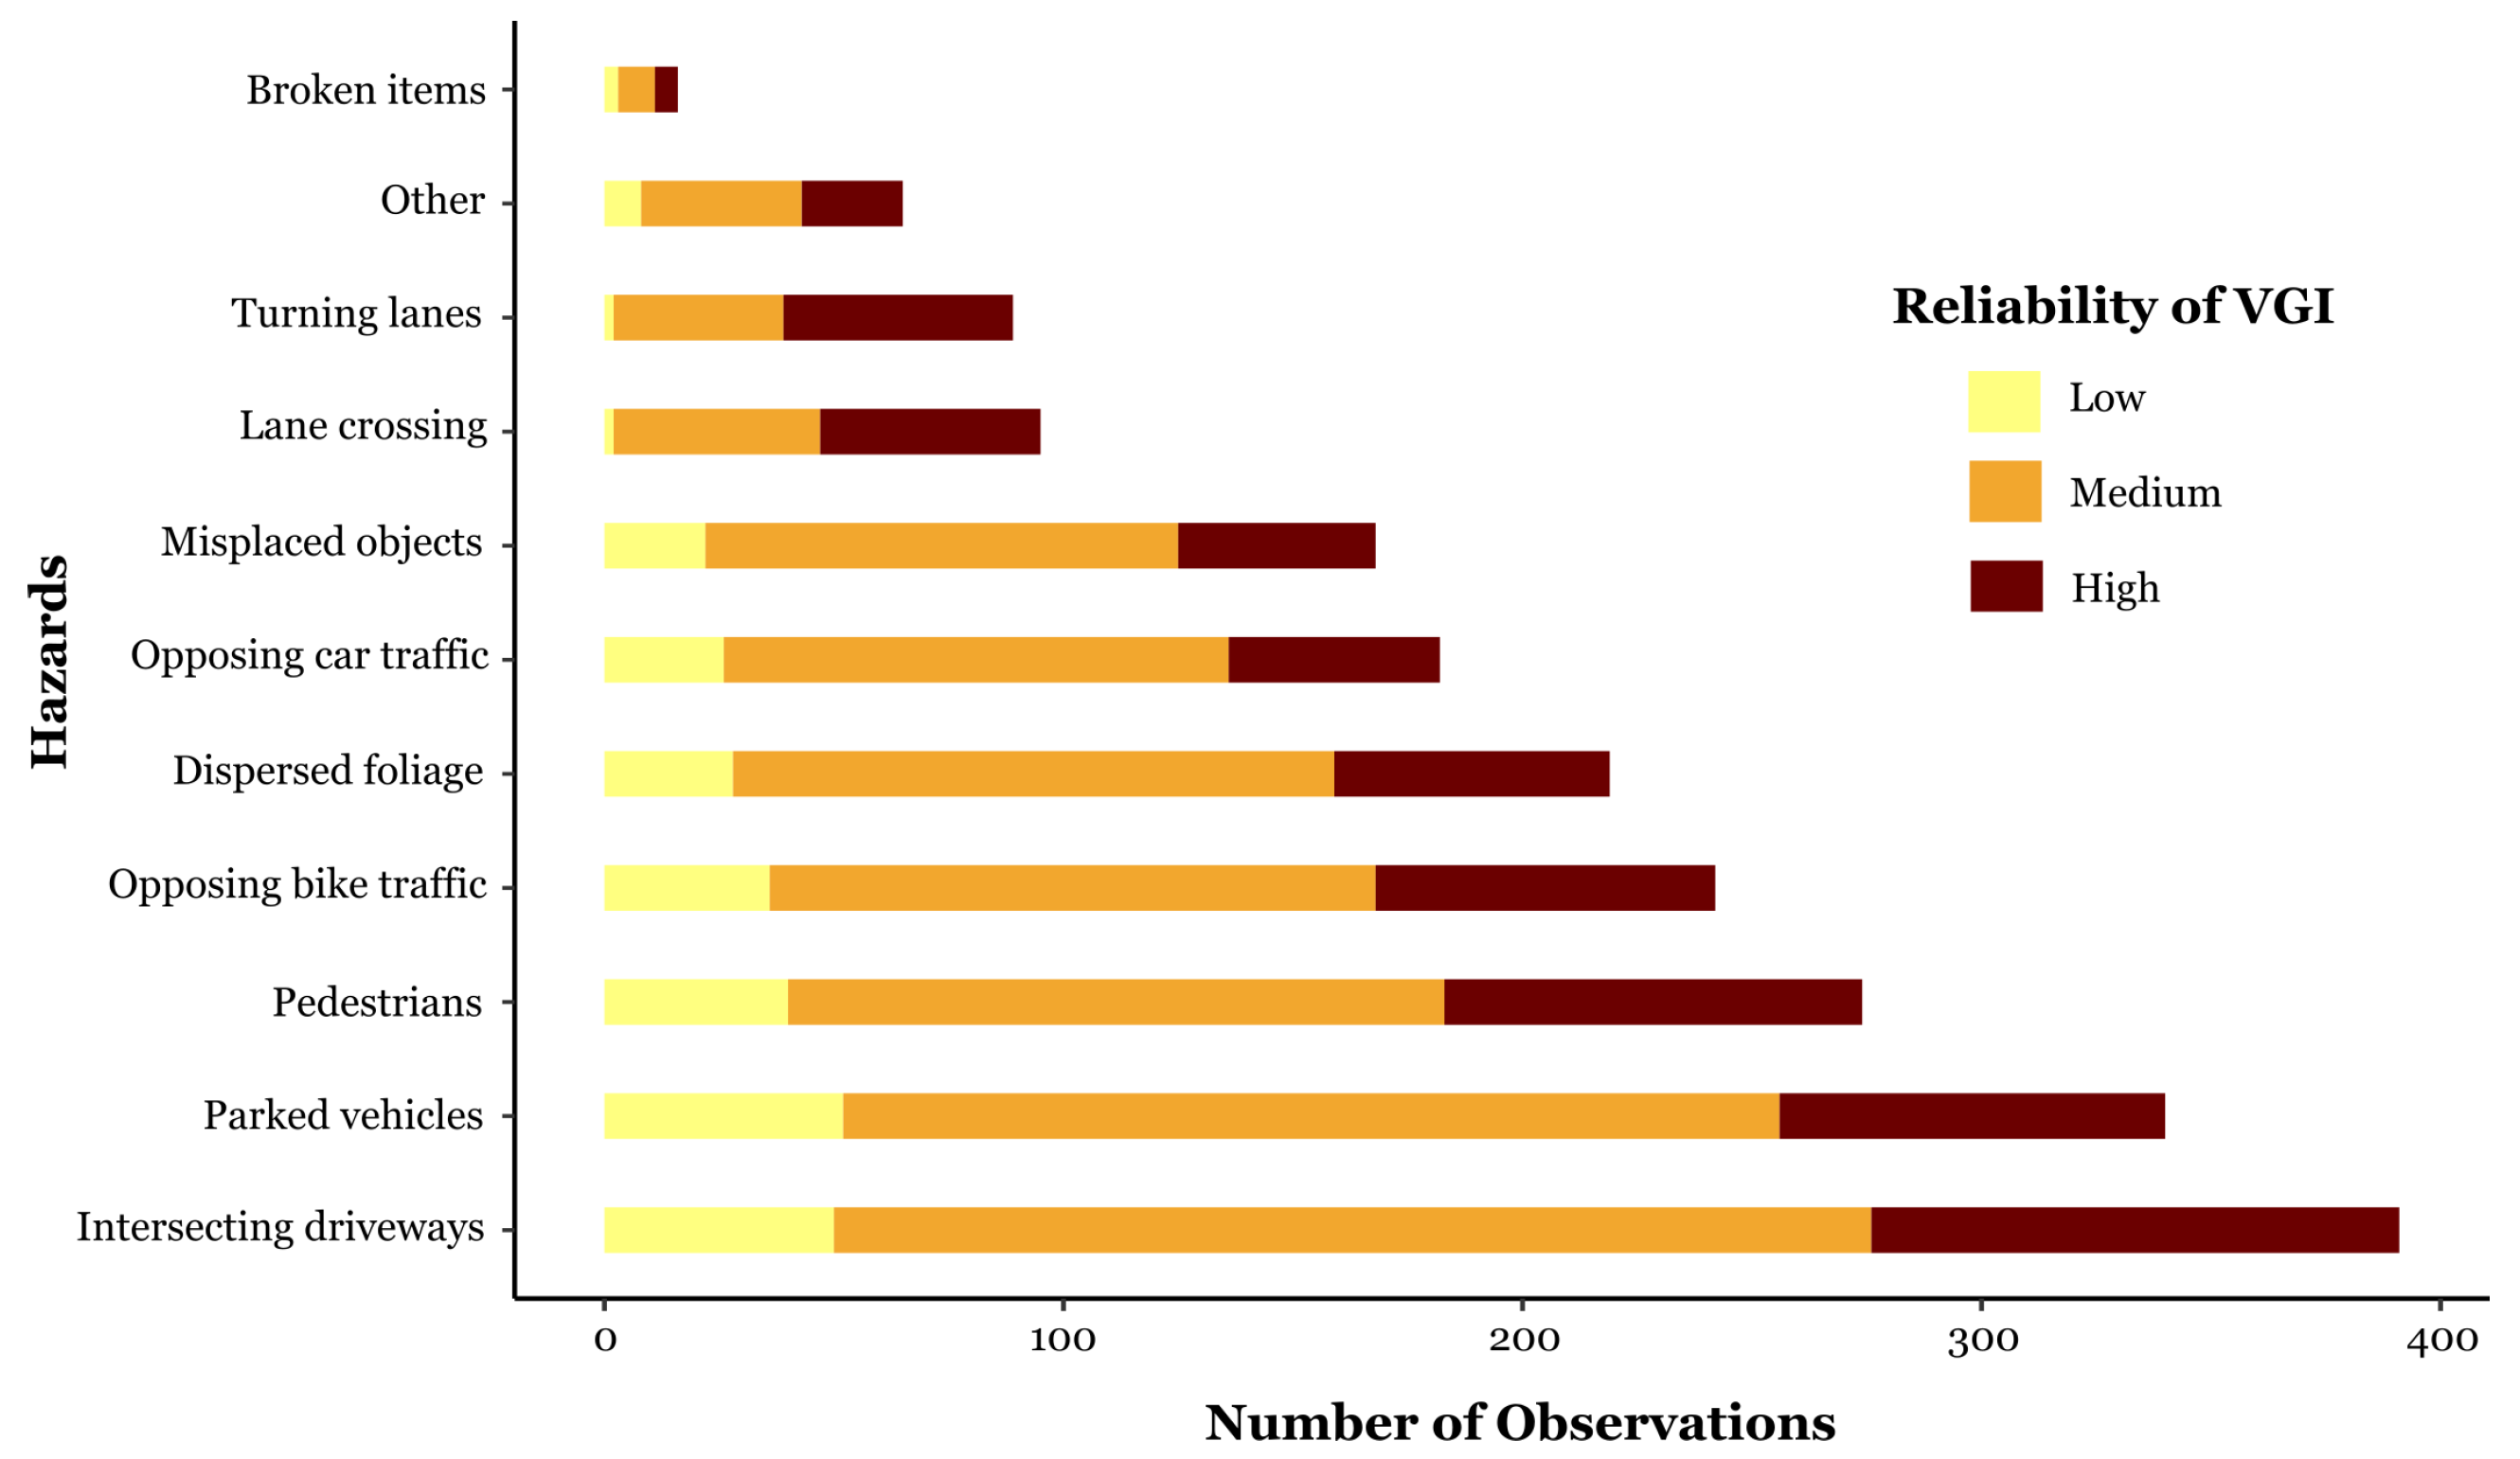
3.1. Reliability of VGI

The uncertainty analysis reveals that 36.6% of the hexagons only show low reliability, 49.3% show medium, and 14.1% show high. Out of the total number of 2081, 12.7% lie within the low reliability hexagons, 55.5% are medium reliability, and 31.8% are high reliability.
Figure 4 shows the different perceived hazards and their respective reliability classes. This shows that more than 80% of the perceived hazards were mapped in areas where medium to high reliability can be assumed. In contrast, low reliability only accounts for the minority throughout all the hazards.
Looking only at VGI marked as highly reliable, most mentioned hazards refer to intersecting driveways (18.1%), pedestrians (14.3%), and parked vehicles (13.2%). Hazards relating to turning lanes and lane crossings account for 15.4% of all hazards.

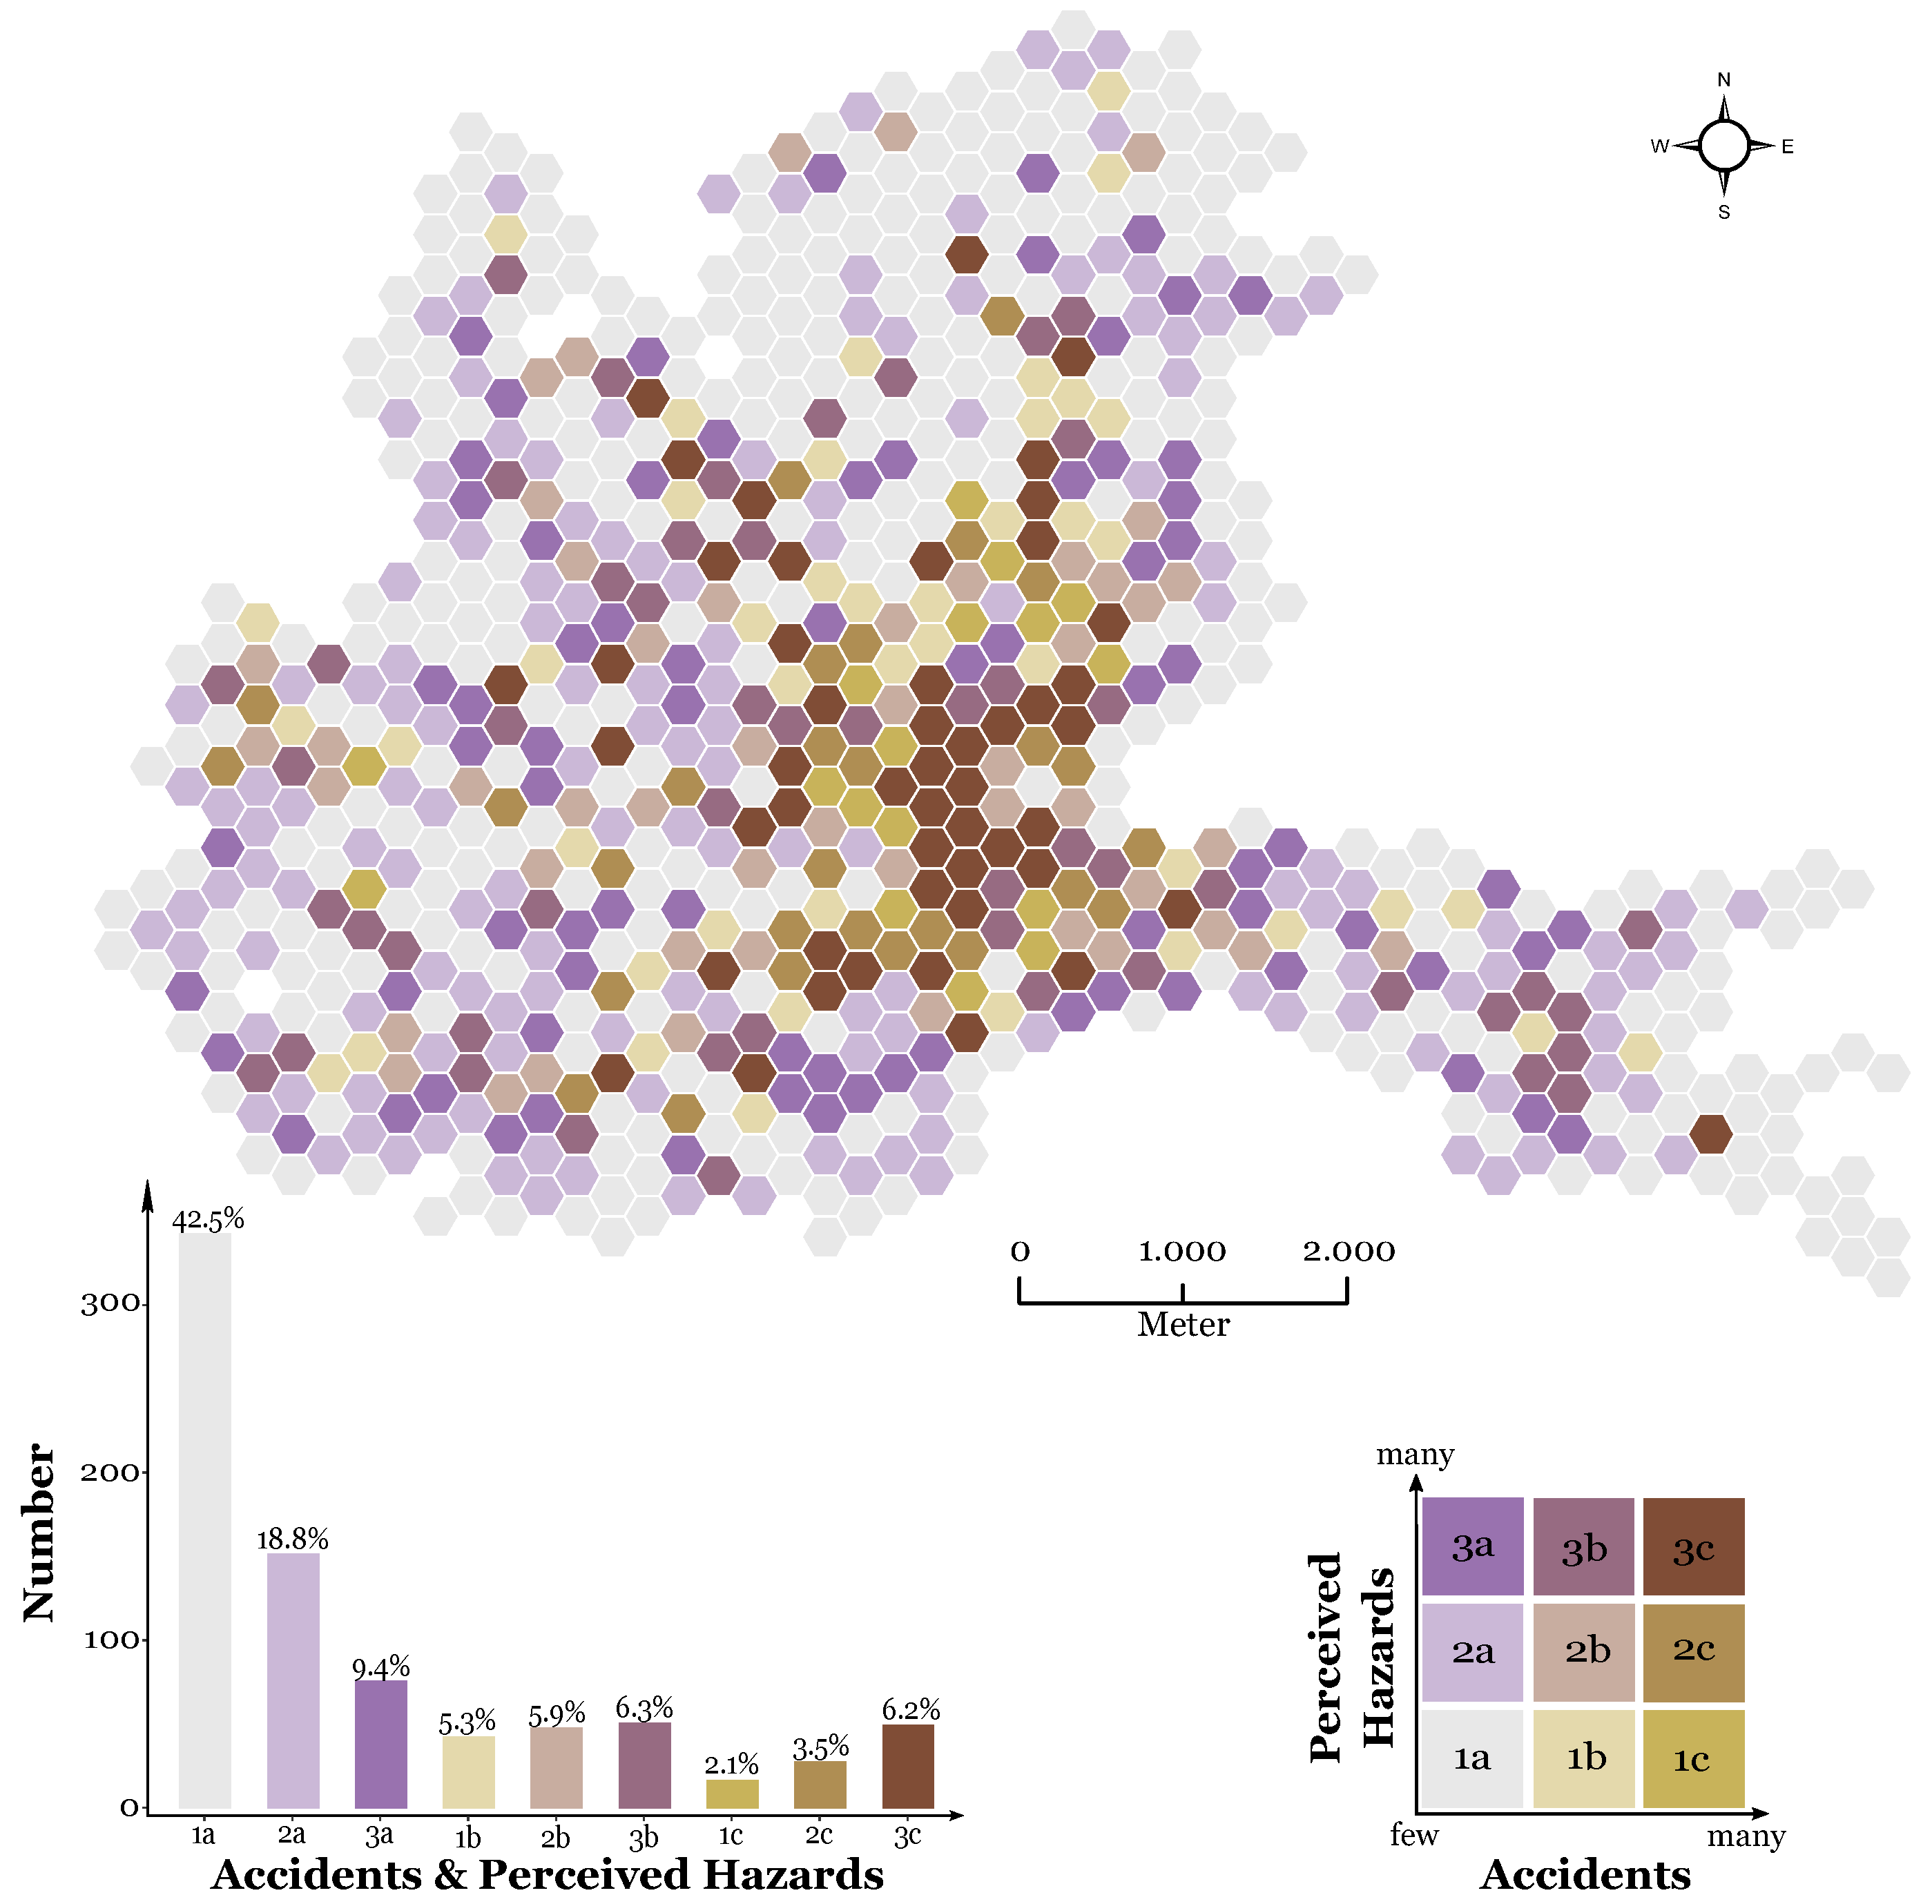
3.2. Dangerous Hot Spots

Addressing the question of whether past accidents can be reproduced by VGI, bivariate spatial analyses offer deeper insights. Here, it is of interest (1) where perceived hazards and past accidents match well and (2) where they mismatch due to one-sided over-representation.
Well matching patterns and places showed few accidents, but many hazards that have been reported were pointed out. Conversely, places where dangers measured by accidents in the past have been underestimated were grouped. The review of stacked data layers reveals a heterogeneous pattern on the local scale. Remarkably, a large cluster appears in the inner city where concentrated perceived hazards and accidents are matched. It is noticeable that this dangerous hot spot extends alongside major entrance and exit roads through the city core (Figure 5).
The bivariate analysis contains nine classes, of which three main patterns were deduced:
  • Areas in which the perceived dangers increase with the number of accidents (1a, 2b, 3c).
    3c: 
    one large cluster containing 19 coherent hexagons in the inner city area as well as 3 × 3 coherent hexagons nearby. Furthermore, scattered islands (n = 22) throughout the city area; n = 50.
    2b: 
    homogeneously scattered around the inner city with some small clusters ranging from 2 to 4 hexagons, but mainly islands; n = 48.
    1a: 
    mainly around the outskirts with large areas to the north and southwest of the inner city area; n = 343.
  • Areas where the perceived hazards increase but the accidents do not (1a, 2a, 3a).
    1a: 
    see above; n = 343.
    2a: 
    numerous coherent neighbourhoods alongside edges. Few islands but many small clusters ranging from 2 to 11 hexagons; n = 152.
    3a: 
    similar pattern to a2 but significantly fewer neighbourhoods and therefore more isolated occurrence; n = 76.
  • Areas where the accidents increase but the perceived hazards do not (1a, 1b, 1c).
    1a: 
    see above; n = 343.
    1b: 
    mainly islands; some small clusters ranging from 2 to 4 hexagons, n = 43.
    1c: 
    very small class, strongly clustered hexagons around the inner city, ranging from 2 to 4 hexagons; n = 13.

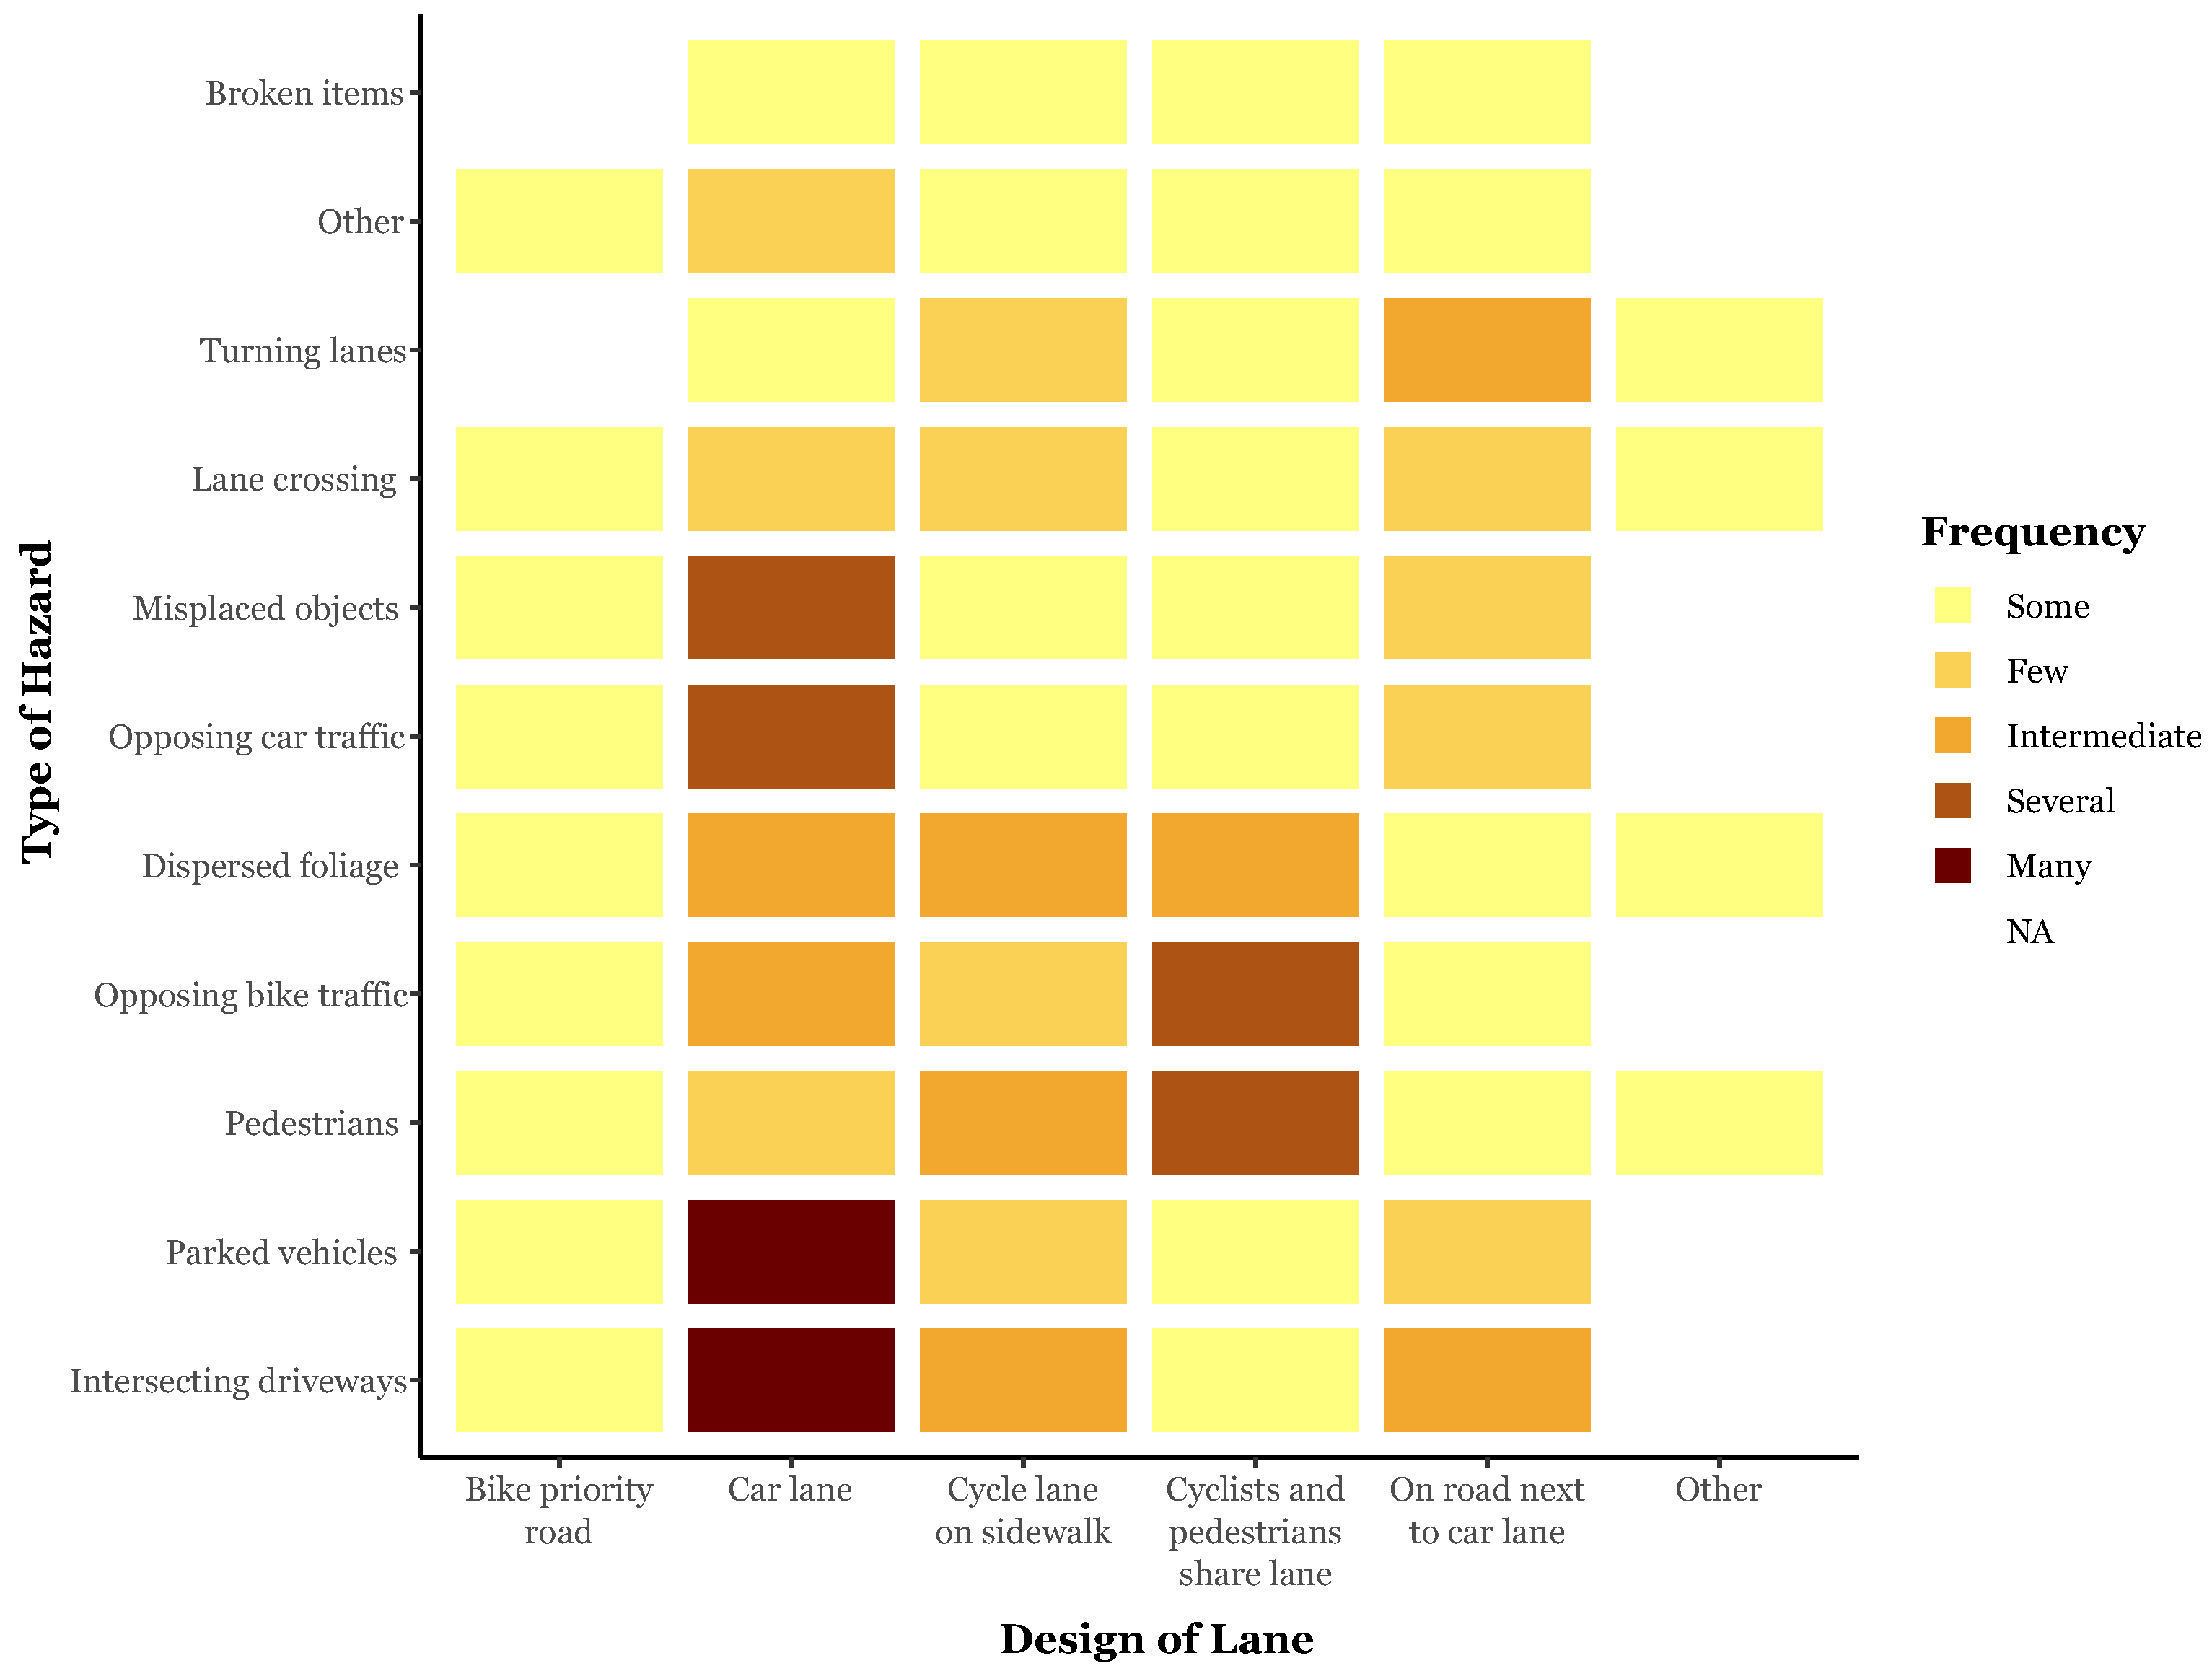
3.3. Dangerous Lane Types

The perceived hazards can furthermore be examined according to the lane type they were mapped on. This synopsis of typical hazards results in their frequencies on specific lane types (Figure 6).
Most hazards were reported with respect to car lanes without dedicated bicycle lanes. Many of them originate from parked vehicles and intersecting driveways, but there are also several dangers resulting from opposing car traffic and misplaced objects. In contrast, bike priority roads are perceived as comparatively safe, since only some hazards are reported. If the lanes are designed for both pedestrians and cyclists, several to many hazards point towards hazards typically related to mixed use, e.g., pedestrians on bike lanes or opposing bike traffic. In the case of bike lanes and roads being separated only by lane markings, most hazards arise from intersecting, e.g., turning lanes and lane crossings as well as intersecting driveways.

4. Discussion

Dealing critically with VGI, corresponding uncertainties due to crowd behavior must always be taken into account [43]. This issue was addressed by assigning three reliability classes to the data, following the assumption that, in areas with high travel rates, it can also be assumed that these zones have been intensively investigated by the crowd. Here we find higher reliability. Unsurprisingly, there are also more VGI reports. This allows for deeper analysis in order to check crowd behavior by cross-validating similarities of reports.
In line with these aspects of reliability, we need to critically reflect the crowd and highlight the fact that examined data must be interpreted with the limitations of a case study. Here, size and socio-demographic characteristics of the crowd as well as the time span of the campaign can offer exemplary insights of such a participatory mapping approach. Due to this fact, it must be assumed that the derived results will change or consolidate in a larger dataset, particularly since a more heterogeneous crowd would likely vary in terms of behaviors [44]. However, we can demonstrate that even a small crowd is able to generate comprehensive VGI with a wide-ranging coverage, if they are supported by a standardized technical backbone for effective crowdsourcing.
With regard to the respective hazard categories mapped by the crowd, two superordinate groups should be differentiated. There are reports that increasingly refer to, on the one hand, temporary phenomena (e.g., dispersed foliage, broken items, and misplaced objects) and, on the other hand, those where a direct urban planning context can be identified (e.g., intersecting driveways and turning lanes). Understandably, this division into two groups is only conditionally tenable, since some phenomena are also subject to spatio-temporal fluctuations and show references to both superordinate categories (e.g., parked vehicles and opposing bike traffic).
Referring to those VGI (out of the highly reliable) for which constructional adaptions might be applicable, we find that approximately 18% of the reports are related to entries and exits, and approximately 15% are related to hazards associated with lane changes, while approximately 13% are attributed to closely parked vehicles.
Furthermore, the potential of VGI was highlighted by comparing official accident data and perceived hazards so that the most dangerous hot spots could be identified based on this bivariate approach. To designate safe areas, it is worth looking at Category 1a filtered by hexagons of high quality (Figure 5). This makes it possible to identify areas in which, despite high travel rates, hardly any hazards have been reported, and only a few accidents have ever occurred. In contrast, Category 3c can be used to prioritize particularly dangerous areas. Due to the coarse spatial resolution, it is recommended to inspect the hot spots in situ for further evaluation in order to understand the actual characteristics of such hot spots. Thus, the designated hot spots are suitable as a starting point for implementing adequate countermeasures.
Since hazards vary spatially on the local scale and show strong relations to lane types. We agree with Fernández-Heredia et al. [45] that, although perceptions differ individually, regional planning can still improve the external factors (viz. Infrastructure), which variably affects dangers. Thus, people-based data, such as VGI, can help decision-makers prioritize regional planning. However, as Sarkar et al. [46] suggest, there is also a need to consider the role of traffic volume and street morphology in future research. This applies particularly to the question of the centrality of roads, given that it can be assumed that the positions are related to the degree of centrality [37]. Lastly, we are aware that the regional context of this study limits transferability, since risk perceptions depend on region-specific characteristics [31].
Naturally, in this study, the perceived hazards of the crowd can be differentiated and located by type, but beyond the local context it seems more promising to abstract on which lane types in relation to which a specific hazard type has been identified. In this sense, the results of this study suggest that lane type characteristics have an influence on the perception of hazards (Figure 6).
Thus, one can interpret that a spatial separation of bicycle and car traffic reduces the number of reported hazards. In the absence of such lane designs, however, more hazards tend to be reported. A similar conclusion is drawn by Heinen et al. [47], who state that the presence or absence of risks along a cycling route, among other factors, can influence individual behavior in terms of whether the bicycle is preferred to other means of transport.
Boss et al. [48] and Hull and O’Holleran [49] also note that enhancements to cycling infrastructure have a measurable influence in the sense that an adequate cycle infrastructure can encourage more people to cycle. Similarly, Sanders [50] highlights that perceived hazards negatively influence the decision to bicycle. In light of this, our results can likewise be interpreted.

5. Conclusions

The presented crowdsourcing approach illustrates the appeal of a combined use of VGI and traditional data sources. By bridging the gap between individual perception and objective parameters, risk assessments can be supplemented into regional planning, which focuses on cyclists’ needs. Such complementary information may be taken into account for the optimization of cycling infrastructure. Furthermore, it may provide authorities with the tools to engage citizens in the participatory design of future urban mobility.
In this study, we outline the promising potential of VGI about perceived hazards that helps to gain a more holistic comprehension of people-based perspectives on urban mobility. We demonstrate for the city of Freiburg that even a small group of laypersons is able to crowdsource an extensive dataset that covers large parts of the city. The VGI reference indicates numerous locations characterized by wide-ranging hazards perceived by the crowd. These were linked to other variables, such as lanetypes. Referring to this nexus, we conclude that specific lane types account for characteristic hazard categories, e.g., intersecting driveways on car lanes or opposing bike traffic on shared lanes. Unsurprisingly, the absence of designated cycling infrastructure increases the perception of hazards. On the question of whether laypersons are able to predict dangerous hot spots based on areas where accidents have occurred, we identified a spatially equivocal pattern: for the urban center, perceived hazards and past accidents correspond well. We therefore argue that the crowd has a high potential to identify and predict accident sites, which applies only to areas of intensive investigation.
To improve safety and to encourage cycling in the urban context, insights on bike hazards are essential. Innovative crowdsourcing may add user-centered perspectives and reveal unknown hazards that often prevent citizens from cycling. For a systematic use of such participatory mapped VGI, inherent unreliabilities must be taken into consideration. Hence, for subsequent research we recommend further emphasis on hazards in relation to car lanes, since improvements of such dangerous lane types affect a higher numbers of cyclists. To foster cycling, we propose a shift towards highly frequented daily routes, regardless of whether they are primarily designated as cycling lanes. This could help decision-makers prioritize effective measures.

Author Contributions

Conceptualization, R.H. and N.R.; methodology, R.H. and N.R.; software, R.H. and N.R.; validation, R.H. and N.R.; formal analysis, R.H. and N.R.; investigation, R.H. and N.R.; resources, R.H. and N.R.; data curation, R.H. and N.R.; writing—original draft preparation, R.H. and N.R.; writing—review and editing, R.H. and N.R.; visualization, R.H. and N.R.; project administration, R.H. and N.R. All authors have read and agreed to the published version of the manuscript.

Funding

The article processing charge was funded by the Baden-Wuerttemberg Ministry of Science, Research and Art and the University of Freiburg in the funding programme Open Access Publishing.

Acknowledgments

The authors would like to acknowledge everyone who was part of the crowd, who contributed VGI and shared their perceptions on bike hazards. We would also like to thank the team behind the development and hosting of the free and open source software solutions KoBoToolbox (www.kobotoolbox.org), which we used for field data collection.

Conflicts of Interest

The authors declare that there is no conflict of interest.

Abbreviations

The following abbreviations are used in this manuscript:
GISGeographic Information System
MAUPModifiable Areal Unit Problem
OSMOpenStreetMap
SiNSafety-in-numbers
VGIVolunteered Geographic Information

References

  1. Loidl, M.; Wallentin, G.; Wendel, R.; Zagel, B. Mapping bicycle crash risk patterns on the local scale. Safety 2016, 2, 17. [Google Scholar] [CrossRef] [Green Version]
  2. Attard, M.; Haklay, M.; Capineri, C. The potential of volunteered geographic information (VGI) in future transport systems. Urban Plan. 2016, 1, 6–19. [Google Scholar] [CrossRef]
  3. Miller, H. Place-Based versus People-Based Geographic Information Science. Geogr. Compass 2007, 1, 503–535. [Google Scholar] [CrossRef]
  4. Neis, P.; Zipf, A. Analyzing the contributor activity of a volunteered geographic information project—The case of OpenStreetMap. ISPRS Int. J. Geo-Inf. 2012, 1, 146–165. [Google Scholar] [CrossRef]
  5. Zourlidou, S.; Sester, M. Traffic Regulator Detection and Identification from Crowdsourced Data—A Systematic Literature Review. ISPRS Int. J. Geo-Inf. 2019, 8, 491. [Google Scholar] [CrossRef] [Green Version]
  6. Goodchild, M.F. Citizens as sensors: The world of volunteered geography. GeoJournal 2007, 69, 211–221. [Google Scholar] [CrossRef] [Green Version]
  7. Elwood, S.; Goodchild, M.F.; Sui, D.Z. Researching Volunteered Geographic Information: Spatial Data, Geographic Research, and New Social Practice. Ann. Assoc. Am. Geogr. 2012, 102, 571–590. [Google Scholar] [CrossRef]
  8. Heipke, C. Crowdsourcing geospatial data. ISPRS J. Photogramm. Remote Sens. 2010, 65, 550–557. [Google Scholar] [CrossRef]
  9. Fast, V.; Rinner, C. A Systems Perspective on Volunteered Geographic Information. ISPRS Int. J. Geo-Inf. 2014, 3, 1278–1292. [Google Scholar] [CrossRef] [Green Version]
  10. Lee, K.; Sener, I.N. Emerging data for pedestrian and bicycle monitoring: Sources and applications. Transp. Res. Interdiscip. Perspect. 2020, 111, 101–108. [Google Scholar] [CrossRef]
  11. Sieber, R.E.; Haklay, M. The epistemology(s) of volunteered geographic information: A critique. Geo Geogr. Environ. 2015, 2, 122–136. [Google Scholar] [CrossRef]
  12. Haklay, M.M. Neogeography and the Delusion of Democratisation. Environ. Plan. A Econ. Space 2013, 45, 55–69. [Google Scholar] [CrossRef]
  13. Fischer, F. VGI as Big Data: A New but Delicate Geographic Data-Source. GeoInformatics 2012, 3, 46–47. [Google Scholar]
  14. Elwood, S.A. GIS use in community planning: A multidimensional analysis of empowerment. Environ. Plan. A 2002, 34, 905–922. [Google Scholar] [CrossRef]
  15. Reynolds, C.C.; Harris, M.A.; Teschke, K.; Cripton, P.A.; Winters, M. The impact of transportation infrastructure on bicycling injuries and crashes: A review of the literature. Environ. Health A Glob. Access Sci. Source 2009, 8. [Google Scholar] [CrossRef] [PubMed] [Green Version]
  16. Wegman, F.; Zhang, F.; Dijkstra, A. How to make more cycling good for road safety? Accid. Anal. Prev. 2012, 44, 19–29. [Google Scholar] [CrossRef]
  17. Summala, H.; Pasanen, E.; Räsänen, M.; Sievänen, J. Bicycle accidents and drivers’ visual search at left and right turns. Accid. Anal. Prev. 1996, 28, 147–153. [Google Scholar] [CrossRef]
  18. Schepers, J.P.; Kroeze, P.A.; Sweers, W.; Wüst, J.C. Road factors and bicycle-motor vehicle crashes at unsignalized priority intersections. Accid. Anal. Prev. 2011, 43, 853–861. [Google Scholar] [CrossRef]
  19. Vanparijs, J.; Int Panis, L.; Meeusen, R.; de Geus, B. Characteristics of bicycle crashes in an adolescent population in Flanders (Belgium). Accid. Anal. Prev. 2016, 97, 103–110. [Google Scholar] [CrossRef]
  20. Rifaat, S.M.; Tay, R.; De Barros, A. Effect of street pattern on the severity of crashes involving vulnerable road users. Accid. Anal. Prev. 2011, 43, 276–283. [Google Scholar] [CrossRef]
  21. Raihan, M.A.; Alluri, P.; Wu, W.; Gan, A. Estimation of bicycle crash modification factors (CMFs) on urban facilities using zero inflated negative binomial models. Accid. Anal. Prev. 2019, 123, 303–313. [Google Scholar] [CrossRef] [PubMed]
  22. Utriainen, R. Characteristics of commuters’ single-bicycle crashes in insurance data. Safety 2020, 6, 13. [Google Scholar] [CrossRef] [Green Version]
  23. Kim, D.; Kim, K. The Influence of Bicycle Oriented Facilities on Bicycle Crashes within Crash Concentrated Areas. Traffic Inj. Prev. 2015, 16, 70–75. [Google Scholar] [CrossRef]
  24. Johnson, M.; Charlton, J.; Oxley, J.; Newstead, S. Naturalistic cycling study: Identifying risk factors for on-road commuter cyclists. Ann. Adv. Automot. Med. 2010, 54, 275–283. [Google Scholar] [PubMed]
  25. Elvik, R.; Goel, R. Safety-in-numbers: An updated meta-analysis of estimates. Accid. Anal. Prev. 2019, 129, 136–147. [Google Scholar] [CrossRef] [PubMed]
  26. Lücken, L.; Wagner, P. On the relation between bicycle volumes and individual risks for bicyclists in Berlin. J. Transp. Safety Secur. 2020, 12, 210–223. [Google Scholar] [CrossRef] [Green Version]
  27. Loidl, M.; Traun, C.; Wallentin, G. Spatial patterns and temporal dynamics of urban bicycle crashes-A case study from Salzburg (Austria). J. Transp. Geogr. 2016, 52, 38–50. [Google Scholar] [CrossRef]
  28. Von Stülpnagel, R.; Schmid, K. Risk perception during urban cycling in volunteered geographic information and in the lab: Effects of the vista space’s spatial properties. J. Locat. Based Serv. 2019, 13, 1–24. [Google Scholar] [CrossRef]
  29. Useche, S.A.; Montoro, L.; Sanmartin, J.; Alonso, F. Healthy but risky: A descriptive study on cyclists’ encouraging and discouraging factors for using bicycles, habits and safety outcomes. Transp. Res. Part F Traffic Psychol. Behav. 2019, 62, 587–598. [Google Scholar] [CrossRef]
  30. Zhao, D.; Zhang, S.; Zhou, B.; Jiao, S.; Yang, L. Risk perception sensitivity of cyclists based on the cox risk perception model. Sustainability 2020, 12, 2613. [Google Scholar] [CrossRef] [Green Version]
  31. Bazilinskyy, P.; Eisma, Y.B.; Dodou, D.; de Winter, J.C. Risk perception: A study using dashcam videos and participants from different world regions. Traffic Inj. Prev. 2020, 21, 347–353. [Google Scholar] [CrossRef] [PubMed]
  32. Nuñez, J.Y.M.; Teixeira, I.P.; da Silva, A.N.R.; Zeile, P.; Dekoninck, L.; Botteldooren, D. The influence of noise, vibration, cycle paths, and period of day on stress experienced by cyclists. Sustainability 2018, 10, 2379. [Google Scholar] [CrossRef] [Green Version]
  33. Zeile, P.; Resch, B. Combining Biosensing Technology and Virtual Environments for Improved Urban Planning. GI Forum 2018, 1, 344–357. [Google Scholar] [CrossRef] [Green Version]
  34. Handy, S.; van Wee, B.; Kroesen, M. Promoting Cycling for Transport: Research Needs and Challenges. Trans. Rev. 2014, 34, 4–24. [Google Scholar] [CrossRef]
  35. Nobis, C. Mobilität in Deutschland-MID Analysen zum Radverkehr und Fußverkehr; Technical Report; Infas, DLR und Infas 360: Bonn, Germany, 2019. [Google Scholar]
  36. Baden-Württemberg, S.L. Unfallatlas: Statistikportal. 2020. [Google Scholar]
  37. Crucitti, P.; Latora, V.; Porta, S. Centrality in networks of urban streets. Chaos 2006, 16, 015113. [Google Scholar] [CrossRef]
  38. von Stülpnagel, R.; Lucas, J. Crash risk and subjective risk perception during urban cycling: Evidence for congruent and incongruent sources. Accid. Anal. Prev. 2020, 142, 1–12. [Google Scholar] [CrossRef]
  39. De Geus, B.; Vandenbulcke, G.; Int Panis, L.; Thomas, I.; Degraeuwe, B.; Cumps, E.; Aertsens, J.; Torfs, R.; Meeusen, R. A prospective cohort study on minor accidents involving commuter cyclists in Belgium. Accid. Anal. Prev. 2012, 45, 683–693. [Google Scholar] [CrossRef]
  40. Watson, A.; Watson, B.; Vallmuur, K. Estimating under-reporting of road crash injuries to police using multiple linked data collections. Accid. Anal. Prev. 2015, 83, 18–25. [Google Scholar] [CrossRef] [Green Version]
  41. Janstrup, K.H.; Kaplan, S.; Hels, T.; Lauritsen, J.; Prato, C.G. Understanding traffic crash under-reporting: Linking police and medical records to individual and crash characteristics. Traffic Inj. Prev. 2016, 17, 580–584. [Google Scholar] [CrossRef] [Green Version]
  42. Birch, C.P.; Oom, S.P.; Beecham, J.A. Rectangular and hexagonal grids used for observation, experiment and simulation in ecology. Ecol. Model. 2007, 206, 347–359. [Google Scholar] [CrossRef]
  43. Senaratne, H.; Mobasheri, A.; Ali, A.L.; Capineri, C.; Haklay, M.M. A review of volunteered geographic information quality assessment methods. Int. J. Geogr. Inf. Sci. 2017, 31, 139–167. [Google Scholar] [CrossRef]
  44. Loidl, M.; Werner, C.; Heym, L.; Kofler, P.; Innerebner, G. Lifestyles and cycling behavior—Data from a cross-sectional study. Data 2019, 4, 140. [Google Scholar] [CrossRef] [Green Version]
  45. Fernández-Heredia, Á.; Monzón, A.; Jara-Díaz, S. Understanding cyclists’ perceptions, keys for a successful bicycle promotion. Transp. Res. Part A Policy Pract. 2014, 63, 1–11. [Google Scholar] [CrossRef]
  46. Sarkar, C.; Webster, C.; Kumari, S. Street morphology and severity of road casualties: A 5-year study of Greater London. Int. J. Sustain. Transp. 2018, 12, 510–525. [Google Scholar] [CrossRef]
  47. Heinen, E.; van Wee, B.; Maat, K. Commuting by bicycle: An overview of the literature. Transp. Rev. 2010, 30, 59–96. [Google Scholar] [CrossRef]
  48. Boss, D.; Nelson, T.; Winters, M. Monitoring city wide patterns of cycling safety. Accid. Anal. Prev. 2018, 111, 101–108. [Google Scholar] [CrossRef]
  49. Hull, A.; O’Holleran, C. Bicycle infrastructure: Can good design encourage cycling? Urban Plan. Transp. Res. 2014, 2, 369–406. [Google Scholar] [CrossRef] [Green Version]
  50. Sanders, R.L. Perceived traffic risk for cyclists: The impact of near miss and collision experiences. Accid. Anal. Prev. 2015, 75, 26–34. [Google Scholar] [CrossRef]
Figure 1. Exemplary photographs hazards and lane types, such as a cycle path being crossed by a car lane (1,3); garbage cans and parked cars (2); a lane type (4); a one-way street (5); oncoming traffic through cyclists (5); closely adjacent parking spaces (6); leaves on a cycle path (6).
Sustainability 12 07015 g001
Figure 2. Reliability classes derived from traveled distances per hexagon.
Sustainability 12 07015 g002
Figure 3. The entirety of all individually cycled routes as heat map based on randomly scattered start and end points. Reported VGI positions are shown alongside the routes.
Sustainability 12 07015 g003
Figure 4. Number of perceived hazards differentiated according to the reliability classes: low, medium, and high.
Sustainability 12 07015 g004
Figure 5. Hot spots according to official accidents statistics and perceived hazards.
Sustainability 12 07015 g005
Figure 6. The frequency of the perceived hazards according to the respective lane types.
Sustainability 12 07015 g006
Table 1. Official accident statistics for the years 2016 to 2018 in Freiburg, Germany. The statistics do not include accidents with only material damage and no accidents that have not been officially reported. Data source: [36].
YearOther AccidentsBicycle AccidentTotal
2016462449911
2017430422852
2018430470900

