Article

Quantitative Modelling and Perspective Taking: Two Competencies of Decision Making for Sustainable Development

1
Department of Biology Education, Göttingen University, 37073 Göttingen, Germany
2
Department of Social Sciences, Hochschule Darmstadt—University of Applied Sciences, 64295 Darmstadt, Germany
3
Department of Agricultural Economics and Rural Development, Faculty of Agricultural Sciences, Göttingen University, 37073 Göttingen, Germany
4
Psychological Methods of Educational Research, University of Bamberg, 96047 Bamberg, Germany
5
Centre of Biodiversity and Sustainable Land Use, Göttingen University, 37077 Göttingen, Germany
*
Authors to whom correspondence should be addressed.
Marko Böhm and Susanne Bögeholz are shared first-authors.
Sustainability 2020, 12(17), 6980; https://doi.org/10.3390/su12176980
Submission received: 30 June 2020 / Revised: 13 August 2020 / Accepted: 20 August 2020 / Published: 27 August 2020
(This article belongs to the Special Issue Teaching Sustainable Development Goals in Science Education)

Abstract

:
Land use change, natural resource use and climate change are challenging Sustainable Development issues (SDGs 13–15). Fostering the competencies to deal with such issues is one core task for current educational endeavors. Among these competencies, decision-making competencies are central. In detail, we investigate how learners evaluate alternative decision-making options to improve existing competence models. We exemplify our competence modelling approach using the designation of a Marine Protected Area. The cross-sectional sample consists of secondary school students and student teachers (N = 760). Partial Credit modelling shows that quantitative modelling of decision-making options is a different competence dimension than perspective taking if contextualized for Sustainable Development. In quantitative modelling, mathematical modelling is used to evaluate and reflect on decision-making options. Perspective taking covers the ability to consider different normative perspectives on Sustainable Development issues. Both dimensions show plausible (latent) correlations with related constructs within the nomological net, i.e., with qualitative arguing, economic literacy, mathematical competencies, reading competencies and analytical problem solving. Furthermore, person-abilities increase with level of education for both dimensions. The identified competence dimensions quantitative modelling and perspective taking were successfully modelled and shown to be distinct; the resulting measuring instrument is reliable and valid.

1. Introduction

Land use change, natural resource use and climate change are Sustainable Development issues (SDGs 13–15; see Section 1.1) [1] for which a suitable selection of policy measures is of paramount importance. Decision making on real-world policy measures frequently relies on quantitative data on the effects of the implementation of alternative policy options: If sufficiently valid and accurate data are available, modern decision theory makes extensive use of quantitative data [2].
This crucial quantitative aspect is inadequately reflected within Education for Sustainable Development (ESD) to date. Typically, ESD interventions focus on qualitative problem descriptions. Even if problems such as climate change are quantified, potential solutions are mostly discussed using qualitative pro and contra arguments [3,4]. Consequently, learners are not adequately equipped with the competencies to deal with complex decision-making issues for which quantitative data can be provided [5]. For instance, it will often be essential to quantitatively compare the magnitudes of ecological, social and economic advantages as well as disadvantages of policy options restricting the use of land or other environmental resources. In particular, this is relevant if advantages and disadvantages are born by different stakeholder groups. In addition to environmental values and justice, the efficient allocation of natural resources is at stake [6]. Purely qualitative argumentation is insufficient here [5].
The relative neglect of quantitative argumentation on complex decision-making challenges is not limited to ESD. Common approaches to socioscientific issues (SSIs) [7] and socioscientific reasoning [8] display similar blind spots (see Section 1.2). The main exception is economics education/financial education, in which learners are encouraged to analyze decision making through the lens of detailed analyses of trade-offs, costs and benefits [9], and frequently need to calculate numerical solutions to problems [10]. Unfortunately, economics and financial education rarely address Sustainable Development issues [6]. Recent research exceptions relate to learner conceptions on economic policy instruments or on market solutions to environmental problems [11,12]. Further, student concepts on the relation of nature and economic development have been addressed [13]. Decision making for Sustainable Development faces factual complexities and ethical uncertainties [14]. The respective learner competencies have, to our knowledge, not been investigated. Thus, a substantial research gap of high political, educational as well as academic importance exists:
Which competencies do learners bring to the quantitative evaluation and reflection of potential real-world decision-making options on Sustainable Development issues?
After identifying potentially relevant competence components [15,16], a first attempt was made to psychometrically model and measure a respective competence dimension. We called this preliminary dimension evaluating and reflecting solutions quantitatively and economically (ERSQE) [5]. This preliminary study was restricted by sample size and sample composition, and did not test if ERSQE was truly a one-dimensional construct. Thus, there is some evidence that the research gap can be closed using competence modelling. Much more solid evidence will be presented in this contribution that overcomes the major shortcomings of Böhm et al. (2016) [5]. Specifically, we test the dimensionality of ERSQE using a larger, independent and more balanced sample of secondary school students and student teachers. Most measures of psychometric fit as well as educational considerations suggest two independent ERSQE dimensions: quantitative modelling and perspective taking.

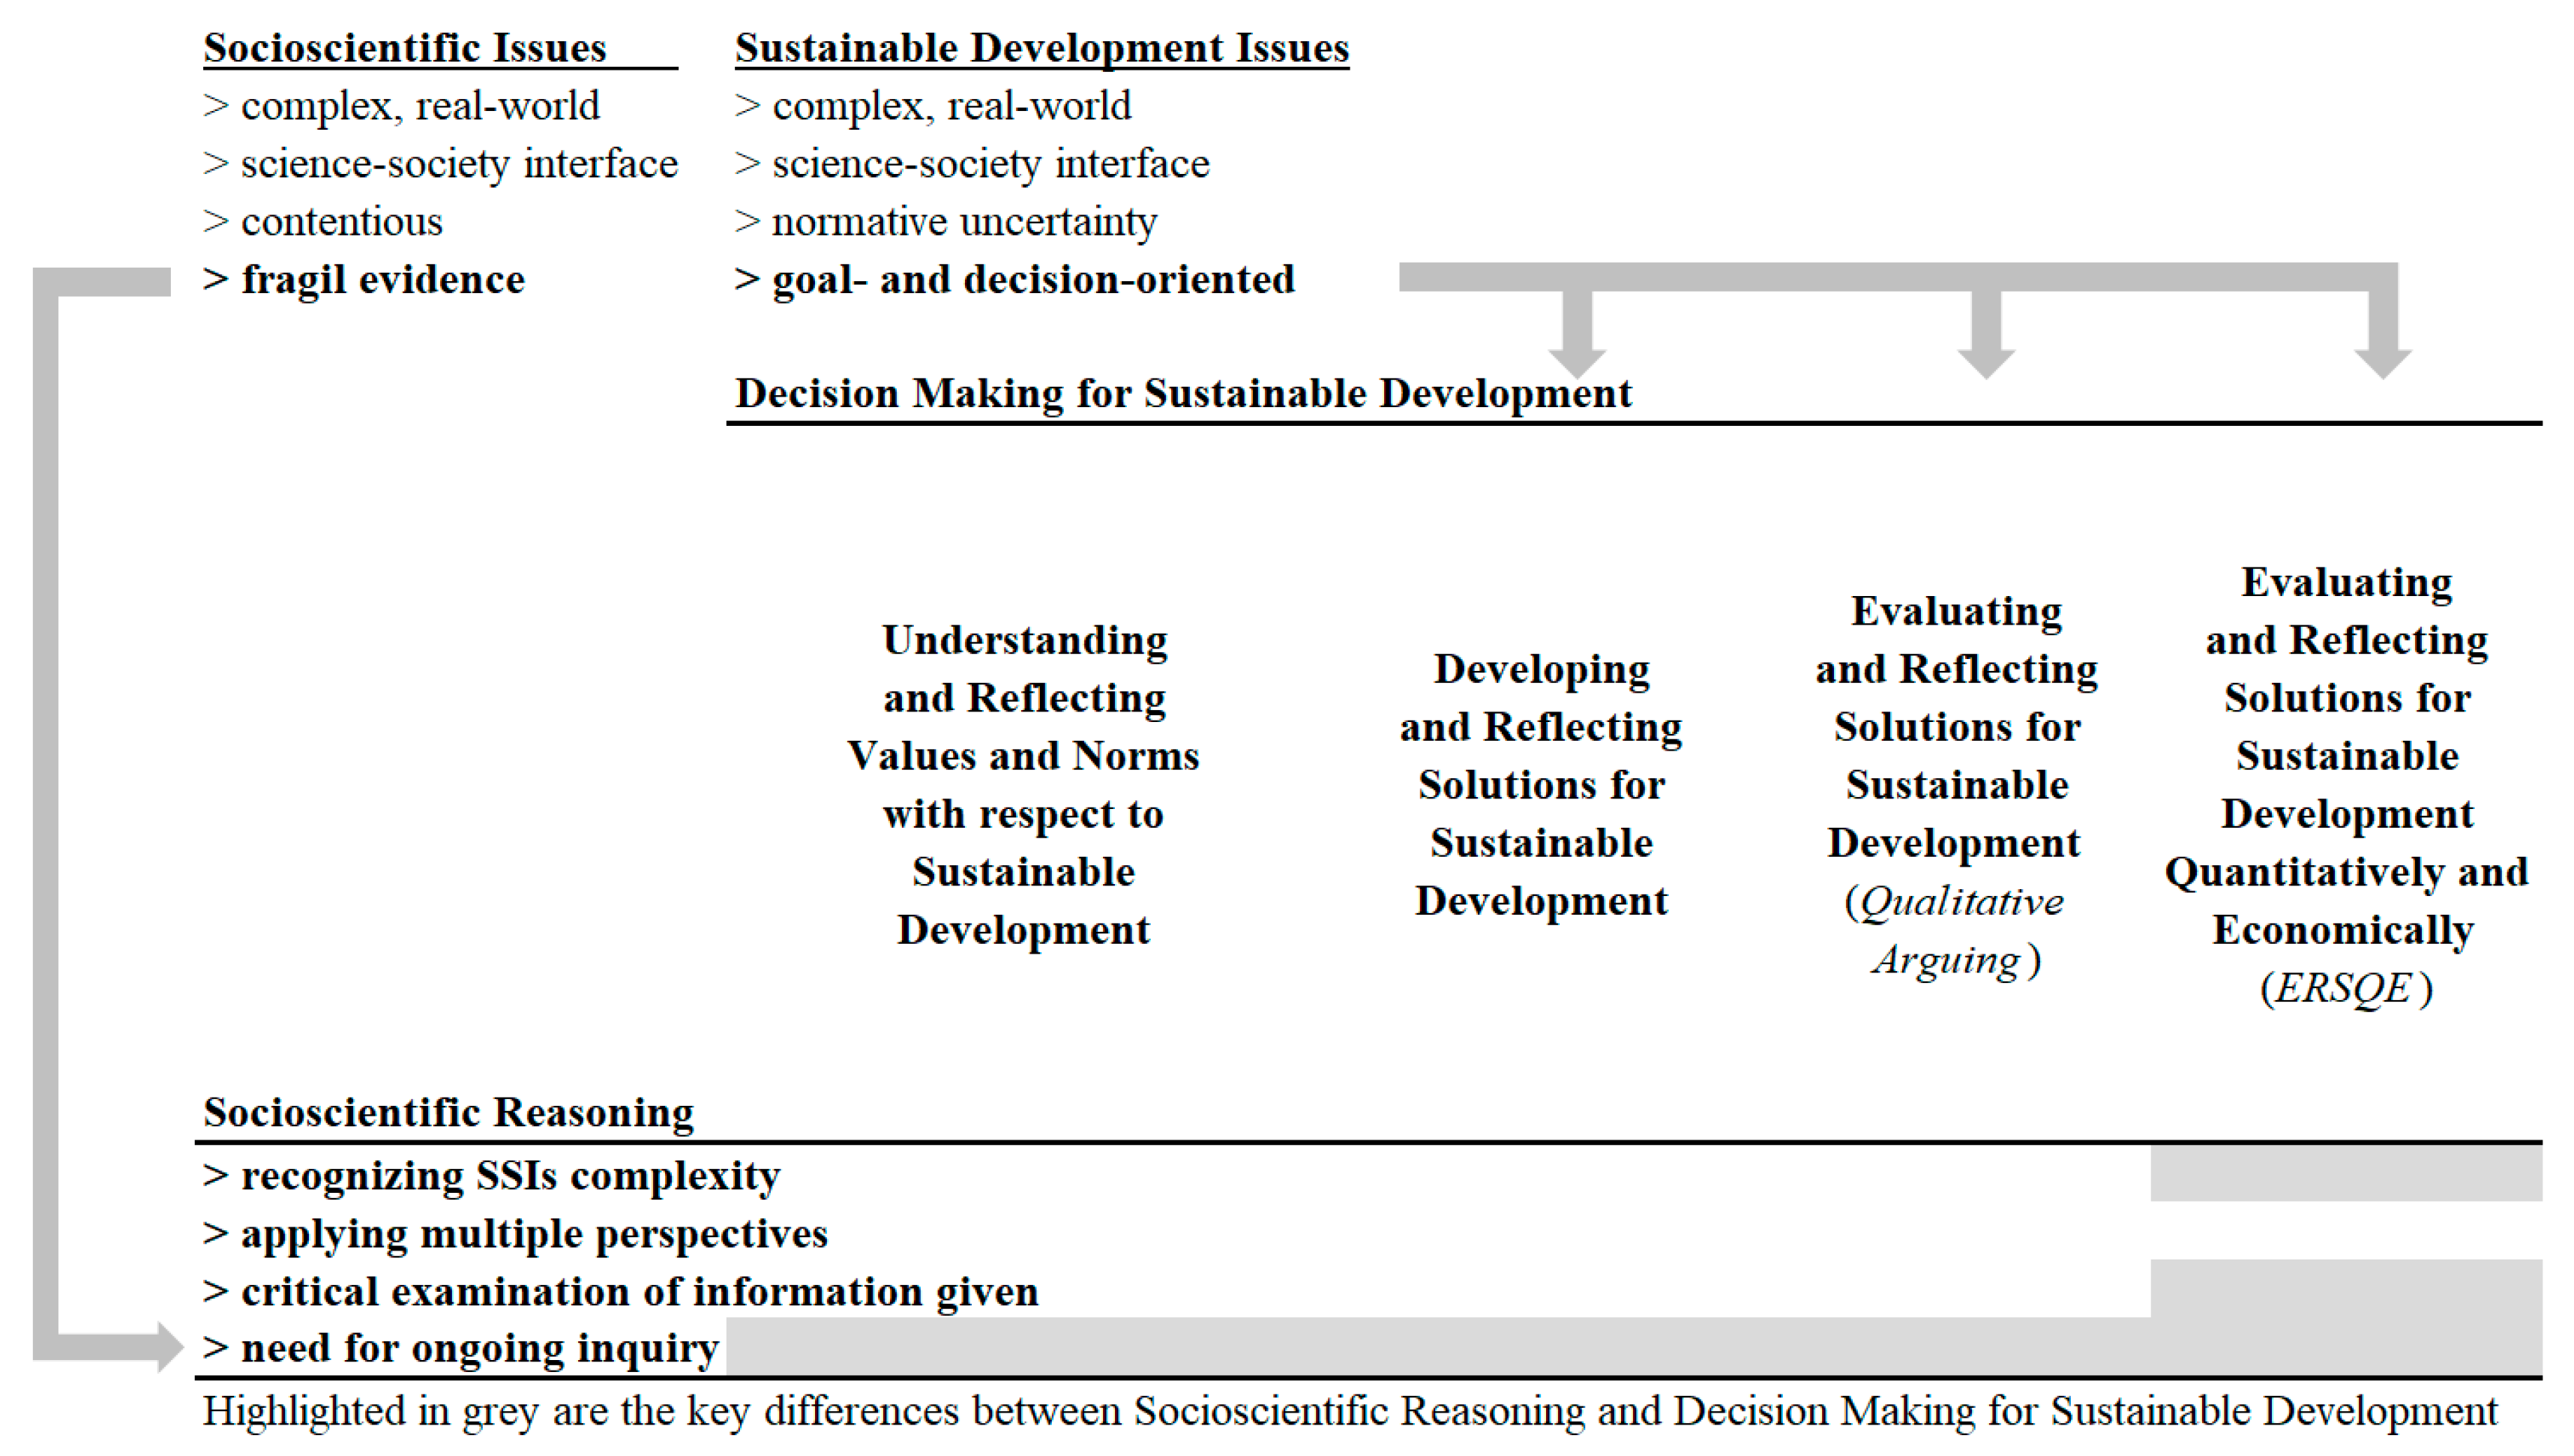
1.1. Sustainable Development Issues as Socioscientific Issues

Land use change, natural resource use, and climate change are typical Sustainable Development issues. They form a particular subset of SSIs [17]. Sustainable Development issues share relevant features of SSIs: being complex real-world issues, located at the science–society interface and often being contentious (see Figure 1). Their contentious nature stems from uncertainty in the facts used to argue specific issues (fragile evidence), and from uncertainty in the norms and values used to transform facts to societal decision making and action (normative uncertainty).
A highly relevant subset of Sustainable Development issues directly relates to Sustainable Development Goals, agreed upon internationally to guide socio-environmental development at the global scale (SDGs) [1]. Here, normative uncertainty is often particularly challenging. In this study, we focus on these normatively challenging Sustainable Development issues. To illustrate features of the Sustainable Development issues, we refer to a resource use issue and the SDG life below water. Thereby, we use Marine Protected Areas—a policy instrument to facilitate the sustainable management of fishery resources [18]—as a specific example throughout the following explanations.
  • Sustainable Development issues are factually complex. This results in factual uncertainty in assessment and judgment [16]. When establishing a Marine Protected Area, the data are often incomplete. That is because of uncertainty regarding fish stock sizes, ecosystem interactions of different populations or changing biotic as well as abiotic factors. Therefore, and also as for SSIs, scientific evidence may be fragile, requiring ongoing inquiry [8,19,20].
  • Sustainable Development issues are at the interface of science and multiple societal considerations [21]. Designating a Marine Protected Area implies a broader range of societal concerns by communicating effects from the individual level (e.g., individual opportunity costs of local fisherman due to fishing restrictions) up to a global level, i.e., welfare gain in terms of food production and climate regulation. To analyze causes and effects of current ecosystem exploitation patterns, and to devise potential options require knowledge from the natural sciences (marine biology), engineering/applied sciences (fishing and aquaculture technology) and the social and economic sciences (resource economics [11], institutional economics, rural sociology).
  • Sustainable Development issues are normatively controversial. Any specific Marine Protected Area is likely to differentially affect concerned coastal stakeholders: Traditional fishing folk at tropical shores may favor a ban on mangrove conversion to shrimp farms but may oppose restrictions on coastal fisheries. In contrast, stakeholders involved in shrimp aquaculture are likely to oppose a ban on mangrove conversion and be indifferent concerning fishing restrictions. Other examples include conflicts between tourism, biodiversity conservation and the fishing industry. This setting results in multidimensional socioeconomic, cultural and political conflicts. Solutions that please all stakeholders are difficult. Thus, implementing a Marine Protected Area is often normatively controversial [18].
  • Sustainable Development issues are goal- and decision-oriented. The designation of a Marine Protected Area implies several decisions about the location, the size and restrictions (cf. Appendix A.1 and Appendix A.2).
Some Sustainable Development issues and certain SSIs have a crucial quantitative component. The real-world discourse on many Sustainable Development issues focuses on quantitative information, e.g., on the cost-effectiveness of a particular intervention, regulation and policy measure. One example is a designation of a Marine Protected Area (see Appendix A.1 and Appendix A.2).

1.2. Socioscientific Reasoning and Decision Making for Sustainable Development

In this Section 1.2, we explain how the present research relates to the international debate on socioscientific reasoning and previous work on decision making for Sustainable Development. Romine and colleagues define socioscientific reasoning as ‘… thinking practices that individuals use as they make sense of, consider solutions for, and work to resolve complex SSI …’ [7] (p. 276). They used the socioscientific reasoning framework [8] to develop an instrument for quantitative assessment [7]. The framework for socioscientific reasoning covers a ‘four-pronged’ structure: (i) recognizing the inherent complexity of SSIs, (ii) examining issues from multiple perspectives, (iii) examining potentially biased information with a skeptical attitude, and (iv) considering that SSIs are subject to ongoing inquiry [7] (pp. 274, 277) (Figure 1). Due to the nature of SSIs, the development of instruments to assess learning outcomes in line with competence modelling is lagging [22]. Romine et al. (2017) published an instrument on socioscientific reasoning for adaptive online testing with multiple choice questions [7]. However, multiple-choice testing can be an obstacle for higher-order thinking [23], is doubtful for assessing critical-thinking skills [24] and can lead to false indication regarding the learners’ knowledge and understanding [25].
The competence model for decision making for Sustainable Development [16] (Figure 1) includes (i) understanding and reflecting values and norms with respect to Sustainable Development, (ii) developing and reflecting solutions for Sustainable Development, (iii) evaluating and reflecting solutions for Sustainable Development [4]—in the following labeled in short ‘qualitative arguing’, and (iv) evaluating and reflecting solutions for Sustainable Development quantitatively and economically (ERSQE) [5].
Qualitative arguing focuses on the use of different decision-making strategies by highlighting the process of using the pro and contra arguments of different possible solutions and weighing arguments [4]. The competence was successfully modelled as one dimension [4,26].
ERSQE focuses more on the quantification with tools and procedures from social, economic and engineering sciences with a more formal, quantitative evaluation of decision-making problems. Preliminary modelling (N = 268) with the Rasch Partial Credit Model [27] resulted in hints for a one-dimensional (1D) competence scale [5]. This study used an open-answering format. Nevertheless, this study is limited by (i) a small sample size, (ii) an unbalanced sample composition (n = 161 9th/10th graders, n = 71 11th graders and n = 36 student teachers), (iii) a lack of dimensionality testing by multidimensional modelling, (iv) a lack of testing for differential item functioning [28], and (v) a lack of validating the investigated construct with related constructs within a nomological net [29].
In general, the socioscientific reasoning and the decision making for Sustainable Development approaches are closely related in treating factual complexity, in examining or reflecting the information given and in considering multiple perspectives. Both differ in their focus: Socioscientific reasoning highlights the need for ongoing investigations and decision making for Sustainable Development underlines a more goal- and decision-oriented approach in the face of factual and normative uncertainty. The approach focuses more strongly on structured decision making either in qualitative or quantitative terms.

1.3. Research Questions

This study aims at modelling and measuring evaluating and reflecting solutions quantitatively and economically (ERSQE). The present main study represents the final step in competence modelling of the preliminary competence dimension ERSQE that resulted from a pilot study [5]. Thus, the present study belongs to the developing of the modelling of ERSQE. At the same time, the present study questions the 1D modelling from the pilot study. Doing so, both developing a model and testing an existing model is the purpose of the present study.
The pilot study [5] is restricted by sample size, sample composition and exclusively 1D modelling. Thus, the present study aims at testing the dimensionality of ERSQE for secondary school students and student teachers by an independent sample to the previous study with larger sample size and more balanced sample composition.
As current practice in competence modelling with heterogeneous sample composition, there is a need to check whether the test items function in the same way, e.g., for different levels of education [30].
Thus, the first set of research questions (RQ 1.1–RQ 1.3) concerns the modelling, dimensionality and measuring of ERSQE:
RQ 1.1
In which way can ERSQE adequately be modelled and measured?
RQ 1.2
Which is/are the resulting dimension(s)?
RQ 1.3
In which way can we use the items of the resulting dimension(s) for different levels of education?
One typical validation approach in competence modelling reflects that competencies can be learnt [31]. For example, it is a validation hint if competence increases with the level of formal education. We showed this for the qualitative arguing dimension for decision making for Sustainable Development [4,26]. Another typical validation approach concerns correlations with related constructs [32]. Up to now, validations with related constructs represent a research need in examining ERSQE related dimension(s). One related construct is qualitative arguing [4] within the decision making for Sustainable Development approach (Figure 1). Other constructs include economic literacy, mathematical competencies, reading competencies and analytical problem solving.
Thus, the second set of research questions (RQ 2.1–2.3) serves validation purposes:
RQ 2.1
In which way does/do competence/ies according to the resulting dimension(s) increase with the level of education?
RQ 2.2
In which way does/do the resulting dimension(s) differ from qualitative arguing?
RQ 2.3
In which way does/do the resulting dimension(s) differ from related constructs such as economic literacy, mathematical competencies, reading competencies and analytical problem solving?

2. Method and Approach

2.1. Measurement Instrument: Composition and Administration

For operationalizing the research questions, the approach for developing the measurement instrument published in Bögeholz et al. (2014) [16] was simplified, specified and further developed (Figure 2). The specification includes, e.g., links to selected SDGs.
The approach reflects the quantitative-economic evaluation of real-world decision making for Sustainable Development. We did that by (i) designing tasks, e.g., for resource use (i.e., decision for designating a Marine Protected Area) of relevance for SDG life below water, (ii) reflecting Sustainable Development-related norms, e.g., retinity and (iii) considering economics concepts, mathematical modelling and decision making as well as perspective taking (Figure 2). This integrative, interdisciplinary conceptualization is in line with the Next Generation Science Standards [33] (p. XV). These standards integrate disciplinary core ideas with cross-cutting concepts and scientific practices.
The measurement instrument consists of three tasks which take up three SDGs, i.e., SDGs 15 life on land, 14 life below water and 13 climate action [1]. The tasks address three Sustainable Development issues (Figure 2): land use change, marine resource use and climate change. Each task provides a particular set of requirements in order to cover a broad spectrum of challenges calling for integrative quantitative evaluation by considering different perspectives.
Regarding the land use change task, we presented a land use conflict of an Ecuadorian family. The study participants have to take the perspective of the family and decide how to use the land in the case of different incentives (e.g., protecting as much natural forest as possible). They also have to reflect on the consequences of land use decisions. For each of the three presented land use options, we gave data on the income ($) per ha, and the tons of released carbon dioxides per ha. Later, the policy instrument Reducing Emissions from Deforestation and Degradation (REDD) is introduced as a potential solution for deforestation and degradation resulting from land use changes [16].
Regarding the marine resource use task (Appendix A.1 and Appendix A.2), we presented a proposal of designating a Marine Protected Area. Thereby, the impact on different stakeholders of a local town in Great Britain has to be evaluated. We asked the participants to analyze different stakeholder interests qualitatively (e.g., item 11, Appendix A.1, Appendix A.2 and Appendix C.2) and quantitatively (item 10; Appendix A.1, Appendix A.2 and Appendix C.1). Items address an individual (items 8 and 9) and a public welfare level (items 10 and 11). For this task, the structural resemblance to the Next Generation Science Standards [33] is the following: the standards combine the disciplinary core idea biodiversity and humans by integrating the scientific practice of using mathematics and computational thinking [33] (p. 114). Within the marine resource use task, participants conduct a cost-benefit analysis addressing biodiversity aspects and impacts on different sectors of human activity (Appendix A.1, Appendix A.2 and Appendix C.1).
Further, the Next Generation Science Standards point out that ‘… empirical evidence is required to […] make claims about specific causes and effects …’ [33] (p. 114). Within the marine resource use task, we gave the empirical evidence through quantitative data in terms of costs and benefits resulting from the designation of a Marine Protected Area (Appendix A.2).
Regarding the climate change task, participants work on the policy instrument European Union Emission Trading System. The material details three options for a paper factory and a steel mill to balance their annual carbon budgets—including quantitative cost data. The learners have to reflect on the allocative efficiency of the three options using multi-step mathematical modelling. Further, they are confronted with market failure: The price of EU carbon emission certificates does not reflect the full social costs of carbon emissions. Learners are asked to evaluate what happens if the EU reduces the supply of emission certificates.
In sum, the three tasks require different kinds of mathematical modelling, quantification in combination with economics concepts (e.g., decision making and cost-benefit analysis to maximize public welfare) and perspective taking. We kept the needed level of mathematical competencies low to avoid measuring mathematical competencies. In the case of challenging concepts or policy instruments (e.g., ecosystem services; Appendix A.2), we used brief explanations and graphic representations to facilitate an understanding.
Regarding perspective taking (Figure 2), we contextualized it for Sustainable Development. The latter includes the concurrent consideration of the ecological, economic and social dimensions of Sustainable Development, action consequences at family, local and global levels, by reflecting on basic needs orientation and justice aspects.
The measurement instrument consists of an information booklet (Appendix A.1 and Appendix A.2) with the three tasks and an answering booklet. Within the answering booklet, participants work on open-ended questions or reflect on the given solutions (Appendix A.1 and Appendix A.2). Mostly, questions were ordered by increasing answering difficulty within each task. The instrument took 90 min of testing time. Positional effects were avoided at the task level by systematically varying the position of the task [34]. This results in six different booklet versions.

2.2. The Scoring of Empirical Data

Two coders analyzed the written answers to the questions using a scoring rubric for 16 polytomous items. Thereby, five items on mathematical modelling of real-world environmental problems or solutions, three items on reasoned decision making and eight items on perspective taking considering norms of Sustainable Development were coded (Appendix B.1 and Appendix B.2). The scoring rubric differentiates according to the sophistication of the given answers (Appendix D.1 and Appendix D.2). The latter implies the number of mentioned valid arguments, the degree of understanding, the degree of plausible and correct use of economics concepts, and mathematical modellings for decision making (for detailed information, see Appendix C.1 and Appendix C.2; for an overview, see Appendix D.1 and Appendix D.2). Both coders had already worked on the development of the scoring rubric in the previous study [5]. Discussions occurred in the case of disagreement. Either one coder convinced the other with arguments or an agreement on the final score was reached between both coders. The inter-rater reliability for the 16 items was very good (κERSQE = 0.99; SD = 0.01).

2.3. Sample

The cross-sectional study was conducted from winter 2015 to summer 2016 with 760 participants (Table 1). Among them were 584 pupils from seven German secondary schools from a western federal state and a new eastern federal state of Germany. In addition to that, we tested 176 student teachers (bachelor and master programs) of six universities from four federal states of Germany. The student teachers were specializing in at least one of the following subjects: biology, politics, geography, economics or mathematics. Table 1 depicts the detailed sample description for modelling of ERSQE and two validation subsamples (V-Study I, V-Study II; see Section 2.5 Correlation and Group Comparisons in Validation Studies).
The survey was conducted in regular classes and during replacement lessons. All respondents participated voluntarily. We rewarded student teachers by incentives (€15 each) for attendance. Seven hundred sixty test persons answered the questions thoughtfully. We treated any other missing answers as unworked in order to avoid model errors [35].

2.4. Procedure in Competence Modelling

Regarding RQ 1.1, the competence modelling was conducted with the Partial Credit Model [27] using Acer ConQuest version 4.14.2 [36]. Item parameters, model fit, reliability of the instrument and differential item functioning were analyzed and evaluated. For item analyses, we used the weighted (infit) mean-square fit statistics (wMNSQ) and the corresponding T-values. Item fit is considered as good, if the wMNSQ value is between 0.8 and 1.2 [37,38] and if the corresponding T-value is between −2.0 and 2.0 [38]. For item discrimination, we used the threshold of 0.25 according to PISA 2006 [39]. Following Wetzel and Carstensen (2014), the Partial Credit Model ‘… does not assume ordered threshold parameters and, […] the order of the response categories is preserved even when reversed thresholds occur …’ [40] (p. 773). Thus, categories were not collapsed necessarily due to reversed thresholds. However, categories had to be collapsed due to the restricted number of responses.
To determine the resulting dimensions concerning RQ 1.2, relative model fit was analyzed using the two information criteria: Akaike’s information criterion (AIC) [41] and Bayesian information criterion (BIC) [42]. Further, the chi-squared difference test (χ²-test) was applied. As for reliability information, the expected a posteriori/plausible values reliability (EAP/PV) was analyzed. EAP/PV is comparable to Cronbach’s alpha from classical test theory [38].
To examine if the items are appropriate for different levels of education regarding RQ 1.3, we applied differential item functioning analyses for identifying biased items in the assessment [30]. We followed Pohl and Carstensen (2012) who defined ‘… absolute differences, […] between 0.6 and 1 [as] noteworthy for further investigation, […] between 0.4 and 0.6 as considerable but not sincerely, and differences smaller than 0.4 as not considerable [differential item functioning] …’ [43] (p. 12). We compared the groups regarding the educational levels (9th/10th graders versus 11th/12th graders, as well as all school students versus student teachers).

2.5. Correlation and Group Comparisons in Validation Studies

Concerning the open question of a competence increase with levels of education posed in RQ 2.1, we conducted a one-way ANOVA using IBM’s SPSS (version 26). Doing so, we assessed the effects of level of education on the average person-abilities (weighted likelihood estimate, WLE) [44]. WLEs were z-standardized, and we used the value of ±3.29 to cut off the top and bottom 0.1% of the distribution. We applied three categories of educational levels: 9th/10th graders, 11th/12th graders and student teachers.
For validation purposes of the resulting dimension(s) out of ERSQE modelling, already established test instruments of related constructs or excerpts of these instruments were administered to a subsample of the participants in a first validation study (n = 191; Table 1). In this validation study with only one subsample, we deleted item 12 from modelling due to low discrimination.
For answering RQ 2.2 that focuses on validating the resulting dimension(s) from ERSQE modelling with qualitative arguing, we used the established instrument of our working group on qualitative arguing [4]. 1D modelling of qualitative arguing (n = 191) resulted in 13 (eight polytomous, five dichotomous) out of 14 items (ten polytomous, four dichotomous). For the instrument of qualitative arguing, we applied reasonable, less restricted thresholds for the wMNSQ of 0.7 to 1.3 [37] to keep a better representation of the construct measured. Here, we investigate how the dimension(s) resulting from our modelling differ from qualitative arguing within the competence model of decision making for Sustainable Development.
RQ 2.3 aims at validating the resulting dimension(s) from modelling with related constructs such as economic literacy, mathematical competencies, reading competencies and analytical problem solving. We applied a 12-item excerpt of the German adaptation (Wirtschaftskundlicher Bildungs-Test) [45] of the test of economic literacy [46] and an excerpt of a German mathematics test for the ninth grade (DEMAT 9) [47]. The mathematics test reviews ERSQE-relevant competencies in linear equations as well as data-based graphs and tables. The excerpts of the test of economic literacy and mathematics competencies were also Rasch modelled in order to analyze latent correlations by multidimensional modelling with resulting dimension(s) from ERSQE modelling. The 1D modelling resulted in 11 of 12 items for the test of economic literacy and 14 out of 16 for the mathematics test; we deleted items with low discrimination. In order to control for divergent validity of the from assessment resulting ERSQE dimension(s) against reading competencies, we assessed for reading speed and reading comprehension as well (LGVT 6-12) [48]. We administered the four above mentioned validation instruments (or excerpts)—including mathematical competencies, qualitative arguing, test of economic literacy and reading competencies—after the three decision-making tasks on land use change, marine resource use and climate change. These supplementary assessments took 90 min.
In a second validation study (n = 71; Table 1) six selected PISA items [49], measuring analytical problem solving, were administered after the three decision-making tasks. We only investigated 9th/10th graders as they are in the PISA age. Assessing analytical problem solving took 30 min.
For all validation instruments used, measuring qualitative arguing, economic literacy, mathematics competencies and analytical problem solving, the inter-rater reliability was very good (κqualitative arguing = 0.97, SD = 0.02; κeconomic literacy = 1, SD = 0.00; κmathematics competencies = 0.99, SD = 0.00; κanalytical problem solving = 0.99, SD = 0.04).

3. Results

3.1. First Set of Research Questions—Dimensionality, Measurement, and Differential Item Functioning

In Section 3.1.1, Section 3.1.2 and Section 3.1.3, we address the first set of research questions. We respond to RQ 1.1 (adequate modelling and measuring) in Section 3.1.1, to RQ 1.2 (resulting dimensions from modelling) in Section 3.1.1 and Section 3.1.2, and to RQ 1.3 (appropriateness of items for different educational levels) in Section 3.1.3.

3.1.1. Modelling and Dimensionality

After some refinements, such as removing two items compared to the preliminary study [5], psychometric modelling resulted in 16 polytomous items (N = 760; Appendix B.1 and Appendix B.2). The analysis of the fit parameters indicates that all items fit the requirements made explicit in Section 2.4 Procedure in Competence Modelling. ERSQE again, can be satisfactorily modelled one-dimensionally (1D; EAP/PV reliability: 0.73, item separation reliability: 0.99, variance: 0.33). In addition to that, two-dimensional (2D) modelling gives further hints: comparing a 1D and 2D modelling, the wMNSQ values of the 16 items are slightly better for the 2D model (closer to 1; data not shown). Regarding dimensionality, the final deviance, as well as the AIC and BIC, indicate a better fit of the 2D model compared to the 1D model (Table 2). The χ²-test confirmed the better fit of the 2D model (p < 0.001).
Items regarding mathematical modelling of real-world environmental problem solutions and reasoned decision making form one dimension evaluating and reflecting solutions—quantitative modelling (in short, quantitative modelling; eight items; Appendix B.1 and Appendix D.1). Items regarding perspective taking considering the norms of Sustainable Development (in short, perspective taking; eight items; Appendix B.2 and Appendix D.2) form the second dimension. The latent correlation between quantitative modelling and perspective taking in 2D modelling is 0.69 (N = 760).

3.1.2. Quantitative Modelling and Perspective Taking: Test Quality and Wright Map

The two dimensions, i.e., quantitative modelling and perspective taking, exhibit satisfactory values for the different characteristics of test quality (Table 3). For quantitative modelling, EAP/PV reliability and the variance are noticeable exceptions. For both dimensions, item reliability is very good. The average person-abilities are similar because we ‘… set the mean of the latent ability distribution to zero’ [36] (p. 24). The average item-difficulty lies higher for quantitative modelling, whereby the standard deviation for perspective taking is twice as much as for quantitative modelling. All items are within the acceptable boundaries regarding the item fit and discrimination.
The Wright map for quantitative modelling (Figure 3) shows a good fit between the item-difficulty and the person-abilities within a range of −1 to 1 logits. It is the same for the perspective taking Wright map between −1.5 to 1.5 logits. For both dimensions, only a few item steps deliver similar information, e.g., 10.1 and 2.1 for quantitative modelling as well as 11.1 and 3.1 for perspective taking (Figure 3) [37].
The content structure of quantitative modelling, as well as the ordering of the item steps, is exemplarily described for two items. First, we explain item 10 on resource use and designating a Marine Protected Area. It requires multi-step mathematical modelling (Appendix C.1). Item step 10.1 represents the step from Score 0 to Score 1. For Score 1, a person had to apply the economics concepts of public welfare as well as cost/benefit correctly (at least implicitly). The corresponding multi-step mathematical modelling is incompletely documented, but the right result presented. To achieve Score 2, in addition to Score 1, the mathematical results had to be transferred back to the given Sustainable Development issue (e.g., a recommendation for designating the Marine Protected Area). For Score 3, in addition to Score 2, the mathematical modelling has to be correct and completely documented. Also, the economics concepts have to be correctly applied (at least implicitly).
Second, item 1 on land use change requires one-step mathematical modelling (Appendix D.1). It displays nearly the same structure as item 10. Here, the economics concept profit maximization and the one-step mathematical modelling with very manageable data given are easier. Consequently, the item steps for this item are all below those of item 10 (Figure 3). In average the whole item 1 is easier than the item 10 (see item-difficulties in Appendix B.1: −0.17 and 0.60).
Regarding quantitative modelling, not all areas of the Wright map are equally well-covered. Partly difficult item steps and low-difficulty item steps that are performed with a 50% probability are lacking (needed for equal distribution between 1 and 2 logits and −2 and −1 logits). Three item steps are located at the very upper end (5.2, 13.2 and 16.2) and one item step at the very lower end (5.1). The land use item 5 focuses on an environmental economics instrument for preserving the rainforest and involves the economics concept of financial incentives. The items 13 and 16 on the climate change issue address the principle function of the EU Emission Trading System. In addition, item 13 integrates the economics concepts cost-efficiency and market failure, whereas item 16 integrates the concepts supply/demand and externalities (Appendix B.1). For achieving full credit in the items 5, 13 and 16, the test persons need to process demanding information.
In summary, the Wright map for quantitative modelling seems to differentiate the complexity of (i) the economics concept(s) at hand (difficulty-generating appears the number of economics concepts), (ii) the required mathematical modelling steps and (iii) the environmental policy instrument, which has to be reasoned. Thereby, economic and mathematical aspects must be understood separately as well as interconnected. The latter seems to be the most challenging facet of quantitative modelling (cf. Score 3 for item 10 in Appendix C.1 or Appendix B.1 and Appendix D.1).
Concerning perspective taking, we describe the content structure, as well as the ordering of the item steps, regarding marine resource use item 11. The item contains reasoning of the environmental policy instrument designation of a Marine Protected Area. To achieve Score 1, the test person had to take two Sustainable Development-specific perspectives out of three (ecological, economic and social). For the two perspectives, the point of view had to be substantiated by one valid argument for each perspective (Appendix C.2). To reach Score 2, one had to take all three Sustainable Development-specific perspectives with one valid argument for each perspective. For gaining Score 3, in addition to Score 2, more than one valid argument for at least two perspectives is required. Item steps for items with two perspectives (item 9) and item steps for items with one specific stakeholder perspective (item 8) can be found in lower areas of the logit scale for perspective taking than items which require more perspectives (e.g., item 11; Figure 3).
Perspective taking includes the cognitive processes of positioning, arguing and reasoning/reflecting. Positioning refers to tasks in which the learners have to take predefined perspectives that are very close to real-life (items 8 and 9, Appendix A.1). Arguing includes applying arguments for and against an environmental policy instrument (REDD for item 7, Appendix D.2). Reasoning/reflecting includes understanding the principle functioning of an environmental policy instrument in combination with Sustainable Development-relevant norms (see item 11 above, Appendix C.2 and Appendix D.2). Items regarding positioning (items 8, 9 and 6) are easier compared to items regarding arguing (item 7) and especially compared to items regarding reflecting/reasoning (items 3, 11, 14, and 4; see item-difficulties in Appendix B.2).
Regarding perspective taking, there are no considerable gaps between the placed item steps in the Wright Map (Figure 3). Nevertheless, two item steps are located at the upper end of the scale (see 4.2, 14.3; Figure 3). Climate change item 14 focuses on a proposal regarding a more effective functioning of the EU Emission Trading System. One can answer this item correctly by understanding the economics concept of allocative efficiency. Land use change item 4 focuses on the trade-off between a good living and its resulting negative externalities.
In summary, item-difficulties depend on the number and type of sustainability-relevant perspectives. Besides, it includes an increase in elaboration regarding the required cognitive processes of positioning, arguing and reasoning/reflecting (Appendix B.2).

3.1.3. Differential Item Functioning

According to Pohl and Carstensen (2012) [43], no proper differential item functioning occurred between lower and upper secondary school students and between all secondary school students and student teachers for quantitative modelling and perspective taking.
A comparison of the 9th/10th graders with 11th/12th graders revealed only one considerable differential item functioning for quantitative modelling in favor of the 11th/12th graders (item 10, Δδ 0.40) [43]. Not one of the items for perspective taking had considerable differential item functioning (max. Δδ 0.37). The 9th/10th graders scored 0.23 (SE = 0.03) logits lower than 11th/12th graders in all items of quantitative modelling and 0.43 (SE = 0.03) logits lower in all items of perspective taking.
Comparing the secondary school students (9th/10th and 11th/12th graders) with the student teachers, each dimension displays one considerable differential item functioning: quantitative modelling item 12 (Δδ 0.45) favors the secondary school students, and perspective taking item 9 (Δδ 0.45) favors the student teachers. All in all, secondary students scored 0.46 (SE = 0.03) logits lower than student teachers for quantitative modelling and 0.78 (SE = 0.03) logits lower for perspective taking.

3.2. Second Set of Research Questions—Validation

In Section 3.2.1, Section 3.2.2 and Section 3.2.3, we address the second set of research questions. We respond to RQ 2.1 (increase in competencies with level of education) in Section 3.2.1, to RQ 2.2 (distinction of quantitative modelling and perspective taking from qualitative arguing) in Section 3.2.2, and to RQ 2.3 (differentiation of quantitative modelling and perspective taking from related constructs) in Section 3.2.3.

3.2.1. Competence Increase in Quantitative Modelling and Perspective Taking with Level of Education

Data were normally distributed for the two groups 11th/12th graders and student teachers for perspective taking (Shapiro–Wilk test, p > 0.05), but not for 9th/10th graders for perspective taking and all groups regarding quantitative modelling (Shapiro–Wilk test, p < 0.05). Visual inspection of the histograms revealed no extreme outliers for both dimensions. Levene tests showed that homogeneity of variances could be assumed (p-values > 0.05). The average WLE person-abilities differed for the three educational levels regarding quantitative modelling with medium effect size (F(2, 748) = 46.07, p < 0.01, η² = 0.11) and for perspective taking with great effect size (F(2, 750) = 101.86, p < 0.001, η² = 0.21).
Figure 4 shows the frequency of the person-abilities regarding the three educational levels for both dimensions in detail. Dashed vertical lines mark the average person-abilities for the three educational levels. Arrows indicate the level of education at hand. Average person-abilities increased with level of education for both dimensions (Figure 4). The increase in competencies is visibly more significant for perspective taking than for quantitative modelling.

3.2.2. Quantitative Modelling and Perspective Taking with Qualitative Arguing

To find out whether quantitative modelling and perspective taking differ from qualitative arguing, 2D models for quantitative modelling and qualitative arguing as well as for perspective taking and qualitative arguing were each compared to correspondent 1D models (Table 4). 1D modelling included seven out of eight quantitative modelling items and all eight perspective taking items. The final deviance, as well as the AIC and BIC information criteria, support both 2D model solutions (Table 4).
The χ²-test confirms the latter (p-values < 0.001). In addition to that, the corresponding latent correlation of the 2D modelling between quantitative modelling and qualitative arguing is 0.46 and between perspective taking and qualitative arguing 0.67 (n = 191).
A 3D modelling of the three dimensions of the competence model for decision making for Sustainable Development revealed similar latent correlations (see Figure 5).

3.2.3. Quantitative Modelling and Perspective Taking and Further Related Constructs

Correlation analyses with related constructs serve to locate quantitative modelling and perspective taking within the nomological net. The 4D modellings reveal latent correlations of quantitative modelling with related constructs, i.e., economic literacy, mathematical competencies and qualitative arguing of the competence model of decision making for Sustainable Development (Table 5). The same applies for perspective taking (Table 6).
Quantitative modelling correlates in 4D modelling (Table 5) highest (0.81) with economic literacy, followed by mathematical competencies (0.60). The latent correlation with qualitative arguing is the lowest (0.47; cf. 0.46 in 2D modelling, see above, and 0.47 in 3D modelling, see Figure 5 above). Further, quantitative modelling displays higher latent correlations with economic literacy and with mathematical competencies than qualitative arguing (Table 5).
Regarding perspective taking (Table 6), the latent correlation again is the highest with economic literacy (0.72), followed by qualitative arguing (0.66). Mathematical competencies are weakest related to perspective taking (0.32). Comparing the latent correlations of perspective taking and qualitative arguing with economic literacy, it is roughly 0.30 higher for perspective taking. For mathematical competencies, it is approximately 0.10 lower for perspective taking than for qualitative arguing.
Very low differences (0.01 deviation) of latent correlations between related constructs (displayed in the second and third column in Table 5 and Table 6) result from rounding errors and from the two different underlying 4D models. The 191 test persons are identical in both 4D models.
Quantitative modelling and perspective taking differently correlate with performance in different school subjects (measured via grades; see Table 7). Correlations with intermediate effect sizes (0.30–0.50) are given for quantitative modelling in politics/economics for lower secondary students as well as for upper secondary students in mathematics and biology. For perspective taking, there are only low correlations—except one moderate correlation with the grade in German for lower secondary education.
Correlation analyses relating WLE person-abilities in quantitative modelling and perspective taking to analytical problem solving revealed no significant correlations (Spearman’s Rho).
Concerning partial correlation (controlled for age) of quantitative modelling and perspective taking with reading speed and reading comprehension, only perspective taking correlates significantly with reading comprehension (r = 0.16, p < 0.05).

4. Discussion

4.1. First Set of Research Questions—Dimensionality, Measurement, and Differential Item Functioning

In Section 4.1.1, Section 4.1.2, Section 4.1.3 and Section 4.1.4, we discuss results concerning the first set of research questions. We address results regarding RQ 1.1 (2D modelling and measuring of ERSQE) and regarding RQ 1.2 (resulting dimensions: quantitative modelling and perspective taking) in Section 4.1.1, Section 4.1.2 and Section 4.1.3. We argue results regarding RQ 1.3 (appropriateness of items for different educational levels) in Section 4.1.4.

4.1.1. Dimensionality

ERSQE can be modelled one-dimensionally with the Partial Credit Model, de novo. However, a 2D model better fits the empirical data. The two dimensions are: evaluating and reflecting solutions—quantitative modelling (in short, quantitative modelling), and perspective taking contextualized for Sustainable Development (in short, perspective taking).

4.1.2. Quantitative Modelling

The 1D model of quantitative modelling shows satisfactory statistics regarding item reliability, item fit and discrimination. The EAP/PV reliability is restricted but still meets the critical value of 0.50 (specified for Cronbach’s alpha, see [7,50]). Nonetheless, this coincides with a limited number of eight polytomous items [51]. Thus, selection or deletion of items was not an option for optimization. Further, workable test lengths are necessary for designing sophisticated competence tests, which can make achieving high reliability difficult [52].
Further, low reliability can occur with significant content coverage of the construct to be measured [51]. Quantitative modelling covers a broad spectrum of contents that can contribute to restricted reliability and low variance. Nevertheless, the measure provides trustworthy information because it resulted from a systematic, iterative and gradual development [5,16] according to Wilson (2005) [53].
The low variance originates from the distribution of the person-abilities (between ca. −1.5 and ca. 1.2; Figure 3). Some item steps have higher difficulty (located at approximately 2 logits) and one item less difficulty (located at ca. −2 logits). Achieving full credit for the items 5, 13 and 16 is very difficult. This phenomenon is explainable by the requirements for solving interdisciplinary Sustainable Development tasks. The necessary integrated application of knowledge from different disciplines seems to be challenging. Further, an unfamiliarity with and a reluctance to perform quantitative environmental-economic analysis of environmental problems could contribute to the item-difficulty [5].
The economic setting provides somewhat unfamiliar contexts [54] for the participants. Furthermore, the economics concepts required for many real-world Sustainable Development issues may not be connected with the underlying rational behind them [55]. The latter can result in a lack of a well-developed schema within the learner’s mind [56]. Hence, we think that the economics concepts constitute some kind of a content knowledge threshold. Thereby, the economics concepts prevent the learners from reaching a sophisticated level of socioscientific reasoning [57]. Additionally, it may be that the unfamiliarity and the knowledge thresholds, mutually reinforce each other. For instance, deficient decision making can result from a misunderstanding of basic science [54].
Findings from mathematics education can also contribute to explaining the difficulty-generating factors regarding quantitative modelling. There is empirical evidence that pupils have difficulties in applying a familiar formula in unfamiliar contexts [58]. Further, the interpretation of graphs in real-world situations is more difficult compared to spare contexts [59]. These findings may be transferred partly to economics, too. The result that the latent correlation between quantitative modelling and mathematical competencies is lower compared to the correlation between quantitative modelling and economic literacy is plausible: The solution for the Sustainable Development tasks require only a low level of mathematical competencies.

4.1.3. Perspective Taking

Perspective taking can be modelled one-dimensionally in a suitable manner. It generally exhibits satisfactory statistics regarding item reliability, item fit and discrimination as well as variance and EAP/PV reliability.
Being able to take different perspectives is of high relevance for Education for Sustainable Development: It can promote the engagement of learners with ‘psychologically distant issues’ and contribute to ‘motivate sustainable behaviour change’ [60] (p. 155). Perspective taking is in line with the dimension applying multiple perspectives of the socioscientific reasoning approach [8] and with research related to evaluating medical ethics issues [61]. The latter results from a qualitative study in which perspective taking is considered as an independent dimension. The research presented here psychometrically underpins the importance of perspective taking within Education for Sustainable Development.
The curricular relevance of perspective taking as a competence dimension is underlined in the most recent German national educational standards for biology [62], resolution of the conference of ministers of education and cultural affairs from 18 June 2020. For example, the standards demand that upper secondary school students be able to (i) look at issues from multiple perspectives, (ii) reflect short- and long-term consequences of their own and of societal decisions, (iii) reflect decision-making processes from personal, societal and ethical perspectives, and (vi) assess and evaluate the effects of biology applications in terms of Sustainable Development from ecological, economic, political and social perspectives [62] (pp. 17, 18). The most recent German national educational standards for chemistry and physics from 2020 introduce similar provisions on perspective taking [63,64]. Likewise, the national German guidelines on global development education [65] describe perspective taking as a central competence.
In sum, we improve the competence model on decision making for Sustainable Development by identifying two distinct dimensions: quantitative modelling and perspective taking. The latter is an innovative contribution of this paper.

4.1.4. Differential Item Functioning

Quantitative modelling and perspective taking can be measured among different groups of secondary school students and student teachers. Considering all analyses conducted, only items 9, 10 and 12 partly exhibited considerable differential item functioning. In perspective taking item 9, we ask learners to take two potential conflicting perspectives of a specific stakeholder (Appendix B.2 and Appendix D.2). The fact that the item is easier for the student teachers is consistent with the increase in perspective taking competence in adolescence [66]. Regarding item 10 of quantitative modelling, the participants had to conduct a cost-benefit analysis. The curricula address corresponding knowledge in grade 10 [67,68]. Therefore, it is plausible that item 10 was easier for 11th/12th graders than for the 9th/10th graders. Quantitative modelling item 12 requires identifying an error in mathematical modelling. The task was easier for the school students than for the student teachers. We explain this by the kind of task with which school students are more familiar with than the student teachers without mathematics as a teaching subject.
In sum, items with differential item functioning are limited, and thereby, differential item functioning is not ‘sincerely considerable’ [43] (p. 12), but plausibly explainable.

4.2. Second Set of Research Questions—Validation Studies

In Section 4.2.1, Section 4.2.2 and Section 4.2.3, we discuss results concerning the second set of research questions. First, we address results regarding RQ 2.1 (competence increase in quantitative modelling and in perspective taking with level of education) in Section 4.2.1. Second, we focus results regarding RQ 2.2 (distinction from quantitative modelling and perspective taking from qualitative arguing) in Section 4.1.2. Third, we argue results regarding RQ 2.3 (differentiation from related constructs) in Section 4.2.3.

4.2.1. Competence Increase in Quantitative Modelling and Perspective Taking with Level of Education

The findings that average person-abilities regarding quantitative modelling and perspective taking increase with level of education (Figure 4) is consistent with the character of competencies, which can be learnt [31]. The phenomenon of developing perspective taking during adolescence was determined ‘… as a result of cognitive development …’ [66] (p. 881). We explain the more substantial increase in perspective taking than of quantitative modelling (Figure 4) via the following: In nearly every school subject perspective taking is fostered at some point of time or even continuously. Relevant components of quantitative modelling are prone to fewer subjects and opportunities to practice.

4.2.2. Quantitative Modelling and Perspective Taking: Two distinct Dimensions to Qualitative Arguing

Figure 5 depicts three competence dimensions of the competence model on decision making for Sustainable Development. We explicitly contextualize each dimension for Sustainable Development. Latent correlations of 3D modelling show that quantitative modelling and perspective taking are relatively distinct from qualitative arguing (0.47 and 0.66). For comparison, PISA reports higher latent correlations within a range of r = 0.77 and 0.89 between reading competencies, mathematical competencies, and scientific as well as cross-disciplinary problem solving [49].
As expected, the latent correlations between quantitative modelling and qualitative arguing are lower (0.47 in 3D modelling in Figure 5 and in 4D modelling Table 5) than for both with perspective taking (quantitative modelling: 0.70 in Figure 5; qualitative arguing: 0.66 in 3D modelling in Figure 5 and 4D modelling in Table 6). The given correlations appear plausible against the background, that general cognitive abilities cannot be separated entirely from context-specific competencies [31].
In the following the resulting latent correlations of the 3D modelling of the investigated three competence dimensions of the competence model on decision making for Sustainable Development (Figure 5) are explained. The latent correlation between quantitative modelling and qualitative arguing is plausible because both share the same rational when it comes to reflecting on the advantages (benefits) and disadvantages (costs) of a particular option. Fundamental for both dimensions is the question whether the advantages of the option outweigh its drawbacks. Within quantitative modelling, learners work on this question quantitatively in the form of cost-benefit analysis. In contrast, within qualitative arguing, learners engage qualitatively by the weighing of pro- and contra arguments. For quantitative modelling, the best option in solving the task can be identified (if enough data are available), whereas, for qualitative arguing, the result is more depending on values. At the same time, qualitative arguing focuses more on the arguments and the quality of argumentation within the process of decision making instead of the resulting decision itself.
The latent correlation between qualitative arguing and perspective taking can partly be explained by structural similarity. For example, the qualitative weighing of the advantages and disadvantages of different options (qualitative arguing) is similar to considering different positions, arguments and consequences of Sustainable Development-relevant perspective taking.
Two reasons can explain the highest correlation between quantitative modelling and perspective taking. Firstly, in both dimensions, the economic points of view have to be considered. Secondly, we measured both dimensions in a combined measurement of quantitative modelling and perspective taking within the three Sustainable Development tasks of the questionnaire addressing land use change, marine resource use and climate change.

4.2.3. Quantitative Modelling, Perspective Taking and further Related Constructs

The finding that the latent correlations between quantitative modelling and related constructs resulting from 4D modelling (Table 5) are highest between quantitative modelling and economic literacy, followed by mathematical competencies, is plausible. Quantitative modelling in our questionnaire tasks requires applying economics concepts, mathematical modelling and formalization (Appendix B.1 and Appendix D.1). Even for perspective taking, the latent correlations are highest for economic literacy (Table 6), followed by qualitative arguing. The economic contextualization of both dimensions can explain the highest correlation of economic literacy with quantitative modelling and perspective taking. The more moderate (weaker) correlations of quantitative modelling (and perspective taking) with mathematical competencies can be explained by the low level of (and the not requested) mathematical competencies required to solve the questionnaire tasks.
The correlation patterns regarding quantitative modelling and perspective taking with grades from relevant subjects are in line with the contents of school curricula. We discuss the correlations of minimum intermediate effect sizes (Table 7) in the following. The 9th/10th graders quantitative modelling competence correlates with the subject politics/economics. Quantitative modelling requires relevant economics content knowledge regarding the corresponding curriculum. For example, in grade 10 topics such as the strained relationship between economy and ecology as well as the economics concepts such as efficiency (weighing costs and benefits), market failure or supply and demand are addressed in the school curricula of the two German states [67,68].
Concerning the 11th/12th graders, correlations of intermediate effect size from quantitative modelling can be found with the subject mathematics and the subject Again, these correlations can arise because general cognitive abilities cannot be separated entirely from context-specific competencies [31].
Regarding perspective taking competence, the only correlation of intermediate effect size occurs for the correlation with the grade in German for 9th/10th graders. The moderate correlation is plausible regarding the curricula for the German language, requiring argumentation [69,70].
Regarding correlations between quantitative modelling and perspective taking with analytical problem solving, no mentionable correlations occurred. The lack of mentionable correlations can be explained by the contextualization for Sustainable Development, and the specific problem situations addressed as well as the missing structural similarity of the tasks.
The missing correlation between quantitative modelling and analytical problem solving underpins the independency of an integrative quantitative evaluation from general problem solving. The complex and abstract context in which a problem is embedded affects learner strategies [71,72]. In addition to that, these strategies cannot be considered as identical across domains [73].
Regarding the control check, only perspective taking (not quantitative modelling) correlates with small effect size with reading comprehension. Thus, the impact is restricted.

4.3. Limitations

The measurement of quantitative modelling and perspective taking is also prone to some barriers. Kahn and Zeidler (2016) specify ‘… resistances to anomalous data in order to protect prior beliefs …’ [74] (p. 264). Such resistance especially applies in emotionally charged contexts. Resistance to anomalous data, in terms of points of view or arguments contrary to the students’ core beliefs [72,74], is likely within quantitative modelling and perspective taking, because Sustainable Development raises questions of justice or injustice, which can lead to emotions. Second, examining environmental problems through an economic lens was somewhat unfamiliar to most of our respondents or caused reluctance and eventually even aversions. Aversions were already reported within the context of economic life in Germany [75]. This phenomenon also occurred in our empirical data. For example, the participants of our study had to take a specific stakeholder perspective with strong economic interests. A corresponding student response was: ‘I will not take this position’ (17 years old female student). Therefore, the lacking willingness could prevent students from analyzing the land use, marine resource use or climate change issues quantitatively and economically.
This is also plausible regarding the 2014 published overview of corresponding phenomena regarding decision making in SSIs of Jho et al. [72]. SSIs that are possibly contradictory to learner beliefs, interests or values could lead learners to pay more attention to their own value judgments [72] (p. 1146). Further, the authors gave evidence in the same publication for possible influencing factors on decision making, especially regarding complex SSIs. Decision making in SSIs requires multiple types of knowledge and further considerations. They argue that this could lead to neglect scientific knowledge compared to other factors such as personal experiences and values as well as trust in scientific information (for details, see [72]).
Another limitation concerns the sample composition. It includes (i) a positive selection bias for the subsample of student teachers due to financial incentives, (ii) not all subsamples were equally sized, e.g., due to 12th graders who were in their final exams, and (iii) there are more female student teachers than male student teachers; this is in line with the situation in the teacher study programs in Germany, though.

5. Conclusions

This research on competence modelling deepens the insights on the structure of the competence model on decision making for Sustainable Development. Further, we provide instruments to realiably and validly measure quantitative modelling and perspective taking if contextualized for Sustainable Development. Thus, the work presented contributes to the desiderata of standardized assessments [76] that are in line with competence modelling [22]. Concerning perspective taking, a conceptually important and curricula-relevant competence dimension of Education for Sustainable Development could be empirically modelled. The results are promising for future educational work as perspective taking is considered as vital for promoting engagement in SSIs [8,77,78,79].
The developed instrument can analyze starting points for teaching and learning. The instrument provides information on learning outcomes, specifically, for land use issues, resource use issues and climate change issues. Thus, crucial issues of Sustainable Development and several SDGs are addressed. Furthermore, our modelled competence dimensions are contextualized for actual political decision making.
Thus, educational efforts in teaching and assessing competencies should explicitly focus on learning environments that fulfill the interdisciplinary requirements to cope with real-world tasks such as designating Marine Protected Areas (Appendix A.1 and Appendix A.2). The latter includes dealing with factual complexity and uncertainty as well as with normatively controversial issues characterized by normative uncertainty. Doing so, using available scientific knowledge and data is essential. Thereby, ecological, economic, political and social facets need to be considered in analyzing causes and effects of land use issues, resource use issues and climate change issues in devising potential solutions.
The present work enriches Education for Sustainable Development for the SDGs life on land, life below water and climate action [1,80]. The innovations provided with this study are the modelling and measuring of quantitative modelling and perspective taking for coping with the complex real-world tasks of Sustainable Development. All of these tasks include the systematic integration of economic, social and environmental aspects in decision making. This study improves existing competence models. Alongside a small set of similar studies, this paper demonstrates that these tasks can successfully be addressed by empirical educational research. Such research is the main step toward evidence-based teaching in Education for Sustainable Development.

Author Contributions

Conceptualization, M.B., S.B. and J.B.; formal analysis, M.B.; funding acquisition, S.B. and M.B.; investigation, M.B.; methodology, M.B., S.B., S.E., J.B. and C.H.C.; project administration, S.B.; resources, S.B.; supervision, S.B., S.E. and J.B.; validation, M.B., S.B. and C.H.C.; visualization, M.B., S.B. and J.B.; writing—original draft, M.B., S.B., and J.B.; writing—review and editing, M.B., S.B., S.E., J.B. and C.H.C. All authors have read and agreed to the published version of the manuscript.

Funding

The project was supported by the German Research Foundation (BO 1730/5-1).

Acknowledgments

We acknowledge support by the Open Access Publication Funds of the Göttingen University.

Conflicts of Interest

The authors declare no conflict of interest.

Appendix A

Appendix A.1. Information Booklet for the Resource Use Issue—Marine Resource Use Task—Part I

Oceans and shores are important for human nutrition as well as leisure and recreation. Oceans play a significant role regarding climate regulation as they absorb and store CO2. Further, in economic terms, oceans are of great importance for human well-being. All in all, the state of the oceans affects human well-being.
Information I for the designation of a Marine Protected Area in Great Britain
The British government plans to designate a Marine Protected Area. Communications were sent to all parties and communities concerned in order to inform citizens and economic sectors about three proposals for the designation of a Marine Protected Area (Table A1, Table A2 and Table A3).
Table A1. Three proposals for the designation of a Marine Protected Area.
FeaturesMarine Protected Area 1Marine Protected
Area 2
Marine Protected
Area 3
Area [ha]125,700156,000147,300
Percentage of Endangered Species and Habitats [%]206060
Special Features of the Marine Protected AreaNoneFish breeding grounds and fish nursery Does not include coastal regions
Sustainability 12 06980 i001

Appendix A.2. Information Booklet for the Resource Use Issue—Marine Resource Use Task—Part II

Despite the intensive use, oceans and their natural resources are poorly protected. This results in the overfishing of many fish stocks.
Information II for the designation of a Marine Protected Area in Great Britain
Due to the designation of a Marine Protected Area, no interventions may take place in the protected area. As a result, some individual economic sectors will suffer losses (costs, Table A2).
Table A2. Costs for individual economic sectors over the next 20 years.
Economic SectorsMarine Protected
Area 1
Marine Protected
Area 2
Marine Protected
Area 3
Fisheries [€]208 million 227 million346 million
Oil and Gas Companies [€]535 million811 million799 million
Telecommunications and Energy Companies [€]24 million57 million43 million
The disuse of the area, protected under a Marine Protected Area, favors ecosystem services1 generated by the ocean, such as the food production and climate regulation. The equivalent of these benefits is presented in monetary terms (see Table A3).
Table A3. Benefits to the public in the next 20 years.
Ecosystem Services Marine Protected Area 1Marine Protected Area 2Marine Protected Area 3
Food Production and Climate Regulation [€] 8000 million18,000 million14,000 million
Tourism, Research, Leisure and Recreation [€]2000 million2500 million2800 million
Sustainability 12 06980 i002

Appendix B

Appendix B.1. Overview of all Items for Quantitative Modelling:

Content,
Economics Concept(s),
-
Sustainable Development issues [Environmental Policy Instrument], and
σ 
Item-Difficulty
Items regarding Quantitative Modellingσ
1
One-Step Mathematical Modelling with very Manageable Data
Profit Maximization
-
Land Use Change Issue
−0.17
15
Reasoned Decision Making regarding the Environmental Policy Instrument
Supply/Demand and Incentives
-
Climate Change Issue [European Union Emission Trading System]
−0.11
5
One-Step Mathematical Modelling with very Manageable Data
Financial Incentives
-
Land Use Change Issue [Reducing Emissions from Deforestation and Forest Degradation]
0.07
2
Multi-Step Mathematical Modelling with Manageable Data; Additional Constraint
Minimum Principle
-
Land Use Change Issue
0.46
13
Reasoned Decision Making regarding the Environmental Policy Instrument
Cost-Efficiency and Market Failure
-
Climate Change Issue [European Union Emission Trading System]
0.60
10
Multi-Step Mathematical Modelling with Manageable Data (Cost-Benefit Analysis)
Public Welfare and Cost/Benefit
-
Marine Resource Use Issue [Marine Protected Area]
0.60
12
Reflection of a Given Multi-Step Mathematical Modelling with Manageable Data; Determination of an Error in one Modelling Step
(without any Economics Concept to consider)
-
Climate Change Issue [European Union Emission Trading System]
0.67
16
Reasoned Decision Making regarding the Environmental Policy Instrument
Supply/Demand (Pricing) and Externalities
-
Climate Change Issue [European Union Emission Trading System]
0.68

Appendix B.2. Overview of all Items for Perspective Taking:

Content,
Sustainable Development-relevant Norms or Perspectives respectively,
-
Sustainable Development issues [Environmental Policy Instrument], and
σ 
Item-Difficulty
Items regarding Perspective Takingσ
8
Positioning on the Environmental Policy Instrument
Specific Stakeholder with Economic Interests
-
Marine Resource Use Issue [Marine Protected Area]
−1.00
9
Positioning on the Environmental Policy Instrument
Specific Stakeholder with conflicting Economic and Ecological Interests
-
Marine Resource Use Issue [Marine Protected Area]
−0.74
6
Positioning on the Environmental Policy Instrument
Basic Needs and Inter-/Intragenerational Justice
-
Land Use Change Issue [Reducing Emissions from Deforestation and Forest Degradation]
−0.06
7
Arguing for or against the Environmental Policy Instrument
From Local to Global (Family/Community, Society and Humanity)
-
Land Use Change Issue [Reducing Emissions from Deforestation and Forest Degradation]
0.10
3
Reflecting Consequences of conflicting Interests in StakeholderLand Use Decisions
Equal Consideration of the Social, Ecological and Economic Dimension on a Specific Stakeholder-Level (Family)
-
Land Use Change Issue
0.11
11
Reasoning of the Environmental Policy Instrument
Equal Consideration of the Social, Ecological and Economic Dimension on a Global Level (Humanity)
-
Marine Resource Use Issue [Marine Protected Area]
0.22
14
Reasoning of the Environmental Policy Instrument
Equal Consideration of the Social, Ecological and Economic Dimension on a Global Level (Humanity)
-
Climate Change Issue [European Union Emission Trading System]
0.71
4
Reflecting Consequences of conflicting Interests in Stakeholder Land Use Decisions
Global Level (Humanity)
-
Land Use Change Issue
1.33

Appendix C

Appendix C.1. Scoring of Item 10—Quantitative Modelling

Item 10 Marine Resource Use Issue
Question:Imagine you are Margaret Fields [major of the town Whitstable]. Explain to the local community which potential Marine Protected Area you would recommend in terms of public welfare for the entire city. Justify your decision mathematically!
Content:Multi-Step Mathematical Modelling, Manageable Data
Economics Concepts:Public Welfare and Cost/Benefit
ScoringResponses
0
  • Concepts not or correctly applied (implicitly)
  • Mathematical Modelling incorrect or false, incompletely documented
9th grade, female, 16 years old
I would recommend Marine Protected Area 1 because it includes the smallest percentage of endangered species and there are not many restrictions for the fishery. In addition, the costs for individual economic sectors are lowest for Marine Protected Area 1. Also in regard of the use for the general public for the next 20 years the costs are rather small.
1
  • Concepts at least correctly applied (implicitly)
  • Mathematical Modelling with correct result, incompletely documented
9th grade, sex not specified, 15 years old
Marine Protected Area 2 should be designated.
 - € 227 million     € 18,000 million
 - € 811 million     € 2500 million
- € 57 million
 - € 1095 million   € 20,500 million
€ 20,500 million - € 1095 million = € 19,405 million
A benefit of € 19,405 million.
2
  • [see Score 1]
  • Mathematical results transferred back to the Sustainable Development issue
11th grade, male, 17 years old
             Benefits
Marine Protected Area 1  € 9233 million
Marine Protected Area 2  € 19,405 million
Marine Protected Area 3  € 15,612 million
→ Marine Protected Area 2 generates the highest benefit while safeguarding the protected species in 60% of the area.
3
  • [see Score 2]
  • Concepts correctly applied (at least implicitly)
  • Mathematical Modelling correct and completely documented
11th grade, male, 17 years old
Marine Protected Area123
Area/Surface125,700 ha156,000 ha147,300 ha
Costs [€]−767 million−1095 million−1188 million
Benefits [€]+10,000 million+ 20,500 million+ 16,800 million
Total [€]+9233 million+ 19,405 million+ 15,612 million
Per Hectare [€]+0.0734 million+ 0.1244 million+ 0.1059 million
In regard of the city’s benefit, I would recommend Marine Protected Area 2, since it contains 60% endangered species which need to be protected on one hand, and contains fish spawning grounds and nurseries, and on the other hand, the city would benefit in the next 20 years from the benefit of up to € 19,405 million. At the same time, Marine Protected Area 2 is by far the biggest profit per hectare in the next 20 years, even though it occupies a large area of 156,000 ha, it comes with a great benefit.

Appendix C.2. Scoring of Item 11—Perspective Taking

Item 11 Marine Resource Use Issue
Question:To what extent does the designation of a Marine Protected Area constitute a sustainable solution in terms of public welfare for the entire city? Justify your point of view through social, economic and economical aspects!
Content:Reasoning of the Environmental Policy Instrument Marine Protected Area
Remark:Taking three Sustainable Development-specific Perspectives: Ecological, Economic and Social
ScoringResponses
0
  • Perspective taking missing, superficial or given for one point of view, substantiated by one valid argument
9th grade, female, 15 years old
It’s a great way to protect fish species that are threatened with extinction. Even the natural space is preserved in a natural way.
1
  • Perspective taking given for two points of view
  • Points of view substantiated by one valid argument
9th grade, male, 15 years old
Social:  research for the general public
Ecological:  natural space for fish is preserved, regeneration of fish stocks and water quality
Economic:
2
  • Perspective taking given for three points of view
  • Points of view substantiated by one valid argument
11th grade, female, 17 years old
From an ecological point of view, the non-use promotes ecosystem services and thus also food production. From a social point of view, the expansion of nature reserves promotes the recreational factor of tourists. Even economically (see Table A3), the implementation of a Marine Protected Area has only advantages, as you can see the expenses cover the revenues and you get high profits.
3
  • [See Score 2]
  • At least two points of view substantiated by more than one valid argument
10th grade, female, 16 years old
I think that a Marine Protected Area is a good solution. Everyone has advantages and disadvantages.
Socially: There is more food, tourism, research, leisure and recreation.
Ecologically: It would protect the environment and also their living beings more and in a sustainable manner.
Economically: The fishery would suffer as they have less revenue in the first few years until the fish stocks have recovered. Employees have to be dismissed and there would be financial losses.
Nevertheless, in the end, every aspect, socially, ecologically and economically, has something of it. I think it’s a good solution, because at some point we have to start with sustainable thinking. Our children also want to eat fish.

Appendix D

Appendix D.1. Scoring Rubric for the Items of Quantitative Modelling

Item 1Item 5Item 2Item 10Item 13Item 15Item 16Item 12
Sustainable Development issueLand Use ChangeMarine Resource UseClimate Change
ContentOne-Step Mathematical Modelling,
very Manageable Data
Multi-Step Mathematical Modelling,
Manageable Data, Additional Constraint (secured livelihood)
Multi-Step Mathematical Modelling,
Manageable Data
Reasoned Decision Making regarding the Environmental Policy Instrument European Union Emission Trading SystemReflection of given Multi-Step Mathematical Modelling with Manageable Data; Determination of an Error in one Modelling Step
Immanent Economics Concept(s)Profit MaximizationFinancial IncentivesMinimum PrinciplePublic Welfare
Cost and Benefit
Cost-Efficiency
Market Failure
Supply/Demand
Financial Incentives
Supply/Demand (Pricing)
Externalities
(without any Economics Concept to consider)
Score 0Concept(s) not or correctly applied (implicitly);
Mathematical Modelling incorrect or false, incompletely documented
Both Concepts missing or incorrectValid Reasoning of Mathematical Modelling might be given but Error within Mathematical Modelling not mentioned
Score 1Concept(s) at least correctly applied (implicitly);
Mathematical Modelling with correct Result, incompletely documented
One Concept correctly applied (implicitly)[See Score 0]
Plus: a viable and sophisticated Criticism regarding European Union Emission Trading System
One Concept correctly applied (implicitly)Error mentioned but not precisely determined and valid Reasoning of Mathematical Modelling given
or:
Error precisely determined but valid Reasoning of Mathematical Modelling missing
Approximate Calculation Quantification partly applied
Score 2[See Score 1]
Plus: Mathematical Results transferred back to Sustainable Development issue
Both Concepts correctly applied (implicitly)[See Score 1]
Plus:
One Concept correctly applied (implicitly)
Both Concepts correctly applied (implicitly)Error precisely determined and
valid Reasoning of the Mathematical Modelling given
Mathematical Modelling completely documented Quantification completely applied
Score 3[See Score 2]
Plus: Mathematical Modelling correctly and completely documented
No Score 3 availableNo Score 3 available[See Score 2]
Plus: Concepts correctly applied
(at least implicitly); Mathematical Modelling correctly and completely documented
No Score 3 available[See Score 2]
Plus:
Both Concepts correctly applied (implicitly)
No Score 3 availableNo Score 3 available

Appendix D.2. Scoring Rubric for the Items of Perspective Taking

Item 3Item 11Item 14Item 4Item 6Item 7Item 8Item 9
Sustainable Development issueLand Use ChangeMarine Resource UseClimate Change Land Use ChangeMarine Resource Use
ContentReflecting the Consequences of Conflicting Interests in Stakeholder
Land Use Decisions
Reasoning of the Environmental Policy Instrument Marine Protected Area Reasoning of the Environmental Policy Instrument
European Union Emission Trading System
Reflecting the Consequences of Conflicting Interests
in Stakeholder
Land Use Decisions
Positioning with respect to the Environmental Policy Instrument Reducing Emissions from Deforestation and Forest DegradationArguing for or against
the Environmental Policy Instrument Reducing Emissions from Deforestation and Forest Degradation
Positioning with respect to the Environmental Policy Instrument
Marine Protected Area
Perspective takingTaking three Sustainable Development-specific Perspectives:
Ecological, Economic and Social
Taking the Sustainable Development-relevant Perspective:
Global Impact
Taking the Sustainable Development-specific Perspectives:
Basic Needs, Inter- and Intragenerational Justice
Taking three Sustainable Development-specific Perspectives:
From Local to Global Levels
Taking a Sustainable Development-specific Stakeholder Perspective
RemarkPerspective taking on a concrete Stakeholder-Level (Family)Perspective taking on a general Level regarding the
Benefits and/or Costs for the Humanity
Perspective taking on a general Level regarding the Sustainable Development-relevant Principles and ObjectivesTaking of different Perspectives: Family/Community, Society and HumanityPerspective taking of a Stakeholder:
Economic interests
Perspective taking of a Stakeholder with Conflicting Interests: Economic vs. Ecological
Score 0Perspective taking missing, superficial or Perspective taking given and Point of View substantiated by …
… one valid Argument for one Perspective… one valid Argument (implicitly)… one valid Argument… one valid Argument for one Perspective… one valid Argument for the specific Stakeholder Perspective
Score 1Perspective taking given and Point of View substantiated by …
… one valid Argument for each of two Perspectives… two valid Arguments (at least implicitly)… two valid Arguments… one valid Argument for each of two Perspectives… two valid Arguments for the specific Stakeholder Perspective
Score 2Perspective taking given and Point of View substantiated by …
… one valid Argument for each of three Perspectives… at least two valid Arguments (at least implicitly)[See Score 1]
Plus: a viable and sophisticated Criticism regarding Reducing Emissions from Deforestation and Forest Degradation
… one valid Argument for each of three Perspectives… at least three valid Arguments for the specific Stakeholder Perspective
Score 3[See Score 2]
Plus: more than one valid Argument for at least two Perspectives
No Score 3
available
No Score 3
available
[See Score 2]
Plus: each Perspective specified
No Score 3
available
No Score 3
available

References

  1. UNESCO. Education for Sustainable Development: Towards achieving the SDGs (ESD for 2030). Available online: https://www.bne-portal.de/sites/default/files/draft_framework_esd_annex_eng.pdf (accessed on 12 August 2019).
  2. TEEB. The Economics of Ecosystems and Biodiversity: Mainstreaming the Economics of Nature: A Synthesis of the Approach, Conclusions and Recommendations of TEEB. Available online: http://www.teebweb.org/our-publications/teeb-study-reports/synthesis-report/ (accessed on 12 August 2020).
  3. Cinici, A. Balancing the pros and cons of GMOs: Socio-scientific argumentation in pre-service teacher education. Int. J. Sci. Educ. 2016, 38, 1841–1866. [Google Scholar] [CrossRef]
  4. Eggert, S.; Bögeholz, S. Students’ Use of Decision-Making Strategies with Regard to Socioscientific Issues—An Application of the Rasch Partial Credit Model. Sci. Educ. 2010, 94, 230–258. [Google Scholar] [CrossRef]
  5. Böhm, M.; Eggert, S.; Barkmann, J.; Bögeholz, S. Evaluating sustainable development solutions quantitatively: Competence modelling for GCE and ESD. CSEE 2016, 15, 190–211. [Google Scholar] [CrossRef]
  6. Seeber, G.; Birke, F. Using a Fox to Guard the Geese? A German Debate on the Purposes of Economic Education in Relation to Sustainability and the Role of Values. CSEE 2011, 10, 170–181. [Google Scholar] [CrossRef]
  7. Romine, W.L.; Sadler, T.D.; Kinslow, A.T. Assessment of scientific literacy: Development and validation of the quantitative assessment of socio-scientific reasoning (QuASSR). J. Res. Sci. Teach. 2017, 54, 274–295. [Google Scholar] [CrossRef]
  8. Sadler, T.D.; Barab, S.A.; Scott, B. What do students gain by engaging in socioscientific inquiry? Res. Sci. Educ. 2007, 37, 371–391. [Google Scholar] [CrossRef]
  9. Crowley, R.M.; Swan, K. What Kind of Economic Citizen? An Analysis of Civic Outcomes in U.S. Economics Curriculum and Instruction Materials. Educ. Sci. 2018, 8, 95. [Google Scholar] [CrossRef] [Green Version]
  10. De Beckker, K. Financial Literacy. Uncovering avenues for future research. In Financial Education—Current Practices and Future Challenges; De Witte, K., Holz, O., De Beckker, K., Eds.; Waxmann: Münster, Germany; New York, NY, USA, 2020; pp. 11–40. [Google Scholar]
  11. Löw Beer, D. Teacher Trainees Conceptions of Economic Policy Instruments for the Environment. JEEER 2018, 19, 1–21. [Google Scholar]
  12. Harring, N.; Davies, P.; Lundholm, C. Learning Economics and Attitudes to Market Solutions to Environmental Problems. Educ. Sci. 2017, 7, 36. [Google Scholar] [CrossRef] [Green Version]
  13. Sternäng, L.; Lundholm, C. Climate change and costs: Investigating students’ reasoning on nature and economic development. Environ. Educ. Res. 2012, 18, 417–436. [Google Scholar] [CrossRef]
  14. Bögeholz, S.; Barkmann, J. Rational choice and beyond: Handlungsorientierende Kompetenzen für den Umgang mit faktischer und ethischer Komplexität. [Action-oriented competencies for dealing with factual and ethical complexity] In Lehr-und Lernforschung in der Biologiedidaktik. Band 2; Klee, R., Sandmann, A., Vogt, H., Eds.; Studienverlag: Innsbruck, Austria, 2005; pp. 211–224. [Google Scholar]
  15. Bögeholz, S.; Barkmann, J. “…to help make decisions”: A challenge to science education research in the 21st century. In Science Education Research and Education for Sustainable Development, Proceeding of the 22nd Symposium on Chemistry and Science Education, Bremen, Germany, 19–21 June 2014; Eilks, I., Markic, S., Ralle, B., Eds.; Shaker Verlag: Aachen, Germany, 2014; pp. 25–35. [Google Scholar]
  16. Bögeholz, S.; Böhm, M.; Eggert, S.; Barkmann, J. Education for Sustainable Development in German Science Education: Past-Present-Future. Eurasia J. Math. Sci. Technol. Ed. 2014, 10, 231–248. [Google Scholar] [CrossRef]
  17. Sadler, T.D. (Ed.) Socio-Scientific Issues in the Classroom: Teaching, Learning and Research; Springer: Dordrecht, The Netherlands, 2011. [Google Scholar]
  18. Bennett, N.J.; Dearden, P. Why local people do not support conservation: Community perceptions of marine protected area livelihood impacts, governance and management in Thailand. Mar. Policy 2014, 44, 107–116. [Google Scholar] [CrossRef]
  19. Kolstø, S.D. Patterns in students’ argumentation confronted with a risk-focused socioscientific issue. Int. J. Sci. Educ. 2006, 28, 1689–1716. [Google Scholar] [CrossRef]
  20. Eggert, S.; Nitsch, A.; Boone, W.J.; Nückles, M.; Bögeholz, S. Supporting Students’ Learning and Socioscientific Reasoning About Climate Change. The Effect of Computer-Based Concept Mapping Scaffolds. Res. Sci. Educ. 2016, 47, 137–159. [Google Scholar] [CrossRef]
  21. Oulton, C.; Dillon, J.; Grace, M.M. Reconceptualizing the teaching of controversial issues. Int. J. Sci. Educ. 2004, 26, 411–423. [Google Scholar] [CrossRef]
  22. Zeidler, D.L. Socioscientific issues as a curriculum emphasis: Theory, research and practice. In Handbook of Research on Science Education, 1st ed.; Abell, S.K., Lederman, N.G., Eds.; Routledge: New York, NY, USA, 2014; pp. 697–726. [Google Scholar]
  23. Stanger-Hall, K.F. Multiple-choice exams: An obstacle for higher-level thinking in introductory science classes. CBE Life Sci. Educ. 2012, 11, 294–306. [Google Scholar] [CrossRef] [Green Version]
  24. Martinez, M.E. Cognition and the question of test item format. Educ. Psychol. 1999, 34, 207–218. [Google Scholar] [CrossRef]
  25. Dufresne, R.J.; Leonard, W.J.; Gerace, W.J. Making sense of students’ answers to multiple-choice questions. Phys. Teach. 2002, 40, 174–180. [Google Scholar] [CrossRef]
  26. Sakschewski, M.; Eggert, S.; Schneider, S.; Bögeholz, S. Students’ socioscientific reasoning and decision-making on energy-related issues—Development of a measurement instrument. Int. J. Sci. Educ. 2014, 36, 2291–2313. [Google Scholar] [CrossRef]
  27. Masters, G. A Rasch model for partial credit scoring. Psychometrika 1982, 47, 149–174. [Google Scholar] [CrossRef]
  28. Boone, W.J.; Scantlebury, K. The role of Rasch analysis when conducting science education research utilizing multiple choice tests. Sci. Educ. 2006, 90, 253–269. [Google Scholar] [CrossRef]
  29. Cronbach, L.J.; Meehl, P.E. Construct validity in psychological tests. Psychol. Bull. 1955, 52, 281–302. [Google Scholar] [CrossRef] [PubMed] [Green Version]
  30. Martinková, P.; Drabinová, A.; Liaw, Y.L.; Sanders, E.A.; McFarland, J.L.; Price, R.M. Checking equity: Why differential item functioning analysis should be a routine part of developing conceptual assessments. CBE Life Sci. Educ. 2017, 16, rm2. [Google Scholar] [CrossRef] [PubMed] [Green Version]
  31. Hartig, J.; Klieme, E.; Leutner, D. Assessment of Competencies in Educational Contexts; Hogrefe: Göttingen, Germany, 2008. [Google Scholar]
  32. Joachim, C.; Hammann, M.; Carstensen, C.H.; Bögeholz, S. Modeling and Measuring Pre-Service Teachers’ Assessment Literacy Regarding Experimentation Competences in Biology. Educ. Sci. 2020, 10, 140. [Google Scholar] [CrossRef]
  33. NGSS Lead States. Next Generation Science Standards: For States, by States; The National Academies Press: Washington, DC, USA, 2013; Available online: http://www.nextgenscience.org/next-generation-science-standards (accessed on 12 August 2020).
  34. Frey, A.; Hartig, J.; Rupp, A.A. An NCME instructional module on booklet designs in large-scale assessments of student achievement: Theory and practice. Educ. Meas. 2009, 28, 39–53. [Google Scholar] [CrossRef]
  35. Hohensinn, C.; Kubinger, K.D. On the impact of missing values on item fit and the model validness of the Rasch model. Psychol. Test Assess. Model. 2011, 53, 380–393. [Google Scholar]
  36. Wu, M.L.; Adams, R.J.; Wilson, M.R.; Haldane, S.A. Acer ConQuest Version 2.0: Generalised Item Response Modelling Software; Acer: Camberwell, VIC, Australia, 2007. [Google Scholar]
  37. Boone, W.J.; Staver, J.R.; Yale, M. Rasch Analysis in the Human Sciences; Springer: Dordrecht, The Netherlands, 2014. [Google Scholar]
  38. Reliability and Separation of Measures. Available online: http://www.winsteps.com/winman/reliability.htm (accessed on 12 August 2020).
  39. OECD. PISA 2006—Technical Report; OECD: Paris, France, 2009. [Google Scholar]
  40. Wetzel, E.; Carstensen, C.H. Reversed thresholds in partial credit models: A reason for collapsing categories? Assessment 2014, 21, 765–774. [Google Scholar] [CrossRef] [Green Version]
  41. Akaike, H. A new look at the statistical identification model. IEEE Trans. Autom. Control 1974, 19, 716–723. [Google Scholar] [CrossRef]
  42. Schwarz, G. Estimating the dimension of a model. Ann. Stat. 1978, 6, 461–464. [Google Scholar] [CrossRef]
  43. Pohl, S.; Carstensen, C.H. NEPS Technical Report—Scaling the Data of the Competence Tests (NEPS Working Paper No. 14). Bamberg: Otto-Friedrich-Universität, Nationales Bildungspanel. [National Educational Panel Study]. 2012. Available online: https://www.neps-data.de/Portals/0/Working%20Papers/WP_XIV.pdf (accessed on 12 August 2020).
  44. Warm, T.A. Weighted likelihood estimation of ability in item response theory. Psychometrika 1989, 54, 427–450. [Google Scholar] [CrossRef]
  45. Beck, K.; Krumm, V.; Dubs, R. Wirtschaftskundlicher Bildungs-Test (WBT)—Handanweisung [German Adaption of the Test of Economic Literacy—Manual]; Hogrefe: Göttingen, Germany, 1998. [Google Scholar]
  46. Soper, J.C.; Walstad, W.B. Test of Economic Literacy. Examiner’s Manual, 2nd ed.; Council on Economic Education: New York, NY, USA, 1987. [Google Scholar]
  47. Schmidt, S.; Ennemoser, M.; Krajewski, K. Deutscher Mathematiktest für Neunte Klassen (DEMAT 9) [German Test of Mathematical Competencies for Grade 9]; Hogrefe: Göttingen, Germany, 2013. [Google Scholar]
  48. Schneider, W.; Schlagmüller, M.; Ennemoser, M. LGVT 6–12: Lesegeschwindigkeits- und -Verständnistest für die Klassenstufen 6–12. LGVT 6–12 Manual [Test of Reading-Speed and Reading-Comprehension for Grades 6–12]; Hogrefe: Göttingen, Germany, 2007. [Google Scholar]
  49. OECD. Problem Solving for Tomorrow’s World. First Measures of Cross-Curricular Competencies from PISA 2003; OECD: Paris, France, 2004. [Google Scholar]
  50. What Works Clearinghouse. Procedures and Standards Handbook Version 3.0. 2014. Available online: http://ies.ed.gov/ncee/wwc/Docs/referenceresources/wwc_procedures_v3_0_standards_handbook.pdf (accessed on 12 August 2020).
  51. Schmitt, N. Uses and abuses of coefficient alpha. Psychol. Assess. 1996, 8, 350–353. [Google Scholar] [CrossRef]
  52. Schecker, H. Überprüfung der Konsistenz von Itemgruppen mit Cronbachs α [Testing consistency of item groups using Cronbachs alpha]. In Methoden in der Naturwissenschaftsdidaktischen Forschung; Krüger, D., Parchmann, I., Schecker, H., Eds.; Springer: Berlin/Heidelberg, Germany, 2014; Available online: http://static.springer.com/sgw/documents/1426184/application/pdf/Cronbach+Alpha.pdf.springer (accessed on 12 August 2020).
  53. Wilson, M. Constructing Measures: An Item Response Modeling Approach; Lawrence Erlbaum Associates: Mahwah, NJ, USA, 2005. [Google Scholar]
  54. Lewis, J.; Leach, J. Discussion of socio-scientific issues: The role of science knowledge. Int. J. Sci. Educ. 2006, 28, 1267–1287. [Google Scholar] [CrossRef]
  55. Shanahan, M. Threshold concepts in economics. ET 2016, 58, 510–520. [Google Scholar] [CrossRef]
  56. Haskell, R.E. Transfer of Learning: Cognition, Instruction, and Reasoning; Academic Press: San Diego, CA, USA, 2001. [Google Scholar]
  57. Sadler, T.D.; Donnelly, L.A. Socioscientific argumentation: The effects of content knowledge and morality. Int. J. Sci. Educ. 2006, 28, 1463–1488. [Google Scholar] [CrossRef]
  58. Hoch, M.; Dreyfus, T. Students’ difficulties with applying a familiar formula in an unfamiliar context. In Proceedings of the 29th Conference of the International Group for Psychology of Mathematics Education, Melbourne, Australia, 10–15 July 2005; Chick, H.L., Vincent, J.L., Eds.; PME: Melbourne, Australia, 2005; pp. 145–152. [Google Scholar]
  59. Mevarech, Z.; Stern, E. Interaction between knowledge and contexts on understanding abstract mathematical concepts. J. Exp. Child Psychol. 1997, 65, 68–95. [Google Scholar] [CrossRef]
  60. Pahl, S.; Bauer, J. Overcoming the distance: Perspective taking with future humans improves environmental engagement. Environ. Behav. 2013, 45, 155–169. [Google Scholar] [CrossRef]
  61. Steffen, B.; Hößle, C. Decision-making competence in biology education: Implementation into German curricula in relation to international approaches. Eurasia J. Math. Sci. Technol. Ed. 2014, 10, 343–355. [Google Scholar] [CrossRef] [Green Version]
  62. Kultusministerkonferenz [The Standing Conference of the Ministers of Education and Cultural Affairs of the Länder in the Federal Republic of Germany]. Bildungsstandards im Fach Biologie für die Allgemeine Hochschulreife [National Educational Standards of Biology for The General University Entrance Qualification] (Beschluss der Kultusministerkonferenz vom 18.06.2020). 2020. Available online: https://www.kmk.org/fileadmin/Dateien/veroeffentlichungen_beschluesse/2020/2020_06_18-BildungsstandardsAHR_Biologie.pdf (accessed on 12 August 2020).
  63. Kultusministerkonferenz [The Standing Conference of the Ministers of Education and Cultural Affairs of the Länder in the Federal Republic of Germany. Bildungsstandards im Fach Chemie für die Allgemeine Hochschulreife [National Educational Standards of Chemistry for the General University Entrance Qualification] (Beschluss der Kultusministerkonferenz vom 18.06.2020). 2020. Available online: https://www.kmk.org/fileadmin/Dateien/veroeffentlichungen_beschluesse/2020/2020_06_18-BildungsstandardsAHR_Chemie.pdf (accessed on 12 August 2020).
  64. Kultusministerkonferenz [The Standing Conference of the Ministers of Education and Cultural Affairs of the Länder in the Federal Republic of Germany] 2020. Bildungsstandards im Fach Physik für die Allgemeine Hochschulreife [National Educational Standards of Physics for the General University Entrance Qualification] (Beschluss der Kultusministerkonferenz vom 18.06.2020). 2020. Available online: https://www.kmk.org/fileadmin/Dateien/veroeffentlichungen_beschluesse/2020/2020_06_18-BildungsstandardsAHR_Physik.pdf (accessed on 12 August 2020).
  65. Schreiber, J.R.; Siege, H. Orientierungsrahmen für den Lernbereich Globale Entwicklung [Orientation Framework for the Learning Area of Global Development], 2nd ed.; Cornelson: Berlin, Germany, 2016. [Google Scholar]
  66. Van der Graaff, J.; Branje, S.; de Wied, M.; Hawk, S.; van Lier, P.; Meeus, W. Perspective taking and empathic concern in adolescence: Gender differences in developmental changes. Dev. Psychol. 2014, 50, 881–888. [Google Scholar] [CrossRef] [Green Version]
  67. Niedersächsisches Kultusministerium [Ministry of Education and Cultural Affairs of Lower Saxony] (Kerncurriculum für das Gymnasium, Schuljahrgänge 8–10: Politik-Wirtschaft [Core Curriculum for Politics and Economics in University-Track High-Schools]. 2015. Available online: https://cuvo.nibis.de/cuvo.php?p=searched_download&skey_lev0_0=Dokumentenart&svalue_lev0_0=Kerncurriculum&skey_lev0_1=Schulbereich&svalue_lev0_1=Sek+I&skey_lev0_2=Schulform&svalue_lev0_2=Gymnasium-Sek.I&skey_lev0_3=Fach&svalue_lev0_3=Politik-Wirtschaft&&uploadnum=0 (accessed on 12 August 2020).
  68. Sächsisches Staatsministerium für Kultus [Ministry of Education and Cultural Affairs of Saxony]. Lehrplan Gymnasium. Gemeinschaftskunde/Rechtserziehung/Wirtschaft. [Core Curriculum for Politics and Economics in University-Track High-Schools]. 2013. Available online: https://www.schule.sachsen.de/lpdb/web/downloads/1531_lp_gy_gemeinschaftskunde_rechtserziehung_wirtschaft_2013.pdf?v2 (accessed on 12 August 2020).
  69. Niedersächsisches Kultusministerium [Ministry of Education and Cultural Affairs of Lower Saxony]. Kerncurriculum für das Gymnasium, Schuljahrgänge 5–10: Deutsch [Core Curriculum for German in University-Track High-Schools]. 2015. Available online: https://cuvo.nibis.de/cuvo.php?p=download&upload=186 (accessed on 12 August 2020).
  70. Sächsisches Staatsministerium für Kultus [Ministry of Education and Cultural Affairs of Saxony]. Lehrplan Gymnasium. Deutsch. [Core Curriculum for German in University-Track High-Schools]. 2019. Available online: https://www.schule.sachsen.de/lpdb/web/downloads/1529_lp_gy_deutsch_2019_final.pdf?v2 (accessed on 12 August 2020).
  71. Funke, J. Dealing with dynamic systems: Research strategy, diagnostic approach and experimental results. Ger. J. Psychol. 1992, 16, 24–43. [Google Scholar]
  72. Jho, H.; Yoon, H.G.; Kim, M. The relationship of science knowledge, attitude and decision making on socio-scientific issues: The case study of students’ debates on a nuclear power plant in Korea. Sci. Educ. 2014, 23, 1131–1151. [Google Scholar] [CrossRef]
  73. Sternberg, R.J. Expertise in complex problem solving: A comparison of alternative conceptions. In Complex Problem Solving: The European Perspective; Frensch, P.A., Funke, J., Eds.; Lawrence Erlbaum Associates: Mahwah, NJ, USA, 1995; pp. 295–321. [Google Scholar]
  74. Kahn, S.; Zeidler, D.L. Using our heads and HARTSS*: Developing perspective-taking skills for socioscientific reasoning (*Humanities, ARTS, and Social Sciences). J. Sci. Teach. Educ. 2016, 27, 261–281. [Google Scholar] [CrossRef]
  75. Würth, R.; Klein, H.J. Wirtschaftswissen Jugendlicher in Baden-Württemberg. Eine Empirische Untersuchung [Economic Knowledge of Adolescents in Baden-Württemberg: An Empirical Study]; Swiridoff: Künzelsau, Germany, 2001. [Google Scholar]
  76. Sadler, T.D.; Klosterman, M.L.; Topcu, M.S. Learning science content and socio-scientific reasoning through classroom explorations of global climate change. In Socio-Scientific Issues in the Classroom: Teaching, Learning and Research; Sadler, T.D., Ed.; Springer: Dordrecht, The Netherlands, 2011; pp. 45–77. [Google Scholar]
  77. Newton, M.H.; Zeidler, D.L. Developing socioscientific perspective taking. Int. J. Sci. Educ. 2020, 1–18. [Google Scholar] [CrossRef]
  78. Kahn, S.; Zeidler, D.L. A conceptual analysis of perspective taking: Positioning a tangled construct within science education and beyond. Sci. Educ. 2019, 28, 605–638. [Google Scholar] [CrossRef] [Green Version]
  79. Zeidler, D.L.; Sadler, T.D.; Simmons, M.L.; Howes, E.V. Beyond STS: A research-based framework for socioscientific issues education. Sci. Educ. 2005, 89, 357–377. [Google Scholar] [CrossRef]
  80. UNESCO. Education for Sustainable Development Goals: Learning Objectives. 2017. Available online: http://unesdoc.unesco.org/images/0024/002474/247444e.pdf (accessed on 29 June 2019).
Figure 1. Socioscientific Issues (SSIs), Sustainable Development Issues, and Socioscientific Reasoning compared to Decision Making for Sustainable Development.
Sustainability 12 06980 g001
Figure 2. Measuring Evaluating and Reflecting Solutions Quantitatively and Economically (ERSQE) [5,16]. SD = Sustainable Development; SDGs = Sustainable Development Goals [1]).
Sustainability 12 06980 g002
Figure 3. Wright maps of N = 760 regarding Quantitative Modelling and Perspective Taking (each ‘X’ represents 1.8 test persons in each dimension; the numbers indicate the thresholds of different item steps of trichotomous items, e.g., item 5 with item steps 5.1 and 5.2 and quadrotomous items, e.g., item 14 with item steps 14.1, 14.2 and 14.3). The three thresholds of items 1 and 10 from Quantitative Modelling and the two thresholds of items 8 and 9 as well as the three thresholds of item 11 from Perspective Taking are marked. The item markings help to locate the thresholds on the logit scales that are discussed in the text.
Sustainability 12 06980 g003
Figure 4. Person-abilities from one-dimensional modelling regarding Quantitative Modelling (above: 362 9th/10th graders, 213 11th/12th graders, 176 student teachers) and Perspective Taking (below: 362 9th/10th graders, 216 11/12th graders, 175 student teachers). Remark: triangles mark the average person-ability for each level of education; *** p < 0.001, ** p < 0.01.
Sustainability 12 06980 g004
Figure 5. Three-dimensional modelling and latent correlations between Quantitative Modelling, Perspective Taking and Qualitative Arguing—dimensions of the competence model of Decision Making for Sustainable Development (n = 191).
Sustainability 12 06980 g005
Table 1. Sample composition regarding competence modelling study (N = 760) and validation studies with subsamples (V-Study I: n = 191; V-Study II: n = 71; n. sp. = not specified; SD = standard deviation).
Sample Compositionn%
(of Study)
Gendern. sp.Age [SD]
FemaleMale
Competence Modelling9th/10th Graders36848.41711861115.23 [0.80]
11th/12th Graders21628.412789-17.15 [0.76]
Student Teachers17623.211758122.49 [2.77]
V-Study I9th/10th Graders10957.14959115.01 [0.78]
11th/12th Graders4222.02715-16.86 [0.65]
Student Teachers4020.92911-22.95 [1.95]
V-Study II9th/10th Graders71100.04624115.03 [0.82]
Table 2. Fit statistics for the one- and two-dimensional models (1D, 2D) regarding Evaluating and Reflecting Solutions Quantitatively and Economically (N = 760; ***: p < 0.001).
ModelsParametersDevianceAICBICΔDeviance (df)
1D40205152059520781-
2D42203672045120646148 *** (2)
Table 3. Test quality characteristics of the two dimensions Quantitative Modelling (eight items) and Perspective Taking (eight items) (N = 760; SE = standard error; wMNSQ = weighted (infit) mean-square).
Quantitative ModellingPerspective Taking
Variance (SE)0.26 (0.03)0.71 (0.07)
EAP/PV Reliability0.530.70
Item Reliability0.970.99
Average Person-Ability (SE)0.00 (0.03)0.00 (0.04)
Average Item-Difficulty (SE)0.35 (0.13)0.08 (0.26)
Item-Difficulty from min. to max. value−0.17 to 0.68−1.00 to 1.33
Item Fit wMNSQ from min. to max. value0.96 to 1.060.93 to 1.17
Discrimination from min. to max. value0.37 to 0.640.48 to 0.66
Table 4. Fit statistics for the one- and two-dimensional models (1D, 2D): Quantitative Modelling in combination with Qualitative Arguing as well as Perspective Taking in combination with Qualitative Arguing (n = 191; ***; p < 0.001).
Qualitative Arguing combined withModelsParameterDevianceAICBICΔ Deviance (df)
Quantitative1D40635964396570-
Modelling2D4262996383651960 *** (2)
Perspective1D45698370737219-
Taking2D4769277021717456 *** (2)
Table 5. Latent correlations from four-dimensional modelling of Quantitative Modelling with constructs of validation study I (n = 191).
Quantitative ModellingQualitative ArguingEconomic Literacy
Qualitative Arguing0.47
Economic Literacy0.81 0.42
Mathematical Competencies0.600.410.52
Table 6. Latent correlations from four-dimensional modelling of Perspective Taking with constructs of validation study I (n = 191).
PerspectiveTakingQualitative ArguingEconomic Literacy
Qualitative Arguing0.66
Economic Literacy0.720.43
Mathematical Competencies0.320.410.51
Table 7. Correlations between average person-ability (WLE) and grades from relevant subjects (Spearman’s Rho; *** p < 0.001, ** p < 0.01, * p < 0.05).
Quantitative ModellingPerspective Taking
Educational Levels9th/10th11th/12th9th/10th 11th/12th
SubjectsrNrnrnrn
Mathematics0.23 ***3610.31 ***2090.11 *3610.19 **212
Politics/Economics0.34 ***3480.25 **1730.28 ***3470.28 ***176
Biology0.24 ***3560.34 ***1970.29 ***3540.25 ***200
Geography0.25 ***3470.23 **1460.25 ***3470.24 **147
German0.20 ***3610.14 *2090.30 ***3610.23 **212

