National Baselines for Integrated Implementation of an Environmental Sustainable Development Goal Assessed in a New Integrated SDG Index


1
School of Politics and International Relations and UCD Geary Institute for Public Policy, University College Dublin, Dublin, Ireland
2
Visiting Researcher, Sustainable Development Solutions Network (SDSN) Association, New York, NY 10115, USA
Sustainability 2020, 12(17), 6955; https://doi.org/10.3390/su12176955
Submission received: 31 July 2020
/
Revised: 21 August 2020
/
Accepted: 24 August 2020
/
Published: 26 August 2020
Abstract
:Most indicator-based assessments of progress on the Sustainable Development Goals (SDGs) focus on identifying priorities for implementation. However, once priorities are established, policymakers are called to implement them in an integrated way which requires progress not just on a Goal’s targets (siloed approach) but also progress in interrelated policy areas. To assess baselines for integrated implementation, this article introduces a new family of SDG index based on a Goal’s targets and first-order interrelations with other goals that divides targets linked to the prioritized or focal SDG into pressure, impact, and response components. Focusing on an application to SDG14, the conservation and sustainable use of marine resources, an important priority for many small island developing states, the article develops an integrated SDG14 (I-SDG14) index based on an international study of SDG14 interlinkages with indicators selected from SDSN’s global indicator set for all island states with sufficient data available for the year 2018. While all island states assessed face challenges on SDG14, top-performers in terms of I-SDG14 (United Kingdom, New Zealand, Japan, Ireland and Iceland) tend to face greater challenges on pressures, primarily reflecting their performance on targets related to SDGs 2, 12, 13 and 15, whereas bottom-performers (Timor-Leste, Vanuatu, Haiti, Jamaica and Comoros) tend to face greater challenges on responses, i.e., country capacities to influence SDG14, owing to their status on targets related to SDGs 4, 9, 16 and 17. In particular, country scoreboards, “traffic-light” visual representation of performance, and radar-diagrams are used to investigate country-level strengths and challenges for integrated implementation. The proposed index offers a useful starting point to frame discussions with different stakeholders around integrated approaches to implementation and can be flexibly applied to other SDGs and contexts. The article concludes with several suggestions for future research aimed at improving integrated assessments for the SDGs.
Keywords:
sustainable development; SDGs; integrated assessment; SDG index; interlinkages; SDG14; island states1. Introduction
To guide national planning and policies for sustainable development, the United Nations Sustainable Development Goals (UN SDGs) offer a broad framework of 17 SDGs and 169 targets spanning a range of sectors such as poverty, health, energy, climate, marine, justice, that is universal in scope, applying to rich and poor countries alike [1,2]. To provide an evidence-based framework for implementation, the UN Inter Agency Expert Group (IAEG) proposed the global indicator set of 232 official indicators [3] and aided by this development, indicator-based assessments, as prime assessors of progress on the SDGs, have become common practice at all scales [4,5,6].
Most of these assessments focus on evaluating country progress on all SDGs with the aim of identifying performance gaps and informing decision-makers, e.g., politicians, non-specialist media and voters on broad priorities for implementation [6,7,8,9,10,11]. However, once priorities are established, policymakers are called to implement them in an integrated way which requires accounting for interlinkages typically with a smaller set of other goals and targets [12,13,14]. For example, it is recognized that conservation and sustainable use of marine resources (SDG14), a key priority for many small island developing states [15,16,17,18], has important interactions with poverty reduction (SDG1), food security and nutrition (SDG2), economic growth (SDG8), urban development (SDG11), sustainable consumption and production (SDG12) and climate action (SDG13) [19]. However, despite clear connections, there are few indicator-based tools to support integrated approaches to SDG implementation.
The aim of this article is to develop a monitoring tool that can help to assess national baselines for integrated implementation of an SDG. Specifically, the article uses the SDGs as a framework for the integrated assessment basing indicator selection on scientific evidence of SDG interrelations. Influenced by systems thinking, Niemeijer and de Groot [20] argued that causal networks which capture the full range of causes, effects and interrelations with a particular sustainability issue can be used to select indicators (based on their position within that network) to improve sustainability assessments [20,21]. Specifically, they proposed organizing indicators according to causal-chain frameworks, such as pressure-state-response (PSR), driving force-state-response (DSR) or driving force-pressure-state-impact-response (DPSIR) frameworks, popular in environmental assessment reports [22,23,24]. In the simplest case, PSR frameworks divide indicators into pressure, state and response indicators based on interrelations between three components: “pressure on the environment from human and economic activities, lead to changes in the state or environmental conditions that may provoke responses by society to change the pressures and state of the environment’’ [25] (p. 12).
A similar approach can be applied to structure indicators for integrated SDG assessments. To guide the systematic identification of interrelations between SDGs, there is now a large and growing literature that reviews scientific studies and consults with experts to map out the main interlinkages between SDGs [26,27,28]. These studies start with the question “if progress is made on target x, how does this influence progress on target y” [27] (p. 536). Many of the studies focus on a single SDG seeking to identify its links to other goals and targets summarizing the full range of bilateral interactions in a table, cross-matrix or network. For example, detailed analyses have been undertaken for SDG2 zero hunger [19], SDG3 health and well-being [19,29], SDG4 education [30], SDG7 affordable and clean energy [19], SDG8 decent work and growth [31], SDG9 industrial innovation and infrastructure [32], SDG13 climate action [33], and SDG14 oceans and seas [19,28,34]. While these analyses do not invoke PSR, DSR or DPSIR frameworks, focusing instead on establishing the sign (synergy or trade-off) and strength (using scales to grade relationships) of each interaction [35,36,37]. The studies, however, do emphasize the directionality of interactions, resulting in directed graphs, similar to causal networks, since often interactions are unidirectional or bilateral but asymmetric.
Drawing on the indicator selection procedure of Niemeijer and de Groot [20] and studies in sustainability science of SDG linkages, this article proposes a new SDG index (called the I-SDGx index) based on a Goal’s targets and main interlinkages with other Goals. To illustrate, the article focuses on an application to SDG14. Several studies have demonstrated the challenges island states face on targets such as tackling marine pollution (14.1), sustainable fishing (14.2), protection of marine areas (14.5) and raising economic benefits from maritime sectors (14.7) [7], and the strong interrelations between this “Oceans Goal” and other goals [19,28,34,38]. According to ICSU [19], SDG14 involves 97 target-level (first-order) interactions with other goals, of which 61 are positive, 1 is neutral and 35 are negative.
Composite indicators are a way to reduce the complexity of these interactions (owing to the many linkages and feedbacks) without dropping the underlying information base with a view to supporting policymakers need for simple communicative messages [39,40,41]. To incorporate linkages in the selection of indicators for the index, the boundaries of the assessment first need to be defined [20]. In other words, what types of links will be included, and which ones will be excluded. For instance, how much consideration should be given to first-order and second or higher-order interactions [27], such as the effects on health of lower incomes from marine pollution, and how much comes from vertical linkages, such as interactions of global processes with national performance, such as climate change and localized coral bleaching [42]. In view of the large number of proximate influences on SDG14, this paper restricts assessment to first-order interactions and the within-country situation, focusing on a framework that structures these interactions.
Specifically, the article proposes a PIR framework to group selected indicators in pressure, impact and response components. Pressures (P) refer to targets which may influence the achievement of SDG14, e.g., agricultural intensification may pollute coastal waters, renewable energy expansion can raise economic benefits from maritime sectors. On the other hand, impacts (I) refer to targets potentially influenced by progress on SDG14, e.g., protection of marine areas can result in improved climate resilience, tackling marine pollution can support economic growth. Finally, responses (R) reflect country capacities to change the pressures and achievement of SDG14. These targets may relate to education, science and technology, public sector effectiveness or governance, e.g., inclusive decision-making may improve marine protection effectiveness, marine education can enable sustainable fishing; Information Communication Technology (ICT) use can enhance protection management, among others. This framing facilitates simple communication on the main causal interrelations with SDG14 and country capacities to manage these relations.
The article’s main contribution to the literature on SDG monitoring is to propose a new index that could assist with integrated implementation of an SDG. Accounting for interlinkages with other SDGs and reflecting on progress in interlinked policy areas is needed to overcome siloed approaches to implementation that have met with little success in the past [27,43]. Specifically, a sound procedure for indicator selection based on evidence of interlinkages and simple causal framework for structuring interlinked indicators makes for an important management tool for developing coordinated implementation strategies, allocating resources and tracking progress in interrelated policy areas. The attempt at developing an integrated index in this article compliments efforts to measure progress on all SDGs. While these assessments typically focus on identifying priorities for implementation [4,7,8,9], there are no assessments that take a specific priority, such as SDG14, and provide a baseline integrated assessment, despite the importance of this for many countries. The results should be of interest to different stakeholders as a tool to frame discussions and mobilize efforts around integrating policies and strategies [39,44].
This is not the first paper to develop an integrated SDG index. In a recent article, Biggeri et al. [10] propose an I-SD index based on constant elasticity of substitution functions that aim to capture in a single parameter the degree of synergy or trade-off between and within SDGs. However, their approach does not deal with goal-specific interactions and heterogeneity in links across goals. Neither is this the first article to develop a goal-focused SDG index. Kyncolova, Upadhyaya, Nice [45] develop a composite SDG9 index to measure the extent of inclusive and sustainable industrial development based on a selection of five SDG9 industry-related targets. However, their index does not consider interlinkages with other goals. Indicator-based studies of nexus issues come closest to the approach in this paper (e.g., [46,47,48,49]). In these studies, indicator selection is mostly based on perceived interrelations between a small set of policy areas, e.g., water-food-energy nexus, and many of the studies do not develop a composite [46]. The closest article to this one is Nhemachena et al. [47] who develop an agriculture-related SDG index for Southern Africa that identifies eight SDG indicators related to the agricultural sector covering five SDGs (SDGs 1, 2, 6, 7, and 15). However, their index is not based on DPSIR frameworks that group indicators according to evidence on their interrelations.
The article also relates to recent research on integrated environmental management frameworks [50,51,52]. Increasingly, the integration of SDGs in such frameworks is seen to widen their applicability and support more comprehensive quantitative assessments of sustainability [53,54,55]. Although still relatively rare, several studies have sought to integrate SDGs in frameworks for coastal and marine management [53,56,57], water [58], smart cities [59], circular economy [60], as well as spatio-temporal analyses of health [61]. An important theme is identification of a set of key performance indicators [53,62,63,64]. While these frameworks hold considerable long-term promise for sustainability management, current data availability problems limit their use [65]. This article suggests the SDGs provide a relatively simple yet comprehensive and flexibly applicable intermediate framework, between siloed approaches and fully integrated frameworks, if indicator selection is based on scientific studies of interlinkages with the issues of interest [19,26,27,28,29,30,31,32,33,34,35,36,37]. Further, the article develops a composite to assess the main SDG pressures, impacts, and capacities. By using SDGs as an integrated framework for assessment, it also compliments recent efforts that apply the SDGs as a framework to assess socio-economic impacts and guide more sustainable planning and policies [66,67].
The remainder of the paper is structured as follows. Section 2 derives an I-SDGx index based on a PIR framework. Section 3 focuses on an application to SDG14. Section 3.1 proposes a four-step procedure for selecting indicators for integrated SDG14 assessments and presents the indicator set for I-SDG14. Section 3.2 classifies selected indicators as pressures, impacts and responses and describes the data and normalization. Section 3.3 presents the results for all island states with sufficient data. Section 4 concludes with discussion of limitations and suggestions for future research.
2. Deriving an I-SDGx Index Based on a PIR Framework
Compared to the SDG index of Sachs and associates which focuses on all SDGs and ignores linkages between them, the index developed in this paper focuses on a single “focal” SDG, called SDGx, e.g., SDG14, and its first-order interlinkages with other goals. To clarify its unique features, the index is based as closely as possible on the SDG index using the same techniques for target value setting, min-max normalization and arithmetic aggregation [4,7,68]. The main differences concern the conceptual framework, indicator selection procedure and weights used for aggregation.
The I-SDGx index has two dimensions: the focal SDG and linked SDGs (Figure 1). The identification of linkages can use existing studies of SDG linkages (e.g. [19]) or apply these methods such as review scientific literature and organize expert consultations [27]. Once interlinkages are identified, the indicator set is derived from selecting the best available official SDG indicator(s) relevant to the focal targets, termed “focal indicators”, and identified targets of linked SDGs, called “linkage indicators”. Use of official indicators ensures selected indicators meet criteria such as measurability, methodological soundness, target relevancy, comparability, and ease of communication and access [1,68,69]. Based (primarily) on the direction of causality with the focal targets, selected linkage indicators are classified in pressure, impact and response components (Figure 1) (see Section 3.3).
The I-SDGx index is essentially a weighted average of the focal and linkage indicators (Equation (1)), with each indicator normalized for aggregation. To incorporate linkages in the assessment, the weight w assigned to linked SDGs must be strictly positive, i.e., w > 0. Whereas to ensure focal targets are part of the assessment, w < 1. Within the range 0 to 1, the choice of weight appears arbitrary. In this paper, w = ½ on the basis that SDG14 is the focal point for the assessment.
Equation (2) computes the average score for all linkage indicators. It ensures linkage indicators are equally weighted in the I-SDGx index. Equation (2) also helps to decompose I-SDGx into focal, pressure, impact, and response sub-indices, useful both for analytic purposes and communication with policymakers. In addition, Equation (2) summarizes important information about linkages. It expresses the average score as the weighted average of pressure, impact, and response scores with weights that reflect the share of linkage indicators in each component.
For each sub-index, normalized indicators are aggregated into unique scores using the equally weighted arithmetic mean (Equation (3)). Bi-directional linkages cause some targets to act as both pressures and impacts and consequently, pressure and impact components can overlap, i.e., P ∩ I ≠ ϕ. In a PIR framework, dual indicators such as these are double-counted for weighting purposes.
where is the focal SDG, is ’s set of linkage indicators and overbar denotes the score.
counts the number of indicators in the relevant component. , and are respectively the set of pressure, impact and response indicators of .
where is the normalized value of an indicator in or or or , and is the number of indicators in the component.
3. Application to SDG14
3.1. Procedure for Selecting an Indicator Set for an I-SDG14 Index
To construct an indicator set for integrated assessment of SDG14, four main steps are proposed. The method is adapted from Niemeijer and de Groot [20] (pp. 19–21):
- (1)
- Define the focal SDG’s targets of interest.
- (2)
- Choose a study area (i.e., a context for assessing progress).
- (3)
- Identify the main first-order within-country interlinkages with the focal targets using a study of SDG linkages.
- (4)
- Select focal and linkage indicators from official SDG indicator sets based on relevancy and availability criteria.
Step 1: Define the SDG targets of interest. Due to data limitations generic to SDG14, this study focused on four targets that together balance the Goal’s twin objectives of marine conservation and sustainable use of marine resources. Two targets concern conservation: 14.1. Reducing Marine Pollution and 14.5. Protect Marine Areas; and two focus on sustainable use of marine resources: 14.4. Sustainable Fishing and 14.7 Raising Economic Benefits. Table 1 provides official descriptions for selected targets.
Step 2: Choose a study area. The paper focuses on island states, i.e., states made up of islands or land masses surrounded by water, owing to the challenges they face on SDG14 [7,15]. In many island states, fishing, aquaculture, and tourism are important contributors to the economy with significant implications for society and environment [16,17,18].
The sample includes the 39 official UN Small Island Developing States (SIDS). It also includes high-income small island states such as Iceland, Malta, Cyprus, Ireland, Bahrain, New Zealand, Singapore and Brunei Darussalam. There are also several large developing and developed island states, Indonesia, Philippines, United Kingdom, and Japan. Overall, the countries span a diverse range of geographic locations, development levels, population sizes and densities: ranging in population from 270.63 million to 58.14 thousand, in the area from 1910.931 thousand km2 to 21 km2 and in per capita income measured in 2017 US dollars (PPP) from $73,060 to $517.
Step 3: Identify the main first-order within-country interlinkages based on a study of SDG linkages. The ICSU [19] study was used to provide a broad international assessment of first-order interactions between SDG14 and other goals at a national level [19] (p. 178–182). Two types of linkages were distinguished: the potential influence of progress towards SDG14 on other SDGs achievement and the potential influence of other SDGs on SDG14. Findings of the study are presented in Table 2 and Table 3 and briefly described below.
The influence of SDG14 on other SDGs: The first target of relevance is tackling marine pollution (Target 14.1). Progress on this target helps to provide a sustainable resource base for revenues from fisheries, aquaculture and tourism (SDG8). It also connects to poverty reduction and reducing inequalities, by, for example, raising incomes from fisheries, especially for small-scale fishers, and enabling job creation in tourism and related sectors (SDG1). This can contribute to income growth for low-income groups (SDG10). Tackling marine pollution also helps to improve nutrition (SDG2) and population health and well-being (SDG3). By making coastal areas more attractive for development, it can support sustainable urbanization (SDG11), although trade-offs may occur when reducing pollution constrains such development. Tackling marine pollution can also result in reduced terrestrial biodiversity loss (SDG15).
Sustainable fisheries (Target 14.4) also supports a sustainable resource base for revenues from fisheries (SDG1 & SDG8), and higher sustainable fishing yields can improve food security and nutrition (SDG2). Sustainable practices in fishing may also contribute to higher female labour participation (SDG5), innovation in marine technology (SDG9), natural resource protection and reduced food loss (SDG12). While ending overfishing and illegal fishing may help reduce corruption (SDG16), it can limit options to develop fisheries in poor coastal communities (SDG1), reduce food production and nutrition (SDG2), and restrict job creation and growth in fisheries (SDG8), especially in the short-term.
Protection of marine areas and their ecosystems (Target 14.5) can result in improved resilience of coastal communities to climate change (SDG13), such as the important role of sustainable coastal zone management, e.g., mangroves, seagrass beds, in buffering the impacts of climate change. Marine protection can also enhance fish recruitment and biodiversity in areas adjacent to them (SDG2 and SDG15) and result in new opportunities in terms of livelihoods (SDG1, SDG10) and job creation (SDG8). It also helps to contribute to better ocean governance (SDG17) and typically requires more inclusive decision-making and less corruption (SDG16). However, trade-offs can arise when marine protection restricts access to resources and ecosystem services for the poorest (SDG1), access to food and areas for aquaculture (SDG2), which may contribute to inequality (SDG10). It may also restrict growth in certain sectors (SDG8), e.g., fisheries, renewables, and coastal urbanization (SDG11).
In terms of blue growth, raising economic benefits from sustainable management of maritime sectors (Target 14.7) can support poverty reduction (SGD1), job creation and economic growth (SDG8), and lower inequalities (SDG10), as well as innovation in maritime technology (SDG9), coastal urbanization (SDG11), and public finances (SDG17).
The influence of other SDGs on SDG14: Education (SDG4), science and technology (SDG9), effective public sectors (SDG16), and partnerships for sustainable development (SDG17) are each examples of critical enablers of progress on all four targets. Education (SDG4) includes marine training and awareness programs, improvements in ocean literacy and skilled sustainability professionals on ocean and sea services. Transparent, inclusive, and accountable institutions (SDG16) are generally seen as important requirements for effective public interventions, such as community governance arrangements in many developing countries, e.g., community management and policing of no-catch zones. In addition, digital technology, ocean governance, policy coherence, mobilization of financial resources, and investments in statistical capacity (SDG17) go hand in hand with progress on each of the four targets. Further, investment in science and technology (SDG9) can support marine conservation and sustainable resource management and result in absorption of advances in marine technology.
While economic growth (SDG8) and poverty reduction (SDG1) may create or free-up resources for marine investments, these goals can result in negative effects on ocean health, efforts to reduce overfishing and protect marine areas, and economic benefits from sustainable maritime sectors. Similarly, industrialization and infrastructure development in coastal areas (SDG9) and coastal urbanization (SDG11) can help to raise economic benefits from maritime sectors, however, without proper consideration of pollution on marine and coastal waters, coastal development can also lower ocean health and undermine marine protection. Moreover, nutrient run-off from agricultural intensification (SDG2) and imported biodiversity threats (SDG15) can harm ocean health, whereas wastewater treatment (SDG6) and protection of terrestrial biodiversity sites (SDG15) may have positive effects. In addition, without management of chemical and household waste (SDG12), waste can severely affect ocean health.
Renewable energy expansion (SDG7), including offshore wind and wave, goes hand in hand with blue economy, but may have negative effects when energy infrastructure results in spatial competition with other uses, e.g., protected areas, fisheries, aquaculture. Finally, climate mitigation (SDG13) can contribute to ocean health and support sustainable fisheries and maritime sectors.
Step 4: Select focal and linkage indicators from official SDG indicator sets based on relevancy and availability. The indicator set for the index was constructed by selecting official SDG indicators relevant to the focal targets (step 1) and targets identified in the analysis of interlinkages (step 3) [69]. Because some official indicators lack internationally established methodology (so-called Tier 3 indicators) or data is not regularly produced (Tier 2 indicators) [69], following Sachs et al. [7], proxy indicators from SDSN’s global indicator set were used to broaden the scope of the assessment.
The decision process for selecting indicators followed three steps: step A, if a target (focal or linkage) had a Tier 1 indicator (i.e., the indicator has an internationally established methodology and data are regularly produced in at least 50% of countries globally), this indicator was selected; step B, if the target had a Tier 2 or Tier 3 indicator, a suitable proxy was sought and if available selected; and step C, if no suitable proxy was available, the target was excluded from the assessment.
Table 4 summarizes the complete list of indicators selected from SDSN’s Sustainable Development Report 2019 [7]. Where possible, SDSN reports official SDG indicators endorsed by the UN Statistical Commission. Where insufficient standards or data is available for an official indicator and to close data gaps, SDSN includes other metrics from official and unofficial providers [68].
Selection of focal indicators: Following SDSN’s approach, the Ocean Health Index’s measure of Clean Waters is used as a proxy for marine pollution. For sustainable fisheries and marine protection, official indicators were selected: Fish Stock Status (Indicator 14.4.1) and Marine Protected Areas (Indicator 14.5.1). Fish Stock Status measures the percent of a country’s total catch within its Economic Exclusive Zone (EEZ) that comprises fish overexploited or collapsed, whereas marine protected areas refer to the extent of protected area in a country’s EEZ divided by its total EEZ.
For economic benefits, the official indicator 14.7.1 is Sustainable Fisheries as a percentage of GDP. This indicator was recently updated to Tier I and the custodian agency, Food and Agriculture Organization (FAO), has not yet published official data [69]. While many countries estimate fisheries contribution to GDP, calculations often involve different methodologies and are not internationally comparable. To facilitate the assessment of Target 14.7, this article introduces a proxy measure “ocean productivity” defined for each country as Total Revenue from Fisheries/EEZ. Data was collected from the Sea Around Us online data portal (seaaroundus.org/data). This indicator uses data on the real 2010 value (US$) of a country’s fisheries sectors: artisanal, recreational, subsistence and industrial; based on reported catches by FAO in 2014 and divides this figure by the country’s EEZ. It can be interpreted as fisheries revenue per km2 of EEZ and seen as a measure of a country’s ocean productivity, similar to measures of land productivity.
Selection of linkage indicators: Based on Table 2 and Table 3, if the ICSU study reported that progress on a goal or target may influence performance on an SDG14 target (or vice versa), the most relevant available indicator(s) related to this goal or target was selected. For instance, to account for potential effects of poverty reduction on overfishing, the national poverty rate was included. Similarly, to account for sustainable fisheries potential role in better nutrition, the percent of the population undernourished and percent obese were included, since healthier diets can affect both subgroups.
Examples of proxy indicators selected include, an urban air pollution indicator is used to proxy for sustainable urbanization on the basis that more sustainable urbanization should have lower environmental footprint. Number of seats held by women in national parliaments proxies for inclusive decision-making. Similarly, press freedom acts as a proxy for quality of institutions. Whereas, government spending on health and education proxies for policy coherence and mobilization of financial resources for sustainable development.
While proxies significantly broadened the assessment’s scope, it did not solve all problems of availability. Some identified targets were excluded due to lack of relevant Tier 1 indicators and of suitable proxies in SDSN’s indicator set. Examples of such targets (and their official indicators) are reduce food loss (food loss index and food waste index), promote effective partnerships (amount of US$ committed to partnerships), and invest in statistical capacity (proportion of SDG indicators at the national level with full disaggregation) [69].
3.2. Indicator Classification, Data and Normalization
Classification of indicators as pressures, impacts and responses is given in column 2 (Table 4). The direction of influences, positive or negative, reported in Table 2 and Table 3 were used respectively to identify eleven impact and ten pressure indicators. Identification of capacity indicators relied on classifications used in the Environmental Sustainability Index [70]. This resulted in eight capacity indicators, spanning education (1), science and technology (1), public sector institutions (3) and governance (3).
Data was collected from SDSN’s Sustainable Development Report 2019 [7] for the year 2018 (or most recent available). Due to some countries missing one or more SDG14 data point, case deletion was applied to ten countries, all of them SIDS (these countries are Bahrain, Brunei Darussalam, Belize, Dominica, Grenada, Nauru, St Kitts and Nevis, St Lucia, St Vincent and the Grenadines, Singapore). SDG14 missing values can affect I-SDG14 results owing to higher weights ascribed to marine targets, i.e., (1/2)(1/4) = 1/8. Similarly, for P, I and R components, countries with less than 50% data points in any one component were excluded. This resulted in case deletion of a further five countries, leaving a final sample of 35 countries for the study (these are Antigua and Barbuda, Kiribati, Micronesia, Palau and Tuvalu. It is worth noting that raising the 50% threshold to 60% results in case deletion of 7 countries (a further 2). A total of 11 countries are excluded at a 70% threshold (a further 4) and 16 countries at 80% (a further 5)). A lower threshold for linkage indicators is justified on grounds that I-SDG14 ascribes considerably less weight to individual linkage indicators (1/2)(1/29) = 1/58. Specifically, there are 4 focal indicators and 29 linkage indicators. Missing values in this dimension thus tend to exhibit smaller effects. A table of summary statistics for N = 35 is given in Appendix A (For N = 35, there are no data gaps for SDG14 and the average data gap for P, I and R respectively are 1.57, 1.23 and 0.63. Thus, in this study, the largest gaps appear for pressures and the least for responses.). The dataset (for N = 35) is available as Supplementary Material S1.
To make indicators comparable for aggregation, I applied min-max normalization. For each country, each selected indicator was rescaled as an ascending variable from 0 to 100 with 0 denoting the worst performance and 100 describing the best performance (Equation (4)).
where is the normalized value; is the observed value; is the minimum value and is the maximum value. To define the “best”, target values were computed using methods of the SDG Index and Dashboard Report [7,47] and are reported in column 6 (Table 4). Similarly, “worst” values were selected from SDSN’s dataset [7] and are reported in Appendix A. From the Table of Summary Statistics, it can be seen that sample minimums often exceed “worst” values. Rather than deriving “worst” values from sample data, which tended to downplay progress of SIDS (or overstate the depth of challenges) in a sample comprising of SIDS and high-income island states, the selection from global data facilitated a more accurate assessment of progress in a global context (often resulting in higher scores and grades) without significantly affecting rankings and the main results.
Following Sachs et al. [7], the score of each sub-index (Equation (3)) can be interpreted as the percent achievement of the component’s targets given by the (normalized) distance to those targets. The SDG14 score is the percent achievement of the four marine targets, the Pressure score is the percent achievement of the ten pressure targets, etc. The I-SDG14 score itself can be interpreted as the sum of the (sustainability) gaps for each component weighted by the gap’s relative importance (see Equations (1) and (2)).
To identify strengths and challenges, a visual representation of component scores in terms of a “traffic light” colour scheme (green = “achieved”, yellow = “considerable challenges”, orange = “significant challenges”, and red = “major challenges”) helps to illustrate distance from the best = 100. In contrast to the SDG Index and Dashboard, this article uses an equal-interval classification. If v is the score, the categorization is green (v ≥ 80), yellow (80 > v ≥ 60), orange (60 > v ≥ 40), and red (v < 40). Following Glass and Newig [71], differences of 20 points are taken to be considerable.
3.3. Results
To illustrate how I-SDG14 may assist with integrated assessment of SDG14, for the purposes of this article, I have focused on the top-five and bottom-five countries in terms of I-SDG14 (Table 5). I-SDG14 scores and ranks for all island states assessed are reported in Appendix B.
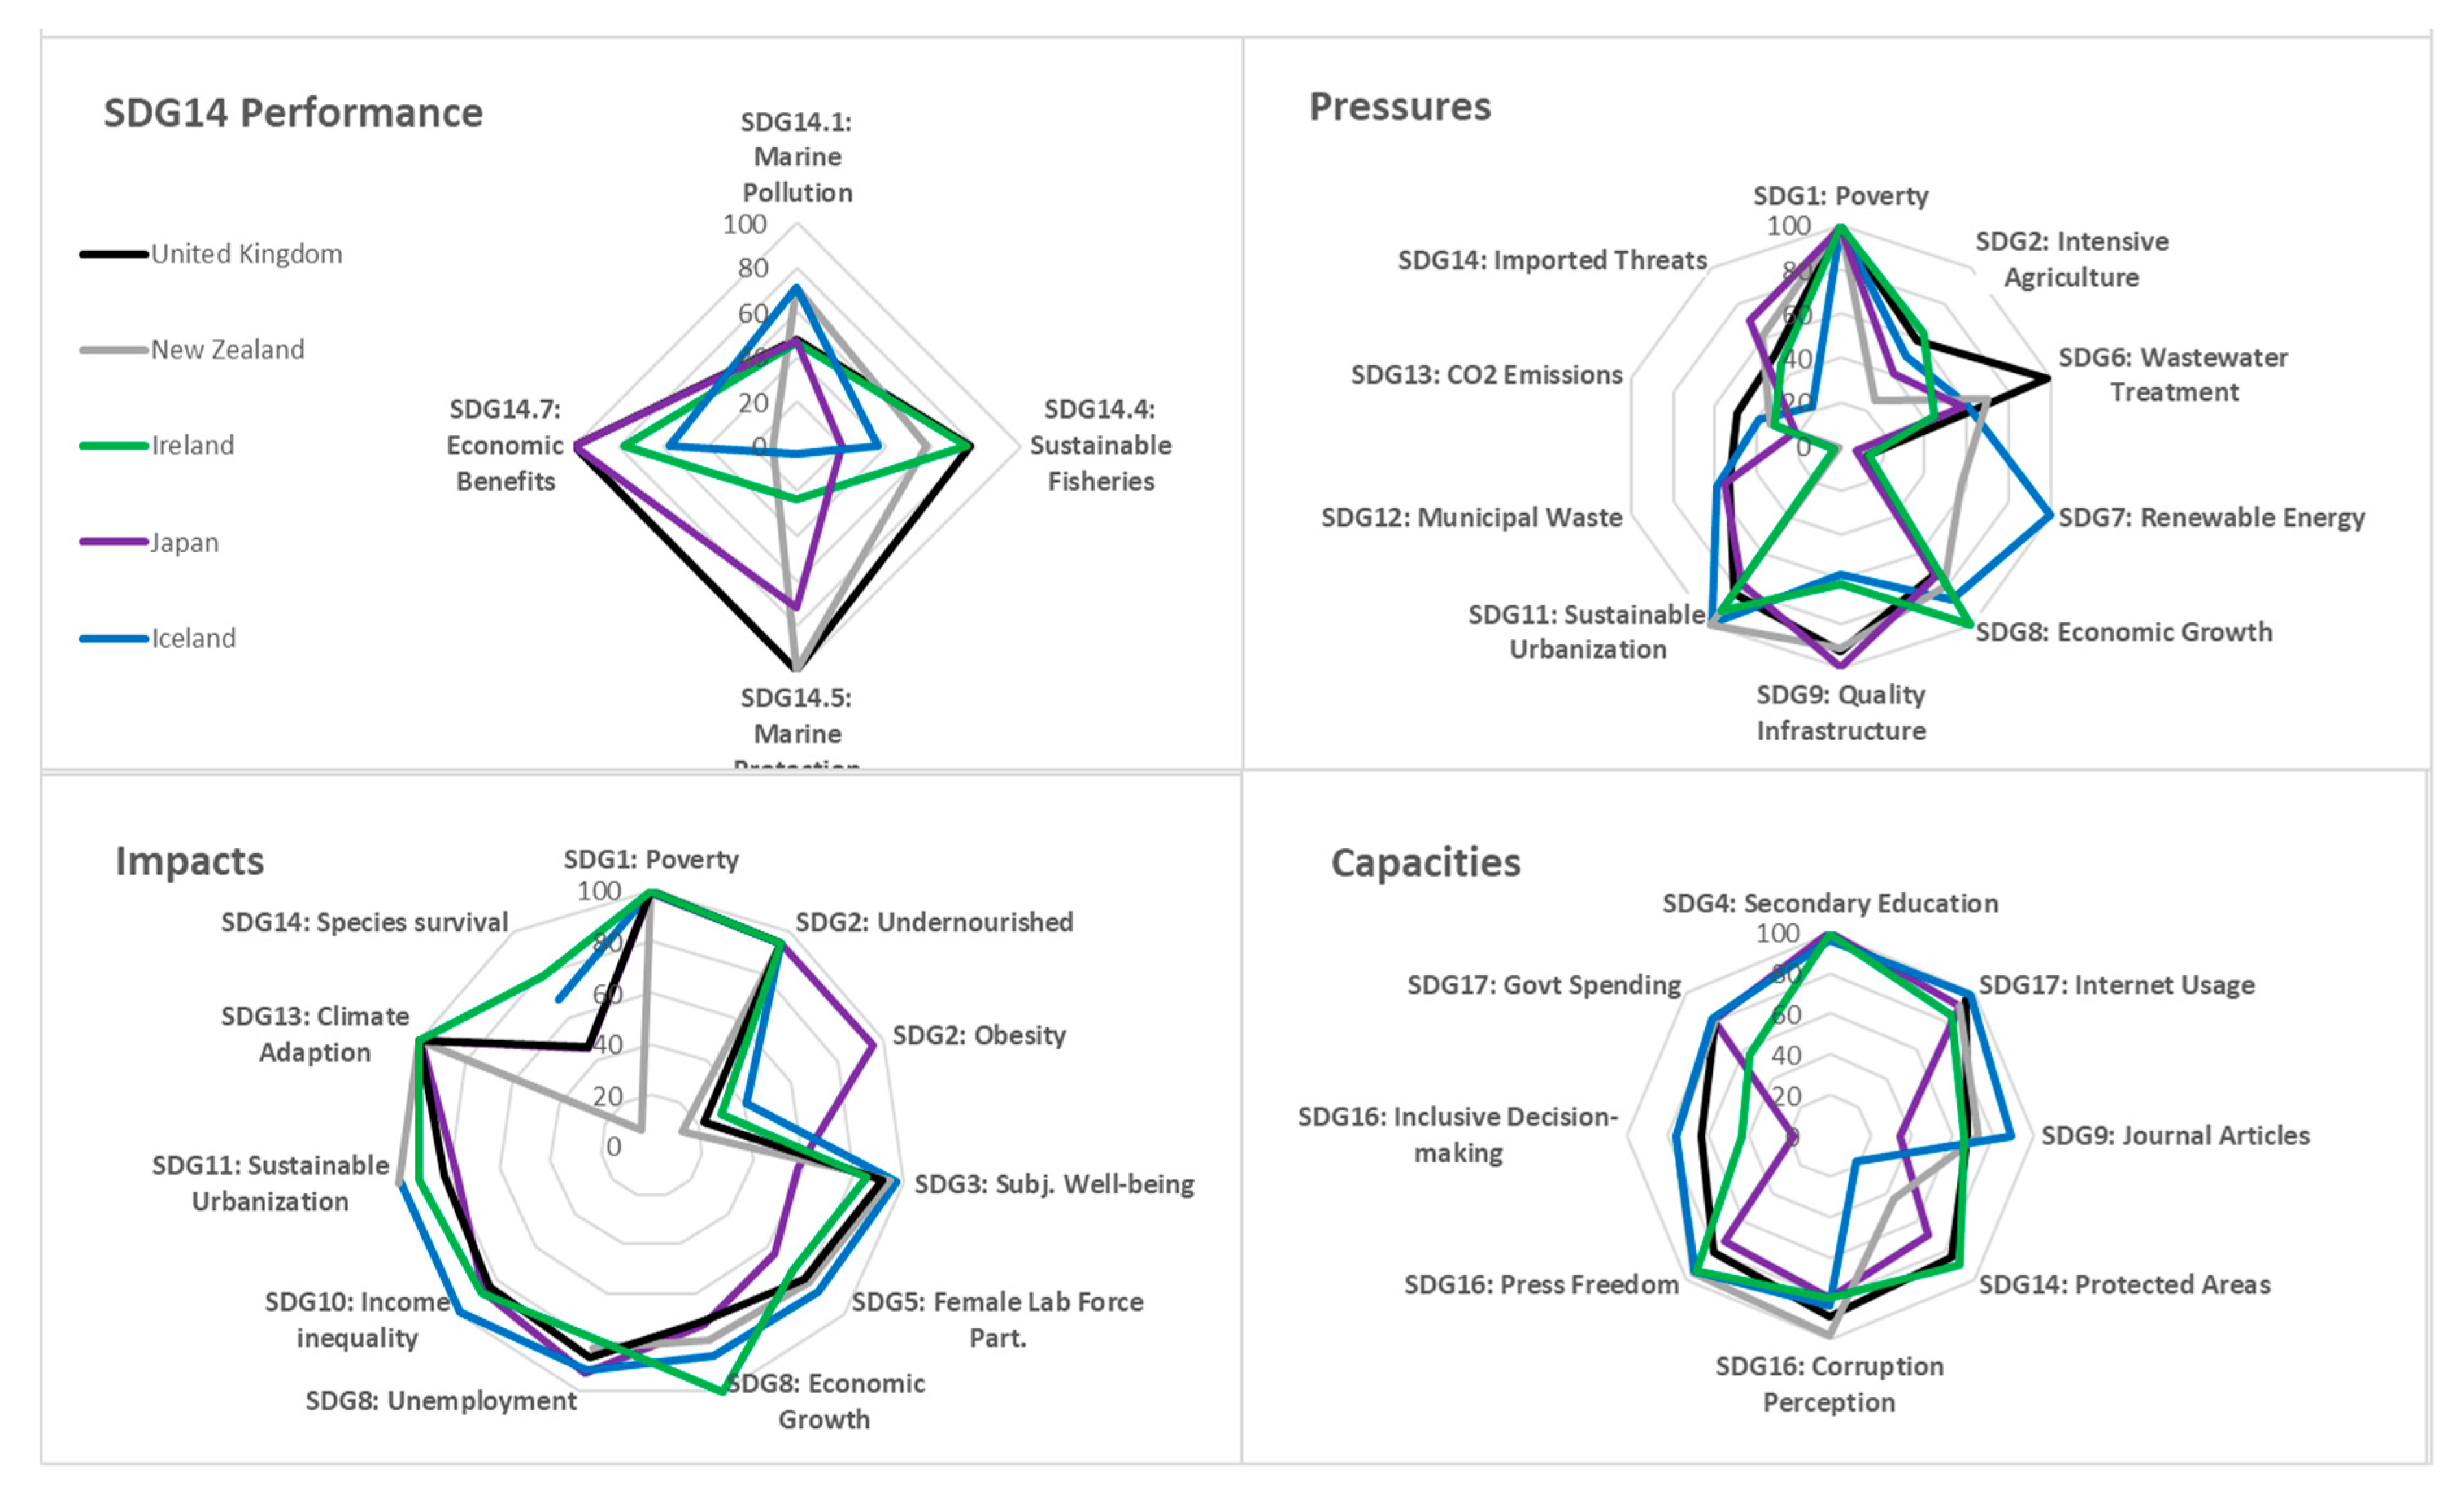
The United Kingdom, New Zealand, Japan, Ireland and Iceland emerged as the top-five countries. Apart from the UK, these countries face considerable (NZ, JPN) or significant challenges (IRL, ISL) on SDG14 implementation. The UK is the only country with a high achievement (81% of marine targets achieved). The others range from a minimum achievement of 42% (ISL) to a maximum of 60% (NZ, JPN). IRL’s achievement is a modest 56%.
Turning to integrated assessment, the top-five face considerable challenges on integrated implementation (signified in yellow). They owe their high rank among island states primarily to their high scores on impacts and responses. While the impact scores range from 75% to 86% and response scores from 68% to 80%, indicating some room for improvement, considerable challenges emerge on marine pressures in all five countries. In IRL, these challenges are significant. The highest score is UK and ISL (67% of pressure targets achieved) and lowest is IRL (56%).
On the other hand, Timor-Leste, Vanuatu, Haiti, Jamaica, and Comoros came out as the bottom-five countries. These low-income (VUT, HTI, COM) and middle-income (TLS, JAM) developing countries are from the Caribbean, Asia Pacific, and African east coast. These countries face major challenges (signified in red) on marine performance. Performance ranges from a minimum achievement of 13% (JAM) to a maximum of 34% (TLS). In addition, all five face major challenges on the integrated implementation of SDG14 (displayed in red). While the bottom-five tend to perform relatively better on pressures and impacts (signified in orange), greater challenges tend to be seen on country capacities (relatively lower scores) especially for low-income countries (highlighted in red). Percent achievement of pressure targets ranges from 22% (HTI) to 48% (JAM), with this range being 22–28% for the three low-income countries, whereas the ranges for all five on impacts and pressures are respectively 44–62% and 31–55%.
To identify where efforts might be needed, useful representation of country performance against each target is provided by radar diagrams, (Figure 2 and Figure 3). The amoeba is produced using normalized values for each indicator. The higher the distance from the centre the higher the country’s performance for that indicator.
For the top-five (Figure 2), clear gaps in marine performance (top-left panel) can be seen in all five countries on marine pollution and sustainable fishing. While they tend to perform well on economic benefits and marine protection, considerable differences in performance are also apparent. For example, significant challenges are evident in ISL and major challenges in NZ on raising economic benefits. Similarly, ISL and IRL face major challenges on the protection of marine areas.
In terms of integrated assessment, focusing first on pressures (top-right panel), it can be seen from the radar-diagram that the top-five tend to face major challenges on emissions, significant challenges on municipal waste, and challenges ranging from major to considerable on intensive agriculture and imported biodiversity threats. While some perform well on wastewater treatment (UK, NZ), renewable energy (ISL, NZ) and infrastructure (JPN, UK, NZ), the others do not. According to the analysis of SDG14 interlinkages (Table 3), all of these pressures can contribute to poor performance on marine pollution. Second, in terms of responses (bottom-right panel), it is evident from this radar-diagram that the top-five have well-developed capacities, particularly in education, digital technology, press freedom (proxy for quality of institutions) and low corruption, however, challenges remain for most of these countries on science and technology, inclusive decision-making, and public spending (policy coherence and mobilization of financial resources) for sustainable development. These challenges if unaddressed may weaken capacities to improve marine performance on sustainable fishing and ocean health (Table 3). Third, on impacts (bottom-left panel), progress on SDG14 could contribute to better performance on several other SDGs. According to the radar diagram, there is scope to improve performance in areas such as obesity, gender equality, growth and employment, and biodiversity. From Table 2, progress on SDG14 could help to reduce obesity through, for example, better fish-based nutrition, lower gender inequalities by integrating sustainable practices in fishing (e.g., higher female labour participation), raise growth and employment in coastal areas (e.g., by the development of maritime sectors), and protect biodiversity.
An almost diametrically opposite picture emerges for the bottom-five countries (Figure 3). Clear gaps emerge on marine performance for economic benefits and marine protection (top-left panel). While some of these countries perform well on ocean health (VUT) and sustainable fishing (TLS, HTI, COM, VUT), the others display major challenges on these marine targets as well.
In terms of pressures (top-right panel), the bottom-five tend to face significant challenges from weak growth, and major challenges from poverty and poor infrastructure, which can undermine performance on all four marine targets (Table 3). In addition, major challenges are also evident on unsustainable agriculture and wastewater treatment, whereas challenges on municipal waste range from considerable (JAM, HTI) to major (COM, VUT), all of which are additional sources of marine pollution (Table 3). Possibly owing to low development, the bottom-five tend to face lower pressures from imported biodiversity threats and domestic emissions. Better marine performance could improve impacts in several areas (bottom-left panel), such as contributing to poverty reduction, better health, stronger growth and less income inequality, and perhaps also help to reduce gender inequalities and terrestrial biodiversity loss (see Table 2). Greatest challenges appear on capacities (bottom-right panel) particularly among low-income countries (VUT, HTI, COM). While progress can be seen in the middle-income countries (JAM, TLS) on education, internet usage and quality of institutions, challenges ranging from significant to major tend to be associated with corruption, government spending (policy coherence and mobilization of finance), inclusive decision-making, science and technological capacity, and terrestrial biodiversity protection. Weak capacities such as these can pose significant obstacles to marine performance (Table 3).
4. Conclusions
The SDGs have renewed interest among academics and policymakers in the priorities and interlinkages of sustainable development. To support integrated approaches to implementation, this article proposed a new index based on a framework that organizes goals linked to a priority or focal SDG in pressure, impact, and response components that can help to assess national baselines for integrated implementation. Focusing for illustrative purposes on SDG14 and its interrelations with other SDGs, the article developed an I-SDG14 index based on a study of SDG14 interlinkages and used this index to provide a snapshot of island states capacities, strengths, and challenges for integrated implementation of SDG14. While all island states assessed face challenges on SDG14 and its integrated implementation, the highest-scoring countries in terms of I-SDG14 (UK, New Zealand, Japan, Ireland, and Iceland) tend to perform well on impacts and responses, yet show challenges ranging from considerable to significant on pressures, primarily reflecting their status on targets related to SDGs 2, 12, 13 and 15. On the other hand, the lowest-scoring countries (Timor-Leste, Vanuatu, Haiti, Jamaica and Comoros) tend to show significant challenges on pressures and impacts, and major challenges or relatively lower scores on capacities to influence SDG14, especially on targets related to SDGs 4, 9, 16 and 17.
By summarizing findings in-country scoreboards and radar-diagrams, the proposed index offers a boundary object to frame discussions on how to implement priorities in a more integrated way. However, several limitations associated with the approach are worth noting. First, the index developed in this article did not consider the relative importance of different targets which could have a crucial bearing on the assessment. In particular, future studies should seek to account for evidence on degrees of synergy or trade-off between areas and the potential role of context in shaping interactions [36,37,38]. Second, as a framework for integrated assessment, the SDGs could result in the exclusion of relevant factors. For example, despite their impact on sustainability in island states, they contain no specific targets on debt and inflation. While debt or inflationary problems can be expected to have discernible impacts on growth and unemployment, the example points to an important limitation with integrated SDG indices. Third, the assessment was limited to the national-level and within-country interlinkages, yet linkages across countries and with global processes and subnational levels are also important [7,42]. Fourth, this article considers a single focal SDG, however, recent systemic approaches to SDG implementation tend to emphasize grouping priorities (targets) from different goals in systems and call for coordinated implementation of “systemic” targets [43,72,73]. Future research should seek to develop integrated indices for systemic transformations given its increasing importance for policy [43,74].
Although the article focused on an application to SDG14 and island states, the index can be readily applied to other SDGs and contexts. Studies of interlinkages for other goals exist (or can be conducted) and required data is publicly available in online portals. In particular, the studies show that interlinkages differ across SDG [19], and therefore should result in different integrated assessments. Interesting applications might include, an I-SDG7 index for integrated assessment of progress on universal and sustainable energy to provide a snapshot of country pressures, impacts and capacities in sub-Saharan Africa, an I-SDG13 for integrated assessment of baselines in EU-25 on climate action or I-SDG3 for integrated assessment of progress in Latin America on universal health and well-being.
Future research can improve the index in several ways. Better assessments could be obtained by addressing data gaps and indicators’ relevancy [75,76], use of more fine-grained SDG interaction frameworks [36,37], estimates of synergies and trade-offs [77] and weighting schemes that reflect indicators importance [78]. In addition, the methodology for indicator selection presented in this article can be improved (see, e.g., [53]). Future research could also seek to account for higher-order interactions using network tools [27], and for interrelations across countries, such as transnational spillovers [7] and linkages with global processes [42]. Another avenue is to use the framework to improve the cooperative structure for sustainable development [2,79,80,81,82,83,84], by assigning targets to government ministries and societal stakeholders based on their responsibilities to enable policy coherence and better partnerships for implementing priority SDGs.
Supplementary Materials
The following are available online at https://www.mdpi.com/2071-1050/12/17/6955/s1, Dataset S1. I-SDG14 Data for Island States (N = 35) from SDSN’s Sustainable Development Report 2019 (for the Year 2018).
Funding
This project received funding from the European Commission and Irish Research Council Horizon 2020 research and innovation program under the Marie Sklodowska-Curie grant agreement 713279.
Acknowledgments
I wish to thank David Farrell, Emma Torres, Yanis Ben Amor, David O’Connor, Alainna Lynch and three anonymous referees for valuable feedback on an earlier draft that helped to improve the paper.
Conflicts of Interest
The author declares no conflict of interest.
Appendix A

Table A1.
Summary Statistics for All Island States Assessed (N = 35).
| Component | SDG/ Target | Indicator | Min | Max | Mean | Standard Deviation | Missing Values | Worst Values |
|---|---|---|---|---|---|---|---|---|
| SDG14 | 14.1 | Ocean Health Index: Clean Waters (0–100) | 36.7 | 91.4 | 61.1 | 13.1 | 0 | 28.6 |
| 14.4 | Fish Stocks Status (%) | 1.1 | 74 | 32.5 | 19.9 | 0 | 90.7 | |
| 14.5 | Marine Protected Areas (% of EEZ) | 0 | 29.7 | 2.8 | 6 | 0 | 0 | |
| 14.7 | Fisheries Revenue (US$ p. km2 of EEZ) | 2.6 | 11,179 | 1009 | 2066 | 0 | 0 | |
| Pressures | 1 | Poverty Headcount Ratio at $3.20/day (%) | 0 | 92.5 | 22.5 | 26.3 | 3 | 51.5 |
| 2 | Sustainable Nitrogen Management Index | 0.4 | 1.3 | 0.9 | 0.3 | 21 | 1.2 | |
| 5 | Anthropogenic wastewater treatment (%) | 0 | 100 | 21.1 | 31.4 | 9 | 0 | |
| 7 | Renewable Energy Consumption (% of TEC) | 0.3 | 86.9 | 28 | 24.5 | 0 | 2.7 | |
| 8 | Adjusted Growth Rate (%) | −12 | 7.2 | −2.1 | 3.4 | 2 | −14.7 | |
| 9 | Logistics performance index (1 = Low 5 = High) | 1.8 | 4.2 | 2.6 | 0.7 | 9 | 1.8 | |
| 11 | PM2.5 air quality in urban areas (μg/m3) | 6 | 34.8 | 16.3 | 6.9 | 0 | 29.8 | |
| 12 | Municipal solid waste (kg/day/per capita) | 0.2 | 5.3 | 2.2 | 1.5 | 5 | 3.7 | |
| 13 | Energy-related tCO2 emissions per capita | 0.1 | 30.2 | 3.9 | 5.2 | 0 | 11.4 | |
| 15 | Imported biodiversity threats (per million pop) | 0.3 | 140.2 | 13.7 | 25.8 | 6 | 26.4 | |
| Impacts | 1 | Poverty Headcount Ratio at $3.20/day (%) | 0 | 92.5 | 22.5 | 26.3 | 3 | 51.5 |
| 2 | Prevalence of undernourishment (% pop.) | 2.5 | 45.8 | 10.5 | 11.3 | 6 | 42.3 | |
| 2 | Prevalence obesity BMI ≥ 30 (% adult pop.) | 3.8 | 52.9 | 20.9 | 12.4 | 0 | 35.1 | |
| 3 | Subjective well-being (10 = High to 0 = Low) | 3.6 | 7.5 | 5.8 | 1.2 | 16 | 3.3 | |
| 5 | Female to male labour force participation rate % | 47.3 | 97.4 | 71.4 | 13.9 | 2 | 21.5 | |
| 8 | Adjusted Growth Rate (%) | −12 | 7.2 | −2.1 | 3.4 | 2 | −14.7 | |
| 8 | Unemployment Rate (%) | 1.2 | 13.9 | 6.2 | 3.7 | 2 | 25.9 | |
| 10 | Gini Coefficient for Income (0–100) | 27.8 | 57.6 | 38.9 | 6.9 | 6 | 63 | |
| 11 | PM2.5 air quality in urban areas (μg/m3) | 6 | 34.8 | 16.3 | 6.9 | 0 | 29.8 | |
| 13 | People affected by climate-related disasters (per 100,000) | 0 | 29,287 | 6578 | 8555 | 6 | 18,000 | |
| 15 | Red List Index of species survival (0 = Low 1 = High) | 0.4 | 1 | 0.8 | 0.1 | 0 | 0.6 | |
| Responses | 4 | Lower Secondary Completion Rate (%) | 36.1 | 133.8 | 84.1 | 22.7 | 3 | 18 |
| 9 | Number of scientific and technical journal articles (per 1000 population) | 0 | 2 | 0.3 | 0.5 | 0 | 0 | |
| 15 | Mean area protected in freshwater sites important to biodiversity (%) | 0 | 99.4 | 35.5 | 27.7 | 1 | 4.6 | |
| 16 | Corruption Perception Index (0 = Worst 100 = Best) | 16 | 87 | 47.8 | 18.6 | 4 | 13 | |
| 16 | Freedom of the Press Index (0 = Low 100 = High) | 11.3 | 68.9 | 27.1 | 11.4 | 6 | 80 | |
| 16 | Seats held by women in national parliaments (%) | 0 | 53.2 | 18.5 | 12.3 | 0 | 1.2 | |
| 17 | Government spending on health and education, proportion of GDP (% GDP) | 2.3 | 14.2 | 8 | 3.4 | 8 | 0 | |
| 17 | Population using the internet (%) | 3.9 | 98.3 | 50.8 | 28.1 | 0 | 2.2 |
Appendix B
Table A2.
I-SDG14 Index: Scores and Rankings for Island States Assessed (N = 35).
| Country | ABN | SDG14 Score | Rank | Pressure Score | Rank | Impact Score | Rank | Response Score | Rank | I-SDG14 Score | Rank |
|---|---|---|---|---|---|---|---|---|---|---|---|
| United Kingdom | GBR | 81 | 1 | 67 | 3 | 78 | 4 | 80 | 1 | 78 | 1 |
| New Zealand | NZL | 60 | 4 | 62 | 5 | 75 | 6 | 80 | 3 | 66 | 2 |
| Japan | JPN | 60 | 3 | 60 | 7 | 80 | 3 | 68 | 6 | 65 | 3 |
| Ireland | IRL | 56 | 5 | 56 | 14 | 84 | 2 | 76 | 4 | 64 | 4 |
| Iceland | ISL | 42 | 11 | 67 | 2 | 86 | 1 | 80 | 2 | 60 | 5 |
| Malta | MLT | 46 | 8 | 61 | 6 | 76 | 5 | 67 | 7 | 57 | 6 |
| Dominican Republic | DOM | 51 | 6 | 59 | 9 | 63 | 16 | 61 | 10 | 56 | 7 |
| Indonesia | IDN | 51 | 7 | 60 | 8 | 68 | 11 | 38 | 25 | 54 | 8 |
| Guinea-Bissau | GNB | 66 | 2 | 35 | 31 | 55 | 25 | 26 | 32 | 53 | 9 |
| Samoa | WSM | 40 | 12 | 73 | 1 | 66 | 13 | 48 | 18 | 52 | 10 |
| Sri Lanka | LKA | 43 | 10 | 57 | 12 | 63 | 15 | 38 | 26 | 48 | 11 |
| Philippines | PHL | 39 | 13 | 58 | 11 | 63 | 14 | 44 | 20 | 47 | 12 |
| Fiji | FJI | 38 | 14 | 58 | 10 | 55 | 26 | 51 | 15 | 46 | 13 |
| Suriname | SUR | 44 | 9 | 44 | 25 | 51 | 32 | 45 | 19 | 45 | 14 |
| Maldives | MDV | 29 | 28 | 56 | 13 | 73 | 8 | 44 | 22 | 44 | 15 |
| Cuba | CUB | 31 | 25 | 43 | 27 | 57 | 23 | 64 | 8 | 42 | 16 |
| Bahamas, The | BHS | 31 | 24 | 44 | 26 | 59 | 21 | 60 | 11 | 42 | 17 |
| Cabo Verde | CPV | 29 | 26 | 52 | 19 | 57 | 24 | 55 | 12 | 42 | 18 |
| Papua New Guinea | PNG | 25 | 31 | 67 | 4 | 72 | 9 | 24 | 34 | 41 | 19 |
| Madagascar | MDG | 34 | 18 | 53 | 17 | 60 | 19 | 27 | 31 | 41 | 20 |
| Guyana | GUY | 35 | 15 | 35 | 32 | 57 | 22 | 50 | 16 | 41 | 21 |
| Trinidad and Tobago | TTO | 32 | 21 | 34 | 33 | 62 | 18 | 54 | 13 | 41 | 22 |
| Cyprus | CYP | 17 | 34 | 50 | 21 | 74 | 7 | 74 | 5 | 41 | 23 |
| Sao Tome and Principe | STP | 34 | 17 | 49 | 22 | 49 | 33 | 41 | 24 | 41 | 24 |
| Mauritius | MUS | 29 | 27 | 42 | 29 | 67 | 12 | 44 | 21 | 40 | 25 |
| Barbados | BRB | 23 | 32 | 42 | 30 | 71 | 10 | 61 | 9 | 40 | 26 |
| Tonga | TON | 32 | 23 | 52 | 18 | 53 | 30 | 36 | 28 | 40 | 27 |
| Solomon Islands | SLB | 34 | 19 | 42 | 28 | 59 | 20 | 32 | 29 | 40 | 28 |
| Marshall Islands | MHL | 35 | 16 | 46 | 24 | 44 | 34 | 36 | 27 | 39 | 29 |
| Seychelles | SYC | 32 | 22 | 33 | 34 | 53 | 28 | 52 | 14 | 39 | 30 |
| Timor-Leste | TLS | 34 | 20 | 31 | 35 | 53 | 29 | 42 | 23 | 38 | 31 |
| Vanuatu | VUT | 27 | 29 | 49 | 23 | 51 | 31 | 25 | 33 | 36 | 32 |
| Haiti | HTI | 27 | 30 | 55 | 15 | 40 | 35 | 22 | 35 | 34 | 33 |
| Jamaica | JAM | 13 | 35 | 53 | 16 | 62 | 17 | 48 | 17 | 34 | 34 |
| Comoros | COM | 20 | 33 | 51 | 20 | 54 | 27 | 28 | 30 | 33 | 35 |
Author’s own calculations. For score , green = “achieved” (), yellow = “considerable challenges” (), orange = “significant challenges” (), and red = “major challenges” ().
References
- UN. Transforming Our World: The 2030 Agenda for Sustainable Development. 2015. Available online: https://www.un.org/ga/search/view_doc.asp?symbol=A/%20RES/70/1=E (accessed on 10 March 2020).
- Chimhowu, A.O.; Hulme, D.; Munro, L.T. The ‘New’ national development planning and global development goals: Processes and partnerships. World Dev. 2019, 120, 76–89. [Google Scholar] [CrossRef]
- UN. Global Indicator Framework for the Sustainable Development Goals and Targets of the 2030 Agenda for Sustainable Development. 2016. Available online: https://unstats.un.org/sdgs/ (accessed on 12 March 2020).
- Schmidt-Traub, G.; Kroll, C.; Teksoz, K.; Durand-Delacre, D.; Sachs, J.D. National baselines for the Sustainable Development Goals assessed in the SDG Index and Dashboards. Nat. Geosci. 2017, 10, 547. [Google Scholar] [CrossRef]
- Eurostat. Sustainable Development in the European Union—Monitoring Report on Progress towards the SDGs in an EU Context; Eurostat: Luxembourg, 2017. [Google Scholar]
- Allen, C.; Reid, M.; Thwaites, J.; Glover, R.; Kestin, T. Assessing national progress and priorities for the Sustainable Development Goals (SDGs): Experience from Australia. Sustain. Sci. 2019, 15, 521–538. [Google Scholar] [CrossRef]
- Sachs, J.; Schmidt-Traub, G.; Kroll, C.; Lafortune, G.; Fuller, G. Sustainable Development Report 2019. Transformations to Achieve the Sustainable Development Goals; Bertelsmann Stiftung; Sustainable Development Solutions Network (SDSN): New York, NY, USA, 2019; Available online: https://www.sdgindex.org/ (accessed on 15 March 2020).
- Allen, C.; Metternicht, G.; Wiedmann, T. Prioritising SDG targets: Assessing baselines, gaps and interlinkages. Sustain. Sci. 2019, 14, 421–438. [Google Scholar] [CrossRef]
- Allen, C.; Nejdawi, R.; El-Baba, J.; Hamati, K.; Metternicht, G.; Wiedmann, T. Indicator-based assessments of progress towards the sustainable development goals (SDGs): A case study from the Arab region. Sustain. Sci. 2017, 12, 975–989. [Google Scholar] [CrossRef]
- Biggeri, M.; Clark, D.A.; Ferrannin, A.; Mauro, V. Tracking the SDGs in an “integrated” manner: A proposal for a new index to capture synergies and trade-offs between and within goals. World Dev. 2019, 122, 628–647. [Google Scholar] [CrossRef]
- McArthur, J.W.; Rasmussen, K. Classifying Sustainable Development Goal trajectories: A country-level methodology for identifying which issues and people are getting left behind. World Dev. 2019, 123, 1–13. [Google Scholar] [CrossRef]
- OECD. Better Policies for Sustainable Development 2016: A New Framework for Policy Coherence; OECD Publishing: Paris, France, 2016. [Google Scholar]
- Tosun, J.; Leininger, J. Governing the Interlinkages between the Sustainable Development Goals: Approaches to Attain Policy Integration. Glob. Chall. 2017, 1, 1700036. [Google Scholar] [CrossRef]
- Stafford-Smith, M.; Griggs, D.; Gaffney, O.; Ullah, F.; Reyers, B.; Kanie, N.; Stigson, B.; Shrivastava, P.; Leach, M.; O’Connell, D. Integration: The key to implementing the sustainable development goals. Sustain. Sci. 2016, 12, 911–919. [Google Scholar] [CrossRef] [Green Version]
- UN. Our Ocean, Our Future: Call for Action. In Proceedings of the Resolution adopted by the General Assembly, New York, NY, USA, 6 July 2017. [Google Scholar]
- WWF. Living Blue Planet. Report: Species, Habitat and Human Well-Being; World Wildlife Fund: Gland, Switzerland, 2015. [Google Scholar]
- UNEP. GEO Small Island Developing States Outlook, United Nations Environment Programme, Nairobi, Kenya. 2014. Available online: https://portals.iucn.org/library/sites/library/files/documents/Man-SOE-UNEP-2014-GEO-SIDS.pdf (accessed on 28 March 2020).
- UNDESA. Trends in Sustainable Development: Small Island Development States; United Nations Department for Economic and Social Affairs: New York, NY, USA, 2010. [Google Scholar]
- ICSU. A Guide to SDG Interactions: From Science to Implementation; International Council for Science: Paris, France, 2017. [Google Scholar]
- Niemeijer, D.; de Groot, R.S. A conceptual framework for selecting environmental indicator sets. Ecol. Indic. 2008, 8, 14–25. [Google Scholar] [CrossRef]
- Niemeijer, D.; de Groot, R. Framing environmental indicators: Moving from causal chains to causal networks. Environ. Dev. Sustain. 2007, 10, 89–106. [Google Scholar] [CrossRef]
- OECD. Environmental Indicators; OECD Core Set.: Paris, France, 1994; p. 37. [Google Scholar]
- EEA. Europe’s Environment: The Dobris Assessment; Report No. 1/1995; European Environmental Agency: Copenhagen, Denmark, 1995; p. 8. [Google Scholar]
- Gari, S.R.; Newton, A.; Icely, J.D. A review of the application and evolution of the DPSIR framework with 1166 an emphasis on coastal social-ecological systems. Ocean Coast. Manag. 2015, 103, 63–77. [Google Scholar] [CrossRef] [Green Version]
- OECD. Environmental Indicators for Agriculture; Organization for Economic Co-Operation and Development: Paris, France, 1999; Volume 1 concepts and frameworks. [Google Scholar]
- IGES. Institute for Global Environmental Strategies (2015) Achieving the Sustainable Development Goals: From Agenda to Action; Institute for Global Environmental Strategies: Kanagawa, Japan, 2016. [Google Scholar]
- Weitz, N.; Carlsen, H.; Nilsson, M.; Skånberg, K. Towards systemic and contextual priority setting for implementing the 2030 Agenda. Sustain. Sci. 2017, 13, 1–18. [Google Scholar] [CrossRef] [PubMed] [Green Version]
- Singh, G.G.; Cisneros-Montemayor, A.M.; Swartz, W.; Cheung, W.; Guy, J.A.; Kenny, T.-A.; McOwen, C.J.; Asch, R.; Geffert, J.L.; Wabnitz, C.C.C.; et al. A rapid assessment of co-benefits and trade-offs among sustainable development goals. Mar. Policy 2017, 93, 223–231. [Google Scholar] [CrossRef]
- Collin, J.; Casswell, S. Alcohol and the sustainable development goals. Lancet 2016, 387, 2582–2583. [Google Scholar] [CrossRef]
- Vladimirova, K.; Le Blanc, D. Exploring links between education and sustainable development goals through the lens of un flagship reports. Sustain. Dev. 2016, 24, 254–271. [Google Scholar] [CrossRef]
- Van Zanten, J.A.; van Tulder, R. Towards nexus-based governance: Defining interactions between economic activities and Sustainable Development Goals (SDGs). Int. J. Sustain. Dev. World Ecol. 2020. [Google Scholar] [CrossRef]
- Mantlana, K.B.; Maoela, A.M. Mapping the interlinkages between sustainable development goal 9 and other sustainable development goals: A preliminary exploration. Bus. Strategy Dev. 2019, 1–12. [Google Scholar] [CrossRef]
- Nerini, F.F.; Sovacool, B.; Hughes, N.; Cozzi, L.; Cosgrave, E. Connecting climate action with other Sustainable Development Goals. Nat. Sustain. 2019, 2, 674–680. [Google Scholar] [CrossRef]
- Le Blanc, D.; Freire, C.; Vierros, M. Mapping the Linkages between Oceans and Other Sustainable Development Goals: A Preliminary Exploration. DESA Working Paper No. 149. Available online: https://sustainabledevelopment.un.org/content/documents/12468DESA_WP149_E.pdf (accessed on 20 March 2020).
- Weitz, N.; Persson, A.; Nilsson, M.; Tenggren, S. Sustainable Development Goals for Sweden: Insights on Setting A National Agenda. Available online: https://www.researchgate.net/publication/304037246_Sustainable_Development_Goals_for_Sweden_Insights_on_Setting_a_National_Agenda (accessed on 15 March 2020).
- Weitz, N.; Nilsson, M.; Davis, M. A Nexus Approach to the Post2015 Agenda: Formulating integrated water, energy, and food SDGs. SAIS Rev. Int. Aff. 2014, 34, 37–50. [Google Scholar] [CrossRef]
- Nilsson, M.; Griggs, D.; Visbeck, M. Map the interactions between Sustainable Development Goals. Nature 2016, 534, 320–322. [Google Scholar] [CrossRef] [PubMed]
- Nilsson, M.; Chisholm, E.; Griggs, D.; Howden-Chapman, P.; McCollum, D.; Messerli, P.; Neumann, B.; Stevance, A.; Visbeck, M.; Stafford-Smith, M. Mapping interactions between the sustainable development goals: Lessons learned and ways forward. Sustain. Sci. 2018, 13, 1489–1503. [Google Scholar] [CrossRef] [PubMed] [Green Version]
- Janoušková, S.; Hák, T.; Moldan, B. Global SDGs Assessments: Helping or Confusing Indicators? Sustainability 2018, 10, 1540. [Google Scholar] [CrossRef] [Green Version]
- Nardo, M.; Saisana, M.; Saltelli, A.; Tarantola, S.; Hoffman, A.; Giovannini, E. Handbook on Constructing Composite Indicators. In OECD Statistics Working Papers; OECD: Paris, France, 2008. [Google Scholar]
- Saltelli, A. Composite indicators between analysis and advocacy. Soc. Indic. Res. 2007, 81, 65–77. [Google Scholar] [CrossRef]
- Bastianoni, S.; Coscieme, L.; Caro, D.; Marchettin, N.; Pulselli, F.M. The needs of sustainability: The overarching contribution of systems approach. Ecol. Indic. 2019, 100, 69–73. [Google Scholar] [CrossRef]
- UNDESA. Global Sustainable Development Report. The Future is Now—Science for Achieving Sustainable Development. Prepared by Independent Group of Scientists Appointed by the Secretary-General; United Nations Department of Economic and Social Affairs: New York, NY, USA, 2019. [Google Scholar]
- De Sherbinin, A.; Reuben, A.; Levy, M.A.; Johnson, L. Indicators in practice: How environmental indicators are being used in policy and management contexts; Yale Columbia University: New Haven, NY, USA, 2013. [Google Scholar]
- Kyncolova, P.; Upadhyaya, S.; Nice, T. Composite index as a measure on achieving Sustainable Development Goal 9 (SDG-9) industry-related targets: The SDG-9 index. Appl. Energy 2020, 265, 114755. [Google Scholar] [CrossRef]
- Saladini, F.; Betti, G.; Ferragina, E.; Bouraoui, F.; Cupertino, S.; Canitano, G.; Gigliotti, M.; Autino, A.; Pulselli, F.M.; Riccaboni, A.; et al. Linking the water-energy-food nexus and sustainable development indicators for the Mediterranean region. Ecol. Indic. 2019, 91, 689–697. [Google Scholar] [CrossRef]
- Nhemachena, C.; Matchaya, G.; Nhemachena, C.R.; Karuiaihe, S.; Muchara, B.; Nhlengethwa, S. Measuring Baseline Agriculture-Related Sustainable Development Goals Index for Southern Africa. Sustainability 2018, 10, 849. [Google Scholar] [CrossRef] [Green Version]
- Guipponi, C.; Gain, A.M. Integrated spatial assessment of the water, energy and food dimensions of the Sustainable Development Goals. Reg. Environ. Chang. 2017, 17, 1881–1893. [Google Scholar] [CrossRef]
- Howe, P. The triple nexus: A potential approach to supporting the achievement of the Sustainable Development Goals? World Dev. 2019, 124, 104629. [Google Scholar] [CrossRef]
- Millennium Ecosystem Assessment. Ecosystems and Human Well-Being: Biodiversity Synthesis; World Resource Institute: Washington, DC, USA, 2005.
- Ostrom, E. A general framework for analyzing sustainability of social-ecological systems. Science 2009, 325, 419–422. [Google Scholar] [CrossRef] [PubMed]
- Elliott, M.; Burdon, D.; Atkins, J.P.; Borja, A.; Cormier, R.; de Jonge, V.N.; Turner, R.K. And DPSIR begat DAPSI(W)R(M)!—A unifying framework for marine environmental management. Mar. Pollut. Bull. 2017, 118, 27–40. [Google Scholar] [CrossRef] [PubMed] [Green Version]
- Schipper, C.; Dekker, G.; Visser, B.D.; Bolman, B.; Lodder, Q. Characterization of SDGs towards climate resilient coastal infrastructure: Sustainability performance and cross-linking cumulative consequences. Sustainability. Forthcoming.
- Estoque, R.C. A Review of the Sustainability Concept and the State of SDG Monitoring Using Remote Sensing. Remote Sens. 2020, 12, 1770. [Google Scholar] [CrossRef]
- Ndzabandzaba, C. Data Sharing for Sustainable Development in Less Developed and Developing Countries. Glob. Sustain. Dev. Rep. 2015. Available online: https://wedocs.unep.org/bitstream/handle/20.500.11822/9849/-Global_Sustainable_Development_Report_-_Advanced_Unedited_Version-2015GSDR_2015.pdf.pdf?sequence=3&isAllowed=y (accessed on 18 August 2020).
- UN Environment. Applying Marine and Coastal Area-Based Management Approaches to Achieve Multiple Sustainable Development Goal Targets: Summary for Policy Makers. UN Regional Seas Reports and Studies No. 206. 2018. Available online: https://www.unep-wcmc.org/resources-and-data/ocean-sdgs (accessed on 21 August 2020).
- Schipper, C.A. Understanding the Sustainable Development Goal approach For Ports of the Future. In Proceedings of the 38th IAHR World Congress, Panama City, Panama, 1–6 September 2019. [Google Scholar]
- Essex, B.; Koop, S.H.A.; Van Leeuwen, C.J. Proposal for a National Blueprint Framework to monitor Progress on Water-related Sustainable Development Goals in Europe. Environ. Manag. 2020, 18. [Google Scholar] [CrossRef] [Green Version]
- Schroeder, P.; Anggraeni, K.; Weber, U. The relevance of circular economy practices to the sustainable development goals. J. Ind. Ecol. 2019, 23, 77–95. [Google Scholar] [CrossRef] [Green Version]
- Ahvenniemi, H.; Huovila, A.; Pinto-Seppä, I.; Airaksinen, M. What are the differences between sustainable and smart cities? Cities 2017, 60, 225–234. [Google Scholar] [CrossRef]
- Lu, C.; Jin, S.; Tang, X.; Lu, C.; Li, H.; Pang, J. Spatio-Temporal Comprehensive Measurements of Chinese Citizens’ Health Levels and Associated Influencing Factors. Healthcare 2020, 8, 231. [Google Scholar] [CrossRef]
- Estoque, R.C.; Murayama, Y. A worldwide country-based assessment of social-ecological status (c. 2010) using the social-ecological status index. Ecol. Indic. 2017, 72, 605–614. [Google Scholar] [CrossRef]
- Estoque, R.C.; Murayama, Y. Social-ecological status index: A preliminary study of its structural composition and application. Ecol. Indic. 2014, 43, 183–194. [Google Scholar] [CrossRef]
- Marti, X.; Lescrauwaet, A.; Borg, M.; Valls, M. Indicators Guidelines. To Adapt. An. Indicators-Based Approach to Evaluate Sustainable Coastal Development; Government of Catalonia: Barcelona, Spain, 2007. [Google Scholar]
- El Mahrad, B.; Newton, A.; Icely, J.D.; Kacimi, I.; Abalansa, S.; Snoussi, M. Contribution of Remote Sensing Technologies to a Holistic Coastal and Marine Environmental Management Framework: A Review. Remote Sens. 2020, 12, 2313. [Google Scholar] [CrossRef]
- Sachs, J.; Schmidt-Traub, G.; Kroll, C.; Lafortune, G.; Fuller, G.; Woelm, F. The Sustainable Development Goals and COVID-19. Sustainable Development Report 2020; Cambridge University Press: Cambridge, UK, 2020. Available online: https://sdgindex.org (accessed on 22 August 2020).
- UN. Shared Responsibility, Global Solidarity: Responding to the Socio-economic Impacts of Covid-19; United Nations: New York, NY, USA, March 2020; Available online: https://unsdg.un.org/sites/default/files/2020-03/SG-Report-Socio-Economic-Impact-of-Covid19.pdf (accessed on 22 August 2020).
- Lafortune, G.; Fuller, G.; Moreno, J.; Schmidt-Traub, G.; Kroll, C. SDSN Index and Dashboard Detailed Methodology Paper. Available online: https://www.sdgindex.org/reports/sdg-index-and-dashboards-2018/ (accessed on 25 March 2020).
- UN. Tier Assessment for Global Indicators, Updated as of April. 2020. Available online: https://unstats.un.org/sdgs/ (accessed on 31 March 2020).
- Esty, D.C.; Levy, M.A.; Srebotnjak, T.; de Sherbinin, A. 2005 Environmental Sustainability Index: Benchmarking National Environmental Stewardship; Yale Center for Environmental Law & Policy: New Haven, CT, USA, 2005. [Google Scholar]
- Glass, L.M.; Newig, J. Governance for Achieving the Sustainable Development Goals: How important are participation, policy coherence, reflexivity, adaption and democratic institutions? Earth Syst. Gov. 2019, 2, 100031. [Google Scholar] [CrossRef]
- Sachs, J.D.; Schmidt-Traub, G.; Mazzucato, M.; Messner, D.; Nakicenovic, N.; Rockström, J. Six Transformations to achieve the Sustainable Development Goals. Nat. Sustain. 2019, 2, 805–814. [Google Scholar] [CrossRef]
- TWI2050—The World in 2050 2018. Transformations to Achieve the Sustainable Development Goals. Report prepared by The World in 2050 initiative; International Institute for Applied Systems Analysis (IIASA): Laxenburg, Austria, 2018; Available online: http://pure.iiasa.ac.at/15347 (accessed on 12 March 2020).
- Walsh, P.P.; Murphy, E.; Horan, D. The role of science, technology and innovation in the UN 2030 agenda. Technol. Forecast. Soc. Chang. 2020, 154, 1–7. [Google Scholar] [CrossRef]
- Dang, H.H.; Serajuddin, U. Tracking the sustainable development goals: Emerging measurement challenges and further reflections. World Dev. 2020, 127, 104570. [Google Scholar] [CrossRef] [Green Version]
- Hák, T.; Janoušková, S.; Moldan, B. Sustainable Development Goals: A need for relevant indicators. Ecol. Indic. 2016, 60, 565–573. [Google Scholar] [CrossRef]
- Barbier, E.B.; Burgess, J.C. Sustainable development goal indicators: Analyzing trade-offs and complementarities. World Dev. 2019, 127, 295–305. [Google Scholar] [CrossRef]
- Herlitz, A.; Horan, D. A model and indicator of aggregation need satisfaction for capped objectives and weighting schemes for situations of scarcity. Soc. Indic. Res. 2017, 133, 417–430. [Google Scholar] [CrossRef]
- Breuer, A.; Janetschek, H.; Malerba, D. Translating Sustainable Development Goal (SDG) Interdependencies into Policy Advice. Sustainability 2019, 11, 2092. [Google Scholar] [CrossRef] [Green Version]
- Horan, D. Compensation strategies to enact new governance frameworks for SDG transformations. Public Sect. Econ. 2019, 43, 375–400. [Google Scholar] [CrossRef]
- Horan, D. A new approach to partnerships for SDG transformations. Sustainability 2019, 11, 4947. [Google Scholar] [CrossRef] [Green Version]
- Moreno-Serna, J.; Sánchez-Chaparro, T.; Mazorra, J.; Arzamendi, A.; Stott, L.; Mataix, C. Transformational Collaboration for the SDGs: The Alianza Shire’s Work to Provide Energy Access in Refugee Camps and Host Communities. Sustainability 2020, 12, 539. [Google Scholar] [CrossRef] [Green Version]
- Van Hille, I.; de Bakker, F.G.; Ferguson, J.E.; Groenewegen, P. Cross-Sector Partnerships for Sustainability: How Mission-Driven Conveners Drive Change in National Coffee Platforms. Sustainability 2020, 12, 2846. [Google Scholar] [CrossRef] [Green Version]
- Dzhengiz, T. A Literature Review of Inter-Organizational Sustainability Learning. Sustainability 2020, 12, 4876. [Google Scholar] [CrossRef]
Figure 1.
An integrated Sustainable Development Goal (I-SDGx) index based on a pressure-impact-response framework for dividing targets linked to the focal SDG (SDGx).
Figure 1.
An integrated Sustainable Development Goal (I-SDGx) index based on a pressure-impact-response framework for dividing targets linked to the focal SDG (SDGx).
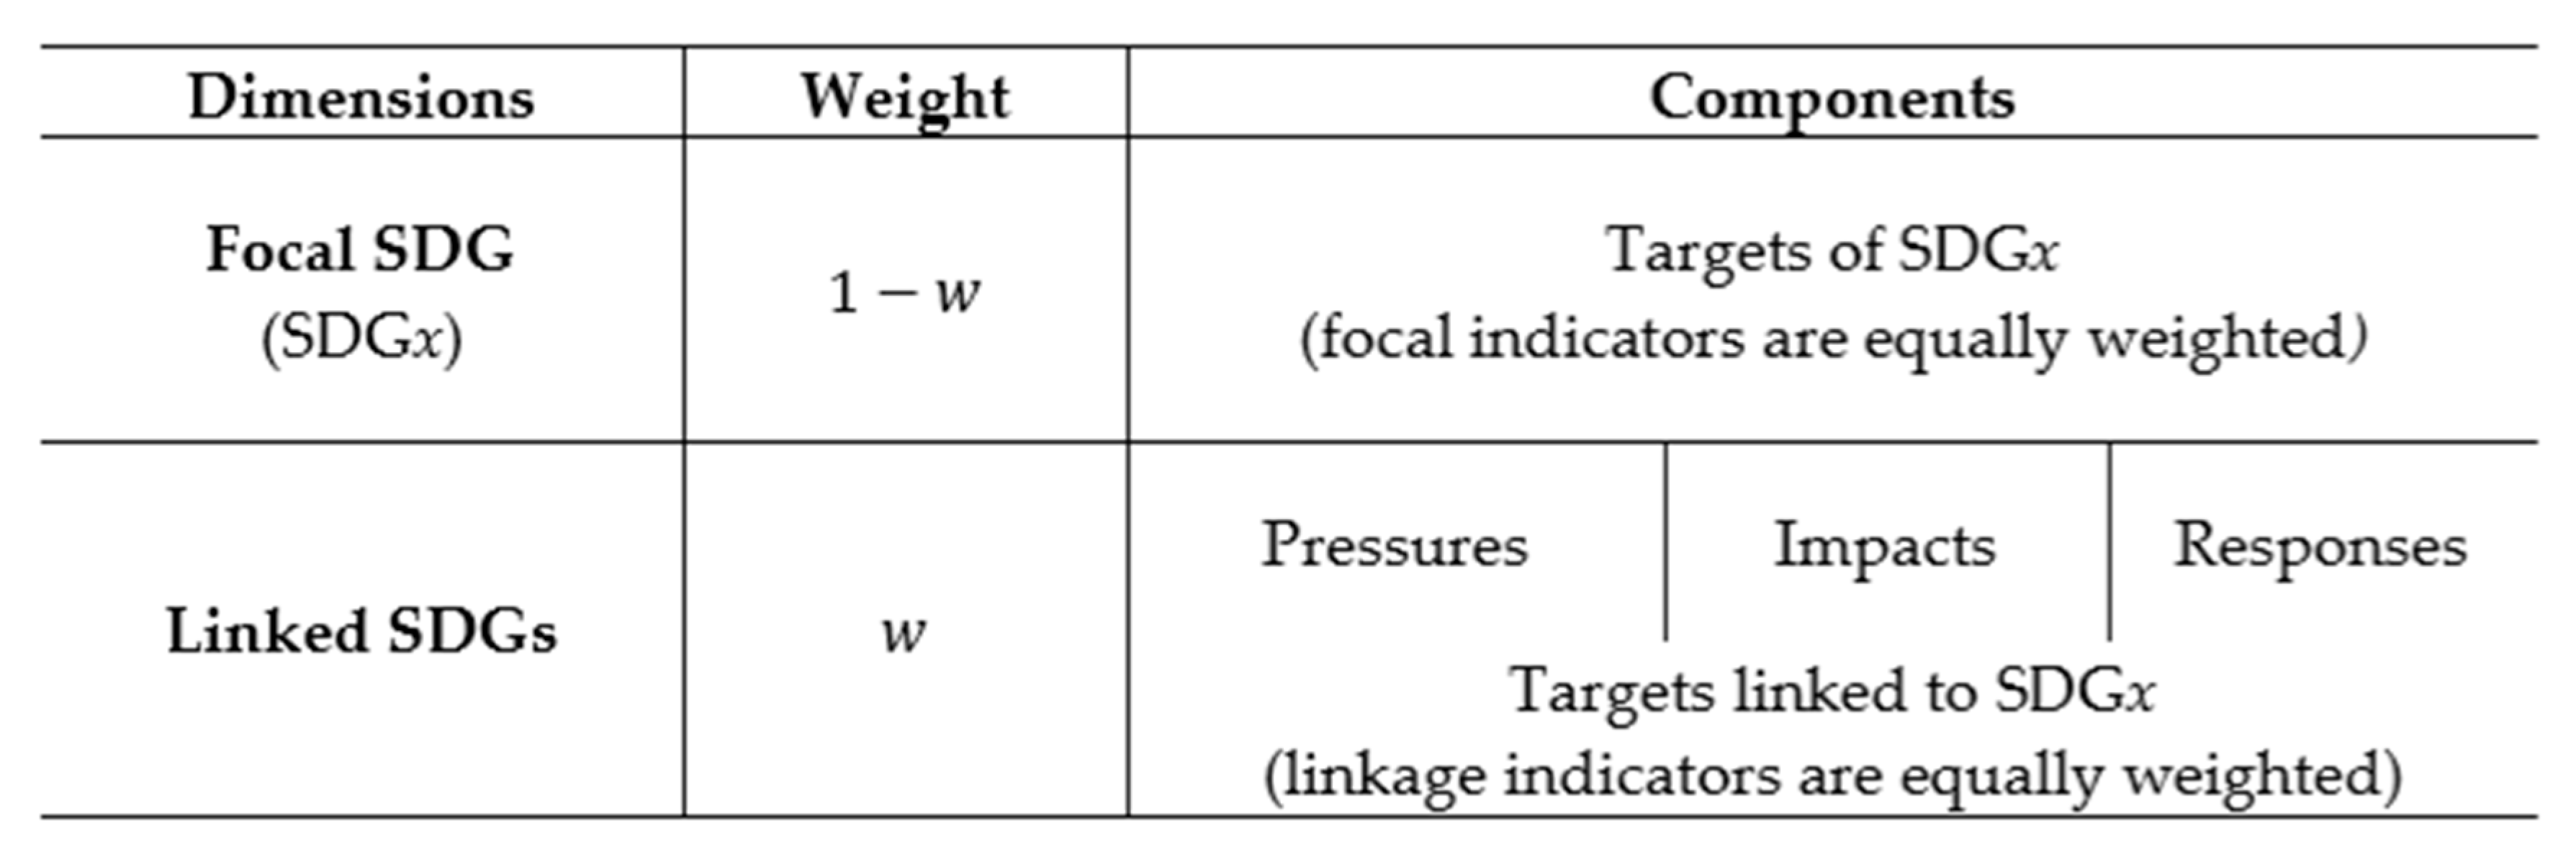
Figure 2.
Radar diagrams of I-SDG14 index components for the top-five performing island states in 2018 (or most recent available).
Figure 2.
Radar diagrams of I-SDG14 index components for the top-five performing island states in 2018 (or most recent available).

Figure 3.
Radar diagrams of I-SDG14 index components for the bottom-five performing island states in 2018 (or most recent available).
Figure 3.
Radar diagrams of I-SDG14 index components for the bottom-five performing island states in 2018 (or most recent available).
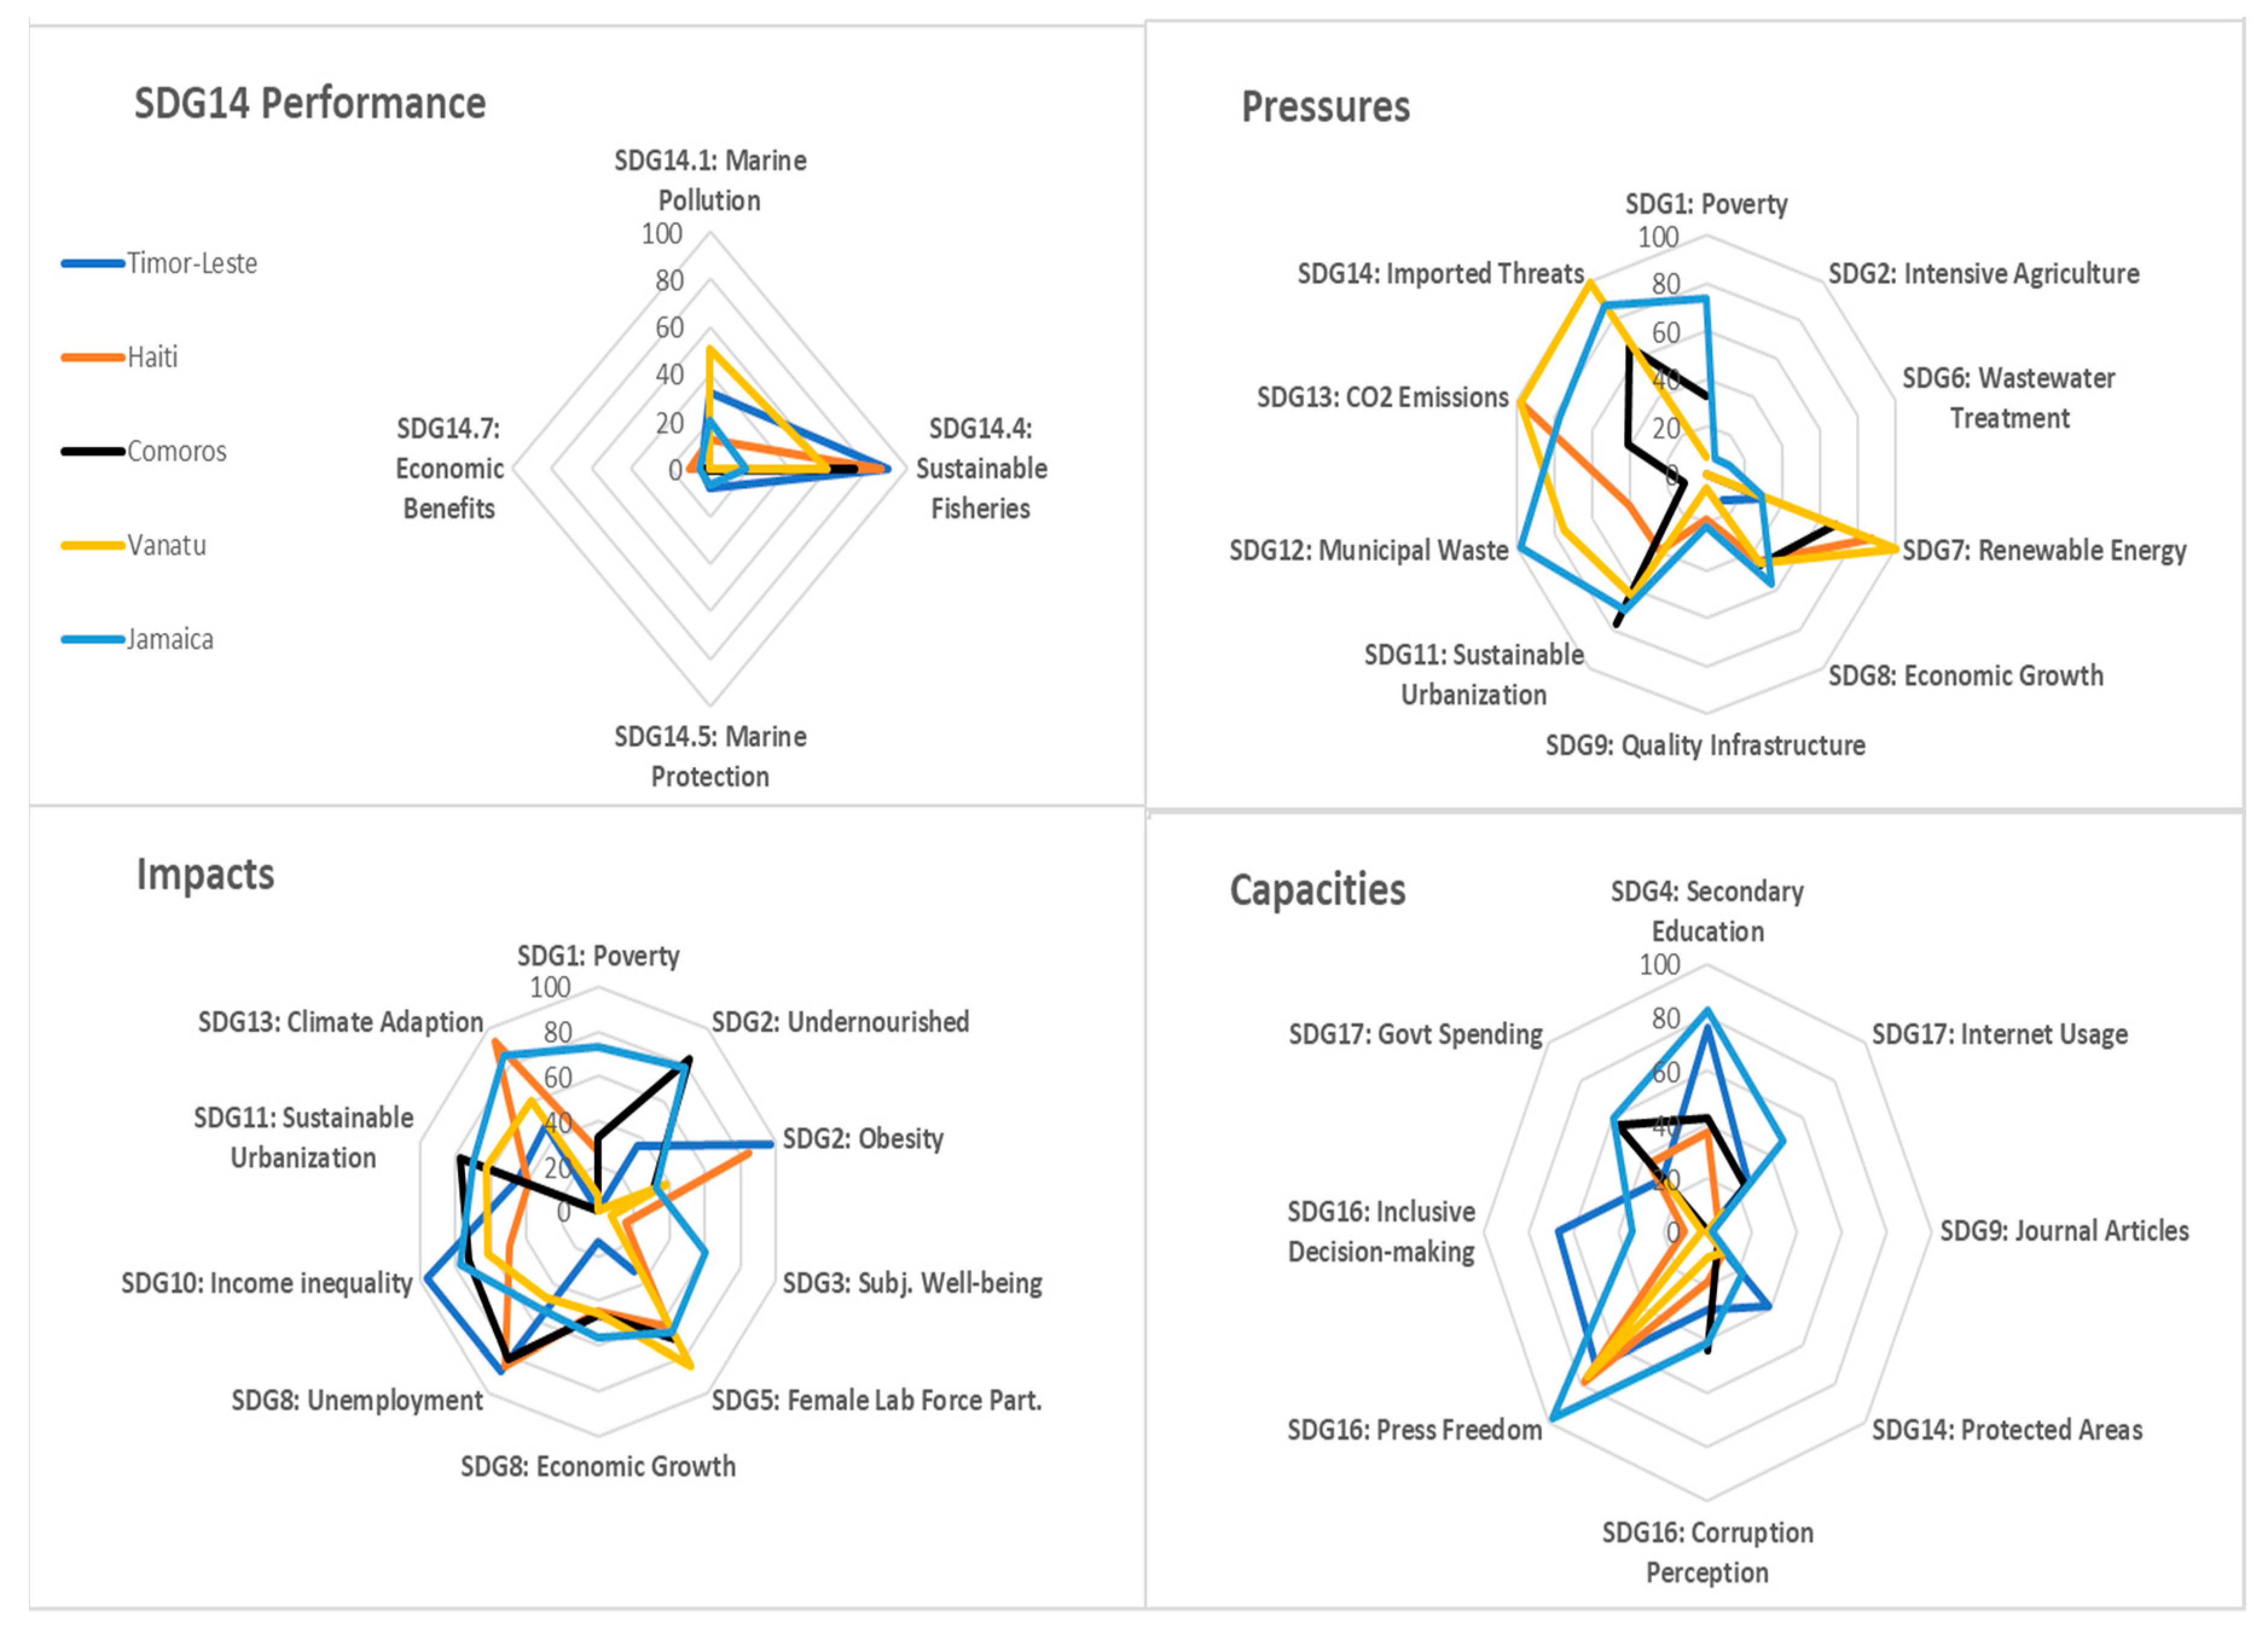
Table 1.
Selected SDG14 Targets.
| SDG Target | Short Description | Official Description * |
|---|---|---|
| 14.1 | Marine Pollution | By 2025, prevent and significantly reduce marine pollution of all kinds in particular from land-based activities, including marine debris and nutrient pollution. |
| 14.4 | Sustainable Fisheries | By 2020, effectively regulate harvesting and end overfishing, illegal, unreported and unregulated fishing and destructive fishing practices and implement science-based management plans, in order to restore fish stocks in the shortest time feasible, at least to levels that can produce maximum sustainable yield as determined by their biological characteristic. |
| 14.5 | Marine Protection | By 2020, conserve at least 10 per cent of coastal and marine areas, consistent with national and international law and based on the best available scientific information. |
| 14.7 | Economic Benefits | By 2030, increase the economic benefits from the sustainable use of marine resources, including through sustainable management of fisheries, aquaculture and tourism. |
* Source: [1].
Table 2.
Influence of selected marine targets on other SDGs.
| Target\SDG | 1 | 2. | 3 | 4 | 5 | 6 | 7 | 8 | 9 | 10 | 11 | 12 | 13 | 15 | 16 | 17 |
|---|---|---|---|---|---|---|---|---|---|---|---|---|---|---|---|---|
| 14.1: Marine Pollution | +/− | + | + | +/− | + | +/− | + | + | ||||||||
| 14.4. Sustainable Fisheries | +/− | +/− | + | + | +/− | + | + | |||||||||
| 14.5: Marine Protection | +/− | +/− | + | + | +/− | +/− | +/− | + | + | + | + | |||||
| 14.7: Economic Benefits | +/− | + | +/− | + | + | + | + |
Source [19]. Influence on SDG16 and 17 is the author’s own assessment.
Table 3.
Influence of other SDGs on selected marine targets.
| Target\SDG | 1 | 2 | 3 | 4 | 5 | 6 | 7 | 8 | 9 | 10 | 11 | 12 | 13 | 15 | 16 | 17 |
|---|---|---|---|---|---|---|---|---|---|---|---|---|---|---|---|---|
| 14.1. Marine Pollution | +/− | − | + | + | + | +/− | +/− | +/− | + | + | + | + | + | |||
| 14.4. Sustainable Fishing | +/− | + | +/− | +/− | + | + | + | + | ||||||||
| 14.5 Marine Protection | +/− | + | +/− | +/− | +/− | +/− | + | + | ||||||||
| 14.7. Economic Benefits | +/− | + | +/− | +/− | + | + | + | + | + |
Source [19]. Influence of SDG16 and 17 is the author’s own assessment.
Table 4.
List of Indicators for I-SDG14.
| Dimensions | Component | Policy Area | SDG/ Target | Indicator | Target Value | Data Source |
|---|---|---|---|---|---|---|
| Focal SDG | SDG14 | Marine | 14.1 | Ocean Health Index: Clean Waters (0–100) | 100 | OHI |
| 14.4 | Fish Stocks Overexploited/Collapsed in EEZ (%) | 0 | FAO/Sea Around Us | |||
| 14.5 | Marine Protected Areas (% of EEZ) | 10 | UNEP | |||
| 14.7 | Fisheries Revenue (US$ p. km2 of EEZ) | 3500 | Sea Around Us | |||
| Linked SDGs | Pressures | Poverty | 1 | Poverty Headcount Ratio at $3.20/day (%) | 0 | World Bank |
| Agriculture | 2 | Sustainable Nitrogen Management Index | 0 | EPI | ||
| Water | 5 | Anthropogenic wastewater that receives treatment (%) | 100 | EPI | ||
| Energy | 7 | Renewable Energy Consumption (as % of Total Energy Consumption) | 51.7 | World Bank | ||
| Economy | 8 | Adjusted Growth Rate (%) | 5 | SDSN | ||
| Infrastructure | 9 | Logistics performance index: Quality of trade and transport-related infrastructure (1 = Low to 5 = High) | 4.25 | UNU-IAS | ||
| Urbanization | 11 | Annual mean concentration of particulate matter of <2.5 microns of diameter (PM2.5) in urban areas (μg/m3) | 6.3 | IHME | ||
| Waste | 12 | Municipal solid waste (kg/day/per capita) | 0.1 | ILO | ||
| Climate | 13 | Energy-related CO2 emissions per capita (tCO2/capita) | 0 | EPI | ||
| Biodiversity | 15 | Imported biodiversity threats (per million population) | 0 | EPI | ||
| Impacts | Poverty | 1 | Poverty Headcount Ratio at $3.20/day (%) | 0 | World Bank | |
| Nutrition | 2 | Prevalence of undernourishment (% pop.) | 0 | WHO | ||
| 2 | Prevalence of obesity BMI ≥ 30 (% of adult population) | 2.8 | WHO | |||
| Health | 3 | Subjective well-being (10 = High to 0 = Low) | 7.6 | Gallup | ||
| Gender | 5 | Female to male labour force participation rate (% female-to-male ratio) | 100 | ILO | ||
| Economy | 8 | Adjusted Growth Rate (%) | 5 | SDSN | ||
| 8 | Unemployment Rate (%) | 0.5 | ILO | |||
| Inequality | 10 | Gini Coefficient for Income (0–100) | 27.5 | SDSN | ||
| Urbanization | 11 | Annual mean concentration of particulate matter of <2.5 microns of diameter (PM2.5) in urban areas (μg/m3) | 6.3 | IHME | ||
| Climate | 13 | People affected by climate-related disasters (per 100,000) | 0 | SDSN | ||
| Biodiversity | 15 | Red List Index of species survival (0 = Worst to 1 = Best) | 1 | IUCN | ||
| Responses | Education | 4 | Lower Secondary Completion Rate (%) | 100 | UNESCO | |
| Science & Technology | 9 | Number of scientific and technical journal articles (per 1000 population) | 2.2 | NSF | ||
| Biodiversity | 15 | Mean area protected in freshwater sites important to biodiversity (%) | 100 | IUCN | ||
| Justice | 16 | Corruption Perception Index (0 = Low to 100 = High) | 88.6 | Transparency Int. | ||
| 16 | Freedom of the Press Index (0 = Best to 100 = Worst) | 10 | Reporters sans frontiers | |||
| 16 | Seats held by women in national parliaments (%) | 50 | IPU | |||
| Partnership | 17 | Government spending on health and education, proportion of GDP (% GDP) | 15 | World Bank | ||
| 17 | Population using the internet (%) | 100 | ITU |
Note, indicators selected from SDSN’s global indicator set [7]. Selection and PIR classification of indicators is by the author.
Table 5.
I-SDG14 Index: Scores and Rankings for Island States (N = 35).
| Country | ABN | SDG14 Score | Rank | Pressure Score | Rank | Impact Score | Rank | Response Score | Rank | I-SDG14 Score | Rank |
|---|---|---|---|---|---|---|---|---|---|---|---|
| Weighting | ½ | 10/58 | 11/58 | 8/58 | 1 | ||||||
| Top five countries | |||||||||||
| United Kingdom | GBR | 81 | 1 | 67 | 3 | 78 | 4 | 80 | 1 | 78 | 1 |
| New Zealand | NZL | 60 | 4 | 62 | 5 | 75 | 6 | 80 | 3 | 66 | 2 |
| Japan | JPN | 60 | 3 | 60 | 7 | 80 | 3 | 68 | 6 | 65 | 3 |
| Ireland | IRL | 56 | 5 | 56 | 14 | 84 | 2 | 76 | 4 | 64 | 4 |
| Iceland | ISL | 42 | 11 | 67 | 2 | 86 | 1 | 80 | 2 | 60 | 5 |
| Bottom five countries | |||||||||||
| Timor-Leste | TLS | 34 | 20 | 31 | 35 | 53 | 29 | 42 | 23 | 38 | 31 |
| Vanuatu | VUT | 27 | 29 | 49 | 23 | 51 | 31 | 25 | 33 | 36 | 32 |
| Haiti | HTI | 27 | 30 | 55 | 15 | 40 | 35 | 22 | 35 | 34 | 33 |
| Jamaica | JAM | 13 | 35 | 53 | 16 | 62 | 17 | 48 | 17 | 34 | 34 |
| Comoros | COM | 20 | 33 | 51 | 20 | 54 | 27 | 28 | 30 | 33 | 35 |
Author’s own calculations. For score v, green = “achieved” (v ≥ 80), yellow = “considerable challenges” (80 > v ≥ 60), orange = “significant challenges” (60 > v ≥ 40), and red “major challenges” (v < 40).
© 2020 by the author. Licensee MDPI, Basel, Switzerland. This article is an open access article distributed under the terms and conditions of the Creative Commons Attribution (CC BY) license (http://creativecommons.org/licenses/by/4.0/).
Share and Cite
MDPI and ACS Style
Horan, D. National Baselines for Integrated Implementation of an Environmental Sustainable Development Goal Assessed in a New Integrated SDG Index. Sustainability 2020, 12, 6955. https://doi.org/10.3390/su12176955
AMA Style
Horan D. National Baselines for Integrated Implementation of an Environmental Sustainable Development Goal Assessed in a New Integrated SDG Index. Sustainability. 2020; 12(17):6955. https://doi.org/10.3390/su12176955
Chicago/Turabian StyleHoran, David. 2020. "National Baselines for Integrated Implementation of an Environmental Sustainable Development Goal Assessed in a New Integrated SDG Index" Sustainability 12, no. 17: 6955. https://doi.org/10.3390/su12176955
Note that from the first issue of 2016, this journal uses article numbers instead of page numbers. See further details here.