Modelling Welfare Transitions to Prioritise Sustainable Development Interventions in Coastal Kenya


Abstract
1. Introduction
2. Methodology
2.1. Study Site and Sampling Frame
2.2. Measuring Welfare and Transitions
2.3. Measuring Determinants of Welfare
3. Results
3.1. Welfare by Household Categories
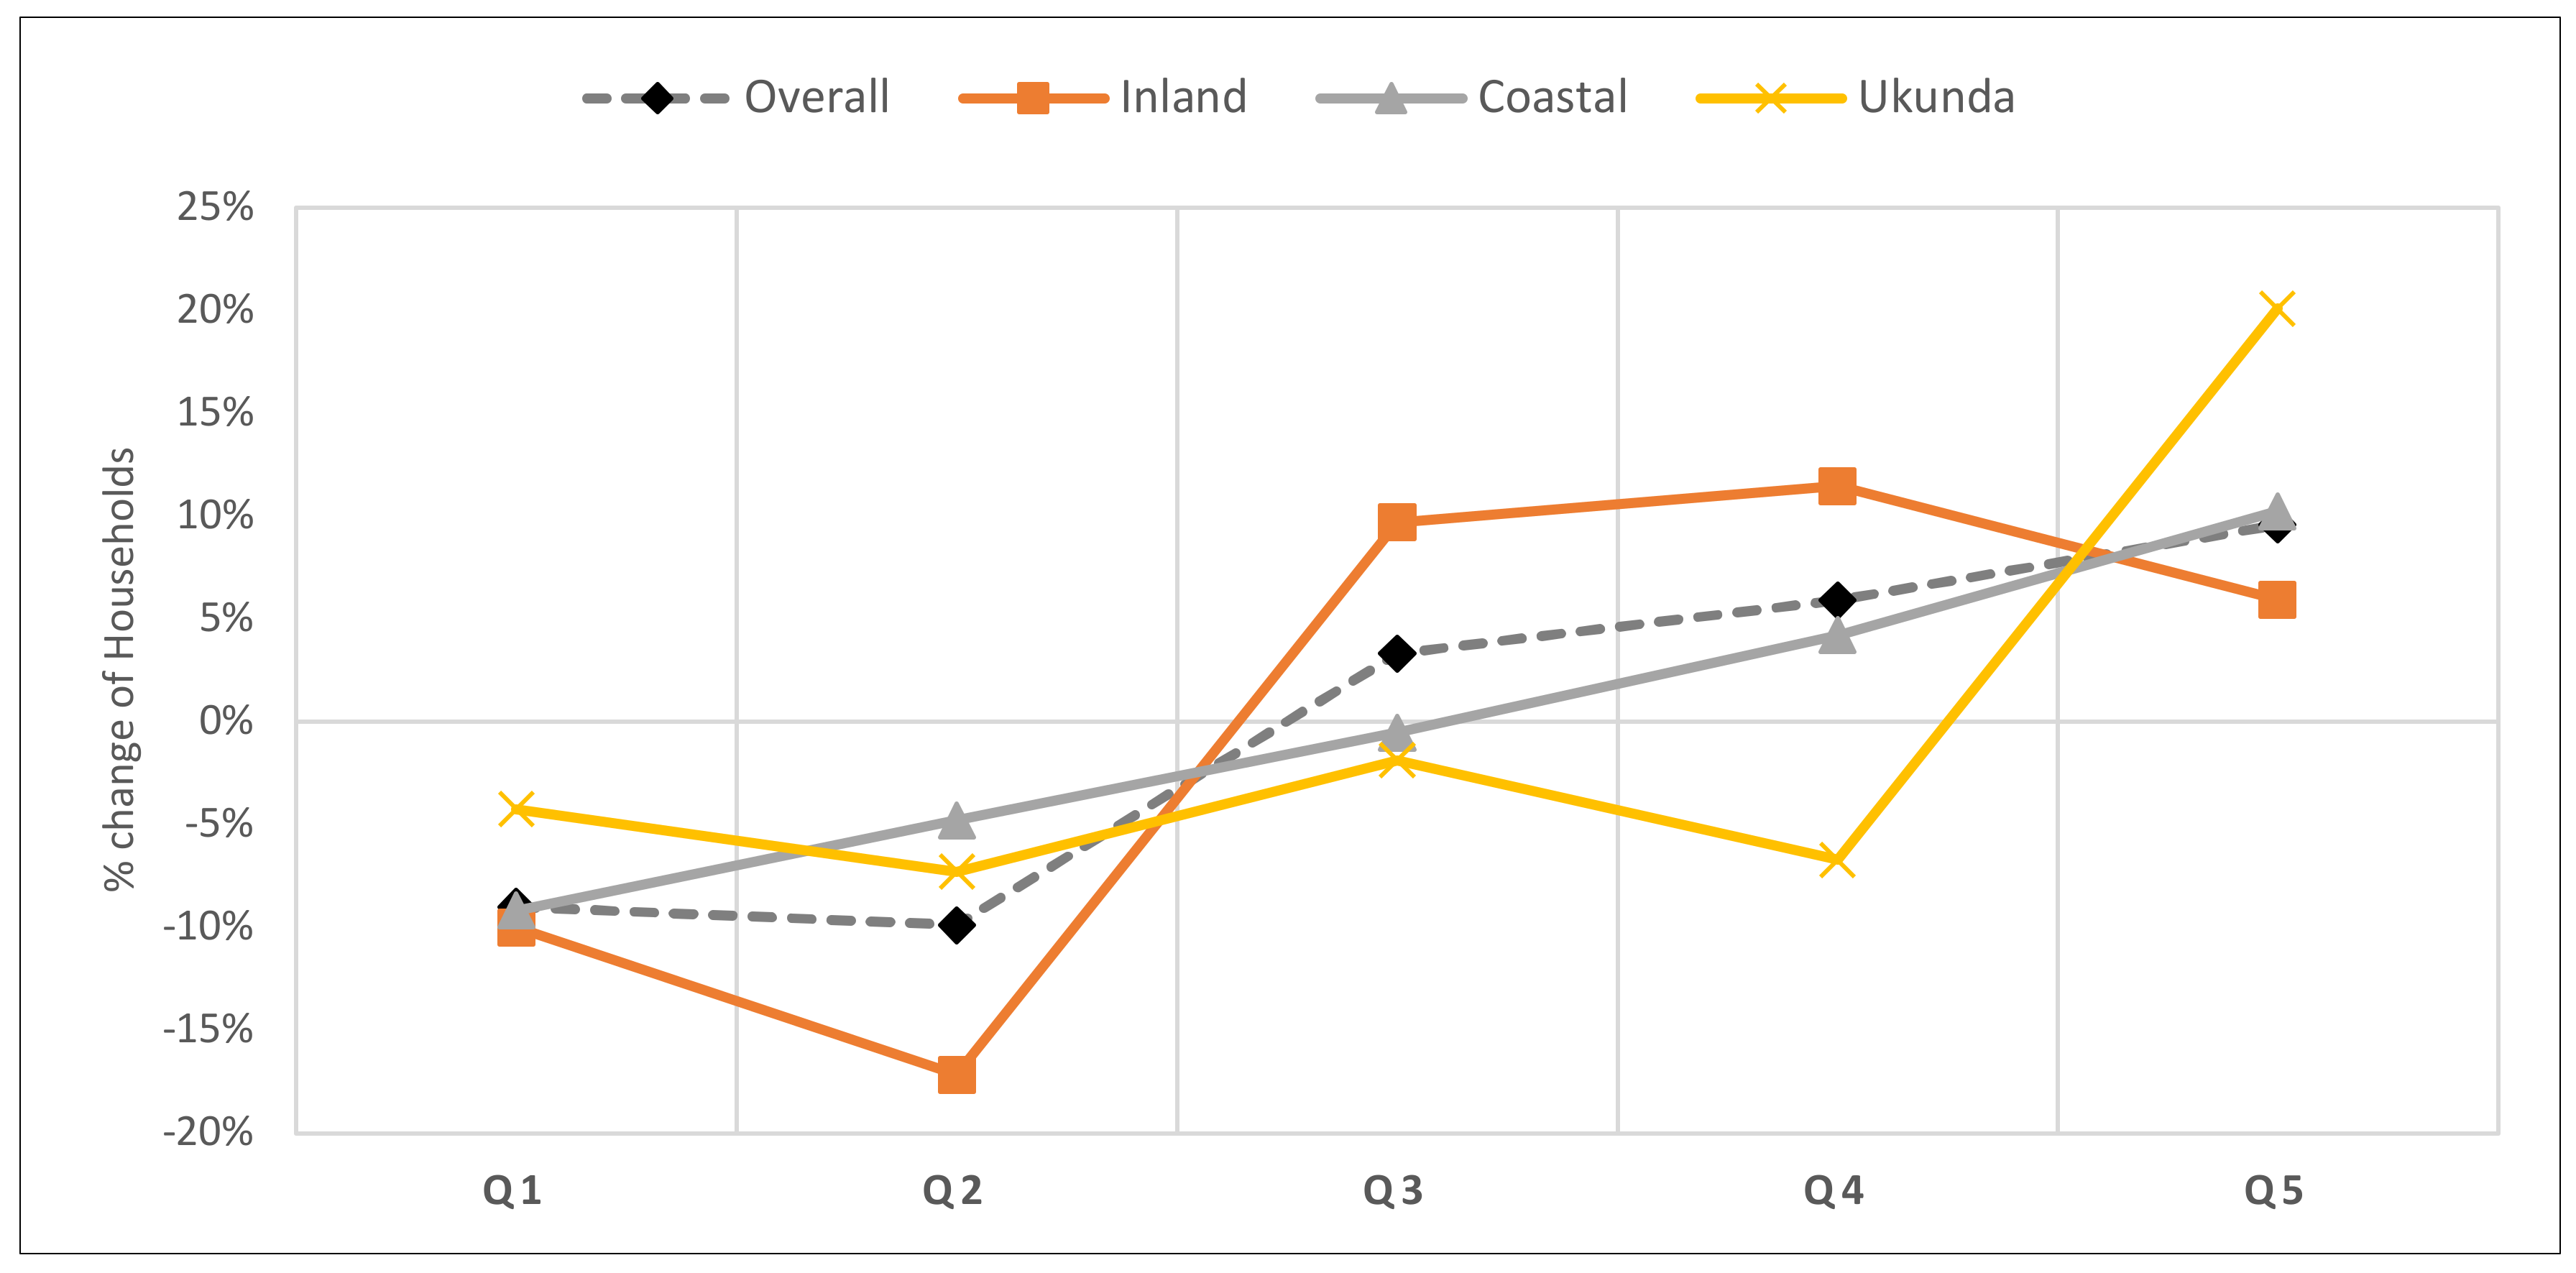
3.2. Welfare Transitions
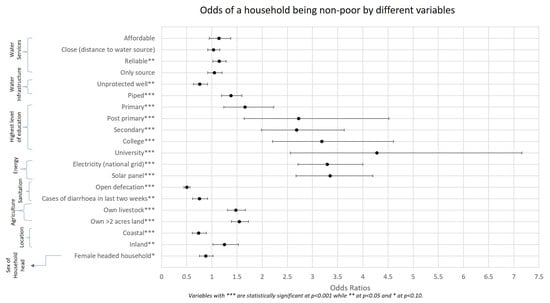
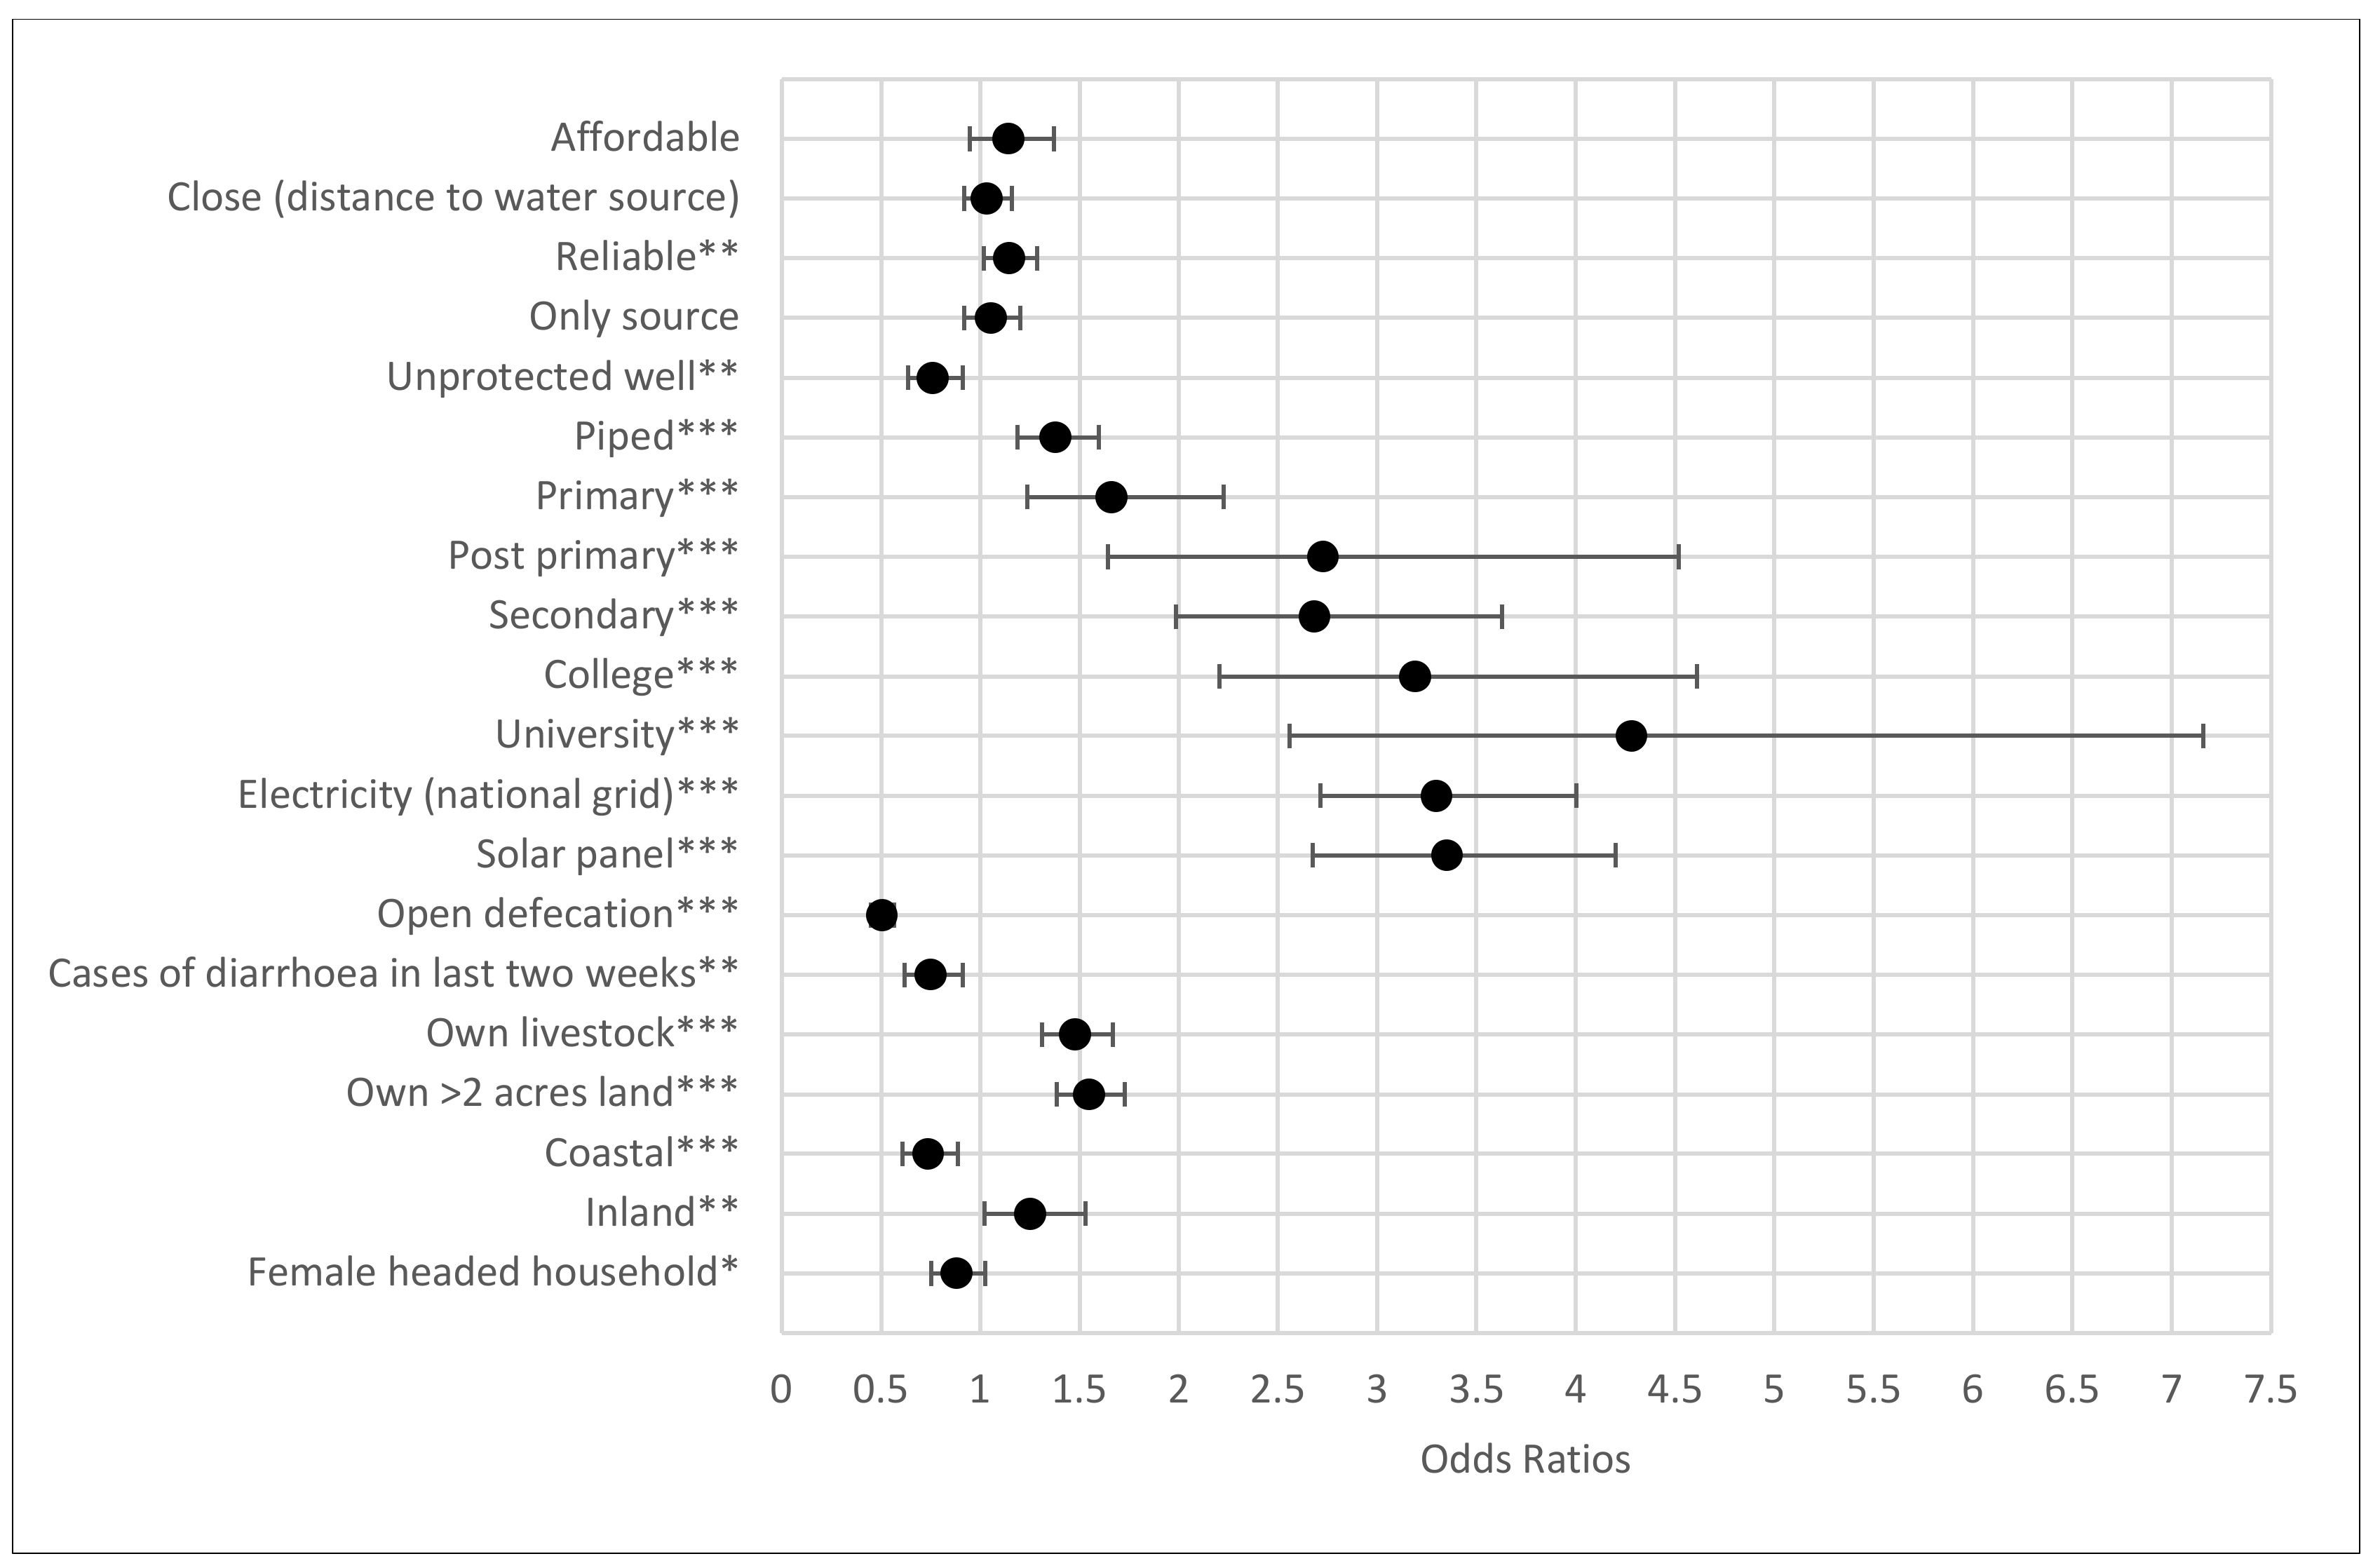
3.3. Random Effects Estimation with Welfare Measures
4. Discussion
5. Conclusions
6. Notes
- First, the surveys were not conducted in the same weather season, and the time intervals between the surveys was not constant. The first survey was conducted late Nov 2013 to Jan 2014, the second survey was conducted in Mar–May 2015 and the third survey conducted in Sep–Nov 2016.
- Second, not all dimensions of poverty in literature were used as explanatory variables, some of the missing variables include employment, age of respondent, broader aspects of health beyond diarrhoea, among others. Some of the omitted variables like household size and income sources were complicated by seasonal migration and the challenge of establishing the size in terms of daily living or broader economic welfare. While we recognize the copious amount of literature supporting employment as a key factor in welfare reduction [76,77,78,79], we did not model it due to the cultural complexities that made it difficult to identify the main wage earner or income source in the household.
- Third, the study does not suggest nor claim any causality between the explanatory variables and the dependent variable.
- Fourth, the welfare index value of 0.4 was used to define the poor and the non-poor. While this value is arbitrary, it is commonly used in literature to understand variation. Sensitivity analysis might present further insights in future works on cut-off indexes for defining the poor and the non-poor though which categorisations will be most suitable will require further thoughts.
Supplementary Materials
Author Contributions
Funding
Conflicts of Interest
References
- Cairncross, S.; O’Neill, D.; McCoy, A.; Sethi, D. Health, Environment and the Burden of Disease; A Guidance Note; Department for International Development: London, UK, 2003. Available online: http://researchonline.lshtm.ac.uk/15497/ (accessed on 17 October 2017).
- Haller, L.; Hutton, G.; Bartram, J. Estimating the costs and health benefits of water and sanitation improvements at global level. J. Water Health 2007, 5, 467–480. [Google Scholar] [CrossRef]
- Macdonald, A.M.; Davies, J. A Brief Review of Groundwater for Rural Water Supply in Sub-Saharan Africa; British Geological Survey-Overseas Geology Series; BGS Technical Report WC/00/33; BGS: Nottingham, UK, 2000. [Google Scholar]
- Willcox, M.; Waters, L.; Wanjiru, H.; Pueyo, A.; Palit, D.; Sharma, K.R. Utilising Electricity Access for Poverty Reduction; Practical Action Consulting and Institute of Development Studies: Rugby, UK, 2015. [Google Scholar]
- African Development Bank Group. African Development Report 2014: Regional Intergration for Inclusive Growth; AfDB Report; African Development Bank Group: Abidjan, Côte d’Ivoire, 2014. [Google Scholar]
- Kende-Robb, C.; Watkins, K.; da Costa, P. Equity in Extractives: Stewarding Africa’s Natural Resources for All; Johnston, A., Ed.; Africa Progress Group: Geneva, Switzerland, 2013. [Google Scholar]
- Reid, W.V.; Mooney, H.A.; Cropper, A.; Capistrano, D.; Carpenter, S.R.; Chopra, K.; Dasgupta, P.; Dietz, T.; Duraiappah, A.K.; Hassan, R.; et al. Ecosystems and Human Well-Being: Synthesis: A Report of the Millennium Ecosystem Assessment; Island Press: Washington, DC, USA, 2005. [Google Scholar]
- Barma, N.H.; Kaiser, K.; Le, T.M.; Vinuela, L. Rents to Riches?: The Political Economy of Natural Resource-Led Development; The World Bank: Washington, DC, USA, 2012; 276p, Available online: https://books.google.com/books?hl=en&lr=&id=HOYZhB3fHgcC&pgis=1 (accessed on 24 March 2019).
- United Nations. Transforming Our World: The 2030 Agenda for Sustainable Development. 2015. Available online: https://sustainabledevelopment.un.org/content/documents/21252030%20Agenda%20for%20Sustainable%20Development%20web.pdf (accessed on 4 October 2017).
- Sembene, D. Poverty, Growth, and Inequality in Sub-Saharan Africa: Did the Walk Match the Talk under the PRSP Approach? Report No.: WP/15/122 Poverty; International Monetary Fund: Washington, DC, USA, 2015. [Google Scholar]
- United Nations. The Millenium Development Goals Report 2015. United Nations, New York. 2015. Available online: http://www.un.org/millenniumgoals/2015_MDG_Report/pdf/MDG2015rev(July1).pdf (accessed on 24 March 2019).
- Beegle, K.; Christiaensen, L.; Dabalen, A.; Gaddis, I. Poverty in a Rising Africa; The World Bank: Washington, DC, USA, 2016. Available online: http://elibrary.worldbank.org/doi/book/10.1596/978-1-4648-0723-7 (accessed on 4 October 2017).
- Alkire, S.; Foster, J. Counting and multidimensional poverty measurement. J. Public Econ. 2011, 95, 476–487. [Google Scholar] [CrossRef]
- Ravallion, M. On multidimensional indices of poverty. J. Econ. Inequal. 2011, 9, 235–248. Available online: http://link.springer.com/10.1007/s10888-011-9173-4 (accessed on 3 December 2014). [CrossRef]
- Davis, B. Choosing a Method for Poverty Mapping; Food and Agriculture Organisation of the United Nations: Quebec City, QC, Canada; Viale delle Terme di Caracalla: Rome, Italy, 2003; 48p, Available online: http://www.fao.org/docrep/005/y4597e/y4597e06.htm (accessed on 24 March 2019).
- Belhadj, B. New weighting scheme for the dimensions in multidimensional poverty indices. Econ. Lett. 2012, 116, 304–307. Available online: http://linkinghub.elsevier.com/retrieve/pii/S0165176512001255 (accessed on 20 November 2014). [CrossRef]
- Ferreira, F.H.G.; Lugo, M.A. Multidimensional Poverty Analysis: Looking for a Middle Ground. In World Bank Research Observer; IZA Policy Paper No. 45; Oxford University Press: Oxford, UK, 2012; Volume 28, Available online: http://hdl.handle.net/10419/91766. (accessed on 20 November 2014).
- Alkire, S.; Foster, J.E.; Seth, S.; Santos, M.E.; Roche, J.M.; Ballon, P. Multidimensional Poverty Measurement and Analysis; Oxford University Press: Oxford, UK, 2015. [Google Scholar]
- Sagar, A.D.; Najam, A. The human development index: A critical review. Ecol Econ. 1998, 25, 249–264. Available online: http://linkinghub.elsevier.com/retrieve/pii/S0921800997001687 (accessed on 20 November 2014). [CrossRef]
- Alkire, S.; Santos, M.E. Acute Multidimensional Poverty: A New Index for Developing Countries. In Proceedings of the German Development Economics Conference, Berlin, Germany, 24–26 June 2011. [Google Scholar]
- Filmer, D.; Pritchett, L.H. Estimating Wealth Effects Without Expenditure Data—Or Tears: An Application to Educational Enrollments in States of India. Demography 2001, 38, 115–132. [Google Scholar] [PubMed]
- Alkire, S.; Santos, M.E. Measuring Acute Poverty in the Developing World: Robustness and Scope of the Multidimensional Poverty Index. World Dev. 2014, 59, 251–274. [Google Scholar] [CrossRef]
- Vyas, S.; Kumaranayake, L. Constructing socio-economic status indices: How to use principal components analysis. Health Policy Plan. 2006, 21, 459–468. [Google Scholar] [CrossRef]
- Radeny, M.; van den Berg, M.; Schipper, R. Rural Poverty Dynamics in Kenya: Structural Declines and Stochastic Escapes. World Dev. 2012, 40, 1577–1593. Available online: http://linkinghub.elsevier.com/retrieve/pii/S0305750X12000976. (accessed on 20 November 2014). [CrossRef]
- Fafchamps, M.; Shilpi, F. Isolation and Subjective Welfare: Evidence from South Asia. Econ. Dev. Cult. Chang. 2009, 57, 641–683. [Google Scholar] [CrossRef]
- Sacks, D.W.; Stevenson, B.; Wolfers, J. The new stylized facts about income and subjective well-being. Emotion 2012, 12, 1181–1187. Available online: http://www.ncbi.nlm.nih.gov/pubmed/23231724 (accessed on 24 March 2019). [CrossRef]
- Diener, E. Subjective well-being. Psychol Bull. 1984, 95, 542–575. [Google Scholar] [CrossRef] [PubMed]
- Beegle, K.; Himelein, K.; Ravallion, M. Frame-of-reference bias in subjective welfare. J. Econ. Behav. Organ. 2012, 81, 556–570. [Google Scholar] [CrossRef]
- OECD. OECD Guidelines on Measuring Subjective Well-Being; OECD Publishing: Paris, France, 2013. [Google Scholar] [CrossRef]
- Helliwell, J.; Layard, R.; Sachs, J. World Happiness Report 2013. United Nations Sustainable Development Solutions Network. 2013. Available online: https://resources.unsdsn.org/world-happiness-report-2013 (accessed on 24 March 2019).
- Edwards, A. Crisis, Chronic, and Churning: An Analysis of Varying Poverty Experiences. Presented at the 2015 Population Association of America Annual Meetings, San Diego, CA, USA, 2 May 2015. [Google Scholar]
- Hulme, D.; Shepherd, A. Conceptualizing chronic poverty. World Dev. 2003, 31, 403–423. [Google Scholar] [CrossRef]
- Mehta, A.K.; Shah, A. Chronic poverty in India: Incidence, causes and policies. World Dev. 2003, 31, 491–511. [Google Scholar] [CrossRef]
- Cagatay, N. Social Development and Poverty Elimination Division: Gender and Poverty; Working Paper Series 5; United Nations Development Programme: New York, NY, USA, 1998; Available online: http://www.pnud.org.ar/content/dam/aplaws/publication/en/publications/poverty-reduction/poverty-website/gender-and-poverty/GenderandPoverty.pdf (accessed on 15 March 2019).
- Bogale, A.; Hagedorn, K.; Korf, B. Determinants of poverty in rural Ethiopia. Q. J. Int. Agric. 2005, 44, 101–120. [Google Scholar]
- Bigsten, A.; Shimeles, A. Poverty Transition and Persistence in Ethiopia: 1994–2004. World Dev. 2008, 36, 1559–1584. [Google Scholar] [CrossRef]
- Dzanku, F.M. Food security in rural sub-Saharan Africa: Exploring the nexus between gender, geography and off-farm employment. World Dev. 2019, 113, 26–43. [Google Scholar] [CrossRef]
- KIPPRA. Kenya Economic Report 2013: Creating an Enabling Environment for Stimulating Investment for Competitive and Sustainable Counties; Kenya Institute for Public Policy Research and Analysis (KIPPRA): Nairobi, Kenya, 2013; Available online: http://www.kippra.org/downloads/KenyaEconomicReport2013.pdf (accessed on 24 March 2019).
- World Bank. Time to Shift Gears: Accelarating growth and Poverty Reduction in the New Kenya, 8th ed.; Kenya Economic Update; World Bank: Nairobi, Kenya, 2013; Available online: http://www.worldbank.org/en/country/kenya/publication/kenya-economic-update (accessed on 24 March 2019).
- KIPPRA. Kenya Economic Report 2017: Sustaining Kenya’s Economic Development by Deepening and Expanding Economic Integration in the Region; KIPPRA: Nairobi, Kenya, 2017. [Google Scholar]
- KNBS. The 2009 Kenya Population and Housing Census—Population Distribution by Age, Sex and Administrative Units; KNBS: Nairobi, Kenya, 2010. Available online: http://www.knbs.or.ke/index.php?option=com_phocadownload&view=category&id=109:population-and-housing-census-2009&Itemid=599 (accessed on 24 March 2019).
- GOK. Kwale District Environmental Assessment Report; Ministry of Environment and Natural Resources: Nairobi, Kenya, 1985.
- KNBS. Kenya Integrated Household Budget Survey (KIHBS) 2005/06; Government of Kenya, Kenya National Bureau of Statistics: Nairobi, Kenya, 2006.
- KNBS. Kenya Integrated Household Budget Survey ( KIHBS ) 2015/16; Government of Kenya, Kenya National Bureau of Statistics: Nairobi, Kenya, 2018.
- Foster, T.; Hope, R. A multi-decadal and social-ecological systems analysis of community waterpoint payment behaviours in rural Kenya. J. Rural. Stud. 2016, 61, 1–31. [Google Scholar] [CrossRef]
- Thomson, P.; Hope, R.; Foster, T. GSM-enabled remote monitoring of rural handpumps: A proof-of-concept study. J. Hydroinform. 2012, 14, 829. [Google Scholar] [CrossRef]
- Thomson, P.; Bradley, D.; Katilu, A.; Katuva, J.; Lanzoni, M.; Koehler, J.; Hope, R. Rainfall and groundwater use in rural Kenya. Sci. Total Environ. 2019, 649, 722–730. [Google Scholar] [CrossRef] [PubMed]
- Foster, T.; Willetts, J.; Lane, M.; Thomson, P.; Katuva, J.; Hope, R. Risk factors associated with rural water supply failure: A 30-year retrospective study of handpumps on the south coast of Kenya. Sci. Total Environ. 2018, 626, 156–164. [Google Scholar] [CrossRef] [PubMed]
- Katuva, J.; Hope, R.; Foster, T.; Koehler, J.; Thomson, P. Groundwater and welfare: A conceptual framework applied to coastal Kenya. Groundw. Sustain. Dev. 2020, 10, 100314. [Google Scholar] [CrossRef]
- Falkingham, J.; Namazie, C. Measuring Health and Poverty: A Review of Approaches to Identifying the Poor. 2002. Available online: http://eprints.soton.ac.uk/35016 (accessed on 20 November 2014).
- Gwatkin, D.R.; Rutstein, S.; Johnson, K.; Suliman, E.; Wagstaff, A.; Amouzou, A. Socio-Economic Differences in Health, Nutrition and Population Within Developing Countries; The World Bank: Washington, DC, USA, 2007; Volume 27, Available online: http://www.ncbi.nlm.nih.gov/pubmed/16387940 (accessed on 24 March 2019).
- KNBS; ICF Macro. Kenya Demographic and Health Survey 2008-09; ICF Macro: Calverton, MD, USA, 2010. [Google Scholar]
- Wooldridge, J.M. Econometric Analysis of Cross Section and Panel Data, 2nd ed.; MIT Press: Cambridge, MA, USA, 2010; Available online: https://jrvargas.files.wordpress.com/2011/01/wooldridge_j-_2002_econometric_analysis_of_cross_section_and_panel_data.pdf (accessed on 14 January 2018).
- Hausman, J.A.; Taylor, W.E. Panel Data and Unobservable Individual Effects. Econometrica 1981, 49, 1377–1398. Available online: http://www.jstor.org/stable/1911406 (accessed on 16 January 2018). [CrossRef]
- Arellano, M.; Bond, S. Some Tests of Specification for Panel Data: Monte Carlo Evidence and an Application to Employment Equations. Rev. Econ. Stud. 1991, 58, 277. Available online: https://academic.oup.com/restud/article-lookup/doi/10.2307/2297968 (accessed on 24 March 2019). [CrossRef]
- Borenstein, M.; Hedges, L.V.; Higgins, J.P.T.; Rothstein, H.R. A basic introduction to fixed-effect and random-effects models for meta-analysis. Res. Synth. Methods 2010, 1, 97–111. [Google Scholar] [CrossRef]
- Borenstein, M.; Hedges, L.V.; Higgins, J.P.T.; Rothstein, H.R. Introduction to Meta-Analysis; John Wiley & Sons, Ltd: Hoboken, NJ, USA, 2009. [Google Scholar]
- Allison, P.D. Fixed Effects Regression Methods for Longitudinal Data Using SAS, 1st ed.; SAS Institute Inc.: Cary, NC, USA, 2005; ISBN 1-59047-568-2. Available online: https://books.google.co.ke/books?id=OIPExEh-tcMC (accessed on 24 March 2019).
- Arellano, M. Panel Data Econometrics; Oxford University Press: Oxford, UK, 2003; Available online: https://econpapers.repec.org/RePEc:oxp:obooks:9780199245291 (accessed on 24 March 2019).
- Conaway, M.R. A Random Effects Model for Binary Data. Int. Biometric Soc. 1990, 46, 317–328. [Google Scholar] [CrossRef]
- Mulinya, L.C.O.J.A. Free Primary Education Policy: Coping Strategies in Public Primary Schools. J. Educ. Pract. 2015, 6, 162–172. [Google Scholar]
- County Government of Kwale. Kwale County Integrated Development Plan (2018–2022). 2018. Available online: https://kecosce.org/kwale-county-integrated-development-plan-2018-2022/ (accessed on 24 November 2019).
- Koehler, J. Exploring policy perceptions and responsibility of devolved decision-making for water service delivery in Kenya’s 47 county governments. Geoforum 2018, 92, 68–80. [Google Scholar] [CrossRef]
- Kikechi, R.W.; Kisebe, C.S.M.; Gitahi, K.; Sindabi, O. The Influence of Free Primary Education on Kenya Certificate of Primary Education Performance in Kenya. Probl. Educ. 21st Century 2012, 39, 71–81. Available online: http://search.ebscohost.com/login.aspx?direct=true&db=ehh&AN=74294230&site=ehost-live (accessed on 24 March 2019).
- KPLC. Kenya Distribution Master Plan. Nairobi, Kenya. 2013. Available online: www.pbworld.co.uk (accessed on 14 March 2019).
- Power Africa. Development of Kenya’s Power Sector 2015—2020. 2015. Available online: https://www.usaid.gov/sites/default/files/documents/1860/Kenya_Power_Sector_report.pdf (accessed on 14 March 2019).
- Hope, R. A Poor Choice? Public Policy, Social Choice and the Right to Water. In The Human Right to Water: Theory, Practice and Prospects; Langford, M., Russell, A., Eds.; Cambridge University Press: Cambridge, MA, USA, 2017; pp. 601–602. [Google Scholar] [CrossRef]
- Koehler, J.; Thomson, P.; Hope, R. Pump-Priming Payments for Sustainable Water Services in Rural Africa. World Dev. 2015, 74, 397–411. Available online: http://linkinghub.elsevier.com/retrieve/pii/S0305750X15001291 (accessed on 24 March 2019). [CrossRef]
- Chowns, E. Is community management an efficient and effective model of public service delivery? Lessons from the rural water supply sector in Malawi. Public Adm. Dev. 2015, 35, 263–276. [Google Scholar] [CrossRef]
- Koehler, J.; Rayner, S.; Katuva, J.; Thomson, P.; Hope, R. A cultural theory of drinking water risks, values and institutional change. Glob. Environ. Chang. 2018, 50. [Google Scholar] [CrossRef]
- Cairncross, S.; Valdmanis, V. Water Supply, Sanitation, and Hygiene Promotion. In Disease Control Priorities in Developing Countries, 2nd ed.; The World Bank: New York, NY, USA; Oxford University Press: Oxford, UK, 2006; pp. 771–792. Available online: http://researchonline.lshtm.ac.uk/12970/DOI (accessed on 14 March 2019).
- Curtis, V.; Cairncross, S. Effect of washing hands with soap on diarrhoea risk in the community: A systematic review. Lancet Infect. Dis. 2003, 3, 275–281. Available online: http://infection.thelancet.com (accessed on 14 March 2019). [CrossRef]
- Hammer, J.; Spears, D. Village sanitation and child health: Effects and external validity in a randomized field experiment in rural India. J. Health Econ. 2016, 48, 135–148. [Google Scholar] [CrossRef] [PubMed]
- Luby, S. Is targeting access to sanitation enough? Lancet Glob. Heal. 2014, 2, e619–e620. [Google Scholar] [CrossRef]
- Rawls, J. A Theory of Justice; Harvard University Press: Cambridge, MA, USA, 1971; Available online: http://www.consiglio.regione.campania.it/cms/CM_PORTALE_CRC/servlet/Docs?dir=docs_biblio&file=BiblioContenuto_3641.pdf (accessed on 14 March 2019).
- Jenkins, R. Globalization, production, employment and poverty: Debates and evidence. J. Int. Dev. 2004, 16, 1–12. [Google Scholar] [CrossRef]
- Ferreira, F.H.G.; Leite, P.G.; Ravallion, M. Poverty reduction without economic growth? J. Dev. Econ. 2010, 93, 20–36. Available online: http://linkinghub.elsevier.com/retrieve/pii/S0304387809000613 (accessed on 21 October 2014). [CrossRef]
- Ravallion, M. Growth, Inequality and Poverty: Looking Beyond Averages. World Dev. 2001, 29, 1803–1815. [Google Scholar] [CrossRef]
- Curnock, E.; Leyland, A.H.; Popham, F. The impact on health of employment and welfare transitions for those receiving out-of-work disability benefits in the UK. Soc. Sci. Med. 2016, 162, 1–10. [Google Scholar] [CrossRef]


| Households with Only Female Adults, n = 526 Mean | Households with at Least One Male Adult, n = 2708 Mean | ||||||
|---|---|---|---|---|---|---|---|
| Variables | Wave 1 | Wave 2 | Wave 3 | Wave 1 | Wave 2 | Wave 3 | |
| Geographical Location * | Coastal | 0.50 | 0.50 | 0.50 | 0.50 | 0.50 | 0.50 |
| Inland | 0.45 | 0.45 | 0.45 | 0.38 | 0.38 | 0.38 | |
| Ukunda | 0.07 | 0.07 | 0.07 | 0.12 | 0.12 | 0.12 | |
| Water Services | Affordable | 0.10 | 0.07 | 0.05 | 0.13 | 0.08 | 0.05 |
| Close (distance to water source) | 0.59 | 0.60 | 0.58 | 0.57 | 0.63 | 0.61 | |
| Reliable | 0.30 | 0.25 | 0.21 | 0.31 | 0.29 | 0.22 | |
| Only source | 0.27 | 0.21 | 0.20 | 0.25 | 0.22 | 0.22 | |
| Water Infrastructure | Handpump | 0.67 | 0.66 | 0.62 | 0.64 | 0.66 | 0.60 |
| Piped | 0.11 | 0.14 | 0.19 | 0.17 | 0.17 | 0.23 | |
| Unprotected well | 0.11 | 0.14 | 0.15 | 0.11 | 0.11 | 0.12 | |
| Highest Education Attained | Primary | 0.61 | 0.68 | 0.61 | 0.53 | 0.49 | 0.50 |
| Post Primary | 0.02 | 0.01 | 0.01 | 0.02 | 0.02 | 0.03 | |
| Secondary | 0.27 | 0.18 | 0.24 | 0.35 | 0.37 | 0.36 | |
| College | 0.03 | 0.03 | 0.04 | 0.06 | 0.08 | 0.06 | |
| University | 0.02 | 0.01 | 0.03 | 0.02 | 0.03 | 0.03 | |
| Energy | Electricity (national grid) | 0.04 | 0.04 | 0.09 | 0.08 | 0.09 | 0.18 |
| Solar panel | 0.02 | 0.04 | 0.12 | 0.05 | 0.08 | 0.13 | |
| Agriculture | Own Livestock | 0.21 | 0.11 | 0.41 | 0.21 | 0.22 | 0.49 |
| Own >2 acres land | 0.44 | 0.44 | 0.65 | 0.43 | 0.49 | 0.63 | |
| Sanitation | Open defection | 0.53 | 0.44 | 0.36 | 0.43 | 0.38 | 0.28 |
| Cases of diarrhoea in last two weeks | 0.10 | 0.10 | 0.07 | 0.08 | 0.10 | 0.06 | |
| Multidimensional Welfare | Poor (bottom 40%) | 0.53 | 0.41 | 0.33 | 0.43 | 0.31 | 0.24 |
| Subjective Well Being | |||||||
| Poor (not well-off) | 0.62 | 0.70 | 0.59 | 0.56 | 0.59 | 0.48 | |
| (a) | ||||||||
|---|---|---|---|---|---|---|---|---|
| Overall | Between | Within | Welfare Transitions | |||||
| multidimensional Welfare | Freq. | Percent | Freq. | Percent | Percent | multidimensional Welfare | Non-poor | Poor |
| Non-poor | 6405 | 66 | 2932 | 91 | 73 | Non-poor | 81% (76%) | 19% (24%) |
| Poor | 3297 | 34 | 1980 | 61 | 56 | Poor | 55% (49%) | 45% (51%) |
| Total | 9702 | 100 | 4912 | 152 | 66 | Total | 71% (63%) | 29% (37%) |
| (b) | ||||||||
| Overall | Between | Within | Subjective Welfare Transitions | |||||
| Subjective Welfare | Freq. | Percent | Freq. | Percent | Percent | Subjective Welfare | Non-poor | Poor |
| Non-poor (Average) | 4238 | 44 | 2356 | 73 | 60 | Non-poor (Average) | 59% (51%) | 41% (49%) |
| Poor (not well-off) | 5455 | 56 | 2714 | 84 | 67 | Poor (not well-off) | 34% (27%) | 66% (73%) |
| Total | 9693 | 100 | 5070 | 157 | 64 | Total | 44% (35%) | 56% (65%) |
| Wave 1 | Wave 2 | Wave 3 | Chronic Poor | Churning Poor | Never Poor |
|---|---|---|---|---|---|
| Poor (not-well-off) | Non-poor (Average) | Non-poor (Average) | 17% (10%) | ||
| Poor (not-well-off) | Non-poor (Average) | Poor (not-well-off) | 7% (7%) | ||
| Poor (not-well-off) | Poor (not-well-off) | Non-poor (Average) | 11% (13%) | ||
| Poor (not-well-off) | Poor (not-well-off) | Poor (not-well-off) | 9% (27%) | ||
| Non-poor (Average) | Non-poor (Average) | Poor (not-well-off) | 5% (6%) | ||
| Non-poor (Average) | Poor (not-well-off) | Non-poor (Average) | 8% (10%) | ||
| Non-poor (Average) | Poor (not-well-off) | Poor (not-well-off) | 4% (10%) | ||
| Non-poor (Average) | Non-poor (Average) | Non-poor (Average) | 39% (16%) | ||
| Total | 9% (27%) | 52% (56%) | 39% (16%) |
| Patterns | Households with Only Female Adults, n = 526 | Households with at Least a Male Adult, n = 2708 | ||||||
|---|---|---|---|---|---|---|---|---|
| Wave 1 | Wave 2 | Wave 3 | Chronic Poor | Churning Poor | Never Poor | Chronic Poor | Churning Poor | Never Poor |
| Poor (not-well-off) | Non-poor (well-off) | Non-poor (well-off) | 18% (12%) | 17% (10%) | ||||
| Poor (not-well-off) | Non-poor (well-off) | Poor (not-well-off) | 8% (10%) | 6% (10%) | ||||
| Poor (not-well-off) | Poor (not-well-off) | Non-poor (well-off) | 13% (5%) | 11% (6%) | ||||
| Poor (not-well-off) | Poor (not-well-off) | Poor (not-well-off) | 14% (10%) | 8% (17%) | ||||
| Non-poor (well-off) | Non-poor (well-off) | Poor (not-well-off) | 4% (12%) | 5% (14%) | ||||
| Non-poor (well-off) | Poor (not-well-off) | Non-poor (well-off) | 7% (5%) | 8% (7%) | ||||
| Non-poor (well-off) | Poor (not-well-off) | Poor (not-well-off) | 6% (8%) | 4% (10%) | ||||
| Non-poor (well-off) | Non-poor (well-off) | Non-poor (well-off) | 29% (37%) | 41% (25%) | ||||
| Total | 14% (10%) | 56% (52%) | 29% (37%) | 8% (17%) | 51% (57%) | 41% (25%) | ||
| Category | Variables | Coef. | Std. Err. | z | [95% Conf. Interval] | |
|---|---|---|---|---|---|---|
| Water Services | Affordable | 0.01164 | 0.00845 | 1.38 | −0.00493 | 0.02820 |
| Close (distance to water source) | 0.03919 *** | 0.00523 | 7.49 | 0.02894 | 0.04943 | |
| Reliable | 0.01671 *** | 0.00525 | 3.18 | 0.00641 | 0.02700 | |
| Only source | 0.00797 | 0.00614 | 1.30 | −0.00407 | 0.02000 | |
| Water Infrastructure | Unprotected well | −0.01357 * | 0.00814 | −1.67 | −0.02953 | 0.00239 |
| Piped | 0.04270 *** | 0.00711 | 6.01 | 0.02877 | 0.05663 | |
| Highest level of education | Primary | 0.03371 ** | 0.01213 | 2.78 | 0.00993 | 0.05749 |
| Post primary | 0.09317 *** | 0.02250 | 4.14 | 0.04906 | 0.13727 | |
| Secondary | 0.10160 *** | 0.01267 | 8.02 | 0.07676 | 0.12643 | |
| College | 0.11875 *** | 0.01598 | 7.43 | 0.08744 | 0.15007 | |
| University | 0.18903 *** | 0.02202 | 8.58 | 0.14587 | 0.23219 | |
| Energy | Electricity (national grid) | 0.16500 *** | 0.00904 | 18.26 | 0.14729 | 0.18271 |
| Solar panel | 0.14386 *** | 0.00969 | 14.84 | 0.12486 | 0.16286 | |
| Sanitation | Open defecation | −0.20281 *** | 0.00550 | −36.84 | −0.21360 | −0.19202 |
| Cases of diarrhoea in last two weeks | −0.02149 ** | 0.00856 | −2.51 | −0.03826 | −0.00471 | |
| Agriculture | Own livestock | 0.02024 *** | 0.00556 | 3.64 | 0.00934 | 0.03113 |
| Own >2 acres land | 0.03576 *** | 0.00508 | 7.04 | 0.02580 | 0.04572 | |
| Geographical Location | Coastal | −0.04179 *** | 0.01010 | −4.14 | −0.06158 | −0.02200 |
| Inland | −0.07028 *** | 0.01075 | −6.54 | −0.09135 | −0.04921 | |
| Sex of Household head | Female-headed household | −0.01341 * | 0.00795 | −1.69 | −0.02900 | 0.00217 |
© 2020 by the authors. Licensee MDPI, Basel, Switzerland. This article is an open access article distributed under the terms and conditions of the Creative Commons Attribution (CC BY) license (http://creativecommons.org/licenses/by/4.0/).
Share and Cite
Katuva, J.; Hope, R.; Foster, T.; Koehler, J.; Thomson, P. Modelling Welfare Transitions to Prioritise Sustainable Development Interventions in Coastal Kenya. Sustainability 2020, 12, 6943. https://doi.org/10.3390/su12176943
Katuva J, Hope R, Foster T, Koehler J, Thomson P. Modelling Welfare Transitions to Prioritise Sustainable Development Interventions in Coastal Kenya. Sustainability. 2020; 12(17):6943. https://doi.org/10.3390/su12176943
Chicago/Turabian StyleKatuva, Jacob, Rob Hope, Tim Foster, Johanna Koehler, and Patrick Thomson. 2020. "Modelling Welfare Transitions to Prioritise Sustainable Development Interventions in Coastal Kenya" Sustainability 12, no. 17: 6943. https://doi.org/10.3390/su12176943
APA StyleKatuva, J., Hope, R., Foster, T., Koehler, J., & Thomson, P. (2020). Modelling Welfare Transitions to Prioritise Sustainable Development Interventions in Coastal Kenya. Sustainability, 12(17), 6943. https://doi.org/10.3390/su12176943