Article

Climate Change: A Bibliometric Study of Adaptation, Mitigation and Resilience

New College, Arizona State University, Phoenix, AZ 85069, USA
*
Author to whom correspondence should be addressed.
Sustainability 2020, 12(17), 6935; https://doi.org/10.3390/su12176935
Submission received: 28 July 2020 / Revised: 19 August 2020 / Accepted: 21 August 2020 / Published: 26 August 2020
(This article belongs to the Section Air, Climate Change and Sustainability)

Abstract

:
The paper uses bibliometric methods to explore the production of knowledge in the field of climate change from 1991–2019. Using the Web of Science database, we demonstrate the growth of publications in the field, including papers in mitigation, adaptation and resilience. Using VOSviewer software, we show the connections between these subfields and the journals in which they are published. The analysis displays clusters of publications in different subfields and minimal convergence of research in STEM fields and the social sciences. We suggest that this lack of convergence may reflect a relative shortage of interdisciplinary research which may in turn have negative outcomes in terms of research and policy.

1. Introduction and Overview

1.1. An Overview of Climate Change

Although climate change has been identified as an existential threat for much of the global population, there is little evidence that changes in public policy, business activity and citizen behavior are yet generating significant positive outcomes. The rates of extreme weather events and resulting impacts, including mortality, indicate increasing threats and record losses of all kinds [1].
A particular challenge to reducing climate change impacts is the range of possible and actual responses that can be identified. These in turn reflect the complex evolution of research and policy. In order to give a brief guide to the terms used in this paper, this section provides a short chronology of the field and its component parts, such as mitigation, adaptation and resilience. At the most fundamental level are mitigation strategies, the most common of which is a reduction in carbon emissions [2]. As is now well known, the pressures to increase energy outputs to match population growth in urban areas have offset efforts to reduce emissions. This has been exacerbated by challenges to climate change orthodoxy from some political leaders and some industries, which are matched by indifference identified in many populations, especially but not exclusively in the Global South, where struggles for prosperity today outweigh concerns for the future [3].
Because of the difficulties that face any concerted effort to change global energy policies, it has been argued that a more pragmatic response is to identify how climate change is impacting the global population and to react accordingly [4]. With greater understanding of these impacts—which will be very location-specific—it will be possible to act proactively and to generate successful adaptive strategies. These will not alter climate change itself but will reduce the vulnerability of communities to different risks and thereby diminish loss of life (of all species) and property (both private and communal) [5].
As we will show, adaptation is also not without critics. It is subject to the same problems inherent in spending public and private funds to offset risks which are probable but not certain, whose consequences may be covered by insurance and/or governments, and which, some suggest, can be left to the ingenuity (and wallets) of future generations [6]. This is especially true of communities whose attitudes to risk are determined by social constructions rather than scientific rationalities; these include societies where religious beliefs are strong and, in contrast, secular societies where social divisions concentrate risk in some communities, whose members are often least able to press for proactive policies. It has been argued that there is a growing indifference to the plight of those most likely to face heightened levels of risk—regardless of its origins—which can be seen in the very different strategies adopted by societies during 2020 as they faced the pandemic and the wildly differing rates of infection and demise for different social groups [7].
One component of these changing social outlooks is a growing emphasis on the concept of resilience, which is manifested in many different contexts. Long associated with studies of ecological regimes, the concept has become visible in fields such as psychology and social work, as professionals seek to identify traits that permit individuals and households to cope with external shocks, from pandemics to disaster management. Resilience is also very visible in the context of climate change, as governments seek to create “resilient communities” which may suffer the consequences of climate change but are able to rebound with minimal assistance [8].

1.2. Adaptation, Mitigation, Resilience

This analysis aims to examine the different ways in which these constructs coexist in academic debate and policy development. Previous research has argued that divergent research approaches and different priorities have constituted a brake on combating climate change, as “the weak integration of scientific fields hinders climate change from being fully addressed as an integral environmental and social problem” (p. 14, [9]). These remarks were based on the situation at the millennium, and here we aim to explore this critique with more recent data.
Clearly there are many ways in which such analysis could proceed. An obvious one would be to try to tabulate the spending that is directed by governments towards mitigation actions, adaptive planning and resilience programs. This would, however, be a virtually impossible task, as many climate change initiatives are undertaken by a multitude of local governments, and not all spending is designated in terms of discrete categories [10].
Another approach would be to use content analysis to look at the discourse that constitutes climate change and climate change policy. Again, however, this would be impossibly complex. While it might be relatively simple to examine published accounts in newspapers and magazines, these have been effectively supplanted by digital technologies, especially social media, and it is challenging to reduce this material to useable content, even with current big data capacity [11].
In this paper, we are consequently addressing a finite and therefore more manageable data set, namely the professional literature which includes factual information on climate change, its impacts and the ways identified to deal with it. Policy documents rarely mention scholarly publications explicitly, but governance is closely connected to this academic discourse, notably through the funding of research [12]. Much of this research will be published, and this contributes to the data used here (see Section 2).

1.3. The Evolution of Climate Change Concepts

This analysis also incorporates the temporal aspect of climate change research. While research in the history of science has pointed out key publications well before the modern era, social and political concern is now driving intense scholarship, although policy is increasingly being filtered through new outlooks, such as austerity and resilience thinking [1].
In a prescient paper published in 1991, Leggett sketched out what he believed was to be humanity’s future, based on a series of climate models, and he called for immediate changes to energy policy to begin a process of mitigation [13]. In the same year, the first paper with an explicit reference to climate change adaptation was published by Meo, in a new journal devoted to climate change [14]. Due to the date of publication for these two journal articles, we use 1991 as the earliest year in the analysis that follows. We note that other bibliometric studies also identify this as a pivot point [15,16].
In the abstract of his paper, Leggett makes a single mention of ‘‘climate change adaptation’’. He stated that “as a result of the perceived costs of emission-limitation policies, collective risk analysis is erring on the side of potential adaptation rather than emission limitation” [13]. This construction of a dualism between mitigation on the one hand—that is, the attempted creation of a post-carbon economy—and adaptive policymaking on the other—in contexts such as preparing for systemic droughts or coastal flooding—has remained in place over the subsequent decades. Yet at exactly the same time that Leggett was writing, Al Gore had already dismissed adaptation as a “kind of laziness, an arrogant faith in our ability to react in time to save our skins” [17].
In subsequent years Leggett’s claims for a preference for adaption have proved illusory, perhaps understood with reference to Gore’s characterization of adaption as a form of last-minute response—a reactive stance—rather than the structured creation of policies and plans—a proactive strategy. In short then, while there has been an increasing volume of papers which discuss mitigation strategies (at international forums, in national assemblies, and even in local communities), there has been less attention paid to adaptive planning until recently [1,18].
In 2007, Pielke and colleagues argued that it was no longer possible to ignore adaptation based upon a misguided ethical reading inherited from Gore and others [4]. This position has been recast and broadened as a neo-colonial issue, subsequent to the Delhi Declaration of 2002, whose signatories argued that pressing needs for resources in poor nations demand interventions to deal with real events, such as rising sea levels. This only slightly pre-dated the Katrina disaster, in which thousands of residents of New Orleans (NOLA) were displaced, injured and in some cases killed because of poor adaptive planning and disaster preparation [19]. Although NOLA was part of an affluent society, the storm’s impacts were clearly concentrated in neighborhoods of poverty [20].
The Katrina disaster was a pivotal occurrence and continues to reverberate in many contexts. A search on Web of Science (the database which we will discuss in detail below) shows that approximately 5000 records, the majority of them journal articles, have been published about the hurricane since it hit NOLA in 2005. Yet it was hardly a unique event. For example, a prolonged heatwave swept across Europe in 2003, and in the policy context, the Hyogo protocol focused attention on a range of global disasters [21,22].
These events also coincide with the appearance of an additional term within the climate change thesaurus, notably resilience. Underscored by the intense economic rollbacks that began after 2008, it was apparent that Katrina and concurrent events showed that (1) Natural events have the capacity to inflict serious damage on communities, even if climate change were illusory; (2) Large damage bills and death tolls were a probable part of a more turbulent future; (3) Costly engineering solutions could not be provided in an era of economic depression and austerity and (4) Communities would have to shoulder much more of the burden of preparing for disasters and reconstituting themselves afterwards: they would be expected to become more resilient. As we will see, academic discussion of resilience accelerated dramatically after 2005 [23].

2. Methods

2.1. The Web of Science Database

This paper now moves to demonstrate the emergence of, and the relations between these terms—mitigation, adaptation, resilience—in the academic literature related to climate change. We use 1991 as out starting point, as already discussed, and conclude with material published in 2019, as publications were continually being added during data collection and included “in press” publications dated 2021 and even 2022.
We employed the Web of Science database (WoS), which is acknowledged to be a robust resource in this context [24]. It excludes technical reports and publications in journals whose standards do not meet specific criteria, primarily relating to peer review. WoS is a curated database with holdings in several languages, although its content is primarily in English. It aggregates publications into a number of indexes, notably Science, Social Science, Arts and Humanities and a new category of content in emerging journals which, in a field such as this, will tend towards specialized focus or broad interdisciplinarity [25]. In order to display the relative amounts of published material available for analysis in this context, Table 1 shows the results from a search in WoS (search term = climate change). It should be noted that a single publication can be assigned to more than one of these indexes but we have examined this overlap and do not see evidence of systematic bias in this research. This is discussed again in the Appendix A.
The coverage within WoS reflects the distribution of authorship around the globe. In the context of climate change, the national origins of those publishing in the field show a concentration in Europe, followed by North America and China (see Table 2).
An advantage of WoS is that it aligns well with the software VOSviewer, used to visualize the bibliographic networks and which accepts WoS, Scopus, Dimensions and PubMed files [26]. Neither PubMed nor Dimensions offers comprehensive citation analysis. WoS was chosen over the Scopus database because it provides citation analyses such as “highly cited papers”, which can be compared between searches. Highly cited papers have been identified as an analytical resource within the scientometric literature [27]. Such publications are in the top one percent in each of the different subject areas identified within WoS and are based on 10 years of publications, in this instance 2010–2019.
For our collection of data, we searched titles, abstracts and keywords, outlined in Table 1 and Table 3, in the WoS core collection. This collection includes Science Citation Index Expanded (1900–present), Social Sciences Citation Index (1956–present), Arts & Humanities Citation Index (1975–present), and Emerging Sources Citation Index (2015–present). In WoS, an “all database” search option was available, which added SciELO Citation Index, Russian Science Citation Index and KCI-Korean Journal Database. However, a simple test search of “climate change adaptation” with these databases showed publications published before 1991, typically on adaptation in a biological context only, outside the focus of this study.
As Table 1 shows, there has been a large number of publications linked to the various aspects of climate change. Many of these papers come from a wide range of disciplines, especially in the case of resilience. In STEM publications, papers with narrow biological and ecological meanings may be only tangentially connected to a broader discussion of climate change. In order to minimize the heterogeneity of our search results, we observed slightly different protocols, and details of these can be found in the Appendix A.
When downloading the files, they were saved as tab-delimited txt files with full records and citation content for use in the VOSviewer visualization software and trendline creation in Excel. Some terms have the same meaning but different spellings. Examples include variations of climate change such as climate changing, climate-change and changing climate or words such as floods, flood and flooding. To combine terms with the same meaning in our datasets, a standardized thesaurus was created using Excel. The list of terms combined can be found in the Appendix A.

2.2. VOSviewer

In our study, we used the software tool VOSviewer to analyze and visualize our datasets. VOSviewer builds and visualizes bibliographic networks and is commonly used in bibliographic analyses of fields such as sustainability [28]. Items such as terms, keywords, authors, research journals, countries or researchers can be employed to form bibliographic networks. Networks are formed from an input of bibliographic database files (i.e., WoS, Scopus, Dimensions and PubMed) or reference manager files (i.e., RIS, EndNote and RefWorks files) [29]. To compare items within these networks, VOSviewer can complete citation, bibliographic coupling, co-citation, co-occurrence or co-authorship links. Each of our maps included only one type of item and most focused on keywords found within the title, abstract or text of our dataset of publications from WoS; in situations where the algorithm found too few keywords, a full text option was employed.
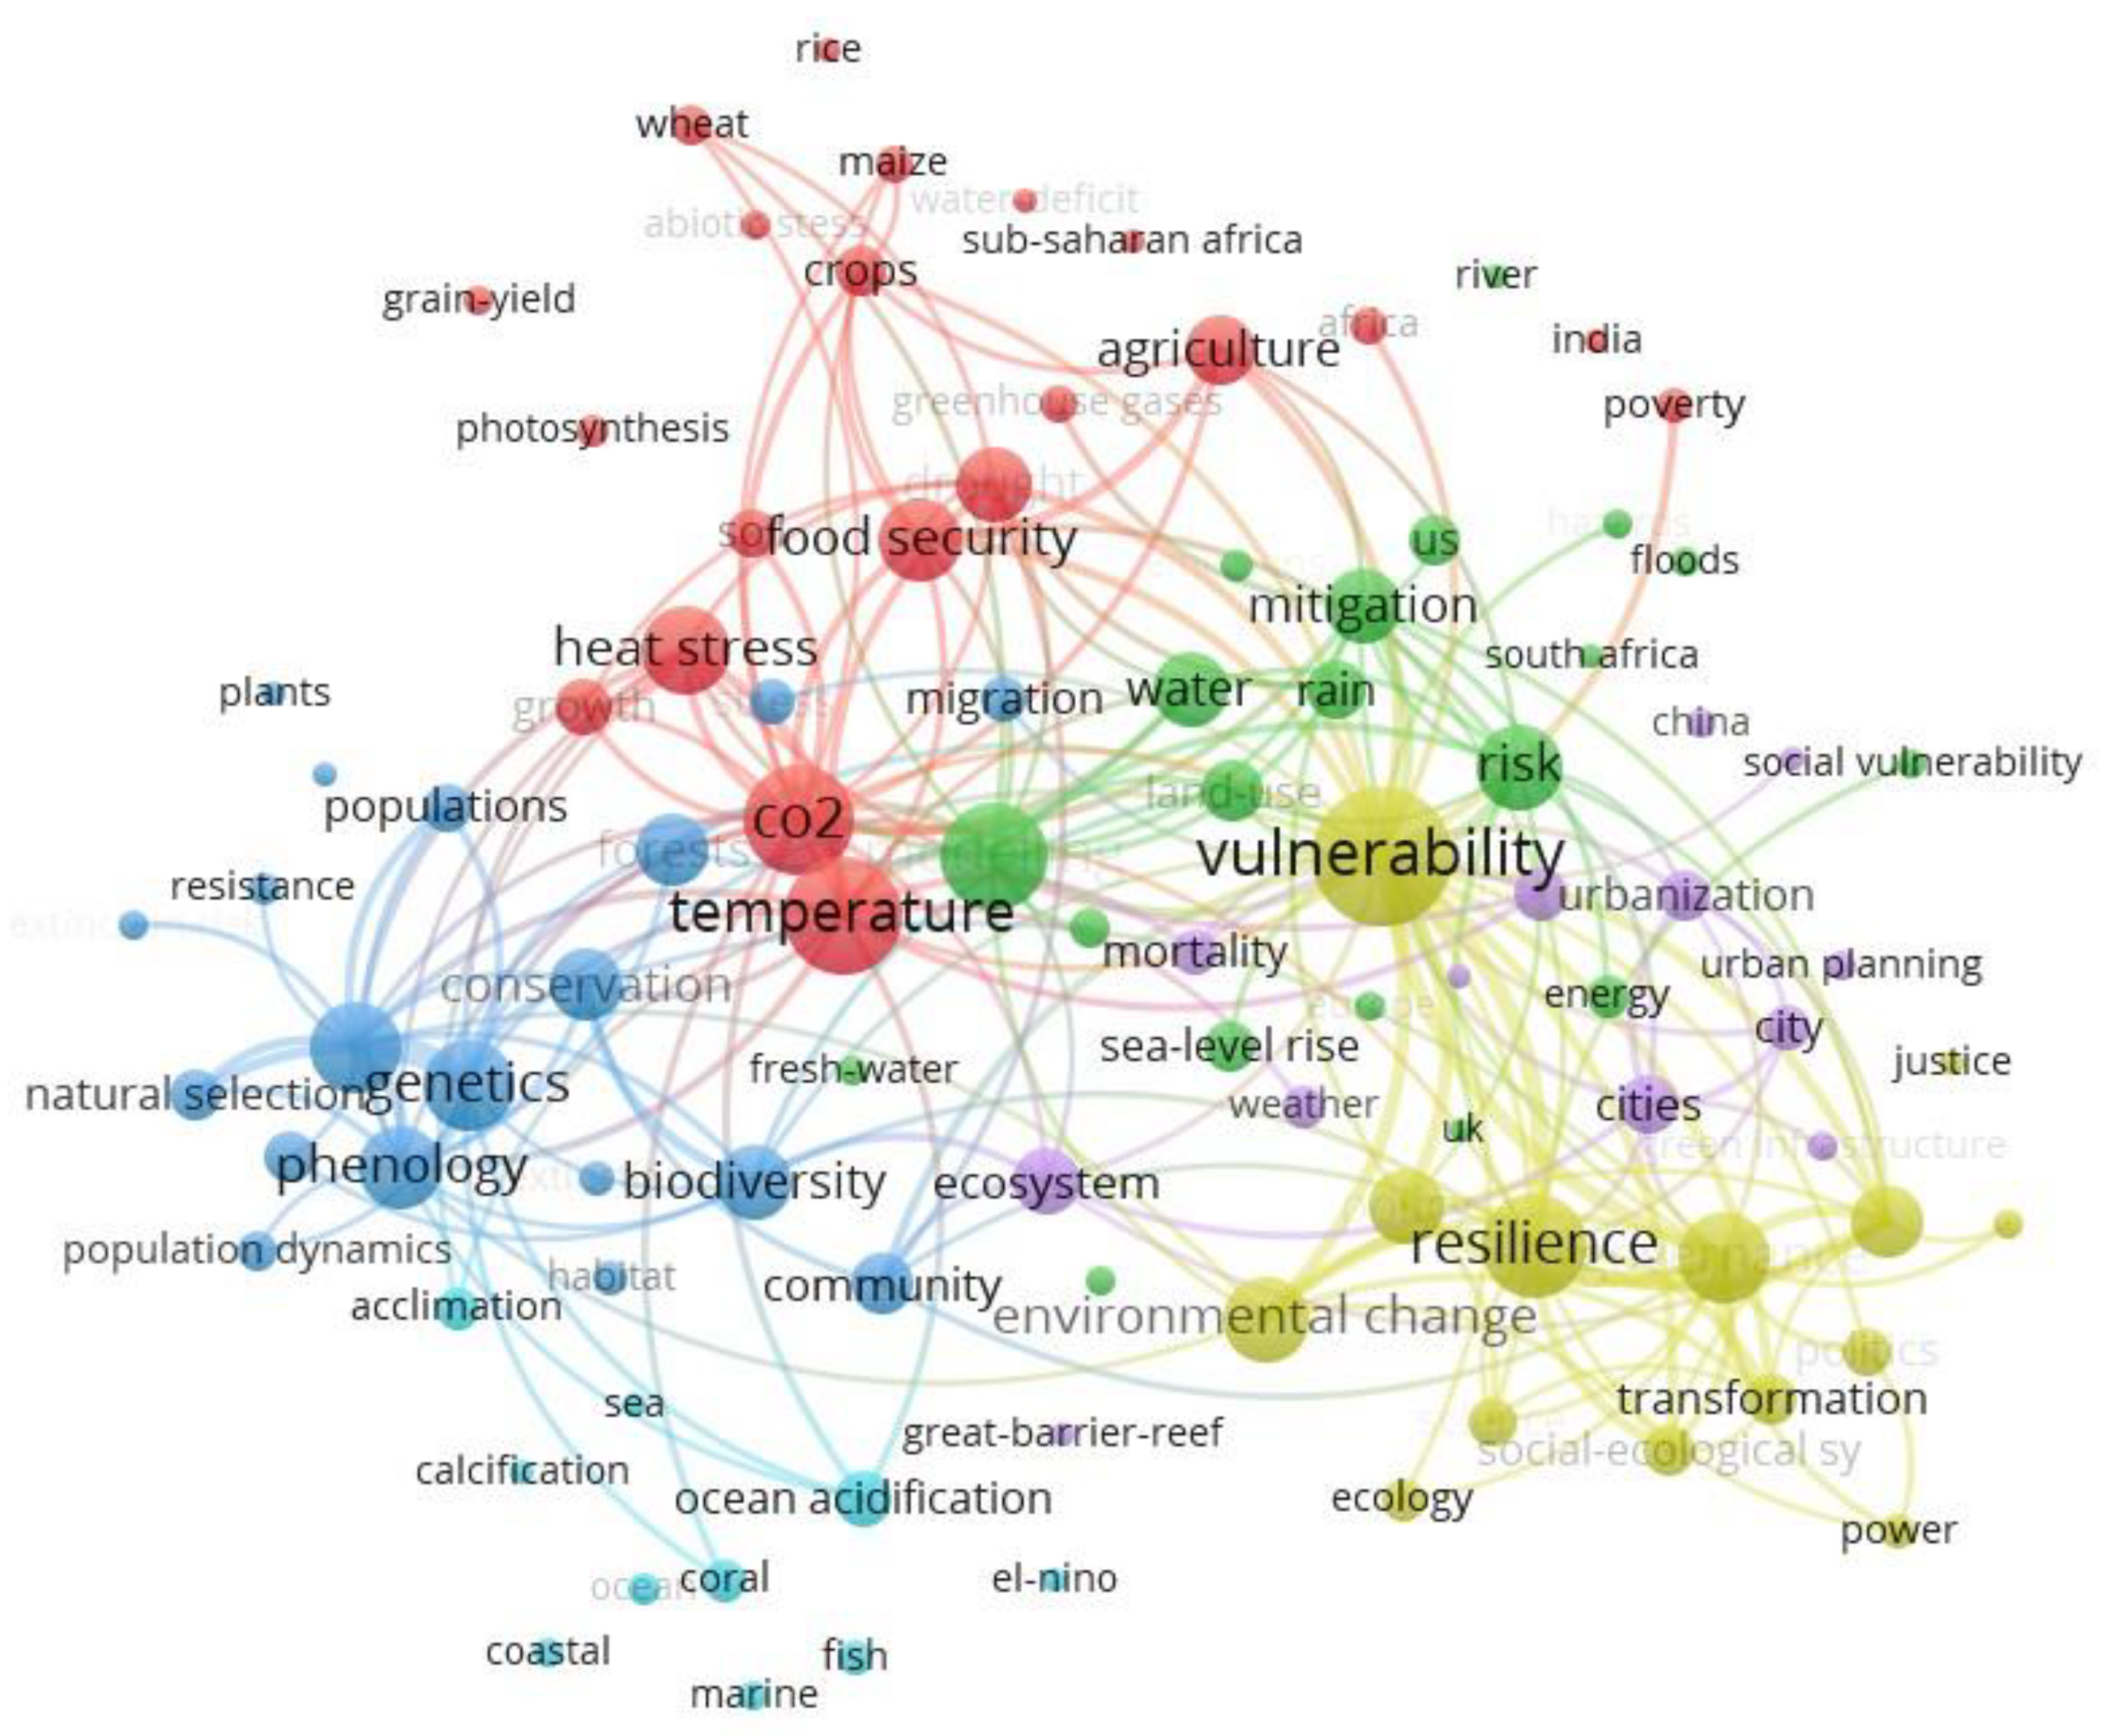
We used the co-occurrence analysis, which creates links between terms. On the maps shown below, lines connect different terms. Link strength indicates the number of publications in which two terms occur together and thicker lines represent a stronger link. A weighted link score—the “link attribute score”—can indicate the number of co-occurrences for links of a given term with other terms. VOSviewer determines that items are closely related when the software calculates association strengths between items that are similar, where association strength “is a proportion of total co-occurrences between items to the expected total co-occurrences between those items, assuming they are statistically independent” [29]. Once items are mapped, those that are closer together are taken to be strongly related compared to items that are far apart. From these visualizations, keywords found in different clusters were used to label and interpret the dataset.
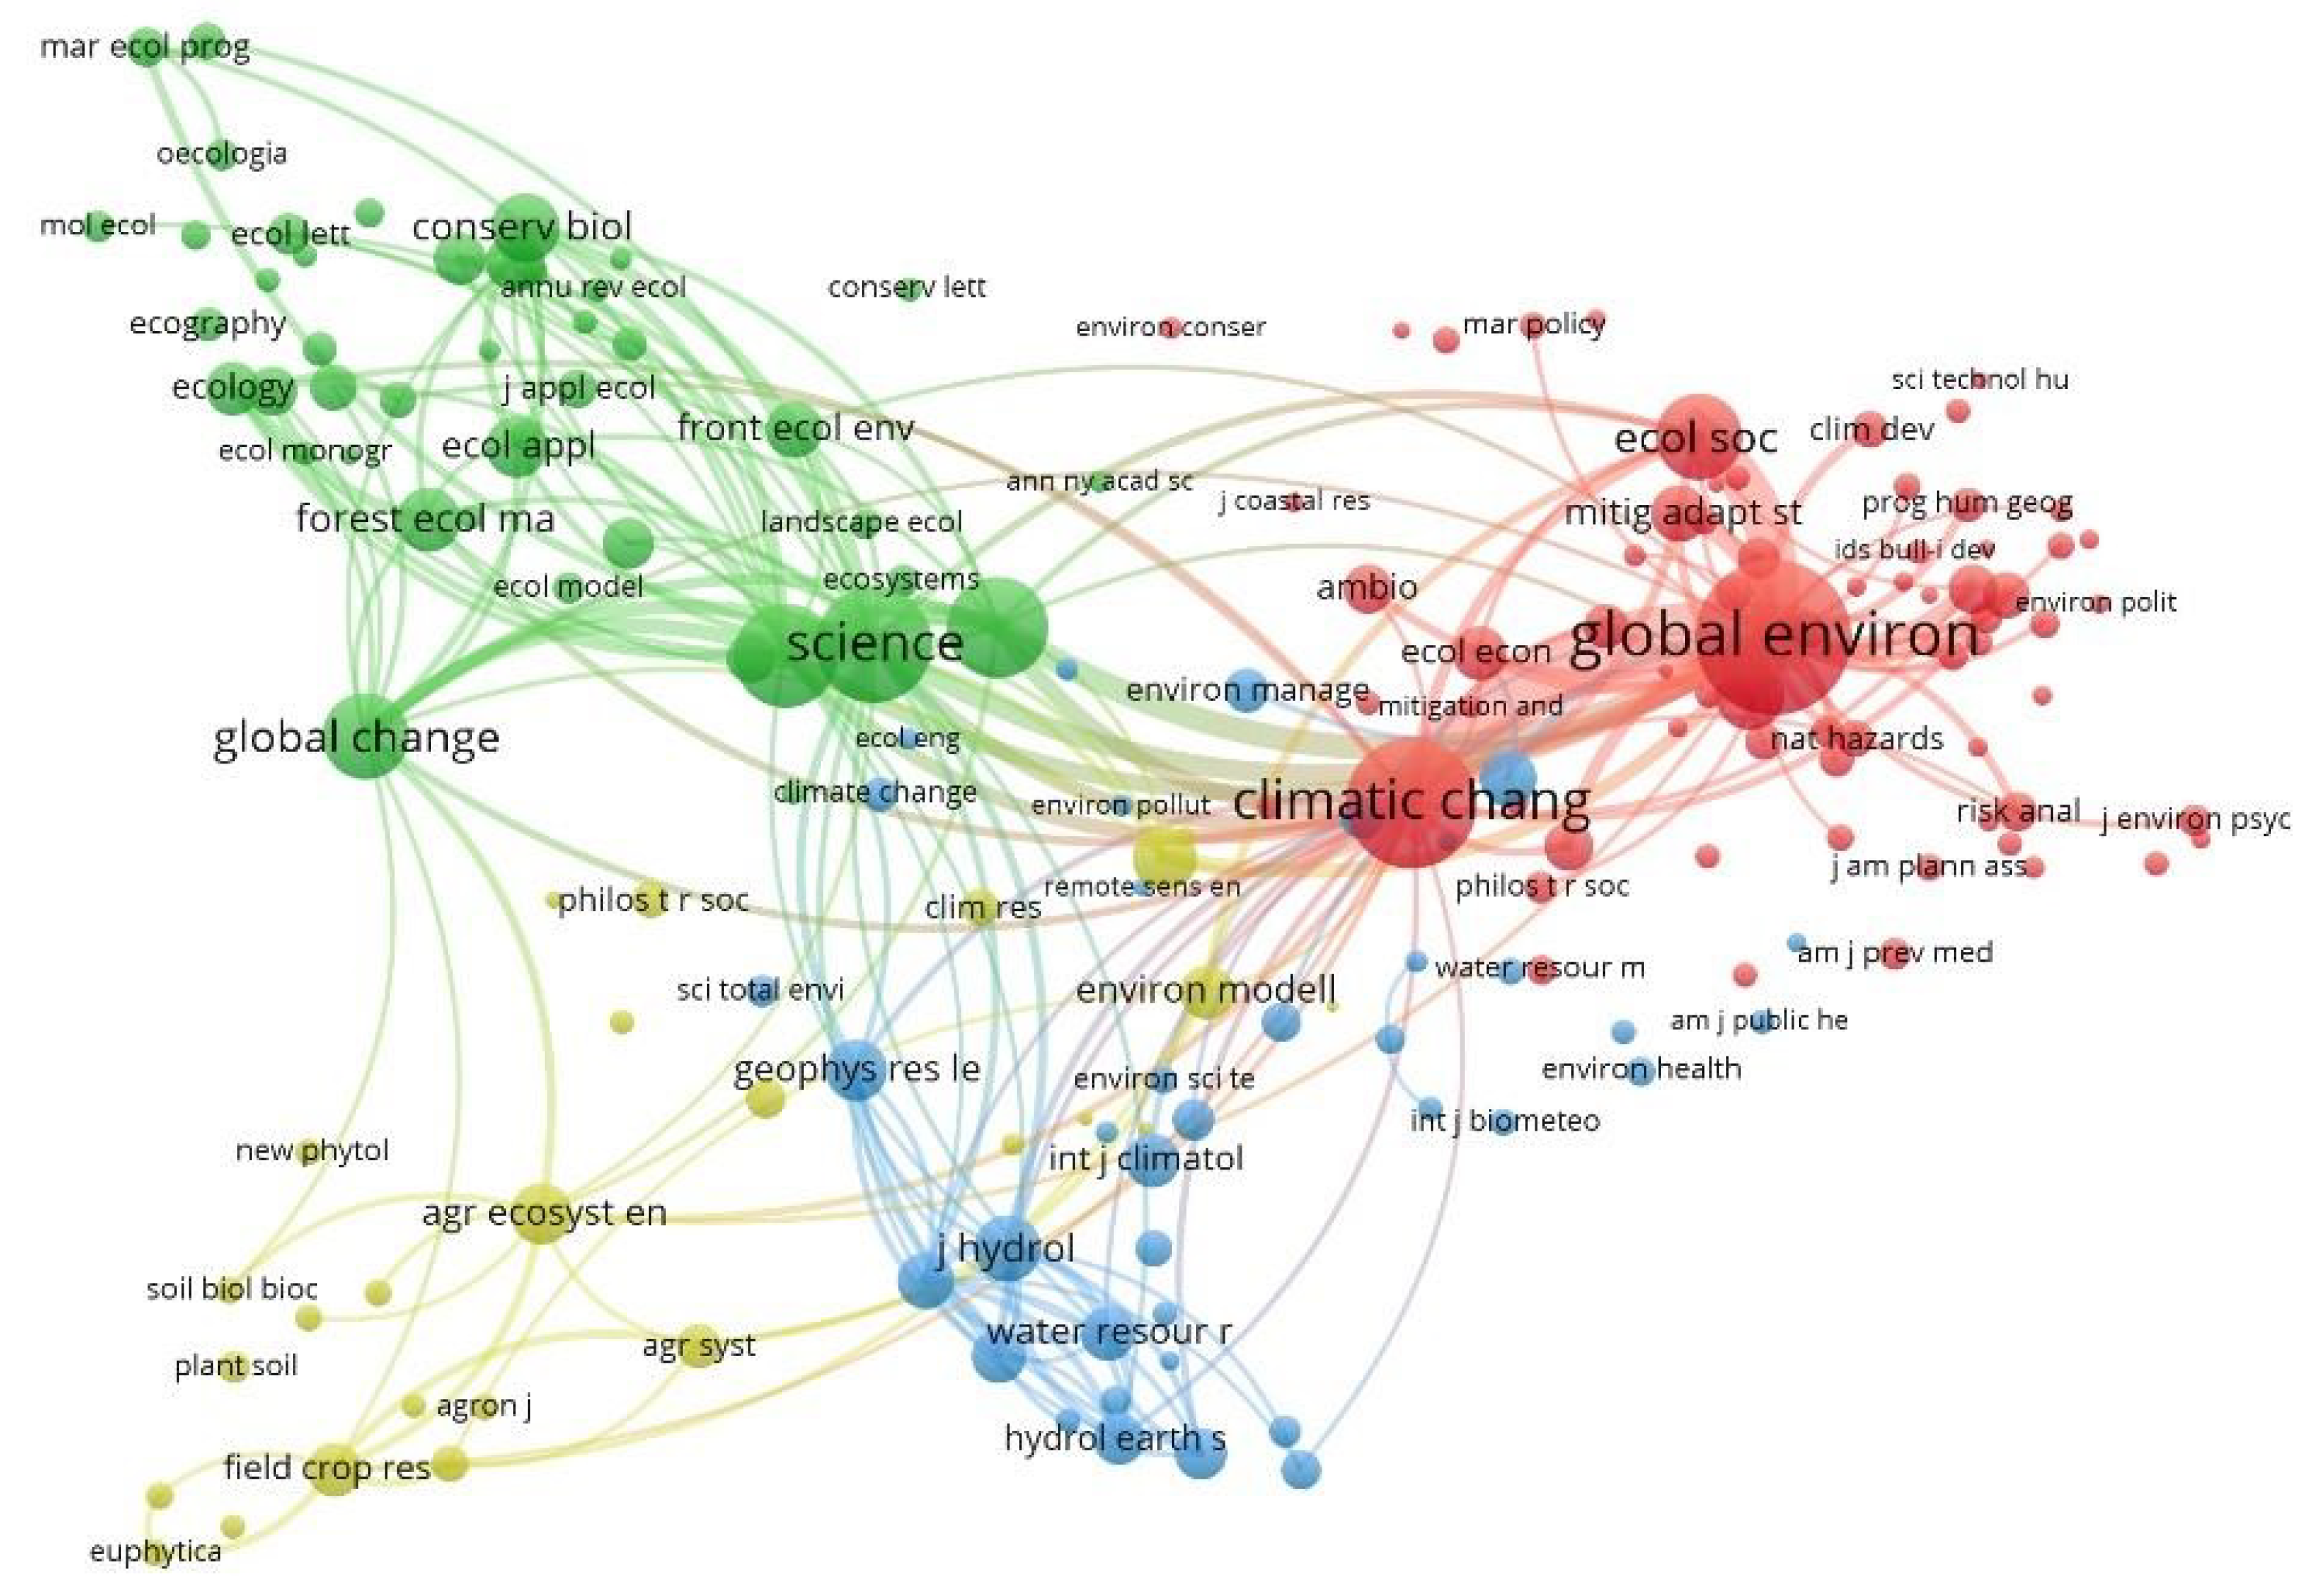
This analysis was also used to visualize the co-citations between different journals. Lines in this analysis represent when papers from one journal have cited papers in a different journal. Journals that appear prominently have larger numbers of citations in relation to other journals. The co-citation network of journals shows the disciplinary landscape of science and social science and identifies the production of knowledge and public policy as they relate to climate change.

3. Results

3.1. The Trends

We began by examining the growth of climate change publications from our initial starting point of 1991. Figure 1 shows the growth of publication related to the different elements of climate research between 1991–2019. The data were collected from the WoS as discussed above using the broadest search results (Table 3). To maintain consistency, the graph shows the proportion of total publications in each category, year by year, and these are directly comparable even though total numbers of publications differ greatly. This is especially true of the results of a search of the topic “the”, which is designed to pick up virtually every title published and which is included as a simple proxy measure of the total output of scholarly publication across the time period. This is baseline growth, which can be attributed to general factors such as digital publication, new journals and the emergence of the Chinese academic sector, which together have driven annual output from 200,000 to over 900,000 papers [30].
The graph shows how “climate change” has increased steadily in importance across the three decades and that the rate of publication increase exceeds the baseline trend. The three specific topics “mitigation”, “adaptation” and “resilience” are also shown. All three demonstrate similar growth in publications until approximately 2010. In subsequent years, publication rates for the three topics have diverged slightly; publications dealing with adaptation are accelerating compared to mitigation, albeit slightly, while resilience is showing a steeper curve. The number of papers dealing with resilience is increasing significantly in almost all academic fields, and its appearance in climate change reflects that trend.
In order to compare the trends, we generated the following regression equations (Table 4). We interpret the starting values of the equations as follows: (1) the starting values of publications regarding ‘‘mitigation’’ “adaptation” and “resilience” are all close to zero and indicate that little research regarding those topics was published during 1991 compared to the body of research published in later years and (2) climate change had a starting value of 0.2747 percent, indicating that there was a small body of climate change research published during 1991 compared to later years. We then interpreted the rate of growth of publications from 1991–2019 as follows: (1) the smallest rate of growth, came from our baseline search, indicating that research regarding climate change has received exponentially greater emphasis as it approached the present; (2) Climate change resilience has had the greatest amount of growth over the 1991–2019 period and (3) the output of research on climate change is steadier than the three subfields, which display steeper growth curves.

3.2. VOSviewer Output: Climate Change

In this section, we demonstrate the bibliometric relations among publications in the field of climate change, employing VOSviewer software [29]. As we have already discussed, the existence of titles, keywords and lists of cited references in virtually all published papers constitutes a rich data set which allows us to explore different relationships, such as those between papers published in different fields, between co-authors and between journals serving different disciplines.
Our first presentation is an overview of climate change itself (Figure 2). Due to the very large number of papers published in the field, we have focused on “highly cited papers” related to the topic “climate change” from 1991 to 2019, as recognized by WoS [27]. In this first analysis, the software produces five differently colored clusters for the co-occurrences between terms. Note that in this display, and subsequently, we have ignored the search term itself (in this case, “climate change”), as it must always be the most frequent term and must always therefore dominate the map of co-occurrences. We have interpreted the clusters by assessing the keywords most closely associated with each of the five clusters, and especially the largest nodes, as size reflects frequency of appearance [26], see Table 5.
We interpret this display of 3689 highly cited papers within the climate change literature over the past three decades as having four distinct components. One (in blue) highlights the natural cycle of rainfall and runoff, which is subject to change by a rapidly changing climate. A second (green) links climate change to species health. A third cluster (yellow) is one we have labeled “CO2 fixation” and is connected to a small but active research area focused on heat stress and the process of CO2 fixation in genetically modified crops [31]. The fourth and largest (red) cluster is defined by risk and vulnerability, adaptation and mitigation, and sustainability and management, and includes cities, governance and science. Although adaptation is a keyword of importance in ecological and agricultural contexts (see Table 6), it is also prevalent in the context of urban and regional planning (see for example Figure 3), and its appearance in this cluster reflects that usage.

3.3. Mitigation

Figure 3 shows the co-occurrences using a data set of 513 “highly cited papers” from WoS on the topic “mitigation”, refined by reference to “climate”. VOSviewer identifies four clusters which we interpret as follows.
These five clusters are closely linked in terms of carbon, CO2 and greenhouse gases. The red cluster is very clearly focused on urban land use and bundles keywords such as society, sustainability and governance, although drought and forests also appear here amidst different examples of climate change impacts. Publications on adaptation also cluster here, often related to land-use planning [4].

3.4. Adaptation

In Figure 3, we saw adaptation bundled into an urban cluster; here, we extend the analysis to focus explicitly on highly cited papers in WoS focused on the topic “climate change adaptation” (Figure 4, Table 7). VOSviewer identifies 6 clusters among the publications. We can see location-specific research fields, ranging from food security in Africa to vulnerability in cities and from coral health to biodiversity.

3.5. Resilience

In this section, we look specifically at the “resilience” concept in the context of highly cited papers in WoS which also contain the keyword “climate”. In contrast to Figure 4, this mapping is more tightly displayed (Figure 5, Table 8). The green cluster is very closely connecting adaptation, sustainability and governance, while yellow links agricultural topics. The blue cluster brings together drought, forests and fire, while in red are clustered habitat, species, CO2 and heat stress.

3.6. Summary

Two things are evident in the material presented above. The first is that we can identify a repetitive structure of co-occurrence within the different topics that were searched within Web of Science (climate change, adaptation, mitigation and resilience). Within each topic, we have identified and labeled clusters with some basic similarities—for example, scientific publications relating to carbon emissions; applied science relating to ecosystem health and agriculture; and social science publications that deal with governance and policy. These clusters are consistent with the structure of the academy, where key research activities are focused on the life sciences, atmospheric science and engineering, which often are not connected to the social sciences. The small number of publications from the Arts and Humanities are mostly historical and are not connected to these topics.
If there were greater urgency given to climate change funding—and especially to integration via interdisciplinary and even transdisciplinary teams—then we might also expect more evidence of research clusters overlapping and closer patterns of co-citation. We have attempted to explore this assertion in more detail, although even trying to define interdisciplinarity is “fraught with difficulty” [32] (p. 70). WoS for example offers the analyst the opportunity to identify publications in a number of journal-based classifications such as “multidisciplinary sciences” or “interdisciplinary social sciences” [33]. However, the extent to which these are capturing strong integration across fields as opposed to the erosion of barriers between similar disciplines remains open [25]. Such was the interpretation made a decade ago in a similar study, and little may have changed [9]. Our analysis of publications in “climate change” shows that they are overwhelmingly classified as disciplinary rather than multidisciplinary or interdisciplinary in our study period, although more research is needed here (see Appendix A Table A2 for these results).
Our second inference is that there is also some similarity on display between the different fields of mitigation, adaptation and resilience. As we have shown in Figure 3, Figure 4 and Figure 5, there are publication clusters with similar keyword foci. Within the topic “mitigation”. these can be interpreted in relation to energy, deforestation and agriculture, with a cluster devoted to adaptation and governance. In the topic “adaptation”, we see two large clusters, one identifiable as biodiversity and one that we have labeled as relating to agriculture. Once more, a third cluster appears that is strongly represented by the social sciences, and here we see keywords such as “sustainability” and “stakeholder”. We have also examined “resilience” and noted that this is a topic of increasing research interest throughout the academy. Once again, similarities emerge: there are clusters linked to the basic science of oceans and forests, one linked to food security and another defined more explicitly by social science publications featuring keywords such as “theory”, “governance” and ”city”.
In order to re-examine these interpretations, we also addressed the relations between the publications in which climate change research is being published. In Figure 6, we show the co-citation patterns between journals for the topic “climate change adaptation”. The VOSviewer algorithm has created distinct clusters which are anchored by high status publication such as Science, Climatic Change (ranked by Scimago in the first quartile of the Atmospheric Science category) and Global Environmental Change (ranked by Scimago in the first quartile of the Ecology category). Each cluster can be labeled, as we have discussed above, which results in a basic life science cluster, an applied science cluster, a broad “climate change” cluster, which incorporates some social science journals, and smaller clusters defined by agriculture journals and hydrology publications. While the high-status journals which anchor these clusters transcend specific disciplinary boundaries, there is clear representation of fields such as ecology, meteorology, economics and medicine.

4. Discussion

The data presented above suggest that there is a recurring pattern within the co-citations of publications within the field of climate change. This patterning can be identified as a convergence of publications in the sciences and a divergence between those and the output of the social sciences, despite commonalities of the concepts being researched. This can be understood given the patterns of knowledge production in many colleges and universities and given the limited roles donated to social scientists by better funded STEM researchers [34]. Yet the familiarity of the problem does not minimize its importance nor, in particular, the restrictions that it can place on effective climate change research.
We are not the first to point to this issue. In a bibliometric analysis of the Third IPCC Assessment Report, Bjurström and Polk conclude that “the IPCC approach to assessing climate change research emphasizes the physical aspects of climate change, downplays social analysis and separates nature and society” (p. 14, [9]). We have undertaken a complementary analysis of the recent Fourth National Climate Assessment [35]. For instance, in Chapter 17, the report states that “a long history of research on complex systems spanning disciplines from meteorology to ecology to paleontology to computer science, has shown that systems that depend on one another are subject to new and often complex behaviors” (https://nca2018.globalchange.gov/chapter/17/, [35]). While this is evident, it is also a partial list of relevant disciplines. Complex systems research is carried on in many parts of the social and behavioral sciences, and in total is likely to be more relevant to the field of climate change adaptation than paleontology, for instance. A clear example is the field of urban development and planning, where systems thinking has existed for half a century [36].
Indeed, the Climate Assessment—which can be taken as a formal statement of current climate research in the US—is replete with assertions which indicate the extent to which STEM research sidesteps the output from social scientists. A simple example relates to the topic of air conditioning. At several points, it is argued within the report that warming trends pose threats to infrastructure and the quality of life, due to increased demands for electricity driven by air conditioners. This is a poor choice of examples—among many—as the heaviest demands for energy in the US are concentrated in the temperate zones rather than the Southwest and Southeast. It takes much more energy to heat homes and offices than to cool them, and increased use of air conditioners rather than furnaces is not as problematic as other likely system changes [37].
In an effort to show that this fracture between STEM fields and the social sciences may constitute a systematic problem, we examined the patterns of keyword co-occurrence within the 5644 citations listed at the close of the Assessment, which we take to be the current domain of knowledge about climate research within the US. As Figure 7 indicates, there are 7 clusters on display. These can be interpreted as follows (clockwise from top): adaptation (yellow); mitigation (purple); humans (orange); water and droughts (blue); oceans (teal); resilience (green) and biodiversity (red). Two points stand out. First, mitigation is little connected to other topics. However, while adaptation has a higher visibility (along with vulnerability and resilience, on the one hand, and health and urbanization, on the other), this cluster is also less connected to the others. We take this as further evidence that the basic schism identified three decades ago between mitigation and adaptation—and the marginalization of adaptive strategies—still remains in place today.

5. Conclusions

This paper has used bibliometric methods to examine scientific publication relating to varied aspects of climate change and thereby to understand the dynamics of knowledge production in the field. Using material from Web of Science and taxonomies available within VOSviewer, we have presented visual displays of relations between publications and have offered some interpretations of the ways that researchers are producing knowledge in this field.
Our visual displays show that basic academic distinctions are reproduced within these data sets. Even in a field with clear policy applications such as climate change adaptation, there is minimal integration to be found between science and social science researchers, which is manifested in divergent patterns of citation.
We have suggested that this conforms to common patterns of separation within the academy. In many contexts, this is to be expected and may even constitute a high level of specialization and sophistication. In the context of climate change, which is already manifesting itself as an existential threat, we see no advantages to anything but the highest levels of research integration.

Author Contributions

This was a collaborative project. All authors have read and agreed to the published version of the manuscript.

Funding

This research received no external funding.

Acknowledgments

The authors wish to thank two anonymous referees for their constructive comments. The usual disclaimers apply.

Conflicts of Interest

The authors declare no conflict of interest.

Appendix A

Table A1. Search terms used for VOSviewer maps.
MapSearch Terms
Figure 2“climate change”: 203,978 publications refined to 3689 “highly cited”.
Figure 3Mitigation: 72,945 publications refined by climate to 513 “highly cited” publications.
Figure 4Climate AND change AND adaptation: 27,324 publications refined to 610 “highly cited” papers.
Figure 5Resilience: 68,615 publications, refined by “climate” to 820 “highly cited” papers.
Table A2. Examples of thesaurus terms employed in VOSviewer maps [extract: full list available from the authors].
Keyword VariationsConsolidated Thesaurus Terms
climate-change impactsimpacts
climate impactsimpacts
climate change impactsimpacts
climate change impactimpacts
change impactsimpacts
behaviourbehavior
behaviorbehavior
biodiversity conservationbiodiversity
biodiversitybiodiversity
community structurecommunity
communitiescommunity
niche conservatismconservation
conservatismconservation
conservation biologyconservation
conservation agricultureconservation
conservationconservation
biodiversity conservationconservation
reef coralscoral
coral-reefscoral
coral bleachingcoral
coralcoral
Figure A1. The relative numbers of publications in science, social science and the humanities categories, compared to the estimated number of interdisciplinary publications (which may transcend one or more category). Examples of interdisciplinary and multidisciplinary research areas identified within WoS are shown in Table A3. [A full account of how the WoS research categories were analyzed to generate these data is available from the authors].
Sustainability 12 06935 g0a1
Table A3. Examples of research areas identified within WoS to create Figure A1. Data indicate numbers of publications identified within a WoS search for “climate change”.
‘Computer Science, Interdisciplinary Applications’‘Social Sciences, Interdisciplinary’‘Multidisciplinary Sciences’‘Mathematics, Interdisciplinary Applications’
937126715,621635

References

  1. Hayhoe, K.; Wuebbles, D.J.; Easterling, D.R.; Fahey, D.W.; Doherty, S.; Kossin, J.; Sweet, W.; Vose, R.; Wehner, M. Our Changing Climate. In Impacts, Risks, and Adaptation in the United States: Fourth National Climate Assessment, Volume II; Reidmiller, D.R., Avery, C.W., Easterling, D.R., Kunkel, K.E., Lewis, K.L.M., Maycock, T.K., Stewart, B.C., Eds.; U.S. Global Change Research Program: Washington, DC, USA, 2018; pp. 72–144. [Google Scholar] [CrossRef]
  2. Fifth Assessment Report: Working Group III. AR5 Climate Change 2014: Mitigation of Climate Change; IPCC: Geneva, Switzerland, 2014. [Google Scholar]
  3. Bulkeley, H.; Carmin, J.; Broto, V.C.; Edwards, G.A.; Fuller, S. Climate justice and global cities: Mapping the emerging discourses. Glob. Environ. Chang. 2013, 23, 914–925. [Google Scholar] [CrossRef] [Green Version]
  4. Pielke, R.; Prins, G.; Rayner, S.; Sarewitz, D. Lifting the taboo on adaptation. Nature 2007, 445, 597–598. [Google Scholar] [CrossRef]
  5. Revi, A.; Satterthwaite, D.; Aragón-Durand, F.; Corfee-Morlot, J.; Kiunsi, R.B.; Pelling, M.; Roberts, D.; Solecki, W.; Gajjar, S.P.; Sverdlik, A. Towards transformative adaptation in cities: The IPCC’s Fifth Assessment. Environ. Urban. 2014, 26, 11–28. [Google Scholar] [CrossRef]
  6. Page, E.A. Climate Change, Justice and Future Generations; Edward Elgar Publishing: Cheltenham, UK, 2007. [Google Scholar]
  7. Laurencin, C.T.; McClinton, A. The COVID-19 pandemic: A call to action to identify and address racial and ethnic disparities. J. Racial Ethnic Health Disparities 2020. [Google Scholar] [CrossRef]
  8. Duit, A.; Galaz, V.; Eckerberg, K.; Ebbesson, J. Governance, complexity, and resilience. Glob. Environ. Chang. 2010, 20, 363–368. [Google Scholar] [CrossRef]
  9. Bjurström, A.; Polk, M. Physical and economic bias in climate change research: A scientometric study of IPCC Third Assessment Report. Clim. Chang. 2011, 108, 1–22. [Google Scholar] [CrossRef]
  10. Bulkeley, H.; Andonova, L.; Bäckstrand, K.; Betsill, M.; Compagnon, D.; Duffy, R.; Kolk, A.; Hoffmann, M.; Levy, D.; Newell, P.; et al. Governing climate change transnationally: Assessing the evidence from a database of sixty initiatives. Environ. Plan. C Gov. Policy 2012, 30, 591–612. [Google Scholar] [CrossRef] [Green Version]
  11. Olteanu, A.; Castillo, C.; Diakopoulos, N.; Aberer, K. Comparing events coverage in online news and social media: The case of climate change. In Proceedings of the Ninth International AAAI Conference on Web and Social Media, Oxford, UK, 26–29 May 2015. [Google Scholar]
  12. Bornmann, L.; Haunschild, R.; Marx, W. Policy documents as sources for measuring societal impact: How often is climate change research mentioned in policy-related documents? Scientometrics 2016, 109, 1477–1495. [Google Scholar] [CrossRef] [PubMed]
  13. Leggett, J. Energy and the new politics of the environment. Energy Policy 1991, 19, 161–171. [Google Scholar] [CrossRef]
  14. Meo, M. Policy-oriented climate impact assessment. Glob. Environ. Chang. 1991, 1, 124–138. [Google Scholar] [CrossRef]
  15. Belter, C.W.; Seidel, D.J. A bibliometric analysis of climate engineering research. Wiley Interdiscip. Rev. Clim. Chang. 2013, 4, 417–427. [Google Scholar] [CrossRef]
  16. Haunschild, R.; Bornmann, L.; Marx, W. Climate Change Research in View of Bibliometrics. PLoS ONE 2016, 11, e0160393. [Google Scholar] [CrossRef] [PubMed] [Green Version]
  17. Gore, A. Earth in the Balance: Ecology and the Human Spirit; Houghton Mifflin: Boston, MA, USA, 1992. [Google Scholar]
  18. Eisenack, K.; Moser, S.C.; Hoffmann, E.; Klein, R.J.; Oberlack, C.; Pechan, A.; Rotter, M.; Termeer, C.J.A.M. Explaining and overcoming barriers to climate change adaptation. Nat. Clim. Chang. 2014, 4, 867–872. [Google Scholar] [CrossRef]
  19. Yarnal, B. Vulnerability and all that jazz: Addressing vulnerability in New Orleans after Hurricane Katrina. Technol. Soc. 2007, 29, 249–255. [Google Scholar] [CrossRef]
  20. Fields, B. From Green Dots to Greenways: Planning in the Age of Climate Change in Post-Katrina New Orleans. J. Urban Des. 2009, 14, 325–344. [Google Scholar] [CrossRef]
  21. Black, E.; Blackburn, M.; Harrison, G.; Hoskins, B.; Methven, J. Factors contributing to the summer 2003 European heatwave. Weather 2004, 59, 217–223. [Google Scholar] [CrossRef]
  22. Olowu, D. The Hyogo Framework for Action and its implications for disaster management and reduction in Africa. Jàmbá J. Disaster Risk Stud. 2010, 3, 303–320. [Google Scholar] [CrossRef] [Green Version]
  23. Gotham, K.F.; Campanella, R. Coupled Vulnerability and Resilience: The Dynamics of Cross-Scale Interactions in Post-Katrina New Orleans. Ecol. Soc. 2011, 16. [Google Scholar] [CrossRef] [Green Version]
  24. Harzing, A.-W.; Alakangas, S. Google Scholar, Scopus and the Web of Science: A longitudinal and cross-disciplinary comparison. Scientometrics 2015, 106, 787–804. [Google Scholar] [CrossRef]
  25. Bjurström, A.; Polk, M. Climate change and interdisciplinarity: A co-citation analysis of IPCC Third Assessment Report. Scientometrics 2011, 87, 525–550. [Google Scholar] [CrossRef]
  26. Moral-Muñoz, J.A.; López-Herrera, A.G.; Herrera-Viedma, E.; Cobo, M.J. Science mapping analysis software tools: A review. In Springer Handbook of Science and Technology Indicators; Springer: Cham, Switzerland, 2019; pp. 159–185. [Google Scholar]
  27. Bornmann, L.; Leydesdorff, L. Count highly-cited papers instead of papers with h citations: Use normalized citation counts and compare “like with like”! Scientometrics 2018, 115, 1119–1123. [Google Scholar] [CrossRef] [Green Version]
  28. Tang, M.; Liao, H.; Wan, Z.; Herrera-Viedma, E.; Rosen, M.A. Ten Years of Sustainability (2009 to 2018): A Bibliometric Overview. Sustainability 2018, 10, 1655. [Google Scholar] [CrossRef]
  29. Van Eck, N.J.; Waltman, L.; Dekker, R.; Berg, J.V.D. A comparison of two techniques for bibliometric mapping: Multidimensional scaling and VOS. J. Am. Soc. Inf. Sci. Technol. 2010, 61, 2405–2416. [Google Scholar] [CrossRef] [Green Version]
  30. Jinha, A.E. Article 50 million: An estimate of the number of scholarly articles in existence. Learn. Publ. 2010, 23, 258–263. [Google Scholar] [CrossRef] [Green Version]
  31. Semenov, M.A.; Shewry, P.R. Modelling predicts that heat stress, not drought, will increase vulnerability of wheat in Europe. Sci. Rep. 2011, 1, 66. [Google Scholar] [CrossRef]
  32. Rousseau, R.; Zhang, L.; Hu, X. Knowledge integration: Its meaning and measurement. In Springer Handbook of Science and Technology Indicators; Springer: Cham, Switzerland, 2019; pp. 69–94. [Google Scholar]
  33. Waltman, L.; van Eck, N.J. Field normalization of scientometric indicators. In Springer Handbook of Science and Technology Indicators; Springer: Cham, Switzerland, 2019; pp. 281–300. [Google Scholar]
  34. Haarstad, H.; Sareen, S.; Wanvik, T.I.; Grandin, J.; Kjærås, K.; Oseland, S.E.; Kvamsås, H.; Lillevold, K.; Wathne, M. Transformative social science? Modes of engagement in climate and energy solutions. Energy Res. Soc. Sci. 2018, 42, 193–197. [Google Scholar] [CrossRef]
  35. Reidmiller, D.R.; Avery, C.W.; Easterling, D.R.; Kunkel, K.E.; Lewis, K.L.M.; Maycock, T.K.; Stewart, B.C. (Eds.) USGCRP Impacts, Risks, and Adaptation in the United States: Fourth National Climate Assessment, Volume II; U.S. Global Change Research Program: Washington, DC, USA, 2018; p. 1515. [CrossRef]
  36. De Roo, G. Introduction to the Handbook on Planning and Complexity. In Handbook on Planning and Complexity; Edward Elgar Publishing: Cheltenham, UK, 2020. [Google Scholar]
  37. Sivak, M. Where to live in the United States: Combined energy demand for heating and cooling in the 50 largest metropolitan areas. Cities 2008, 25, 396–398. [Google Scholar] [CrossRef]
Figure 1. Trendlines of proportions of publications in different climate change subfields vs. baseline growth in all fields: See text for details.
Sustainability 12 06935 g001
Figure 2. VOSviewer output co-occurrences, WoS topic “Climate change”: See Section 2 for details.
Sustainability 12 06935 g002
Figure 3. VOSviewer output co-occurrences, WoS topic ‘Climate Mitigation’: See Section 2 for details.
Sustainability 12 06935 g003
Figure 4. VOSviewer output co-occurrences, WoS topic “Climate Change Adaptation”: See Section 2 for details.
Sustainability 12 06935 g004
Figure 5. VOSviewer output co-occurrences, WoS topic “Resilience and Climate”: See Section 2 for details.
Sustainability 12 06935 g005
Figure 6. VOSviewer co-citation patterns WoS topic “climate change adaptation”.
Sustainability 12 06935 g006
Figure 7. Keyword links, National Climate Assessment [https://nca2018.globalchange.gov].
Sustainability 12 06935 g007
Table 1. The relative number of publications in the field of climate change 1991–2019, Web of Science.
A&HCI (Arts & Humanities Citation Index)ESCI (Emerging Sources Citation Index)SSCI (Social Sciences Citation Index)SCI-Expanded (Science Expanded Index)
397410,97152,769247,557
Table 2. Distribution of authors who contributed to production of 3684 “highly cited” papers on climate change. 1991–2019: This category of high citation is defined in the next section.
Region or CountryNumber [and %] of 8965 Authors
Europe5218 [58%]
North America2455 [27%]
PRC539 [6%]
Japan199 [2%]
New Zeland 132 [1.5%]
Brazil130 [1.5%]
South Africa110 [1.2%]
India107 [1.1%]
Russia75 [0.8%]
Table 3. Comparison of publication numbers found in Web of Science for initial data collection.
Keyword/Phrase SearchedNumber of Results from 1991–2019
Climate change adaptation27,318
Climate change mitigation15,275
Climate change resilience10,311
Climate change282,918
The [used as a baseline]36,236,498
Table 4. Regression results for the five WoS trend lines.
BaselineClimate ChangeMitigationAdaptationResilience
y = 1.6552e0.0467xy = 0.2747e0.1376xy = 0.036e0.227xy = 0.0502e0.2098xy = 0.0102e0.2781x
R2 = 0.9789R2 = 0.9953R2 = 0.9788R2 = 0.9759R2 = 0.9809
Table 5. VOSviewer clusters “Climate change”.
Cluster IdentificationKeywordsCluster Interpretation
Cluster ‘Blue’Rainfall, flooding“Hydrologic cycle”
Cluster ‘Red’Risk, adaptation, sustainability, cities“Policy”
Cluster ‘Green’Species, species health“Biodiversity”
Cluster ‘Yellow’Atmosphere, heat stress“CO2 fixation”
Table 6. Interpretation of VOSviewer clusters, Mitigation.
Cluster IdentificationKeywordsCluster Interpretation
Cluster ‘Red’Heat, drought, UHI“Adaptation”
Cluster ‘Blue’CO2, plants“Biodiversity”
Cluster ‘Green’Energy, land“Food security”
Cluster ‘Yellow’Emissions, crops“Ecosystem”
Cluster ‘Purple’Energy, China“Emissions”
Table 7. Interpretation of VOSviewer Clusters, adaptation.
Cluster IdentificationKeywordsCluster Interpretation
Cluster ‘Green’Mitigation, rain, risk“Floods”
Cluster ‘YellowResilience, ecology“Vulnerability”
Cluster ‘Purple’Cities, urban planning“Urban”
Cluster ‘Teal’Marine, sea“Oceans”
Cluster ‘Blue’Genetics, phenology“Biodiversity”
Cluster ‘Red’CO2, agriculture“Food security”
Table 8. Interpretation of VOSviewer output clusters, resilience.
Cluster IdentificationKeyword LinksCluster Interpretation
Cluster ‘Red’Species, stress, CO2“Habitat”
Cluster ‘Green’Adaptation, sustainability“Policy”
Cluster ‘Yellow’Agriculture“Food security”
Cluster ‘Blue’Drought, forests, fires“Ecosystem health”

