Article

Implications of Energy Intensity Ratio for Carbon Dioxide Emissions in China

1
Institute of Mineral Resources Economics, Chinese Academy of Natural Resources Economics, Beijing 101149, China
2
Key Laboratory of Carrying Capacity Assessment for Resource and Environment, Ministry of Natural Resources, Beijing 101149, China
*
Author to whom correspondence should be addressed.
Sustainability 2020, 12(17), 6925; https://doi.org/10.3390/su12176925
Submission received: 4 August 2020 / Revised: 20 August 2020 / Accepted: 21 August 2020 / Published: 26 August 2020
(This article belongs to the Section Resources and Sustainable Utilization)

Abstract

:
Industrial carbon dioxide (CO2) emissions are mainly derived from fossil energy use, which is composed of procedures involving extraction of energy from the natural system as well as its exchange and consumption in the social system. However, recent research on low-carbon transitions considers the cost of energy commodities from a separate perspective—a biophysical or monetary perspective. We introduce the energy intensity ratio (EIR), which is a novelty perspective combining biophysical and monetary metrics to estimate the cost of energy commodities in the low-carbon energy transitions. This combination is essential, since the feedback of energy into the biophysical system will influence the performance of energy in the economic system and vice versa. Based on the Logarithmic Mean Divisia Index (LMDI), we developed the EIR-LMDI method to explain the changes in CO2 emissions. The changes in CO2 emissions caused by the EIR are the net energy effect. In China, the net energy effect kept CO2 emissions at a compound annual growth rate of 6.15% during 2007–2018. Especially after 2014, the net energy effect has been the largest driver of the increase in CO2 emissions. During the study period, high net energy usually indicated high CO2 emissions. Coal is the most important energy commodity and dominates the net energy effect; the least volatile component is the EIR of natural gas. The EIR affects CO2 emissions by the price crowding-out effect and the scale expansion effect, which make the process of low-carbon transition uncertain. The results illuminate that policymakers should monitor the net energy effect to prevent it from offsetting efforts to reduce energy intensity.

1. Introduction

After the Paris Agreement, governments have struggled to balance the rate of economic growth and the amount of industrial carbon dioxide (CO2) emissions. From the perspective of energy consumption, the integrated CO2 emission factor of energy and the integrated energy intensity of the economy drive changes in CO2 emissions over time. The integrated CO2 emissions factor is determined by the proportion of each energy commodity (e.g., crude oil, gas, coal, and nuclear energy) in the energy structure. The integrated energy intensity is defined as the energy consumption per unit of gross domestic product (GDP) in an economy.
In previous studies, a great number of indicators that assess sustainable development issues for industrial CO2 emissions associated with economic development exist. Commonly, researchers develop systems of indicators to satisfy the research criteria [1]. Guo Li introduces energy efficiency, economic growth, energy use (non-renewable energy), and clean energy substitution (renewable energy) as the indicators affecting CO2 emissions, and believes that resource melioration for energy consumption and economic growth have indispensable roles in reducing CO2 emissions. However, energy efficiency in the mining and extraction-related sector as well as the circular economy have not translated into CO2 emission reduction in China and Nigeria [2]. G. Ortega-Ruiz introduces types of energy sources, sizes of the economic sectors, and value of the gross domestic product as the indicators affecting CO2 emissions, and believes that India’s CO2 emissions increased due to the rapid economic growth and decreased due to the change in energy intensity [3]. More generally, the effects of activity, structure, intensity, fuel mix, and emission factor are introduced as the indicators affecting CO2 emissions [4,5,6,7], and the indicators could be classified into two categories: the integrated CO2 emission factor of energy and the integrated energy intensity of the economy. In this study, the previous systems of indicators are updated by introducing the energy intensity ratio (EIR) to obtain a new perspective on industrial CO2 emissions.
The intuition is that a smaller integrated CO2 emission factor and lower integrated energy intensity of the economy bring an efficient low-carbon transition. There is certain feedback if we consider that the biophysical system and the economic system are independent systems. However, once energy flows into the economy, it exists in both the economic system and the biophysical system, and is measured in monetary units and physical units in turn. The interaction between the two systems makes the feedback uncertain. In biophysics, energy follows the second law of thermodynamics [8], and in economics, energy follows the law of supply and demand [9]. The biophysical system and economic system jointly determine the future energy consumption and low-carbon transition scenario, not just one of them. Therefore, we need a bridge to link the two systems. In our opinion, net energy has the potential to perform this function. The concept of net energy was first proposed by Howard Odum [10] and was defined as the energy extracted minus the energy invested in the process of extraction. Subsequently, it evolved into the energy return ratio, which is represented by the energy returned from the energy extraction process divided by the energy invested to obtain that energy [11,12,13]. Then, the net energy analysis was still based on the biophysical system.
From biophysical perspectives, societies are complex adaptive systems, and their structures or functions are maintained by energy input [14]. Since 1980, the energy consumption per capita of a country scales with 3/4 of the power of its GDP per capita, just as a mammal’s metabolism scales with 3/4 of the power of its mass [15]. Anthropologists suppose that consuming too much energy in extraction processes leads to the collapse of society [16,17,18]. The classic example is the collapse of the Roman Empire. While the energy needed to expand the empire was increasing, the energy derived from the expanding borders decreased. The diminishing of the marginal energy entering the empire caused the diminishing of the average energy of the empire. As a result, the energy balance was broken, and the empire eventually collapsed [16]. The biophysical perspectives indicate that the variation of net energy largely determines the expansion and contraction of a society.
In economic research, econometric economists examine the dynamic relationship between energy consumption, usually in the form of energy cost shares or expenditures on energy as a fraction of GDP, and economic growth [19,20,21]. The results illuminate that the share of energy expenditures relates, usually negatively, to economic growth. The energy cost shares for preindustrial economies with lower economic growth are much higher than those for industrial and postindustrial economies with higher economic growth [22]. In contrast, there is a dearth of studies relating net energy to economic scenarios. King [22] deems it is essential to include net energy in macroeconomic modeling, especially for energy economy analysis. For example, net energy analysis can inform whether the change in energy intensity comes from the change in energy cost and price. Based on this point of view, net energy should be treated as a significant factor influencing CO2 emissions.
The explicit difference is that the net energy in the biophysical system is measured by physical metrics, and in the economic system, it is measured by monetary metrics. Although the traditional net energy analysis is a worthful perspective, it is unable to be the bridge linking the two systems. As a result, existing research has not yet effectively included net energy into the CO2 emissions model. In our opinion, the energy intensity ratio (EIR) can be a new analysis of net energy to link the biophysical system and economic system.
Regarding the research method, we have reviewed the available research on decomposing CO2 emissions into different key drivers and quantitatively analyzing the influence of drivers [23,24,25]. In general, there are two common decomposition methods: Structural Decomposition Analysis (SDA) [26,27] and Index Decomposition Analysis (IDA) [28,29]. The method of SDA requires input–output table data as support, and is merely used in less than 10% of studies. In contrast, the method of IDA is widely used in more than 90% of environmental economic research. IDA is especially suitable for CO2 emissions models since it only requires department aggregation data and few factors [30]. Based on the assessment, the Logarithmic Mean Divisia Index (LMDI), derived from IDA, is the most suitable for our purpose given the data available [31,32]. In previous studies, the LMDI approach was always used to decompose the driver of energy consumption into three categories: activity, structural, and intensity effects, or to decompose the driver of CO2 emissions into five categories: activity, structural, intensity, fuel mix, and emission factor effects. Regardless of the decomposition of energy consumption or CO2 emissions, these studies have not considered the net energy effect. We introduce the net energy effect, specifically the EIR, into the analysis of CO2 emissions. The method derived from the LMDI is called EIR-LMDI in this study.
The contribution of this study is that it introduces the EIR, which is a novelty perspective combining biophysical and monetary metrics to estimate the cost of energy commodities in low-carbon energy transitions. The combination solves the problem that feedback could not be formed between the biophysical system and the economic system in previous studies. In addition, when data are too scarce to perform the original net energy analysis, the EIR can perform a valid simulation of the trend for biophysical net energy. Meanwhile, the construction of the EIR-LMDI model not only includes the EIR into the driving factors of CO2 emissions, but also quantifies the EIR’s effect.

2. Data and Methods

2.1. Data Description

The data, including the price of energy commodities, energy consumption, and CO2 emissions, are available from the BP Statistical Review of World Energy 2019. In order to make different energy commodities comparable, we converted the consumption of oil, coal, gas, nuclear energy, hydroelectricity, and renewables (million tons oil equivalent) into the consumption of energy (TeraJoules, TJ), respectively. The approximate conversion factors are available from the BP Statistical Review of World Energy 2019. The gross domestic product (GDP) of China is available from the National Bureau of Statistics. The exchange rate is available from China’s foreign exchange trade system. All data sets were sampled from November 2007 to May 2018 at a yearly frequency. The CO2 emissions coefficients of different energy commodities are as follows: Oil is 73,300 kgCO2/TJ, coal is 101,000 kgCO2/TJ, and natural gas is 56,100 kgCO2/TJ.

2.2. Methods

2.2.1. Energy Intensity Ratio (EIR) and Net Energy

Access to sufficient affordable energy is an important factor for the success of a low-carbon transition [33]. In our opinion, net energy can play the function of evaluating the difficulty of obtaining energy. In the biophysical system, net energy is the ratio of the energy extracted to the energy invested, and the energy flow is measured in physical units [22]. In practice, the energy flow embodied in the investment process cannot be assessed precisely. We employed a price-based proxy to perform the original net energy analysis [34,35]. The proxy is the energy intensity ratio (EIR) in this paper. While the original net energy analyzes the energy flow just based on the biophysical perspective, the EIR makes net energy analysis feasible by introducing economic variables.
The EIR equation is
E I R p n = 1 p n ε = 1 p n T E C G D P = T J $ T J / y r $ / y r ,
where n is the type of energy commodity, including oil, coal, gas, nuclear energy, hydroelectricity, and renewables; E I R p n is the EIR of energy commodity n in a given country; Pn is the annual average price (e.g., USD/year) of energy in energy commodity n; 1/Pn indicates the energy that can be produced per unit price, whose metric unit is terajoules per dollar (TJ/USD). GDP is the gross domestic product of the country; TEC is the total energy consumption in a country; and ε is the energy intensity in a given country (TEC/GDP), whose metric unit is terajoules per dollar (TJ/$).
Compared to the original net energy, the EIR is a price-based proxy and scales the price of energy commodity n into a dimensionless ratio via the energy intensity. King indicated that the time series of the EIR correlates well with the original net energy based on data from the United States [35]. The major reason for this high correlation is as follows. The EIR represents the amount of energy obtained by spending one dollar relative to the amount of energy it takes to generate one dollar of output in the economy [22]. The numerator 1/Pn in Equation (1) represents the energy produced by one dollar of energy commodity n. The denominator in Equation (1) represents the energy required to produce one dollar in the GDP. In effect, there is an assumption in the EIR analysis that all monetary investments to produce energy occur at the energy intensity of the overall economy rather than at the energy intensity of a specific energy commodity [36]. The energy intensity of the overall economy is the weighted average of the energy intensities of all energy commodities [37]. For most countries and energy commodities, there are not enough data to perform the original net energy analysis. The EIR can imitate net energy by introducing monetary metrics.
E I R p n = 1 p n T E C G D P = M J $ M J / y r $ / y r E o u t E i n v e s t
Equation (2) indicates the process of imitation. E o u t is the energy production in a year, and E i n v e s t is the energy consumption in a year. The left part of indicates the definition of the EIR, and the right part of indicates the definition of biophysical net energy. The parts on both sides of are not equal, but are infinitely close. Biophysical net energy represents energy efficiency in the mining and extraction-related sector and indicates the gap between energy input and energy output. Therefore, the import and export of energy should not be considered in biophysical net energy. If we divide the energy consumption by GDP, the trends of the EIR will be consistent with the biophysical net energy. Accordingly, the EIR is a valid analysis of net energy in this paper.

2.2.2. Net Energy and Logarithmic Mean Divisia Index (LMDI)

Assume that G is the CO2-related aggregate and there are n factors driving the changes in G over time. The amount of change caused by each factor is x1, x2xn. In Equation (3), the subscript i is a subcategory (energy commodities) of the CO2-related aggregate changes. At the subcategory level, the relationship G i = x 1 , i x 2 , i x n , i holds. The general index decomposition analysis (IDA) identity is as follows [6].
G = i G i = i x 1 , i x 2 , i x n , i
We decompose the aggregate changes by additive decomposition:
Δ G t o t = G T G 0 = Δ G x 1 + Δ G x 2 + + Δ G x n ,
where the subscript tot represents the total change, and the terms on the right-hand side give the effects associated with the respective factors in Equation (4) [6].
G 0 = i x 1 , i 0 x 2 , i 0 x n , i 0 is the aggregate change at time 0.
G T = i x 1 , i T x 2 , i T x n , i T is the aggregate change at time T.
Based on the IDA approach, the effect of the kth factor on the right-hand side of Equation (4) is:
Δ G x k = i L G i T , G i 0 ln x k , i T x k , i 0 = i G i T G i 0 ln G i T ln G i 0 ln x k , i T x k , i 0 ,
where:
L a , b = a b / ln a ln b as defined in [38].
In this paper, changes in CO2 emissions from energy commodities are studied by quantifying the impacts of changes in five different factors: the cost effect, the net energy effect, the energy intensity effect, the structural effect, and the emission factor effect. The subcategory of the aggregate is energy commodities. The IDA identity in Equation (3) is
C = i C i = i P i E i Q P i E i E Q E i E C i E i = i E C i E I R i I S i U i
where:ECi is the cost effect of energy commodity i, which is driven by the expenditure on energy commodity i (PiEi). EIRi is the net energy effect of energy commodity i, which is driven by the EIR of energy commodity i (Q/PiEi). “I” is the energy intensity effect, which is driven by the energy intensity of the economy (E/Q). Si is the structural effect, which is driven by the share of energy from energy commodity i (Ei/E). Ui is the emission factor effect, which is driven by the emission factor for energy commodity i (Ci/Ei).
In Equation (6), we introduce the EIR as the driver of CO2 emissions, which we call the net energy effect. This decomposition is based on the method of the Logarithmic Mean Divisia Index (LMDI). In this study, the LMDI, which includes net energy effect, is referred to as the EIR-LMDI. The aggregate change in CO2 emissions from time 0 to time T is as follows:
C = C T C 0 = Δ C cos + Δ C n e t + Δ C int + Δ C s t r + Δ C e m f ,
where:
The change due to the cost effect of energy commodities is given by
Δ C cos = i w i ln E C i T E C i T .
The change due to the net energy effect of energy commodities is given by
Δ C n e t = i w i ln E I R i T E I R i T .
The change due to the energy intensity effect is given by
Δ C int = i w i ln I T I 0 .
The change due to the structural effect is given by
Δ C s t r = i w i ln S i T S i T .
The change due to the emission factor effect is given by
Δ C e m f = i w i ln U i T U i T .
wi is the logarithmic mean,
w i = C i T C i 0 ln C i T ln C i 0 .

3. Results

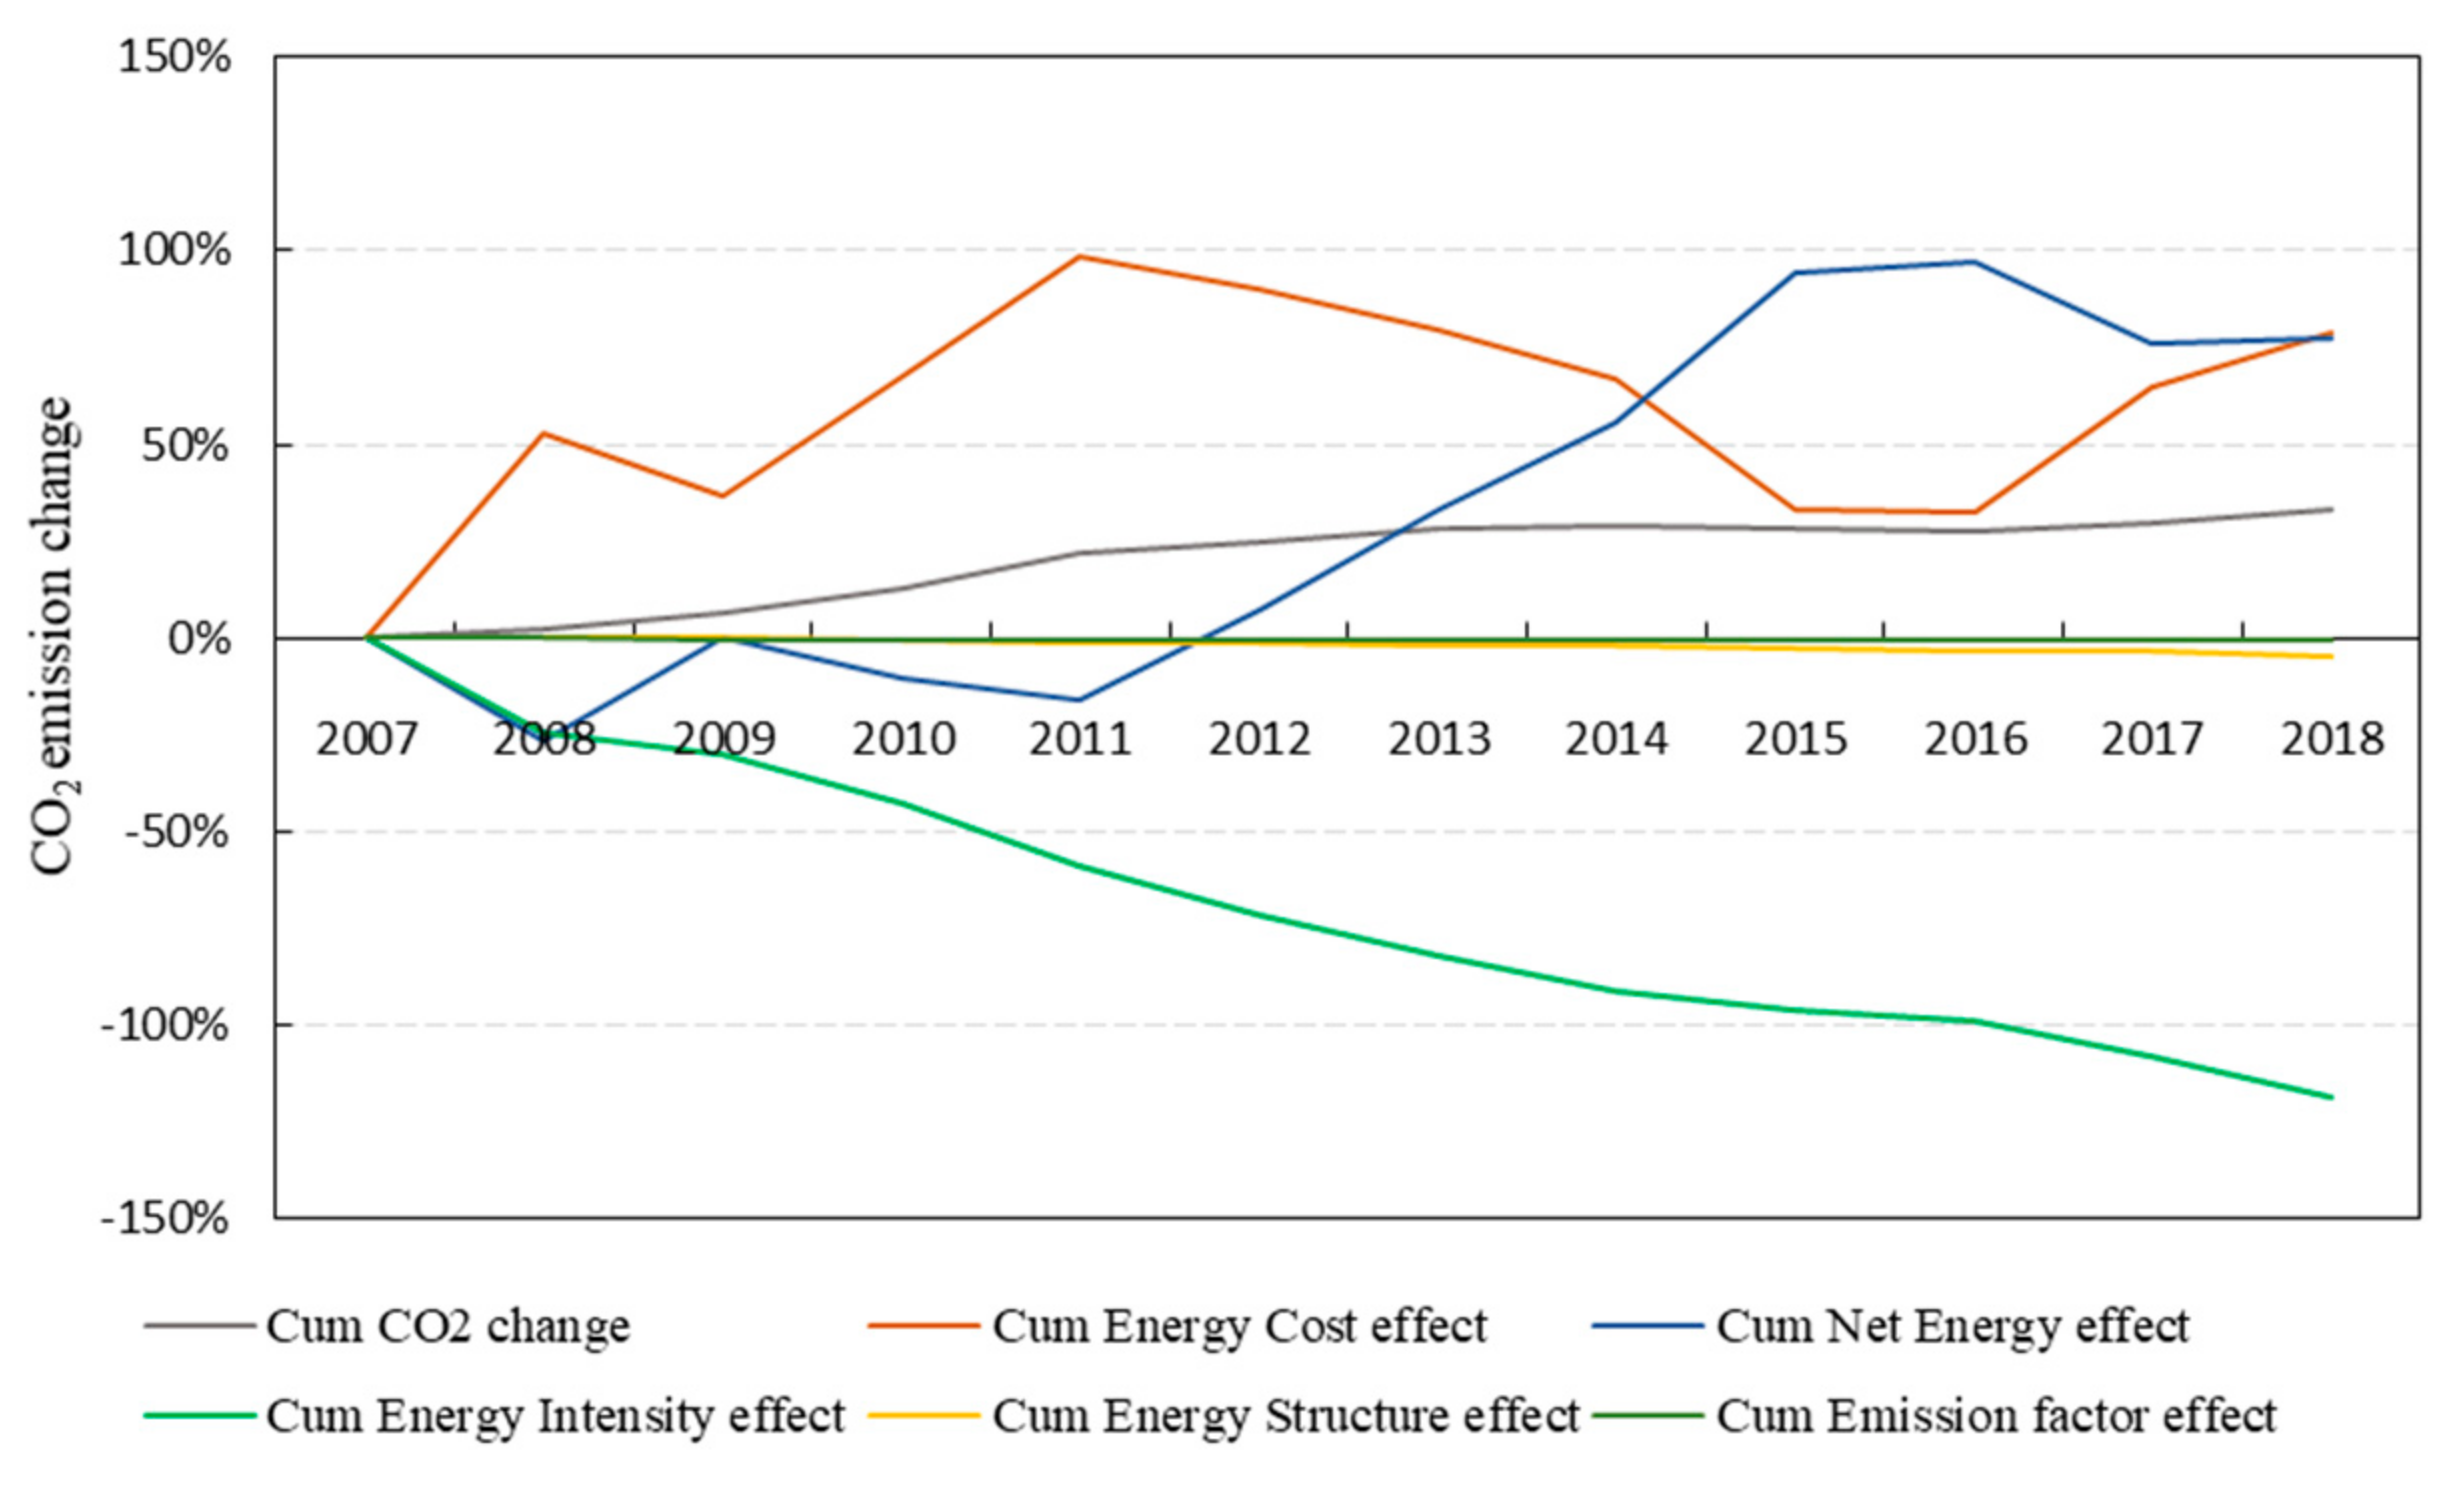
3.1. Net Energy Effect Gradually Becomes the Greatest Factor Driving the CO2 Emissions Up

In the study, we introduce net energy as one of the factors driving changes in CO2 emissions. By putting the EIR into the LMDI, we extract the effects of net energy on CO2 emissions. The results are shown in Figure 1.
Figure 1 presents the results of the cumulative effect of each of the drivers of CO2 emissions in China from 2007 to 2018. The lines indicate that some drivers pull CO2 emissions downward, and others push CO2 emissions upward. The comprehensive effect is that CO2 emissions are rising over the period. The energy intensity effect is the largest and most stable driver pulling CO2 emissions in China downward, decreasing CO2 emissions by 119% until 2018. Compared to the energy intensity effect, the energy structure effect in China has little effect on CO2 emissions, decreasing CO2 emissions by only 5% until 2018. The influences of the energy cost effect and net energy effect are time-varying, driving CO2 emissions up by 79% and 77% until 2018, respectively. However, their trends are different.
Let us focus on the cumulative net energy effect. There are two important points for the net energy effect. One is in 2012: Before 2012, the net energy effect pulled the CO2 emissions downward. The other is in 2014, after which year the net energy effect exceeded the energy cost effect and became the greatest factor pushing the CO2 emissions upward. In Section 3.2, we will explore the internal mechanism of this trend.
Figure 2 is a “waterfall” chart showing the compound annual growth rate of CO2 emissions apportioned to the five drivers during 2007–2008 (as described in Section 2.2.2). The compound annual growth rate of the change in CO2 emissions is given by Equation (14):
CAGR = (1 + total change)^(1/number of years)
The energy cost effect and net energy effect are the drivers pushing the CO2 emissions up (6.29% and 6.15%, respectively), while the energy intensity effect and energy structure effect are the drivers pulling the CO2 emissions down (−9.46% and −0.37%, respectively). The comprehensive effect is that CO2 emissions achieve a compound annual growth rate of 2.62%. Although the integrated CO2 emissions coefficients of energy can be reduced by adjusting the energy structure, the space for reducing the carbon emission coefficient of individual energy commodities is limited due to the fixed molecular formula for specific energy commodities. Therefore, we assume that the CO2 emissions coefficients of energy commodities are constant during the sample period and the emission factor effect is zero. The result shows that net energy is the second large factor worth paying attention to. The net energy effect is the second major factor in raising the overall CO2 emissions, and it deserves attention.
According to the energy commodities we choose, the EIR of energy commodities is divided into the EIRs of coal, oil, and natural gas. Figure 3 shows that the most volatile component is the EIR of oil, and the least volatile component is the EIR of natural gas. The fluctuation of the EIR of coal dominates the change of the net energy effect. For most of the period from 2007 to 2018, the EIR of natural gas is smaller than its initial value in 2007. For the EIRs of oil and coal, there are two important points. One is in 2012; after 2012, the change in the EIR of coal exceeded the change in the EIR of oil, and both increased sharply. Especially for the EIR of oil, its variation exceeded the variation in the EIR of coal in 2014. Furthermore, coal is the most important energy commodity dominating the total net energy effect. In China, coal is the most consumed energy commodity, accounting for 58–74% of the total energy consumption between 2007 and 2018, and the CO2 emission coefficient of coal is the highest among fossil energies: oil—73,300 kgCO2/TJ, coal—101,000 kgCO2/TJ, and natural gas—56,100 kgCO2/TJ. For these two reasons, the net energy of coal dominates the net energy effect of CO2 emissions.

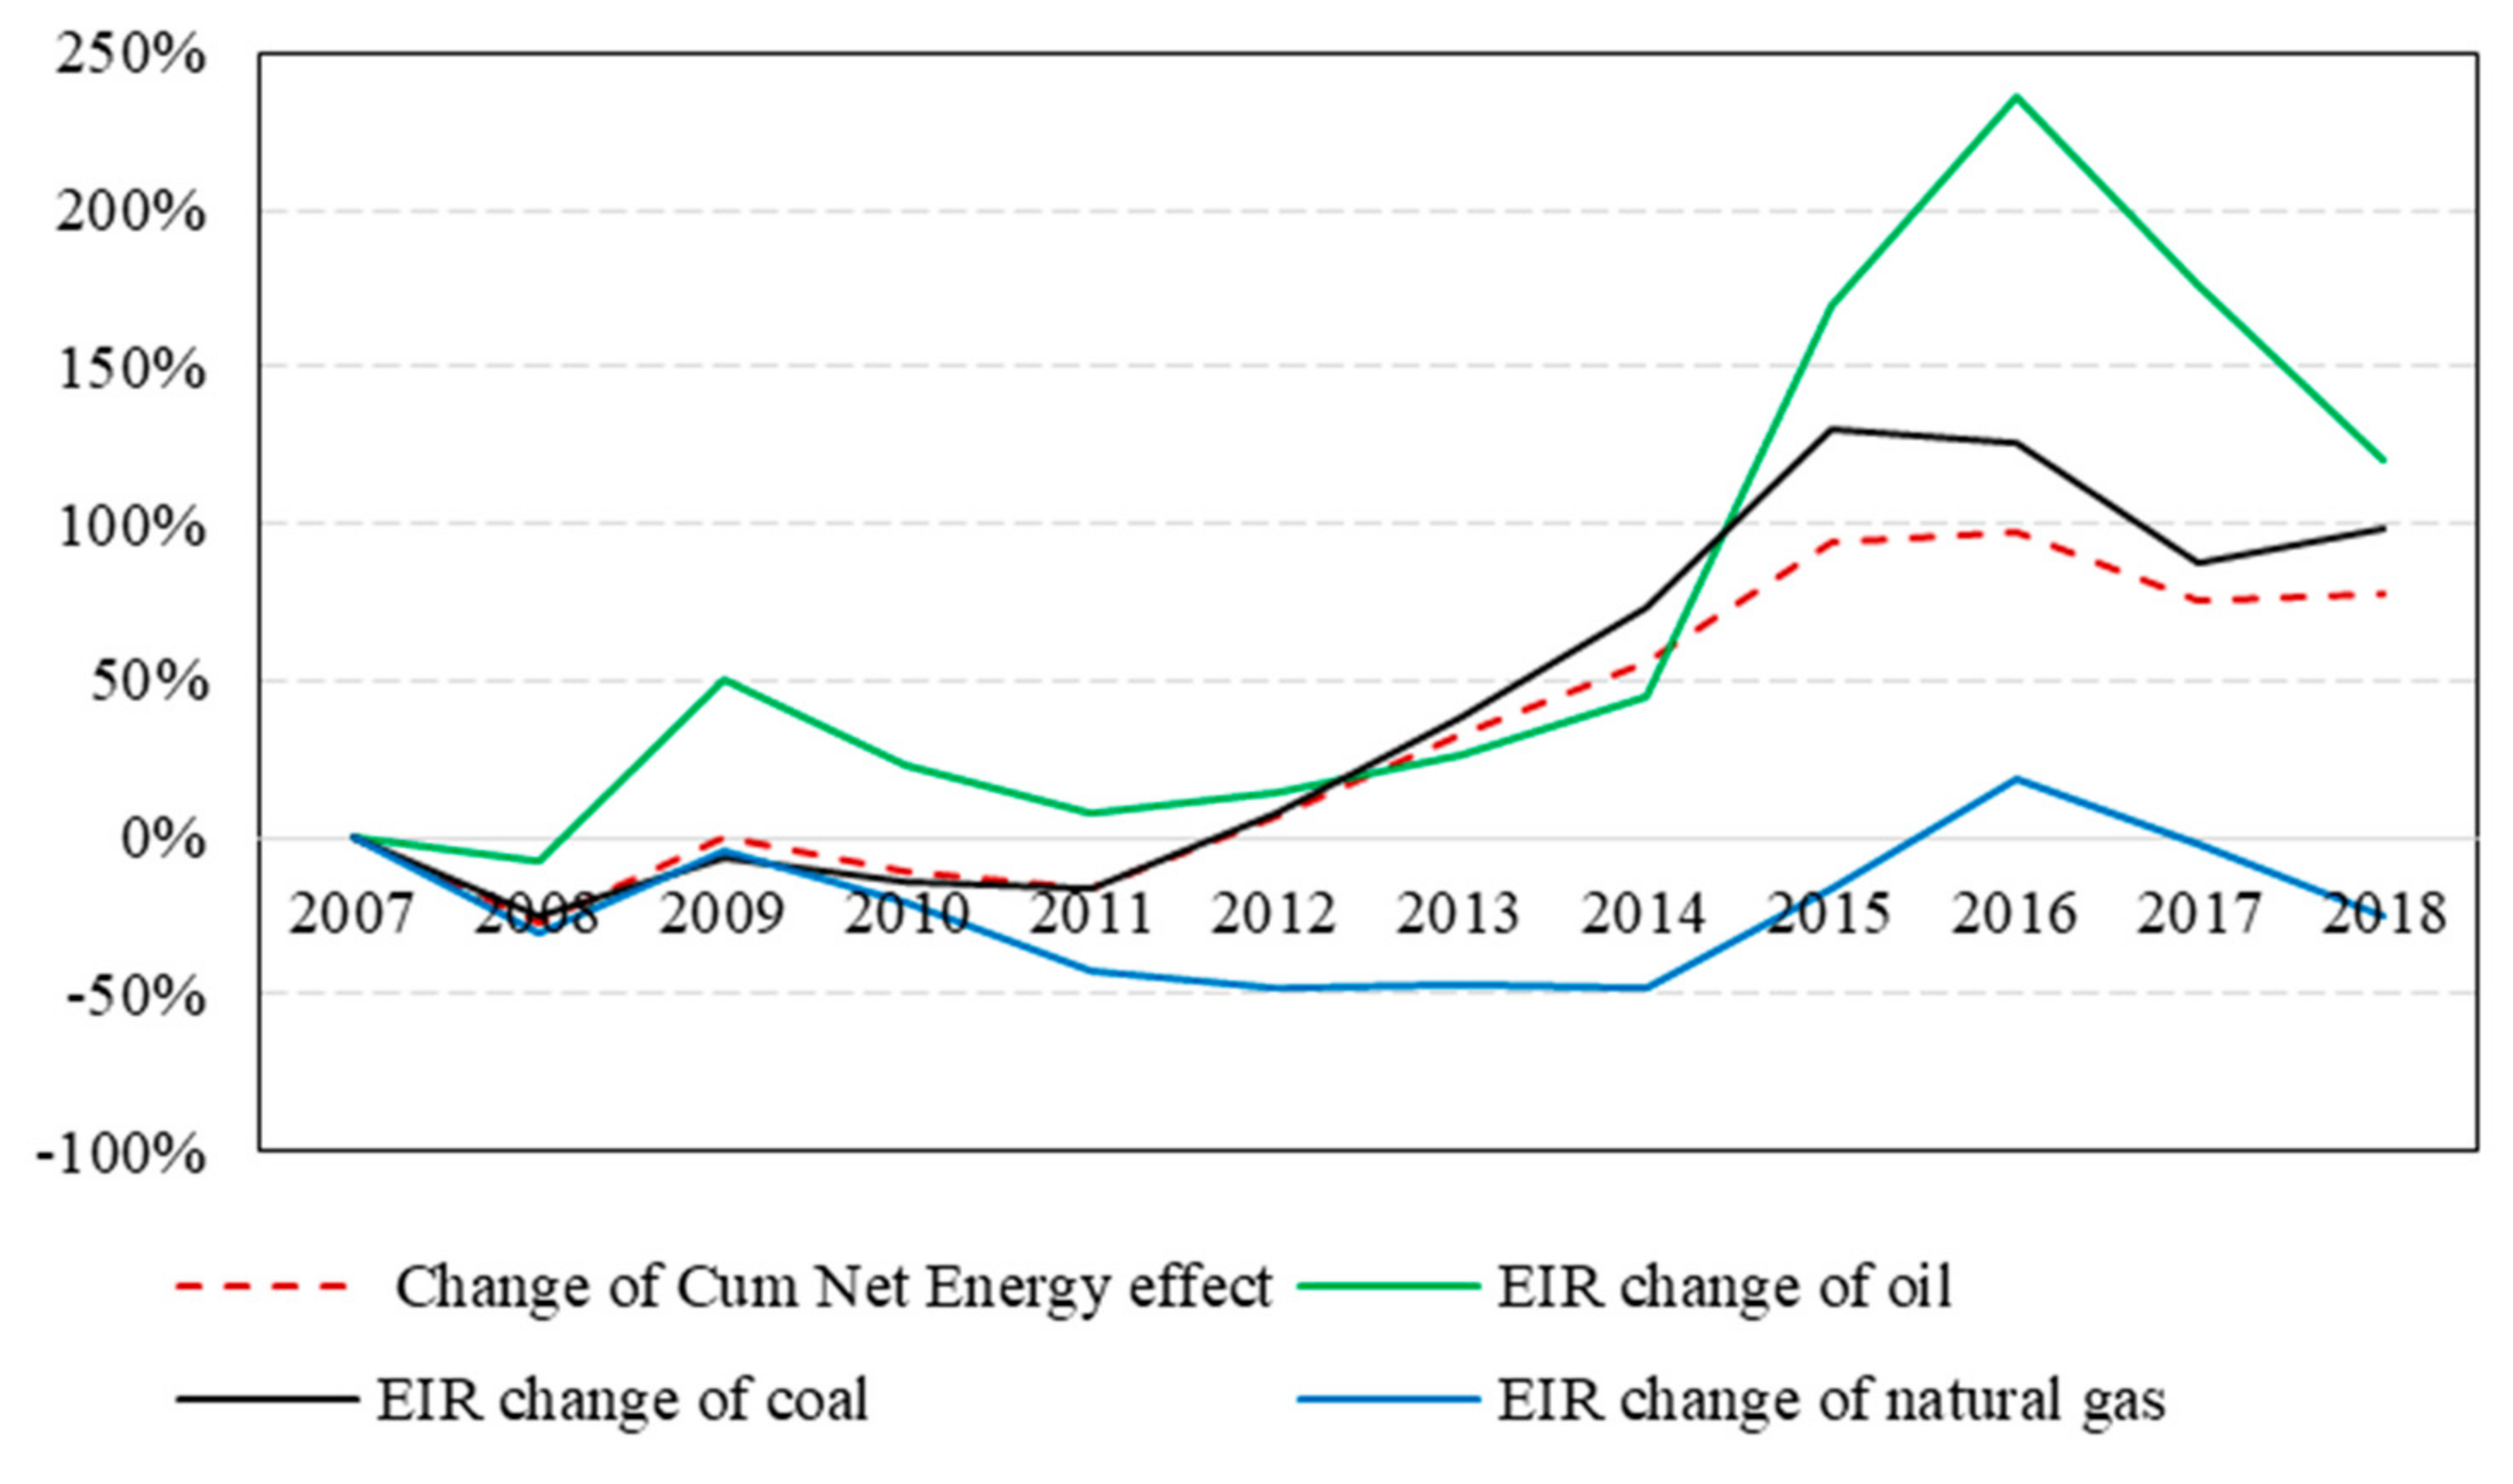
3.2. Two Mechanisms of Net Energy Effect

There are two mechanisms of the EIR affecting CO2 emissions. One is the price crowding-out effect, and the other one is the scale expansion effect. The EIR is a perspective from which to observe net energy, and it represents the amount of energy one can obtain by spending one dollar relative to the amount of energy it takes to generate one dollar of output from the economy. According to the definition, when GDP increases with less energy consumption or more energy is produced with less capital investment, the EIR will increase. In the net energy analysis, there are two conversions in the EIR. The first is biophysical metrics translated into economic metrics, and the second is economic metrics translated into biophysical metrics. These two conversions constitute a complete cycle of energy participation in economic activities. The EIR reflects the efficiency of the energy flow in the economy. The larger the EIR is, the more efficient the energy flow. More efficient energy flow means less energy input gains more energy output, which leads to a lower price (see Figure 4, Figure 5 and Figure 6) [39].
If energy is available at a lower price, economic entities may waste energy, and tend to consume more energy and produce more CO2 emissions. This process will offset the energy intensity effect, decreasing the CO2 emissions. We call this the price crowding-out effect. In addition, higher EIR indicates higher energy flow efficiency, and also means that less energy can support more GDP growth. This process will provide greater flexibility for the energy balance in economic expansion and will overcome the energy constraints of GDP growth. The expansion of the economic scale incurs an increase in total energy consumption and CO2 emissions. This is similar to the example of the Roman Empire. If the marginal energy gains per unit of plundered land became greater than the marginal energy costs, the net energy accumulated in the expansion would promote the further expansion of the empire. We call this the scale expansion effect.
In Section 3.1, the results show that there are two important points for the net energy effect. One is around 2012, and the other is around 2014. In Figure 4, Figure 5 and Figure 6, after 2012, the EIR of energy commodities increased; at the same time, the price of energy commodities decreased. This indicates that the price crowding-out effect became significant. In our opinion, this is the reason why the net energy effect began to push the CO2 emissions upward in 2012. The continuous price decline caused the net energy effect to exceed the energy cost effect in 2014. However, the trend of the price and EIR was reversed in 2014, which caused the trend of net energy effect to be reversed (Figure 1).

4. Discussion and Conclusions

4.1. Discussion

The results indicate that the net energy effect increased CO2 emissions by 6.15% every year during 2007–2018. Therefore, when studying CO2 emissions, net energy deserves more attention than it has previously received. In the process of the dynamic evolution of the net energy effect, there are two distinct stages. One is between 2007 and 2010, and the other is between 2012 and 2018. The former pulls the CO2 emissions down, and the latter pushes the CO2 emissions up. At the same time, the energy intensity effect decreased CO2 emissions by 9.46% every year steadily. Therefore, both scholars and policymakers believe that controlling energy intensity is the most effective measure to control CO2 emissions. The perspective is that the smaller the energy intensity is, the smaller CO2 emissions will be. Though this is certain in the biophysical system, it is doubtable considering the economic system. When energy circulates in the economic system, it is measured by both biophysical and economic metrics. The interaction between the two metrics determines the future scenario of energy and CO2 emissions. While the energy intensity is declining continuously, the net energy will be increasing, leading to more CO2 emissions. This process is realized through two mechanisms: the price crowding-out effect and the scale expansion effect. These two effects will offset the energy intensity effect, decreasing CO2 emissions. Therefore, reducing energy intensity does not always reduce CO2 emissions effectively.
When the net energy of oil is greater than 2.5, the decrease in oil prices and the price crowding-out effect will become significant (see Figure 3 and Figure 4). When the net energy of coal is great than 1.6, the decrease of coal prices and the price crowding-out effect will become significant (see Figure 3 and Figure 5). When the net energy of natural gas is greater than 1.1, the decrease of natural gas prices and the price crowding-out effect will become significant (see Figure 3 and Figure 6). At present, this study cannot quantitatively assess the scale expansion effect.
In the process of CO2 emission reduction, scholars and policymakers should pay more attention to the net energy effect. With the increase of the energy intensity effect, the net energy effect will gradually increase, and will eventually become the main factor leading to the increase of CO2 emissions.

4.2. Conclusions

Differently from traditional studies, we introduced net energy analysis to explore the drivers of industrial CO2 emissions. The net energy effect is an important factor causing fluctuations in CO2 emissions. There are many net energy metrics, and the biophysical form is the most original. When data are too scarce to perform the original type of net energy analysis, the EIR offers a valid simulation of the trend for biophysical net energy. In China, from 2007 to 2012, the net energy effect drove the reduction of CO2 emissions, and from 2012 to 2018, the net energy effect drove the increase in CO2 emissions. After 2014, the net energy effect has been the largest driver of the increase in CO2 emissions. Overall, the net energy effect maintained CO2 emissions at a compound annual growth rate of 6.15% in 2007–2018. There is a strong positive correlation between the EIR and CO2 emissions. This result is in line with the study of Guo Li, and he believes that energy efficiency in the mining and extraction-related sector has not translated into CO2 emission reduction in China and Nigeria [2]. The greater the EIR is, the greater the net energy effect, which always means more CO2 emissions, will be. This correlation is due to two reasons: The first reason is the price crowding-out effect. An increase in the EIR leads to a decrease in price, which stimulates an increase in energy consumption and, ultimately, an increase in total CO2 emissions. The second reason is the scale expansion effect. According to the definition of the EIR, an increase in net energy means an increase in energy flow efficiency. More energy flow efficiency can support sustained economic expansion, which incurs an increase in total energy consumption and CO2 emissions. Furthermore, coal is the most important energy commodity dominating the net energy effect.
The implications of the study results are as follows. The decreases in energy intensity and the marginal cost of energy in the economy are conducive to the increase in net energy. Increases in net energy may lead to an increase in total energy consumption, indirectly increasing the amount of CO2 emissions. Therefore, in the case of a low-carbon transition, policymakers should monitor the net energy effect to prevent the price crowding-out effect and scale expansion effect from offsetting efforts to reduce energy intensity. As a result, reducing the emission coefficient by adjusting energy structure can be a more effective way to achieve a low-carbon transition than adjusting energy density. On the one hand, reducing energy intensity will cause the price crowding-out effect and scale expansion effect. On the other hand, economic development needs energy input, and it is becoming more and more difficult to reduce CO2 emissions by relying on the energy intensity effect. However, the energy structure effect just pulls the CO2 emissions down by −0.37% annually. There is greater potential to reduce CO2 emissions by adjusting the energy structure. In view of this, policymakers need to provide more policies promoting energy structure adjustment.

Author Contributions

J.C. contributed to the conceptualization, formal analysis, funding acquisition, project administration, supervision, and writing—review and editing of this paper. S.W. contributed to the conceptualization, data curation, formal analysis, methodology, validation, visualization, and writing—review and editing of this paper, as well as data curation, investigation, software, and resources for the writing of this paper. All authors have read and agreed to the published version of the manuscript.

Funding

This research was funded by Ministry of Natural Resources of the People’s Republic of China, grant number 121102000000180047.

Acknowledgments

We would like to acknowledge the valuable suggestions from Xiangyun Gao and Shupei Huang.

Conflicts of Interest

The authors declare no conflict of interest.

References

  1. Feleki, E.; Vlachokostas, C.; Moussiopoulos, N. Characterisation of sustainability in urban areas: An analysis of assessment tools with emphasis on european cities. Sustain. Cities Soc. 2018, 43, 563–577. [Google Scholar] [CrossRef]
  2. Li, G.; Zakari, A.; Tawiah, V. Energy resource melioration and CO2 emissions in China and Nigeria: Efficiency and trade perspectives. Resour. Policy 2020, 68, 101769. [Google Scholar] [CrossRef]
  3. Ortega-Ruiz, G.; Mena-Nieto, A.; García-Ramos, J.E. Is India on the right pathway to reduce CO2 emissions? Decomposing an enlarged Kaya identity using the LMDI method for the period 1990–2016. Sci. Total Environ. 2020, 737, 139638. [Google Scholar] [PubMed]
  4. Yang, J.; Cai, W.; Ma, M.; Li, L.; Liu, C.; MA, X.; Li, L.; Chen, X. Driving forces of China’s CO2 emissions from energy consumption based on Kaya-LMDI methods. Sci. Total Environ. 2020, 711, 134569. [Google Scholar] [CrossRef]
  5. Ang, B.W. LMDI decomposition approach: A guide for implementation. Energy Policy 2015, 86, 233–238. [Google Scholar] [CrossRef]
  6. Ang, B.W. The LMDI approach to decomposition analysis: A practical guide. Energy Policy 2005, 33, 867–871. [Google Scholar] [CrossRef]
  7. Paul, S.; Bhattacharya, R.N. CO2 emission from energy use in India: A decomposition analysis. Energy Policy 2004, 32, 585–593. [Google Scholar]
  8. Cai, R.-G.; Kim, S. First law of thermodynamics and Friedmann equations of Friedmann-Robertson-Walker universe. J. High Energy Phys. 2005, 2005, 050. [Google Scholar] [CrossRef] [Green Version]
  9. Gale, D. The law of supply and demand. Math. Scandin. 1955, 3, 155–169. [Google Scholar] [CrossRef] [Green Version]
  10. Odum, H.T. The energy ethic. (Book reviews: Environment, power, and society). Science 1971, 172, 664–666. [Google Scholar]
  11. Hall, C.A.; Cleveland, C.J. Petroleum drilling and production in the United States: Yield per effort and net energy analysis. Science 1981, 211, 576–579. [Google Scholar] [CrossRef] [PubMed]
  12. Cleveland, C.J.; Costanza, R.; Hall, C.A.S.; Kaufmann, R. Energy and the US economy: A biophysical perspective. Science 1984, 225, 890–897. [Google Scholar] [CrossRef] [PubMed] [Green Version]
  13. Ulgiati, S.; Brown, M.T. Monitoring patterns of sustainability in natural and man-made ecosystems. Ecol. Model. 1998, 108, 23–36. [Google Scholar] [CrossRef]
  14. Brown, J.H.; Burger, J.R.; Burnside, W.R.; Chang, M.; Davidson, A.D.; Fristoe, T.S.; Hamilton, M.J.; Hammond, S.T.; Kodric-Brown, A.; Mercado-Silva, N.; et al. Macroecology meets macroeconomics: Resource scarcity and global sustainability. Ecol. Eng. 2014, 65, 24–32. [Google Scholar] [CrossRef] [PubMed] [Green Version]
  15. Brown, J.H.; Burnside, W.R.; Davidson, A.D.; DeLong, J.P.; Dunn, W.C.; Hamilton, M.J.; Mercado-Silva, N.; Nekola, J.C.; Okie, J.G.; Woodruff, W.H.; et al. Energetic limits to economic growth. BioScience 2011, 61, 19–26. [Google Scholar] [CrossRef]
  16. Tainter, J. The Collapse of Complex Societies; Cambridge University Press: Cambridge, UK, 1988. [Google Scholar]
  17. Tainter, J.A. Energy, complexity, and sustainability: A historical perspective. Environ. Innov. Soc. Transitions 2011, 1, 89–95. [Google Scholar] [CrossRef]
  18. Tainter, J.A. Energy and existential sustainability: The role of reserve capacity. J. Environ. Account. Manag. 2013, 1, 213–228. [Google Scholar] [CrossRef]
  19. Kander, A.; Stern, D. Economic growth and the transition from traditional to modern energy in Sweden. Energy Econ. 2014, 46, 56–65. [Google Scholar] [CrossRef] [Green Version]
  20. Stern, D.I.; Kander, A.J. The role of energy in the industrial revolution and modern economic growth. Int. Assoc. Energy Econ. 2012, 33, 125–152. [Google Scholar] [CrossRef] [Green Version]
  21. Cleveland, C.J.; Kaufmann, R.K.; Stern, D.I. Aggregation and the role of energy in the economy. Ecol. Econ. 2000, 32, 301–317. [Google Scholar] [CrossRef]
  22. King, C.W.; Maxwell, J.P.; Donovan, A. Comparing world economic and net energy metrics, part 1: Single technology and commodity perspective. Energies 2015, 8, 12949–12974. [Google Scholar] [CrossRef] [Green Version]
  23. Kojima, M.; Bacon, R. Changes in CO2 Emissions from Energy Use: A multicountry Decomposition Analysis; World Bank Group: Washington, DC, USA, 2009. [Google Scholar]
  24. Azadeh, A.; Amalnick, M.S.; Ghaderi, S.F.; Asafzadeh, S.M. An integrated DEA PCA numerical taxonomy approach for energy efficiency assessment and consumption optimization in energy intensive manufacturing sectors. Enegy Ploicy 2007, 35, 3792–3806. [Google Scholar] [CrossRef]
  25. Misra, A.; Haydock, H. Energy Efficiency Policies and Measures in UK ODYSSEE-MURE 2012; AEA Technology Plc.: Harwell, UK, 2012. [Google Scholar]
  26. Tang, X.; Snowden, S.; Höök, M. Analysis of energy embodied in the international trade of UK. Energy Policy 2013, 57, 418–428. [Google Scholar] [CrossRef] [Green Version]
  27. Minx, J.C.; Baiochhi, G.; Wiedmann, T.; Barrett, J. Understanding Changes in UK CO2 Emissions 1992–2004: A Structural Decomposition Analysis; Stockholm Environment Institute and Durham Business School: London, UK, 2009. [Google Scholar]
  28. Ang, B.; Xu, X. Tracking industrial energy efficiency trends using index decomposition analysis. Energy Econ. 2013, 40, 1014–1021. [Google Scholar] [CrossRef]
  29. Hammond, G.; Norman, J. Decomposing Changes in the Energy Demand of UK Manufacturing. In 23rd International Conference on Efficiency, Cost, Optimization, Simulation and Environmental Impact of Energy (ECOS2010); Favrat, D., Marechal, F., Eds.; ECOS: Lausanne, Switzerland, 2010; pp. 395–402. [Google Scholar]
  30. Liu, F.; Ang, B. Eight methods for decomposing the aggregate energy-intensity of industry. Appl. Energy 2003, 76, 15–23. [Google Scholar] [CrossRef]
  31. Ang, B.; Huang, H.; Mu, A. Properties and linkages of some index decomposition analysis methods. Energy Polciy 2009, 37, 4624–4632. [Google Scholar] [CrossRef]
  32. Hoekstra, R.; Van den Bergh, J.C. Comparing structural decomposition analysis and index. Energy Econ. 2003, 25, 39–64. [Google Scholar] [CrossRef]
  33. Acemoglu, D.; Robinson, J.A. Why Nations Fail: The Origins of Power, Prosperity and Poverty; Crown Books; Crown Business: New York, NY, USA, 2012. [Google Scholar]
  34. Hall, C.A.S. Congratulations to Carey King. Environ. Res. Lett. 2012, 7, 011006. [Google Scholar] [CrossRef]
  35. King, C.W. Energy intensity ratios as net energy measures of United States energy production and expenditures. Environ. Res. Lett. 2010, 5, 044006. [Google Scholar] [CrossRef]
  36. Guilford, M.C.; Hall, C.A.S.; O’Connor, P.; Cleveland, C.J.; Connor, P.O. A new long term assessment of energy return on investment (EROI) for US oil and gas discovery and production. Sustainability 2011, 3, 1866–1887. [Google Scholar] [CrossRef] [Green Version]
  37. Cleveland, C.J. Net energy from the extraction of oil and gas in the United States. Energy 2005, 30, 769–782. [Google Scholar] [CrossRef]
  38. Ang, B.W. Decomposition analysis for policymaking in energy: Which is the preferred method? Energy Policy 2004, 32, 1131–1139. [Google Scholar] [CrossRef]
  39. King, C.W. An integrated biophysical and economic modeling framework for long-term sustainability analysis: The HARMONEY model. Ecol. Econ. 2020, 169, 106464. [Google Scholar] [CrossRef]
Figure 1. Cumulative change of CO2 emissions in 2007–2018.
Sustainability 12 06925 g001
Figure 2. Compound annual growth rate of CO2 emissions in 2007–2018.
Sustainability 12 06925 g002
Figure 3. Energy intensity ratio (EIR) of commodities and the net energy effect.
Sustainability 12 06925 g003
Figure 4. EIR of oil and oil prices.
Sustainability 12 06925 g004
Figure 5. EIR of coal and coal prices.
Sustainability 12 06925 g005
Figure 6. EIR of natural gas and natural gas prices.
Sustainability 12 06925 g006

