Article

Using Characteristic Energy to Study Rural Ethnic Minorities’ Household Energy Consumption and Its Impact Factors in Chongqing, China

1
School of Economics and Management, Shaanxi University of Science &Technology, Xi’an 712000, China
2
State Key Laboratory of Urban and Regional Ecology, Research Center for Eco-Environmental Sciences, Chinese Academy of Sciences, Beijing 100085, China
*
Authors to whom correspondence should be addressed.
Sustainability 2020, 12(17), 6898; https://doi.org/10.3390/su12176898
Submission received: 22 July 2020 / Revised: 9 August 2020 / Accepted: 17 August 2020 / Published: 25 August 2020
(This article belongs to the Section Energy Sustainability)

Abstract

:
In the context of general household energy transition, identifying different household energy consumption patterns is of great significance for the formulation of refined energy conservation and emission reduction policies. For historical reasons, the households of ethnic minorities in China tend to face more severe energy poverty problems. In this study, we proposed the concept and research method of characteristic energy, a new method to depict household energy use pattern. Combined with the diversity analysis, the energy use pattern of Tujia and Miao rural households in Chongqing, China, were studied. Households in research area were clustered into four groups with different characteristic energy sources: firewood, electricity, coal and gasoline, representing four types of household energy use pattern. The main impact factors of rural household energy use pattern are electrical appliances and amount of pig raising, indicating that household production and lifestyle play a decisive role in household energy use patterns. In addition, the research depicts the energy consumption characteristics of rural households with different incomes, ethnic groups and in different regions. The study puts forward corresponding energy saving countermeasures for different energy use pattern, helps to identify the heterogeneity of rural household energy use and promote the formulation of refined regional energy conservation and emission reduction policies.

1. Introduction

Since the reform and opening up, the total energy consumption of households in China has continued to increase, as well as the proportion of commercial energy such as coal and electricity consumption. However, traditional biomass energy like firewood and straw still accounts for a large proportion of energy use in rural households [1]. With the deepening of urbanization, the household energy use pattern of rural residents has undergone profound changes. As the pressure on global warming continues to increase, the importance of refined energy management is increasing. In the context of general household energy transition [2], identifying different household energy consumption patterns is of great significance in the formulation of refined energy conservation and emission reduction management policies.
Household energy consumption is closely relevant to their socio-cultural context [3]. Significant differences are found in behavior, energy consumption, and energy, efficiency existing by racial/ethnic household composition [4]. Due to historical reasons, ethnic minorities in China, especially ethnic minority farmers, tend to inhabit rural areas in less developed regions and face more severe energy poverty problems. For these families, a quantitative study of the impact of its unique living and cultural characteristics on its energy consumption pattern and carbon emissions is rare. An understanding of the energy consumption pattern of ethnic minority households can facilitate not only energy saving of these families, but also the alleviation of ethnic minorities’ energy poverty and the realization of social equity in a rapidly growing but unbalanced developed society.
With the deepening of urbanization, the household energy use pattern of rural households has undergone profound changes [5]. In order to understand household energy pattern in depth, scholars proposed a series of models to describe household energy use pattern and its transition process, such as the energy ladder hypothesis, multiple energy use models, and energy demand ladders. The traditional energy ladder hypothesis states that the (household) energy use would transit from traditional biomass to clean, highly efficient, modern energy with economic development [6]. However, due to the need for different energy sources to meet different living needs such as lighting, cooking, and transportation, households rarely adopt energy utilization strategies that use a single energy source. In modern society, as energy can only be partially replaced, the situation that low-income households using only traditional biomass energy or high-income households using only electrical energy is rare [7]. More and more empirical studies show that households have multiple energy options, whether to meet specific or various energy needs [8]. The multiple energy use model holds that households choose to consume a portfolio of energy options that, at different points along the energy ladder and the process of households using multiple fuels at the same time, was described as fuel stacking [9]. The model emphasizes the diversity of energy choices under specific needs. Energy demand theory describes the diversity of household energy use in practical from the perspective of energy demand [10]. According to the theory, it is a ladder of energy demand rather than fuel preferences that determine fuel choice. For example, in household energy use, household appliances are driven by electricity, and many vehicles can only use gasoline. Multiple energy demands determine the diversity of household energy use. In summary, due to the diversity of energy demand and the partial substitution of energy sources, household energy use pattern is diverse. With the need to ensure the growing energy demand of residents, the diversified household energy use pattern pose a challenge to the formulation of effective energy-saving policies.
Comparing with the diversity of household energy use pattern, methods to represent household energy use pattern is simple, including listing each component of household energy consumption [11] or using binary variables based on the properties of energy (commercial or non-commercial [12], biomass or non-biomass [13], polluting or clean energy [14], etc. Lacking conciseness, the former method is hard to use in further analysis while the latter neglects detailed energy utilization characteristics of combined energy type. New methods to depict household energy use pattern that can emphasis the diversity of household energy consumption as well as facilitate further analysis, for example, impact factor analysis, were required.
Based on the context, the research proposed following questions and try to explore answers through empirical study on Tujia and Miao minorities in Chongqing, China. The following are proposed questions: (1) How do ethnic minority rural households consume energy and what factors would affect their energy use pattern? (2) Is there a method for characterizing household energy structure that combines simplicity and take diversity of household energy use into consideration, and at the same time facilitates further analysis? (3) Are there differences in household energy use among different incomes, ethnic groups, and regions? In this study, we proposed the concept and research method of characteristic energy, a new method to depict household energy use pattern. Combining characteristic energy and diversity analysis of household energy use, household energy use pattern, impact factors and energy saving countermeasures of Tujia and Miao ethnic minorities in Chongqing, China, were studied.

2. Materials and Methods

2.1. Study Area

Chongqing is located in the center of southwestern China (28°10′–32°13′ N, 105°11′–110°11′ E). It has a subtropical monsoon humid climate, with extremely hot summers and cold, humid winters. With the elevation difference of 2723.7 m, the mountain area in Chongqing reaches 75.8% [15] and the vegetation coverage is 20.49% [16]. Chongqing is chosen because it is the only municipality in China that has national autonomous areas and its ethnic composition is neither as complex as other multi-ethnic provinces nor as simple as regions with no autonomous area, which makes it suitable for the study of cultural impact on ethnic minorities’ household energy use pattern. To take the influence of cultural factor into consideration, the study selected two ethnic minorities: Tujia and Miao living in national autonomous regions, Pengshui, Xiushan, Youyang County and in non-national autonomous regions, Wulong, Qianjiang County, in Chongqing, China, as research objects. Tujia and Miao are two major minorities in Chongqing. The Tujia families have the custom of setting up fire ponds for heating, lighting and cooking at home in order to spend the cold winter. The surrounding areas of the fire ponds have become the main space for Tujia families to socialize and entertain. Although clean and convenient modern energy sources are available, Tujia families in rural areas still retain the custom of burning firewood in fire ponds. Miao and Han families living close to them are also affected by this custom to varying degrees.

2.2. Data Acquisition

A stratified sampling method is adopted in this study to decide investigated households. At first, all national autonomous counties in Chongqing were chosen as target counties except Shizhu County, which does not have enough Miao households. Two non-national autonomous regions with Tujia and Miao minorities live in were selected for further comparison analysis. Then, four villages in each county were selected according to their altitude and distance to the county center. Above 20 Tujia and Miao households were random investigated in each village. Finally, a total of 415 valid household questionnaires were collected. Through household questionnaire surveys during January to March in 2018, we investigated target households’ energy use in 2017 and potential impact factors under the permission of the respondents. The energy use data are converted into standard coal for further analysis (see Table S1 for coal conversion factor [17]). Nineteen potential variables that affect the household energy use were screened according to the literature (Table 1). The basic family characteristics and rural household energy consumption is shown in Tables S2 and S3 for the conciseness of context.

2.3. Data Analysis

2.3.1. Households Categorization

As household energy use pattern is unclear before the analysis and energy use mechanism is ambiguous, methods require an a priori specification of the model underlying the analyzed phenomenon is not suitable in the study [18]. Thus, an unsupervised self-organizing mapping model (SOM) and hierarchical clustering method are chosen to categorize household’s energy consumption pattern in this study. The SOM is a low-dimensional (usually two-dimensional), discrete represented artificial neural network (ANN) that uses unsupervised learning to generate the input space for training samples [19]. It can present the features of high-dimensional data in two-dimension space which enable us to illustrate household energy consumption and its diversity in the study. We did not choose a commonly used top-down categorization method, like group households by their ethnicity, to study their energy use pattern. Rather, SOM is a bottom-up categorization method that can keep more information of energy use pattern which would be easily obscured in top-town categorization methods. Based on the proportion of each energy type family consumes, the study clustered families with similar energy consume structure into four categories using representing four types of household energy use pattern (Type I, Type II, Type III, and Type IV). The proportion of household energy use is square root transformation to down-weight influence of the most abundant energy type. In the study, SOM not only reduced the eight-dimensional household energy use data, but also illustrated the similarity of household energy use with spatial proximity.

2.3.2. Impact Factors of Household Energy Use

We used the classification in random forests as a discriminant analysis method to determine the impact factors of the household energy use pattern. Random forest is a boosted tree method that suitable for discriminant analysis for both continuous and categorical variables. It prevents overfitting in classification and regression trees, and releases the strict requirements of data independence and normality in traditional linear methods [20]. In the process of identifying impact factors, primary pseudo R2 and out-of-bag (OOB) error rate of models with all environmental variables included were first calculated. Variables were then stepwise deleted according to their importance (from low to high), and variables included in the optimal model were regarded as impact factors of household energy use pattern. Pseudo R2 and OOB error rate are indicators that evaluate the robustness of the method in this progress.

2.3.3. Characteristic Energy Sources

In this study, we proposed the concept and research method of characteristic energy source to depict major characteristics of different energy use patterns. The concept and research method are borrowed from an ecological concept, indicator species. Indicator species is an organism whose presence, absence or abundance reflects a specific environmental condition [21]. Correspondingly, characteristic energy is one of the energy types that household consumes that reflects certain social, cultural and economic condition that is relevant to energy consumption. Like indicator species, we use indicator value (IV), which contains specificity and fidelity, to find the characteristic energy sources. Here, specificity refers to the probability that families use a certain kind of energy in the target family group, and fidelity refers to the probability of families using a certain energy type to that of all families using this energy. IV ranges from 0 to 1; larger than IV implies a stronger indicative effect. The significance of IV was tested with Monte Carlo randomization tests. In permutation tests (1000 times), energy sources with p-Value <0.05 were considered as characteristic energy sources of their respective group.
A ij = I ij / I i
B ij = S ij / S j
IV ij = A ij × B ij
where A ij refers the specificity of energy form i to family group j. It is calculated as the relative abundance of energy i in family group j divided by the sum of the relative abundance of energy i in all family groups. I ij refers to the relative abundance of energy i in family group j, while I i is the sum of energy i’s relative abundance in all family groups. B ij reflects the fidelity of energy source i to family group j. It is calculated as the number of families in group j that use energy source i divided by the total family number in group j. S ij refers the number of families in group j that use energy source i, while S j refers the total family number in group j.
To calculate the diversity of household or family group energy use pattern, we used the Shannon–Weiner index, a commonly used diversity index to describe biodiversity in ecosystems in ecology study [22]. The calculation formula is as follows:
H = ( n i N ) ln ( n i / N )
When calculating household energy use diversity, ni refers the amount of certain energy form that family consumes; N refers the total energy amount that family consumes; here, i includes firewood, coal, LPG, gasoline, electricity, solar and biogas. When calculating the energy use diversity of family groups, ni refers the number of families that adopt the ith energy use type, while N refers the total number of families in this group; here, i refers four types of household energy use type (Type I, Type II, Type III and Type IV).
All statistical analyses were undertaken in R 3.3.3 [23]. “Kohonen” package was used for SOM and the following hierarchical clustering; “randomForest” package was used for random forest method and “indicspecies” package, which is used for indicator species analysis, was adopted to identify characteristic energy sources.

3. Results

3.1. Four Types of Ethnic Household Energy Use Pattern and Their Characteristic Energy Source

Families with similar energy consumption structure were clustered in a honeycomb pattern composed of 6 × 4 hexagons (Figure 1). The closer the hexagons are, the more similar the energy consumption structure of their internal families. Each hexagon represents one family set that has similar energy consumption structure. The circular sectors within each hexagon represent the relative abundance of each energy type. Larger sectors imply larger energy proportion in the corresponding family set. From bottom left to top right, the proportion of firewood in family sets increases gradually. On its diagonal, the proportion of electricity decreases gradually (top left to bottom right). Then, 24 family sets were clustered into four categories, representing four types of energy use pattern in the study area.
Table 2 shows the features of family sets with different characteristic energy sources. The energy consumption structure of most households in the study area belongs to the first energy use pattern category, Type I (302 households, 72.77%). The energy used by this type of households includes the combination of fuel wood and various energy sources. Characteristic energy of this type of energy use pattern is firewood. Fidelity value (B) of firewood to Type I is 1, indicating that all households in this group use firewood. The ratio of family firewood consumption amount to total firewood consumption in the study area is 0.656 (A), which represents the specificity of firewood in this group. The IV value of firewood for this group is 0.81, which has a high degree of significance (p = 0.005). The second type of household energy consumption is a combination of electrical energy, solar energy and other energy types, including 76 households (18.31%). The characteristic energy of this type of energy use pattern is electric energy (p = 0.005, IV = 0.680). All households in this group use electricity, but, due to the high popularity of electricity in all households, electricity has a relative low fidelity to the group (B = 0.462). The third type of household mainly uses coal and electricity, and consumes a small amount of solar energy and gasoline. The family number in this category is small (12 households, 2.89%). Characteristic energy of the third type of energy consumption structure is coal (p = 0.005, IV = 0.943). The fidelity value of coal to this category is 1, and the specificity value is as high as 0.890, indicating that all households in this category use coal. The characteristic energy source of the fourth type of household energy use pattern is gasoline (p = 0.005, IV = 0.819), with 25 households in this category (6.02%). Gasoline has a fidelity of 1 to this group and a specificity of 0.671. For the four groups, B is constant at 1. This is because all families in each group use the selected characteristic energy source, indicating high fidelity of characteristic energy sources. The variance of A among groups is because these energy sources may also be used by families in other groups.
On average, households with Type IV energy use pattern consume the largest amount of energy, followed by households with Type I and Type III energy use patterns. Households with energy use pattern Type II consume the lowest energy amount. The standard deviation for the total energy consumption follows the same trend as the average total energy. In general, the standard deviation of household energy consumption is large, indicating large deviation of household energy consumption amount within energy use pattern.

3.2. Energy Pattern at Different Income Levels

As Figure 2 shows, as the income level of rural households increases, the proportion of households whose energy use pattern belongs to Type I reduced. Low-income households choose to spend more collection time to obtain free biomass energy. Correspondingly, the proportion of households whose energy use pattern is Type II, Type III and Type IV increased. Only households with energy use pattern characterized by electricity (Type II) had slightly lower proportion in middle-level income than that in lower-income families. Overall, among all income level, Type I is the dominant energy use type. It may be explained by the low-income level and high vegetation cover of the study area. Even in high-income households, the proportion of households with this energy type is more than half (55.56%). Among low-income households, the proportion is as high as 86.59%. Type II energy consumption structure ranks second in importance. Among low-income families, the proportion of households with Type II energy consumption structure is 9.76%, while among high-income households, this proportion rises to 29.63%. Type III and Type IV take a small proportion in researched families and, even in high-income families, they account for less than 10% in all energy consumption types (6.17% and 8.64%).
The average total energy consumption of households in the study area rises first and then falls and reaches the peak at the middle-income level (4431.48 kgce) with income increases. Household energy use pattern in study area present to be diversified. Within the family categories, energy use diversity increases from Type I to Type IV (H(Type I) = 0.22, H(Type II) = 0.33, H(Type III) = 0.36, H(Type IV) = 0.47). With income increase, the diversity of energy use pattern increases first and then falls, indicating that the households energy use pattern options changes from increase to stable(H(Low income) = 0.53, H(Relative low income) = 0.64, H(Middle income) = 0.66, H(High income) = 0.63).

3.3. Impact Factors and Household Characteristics of Household Energy Use Pattern

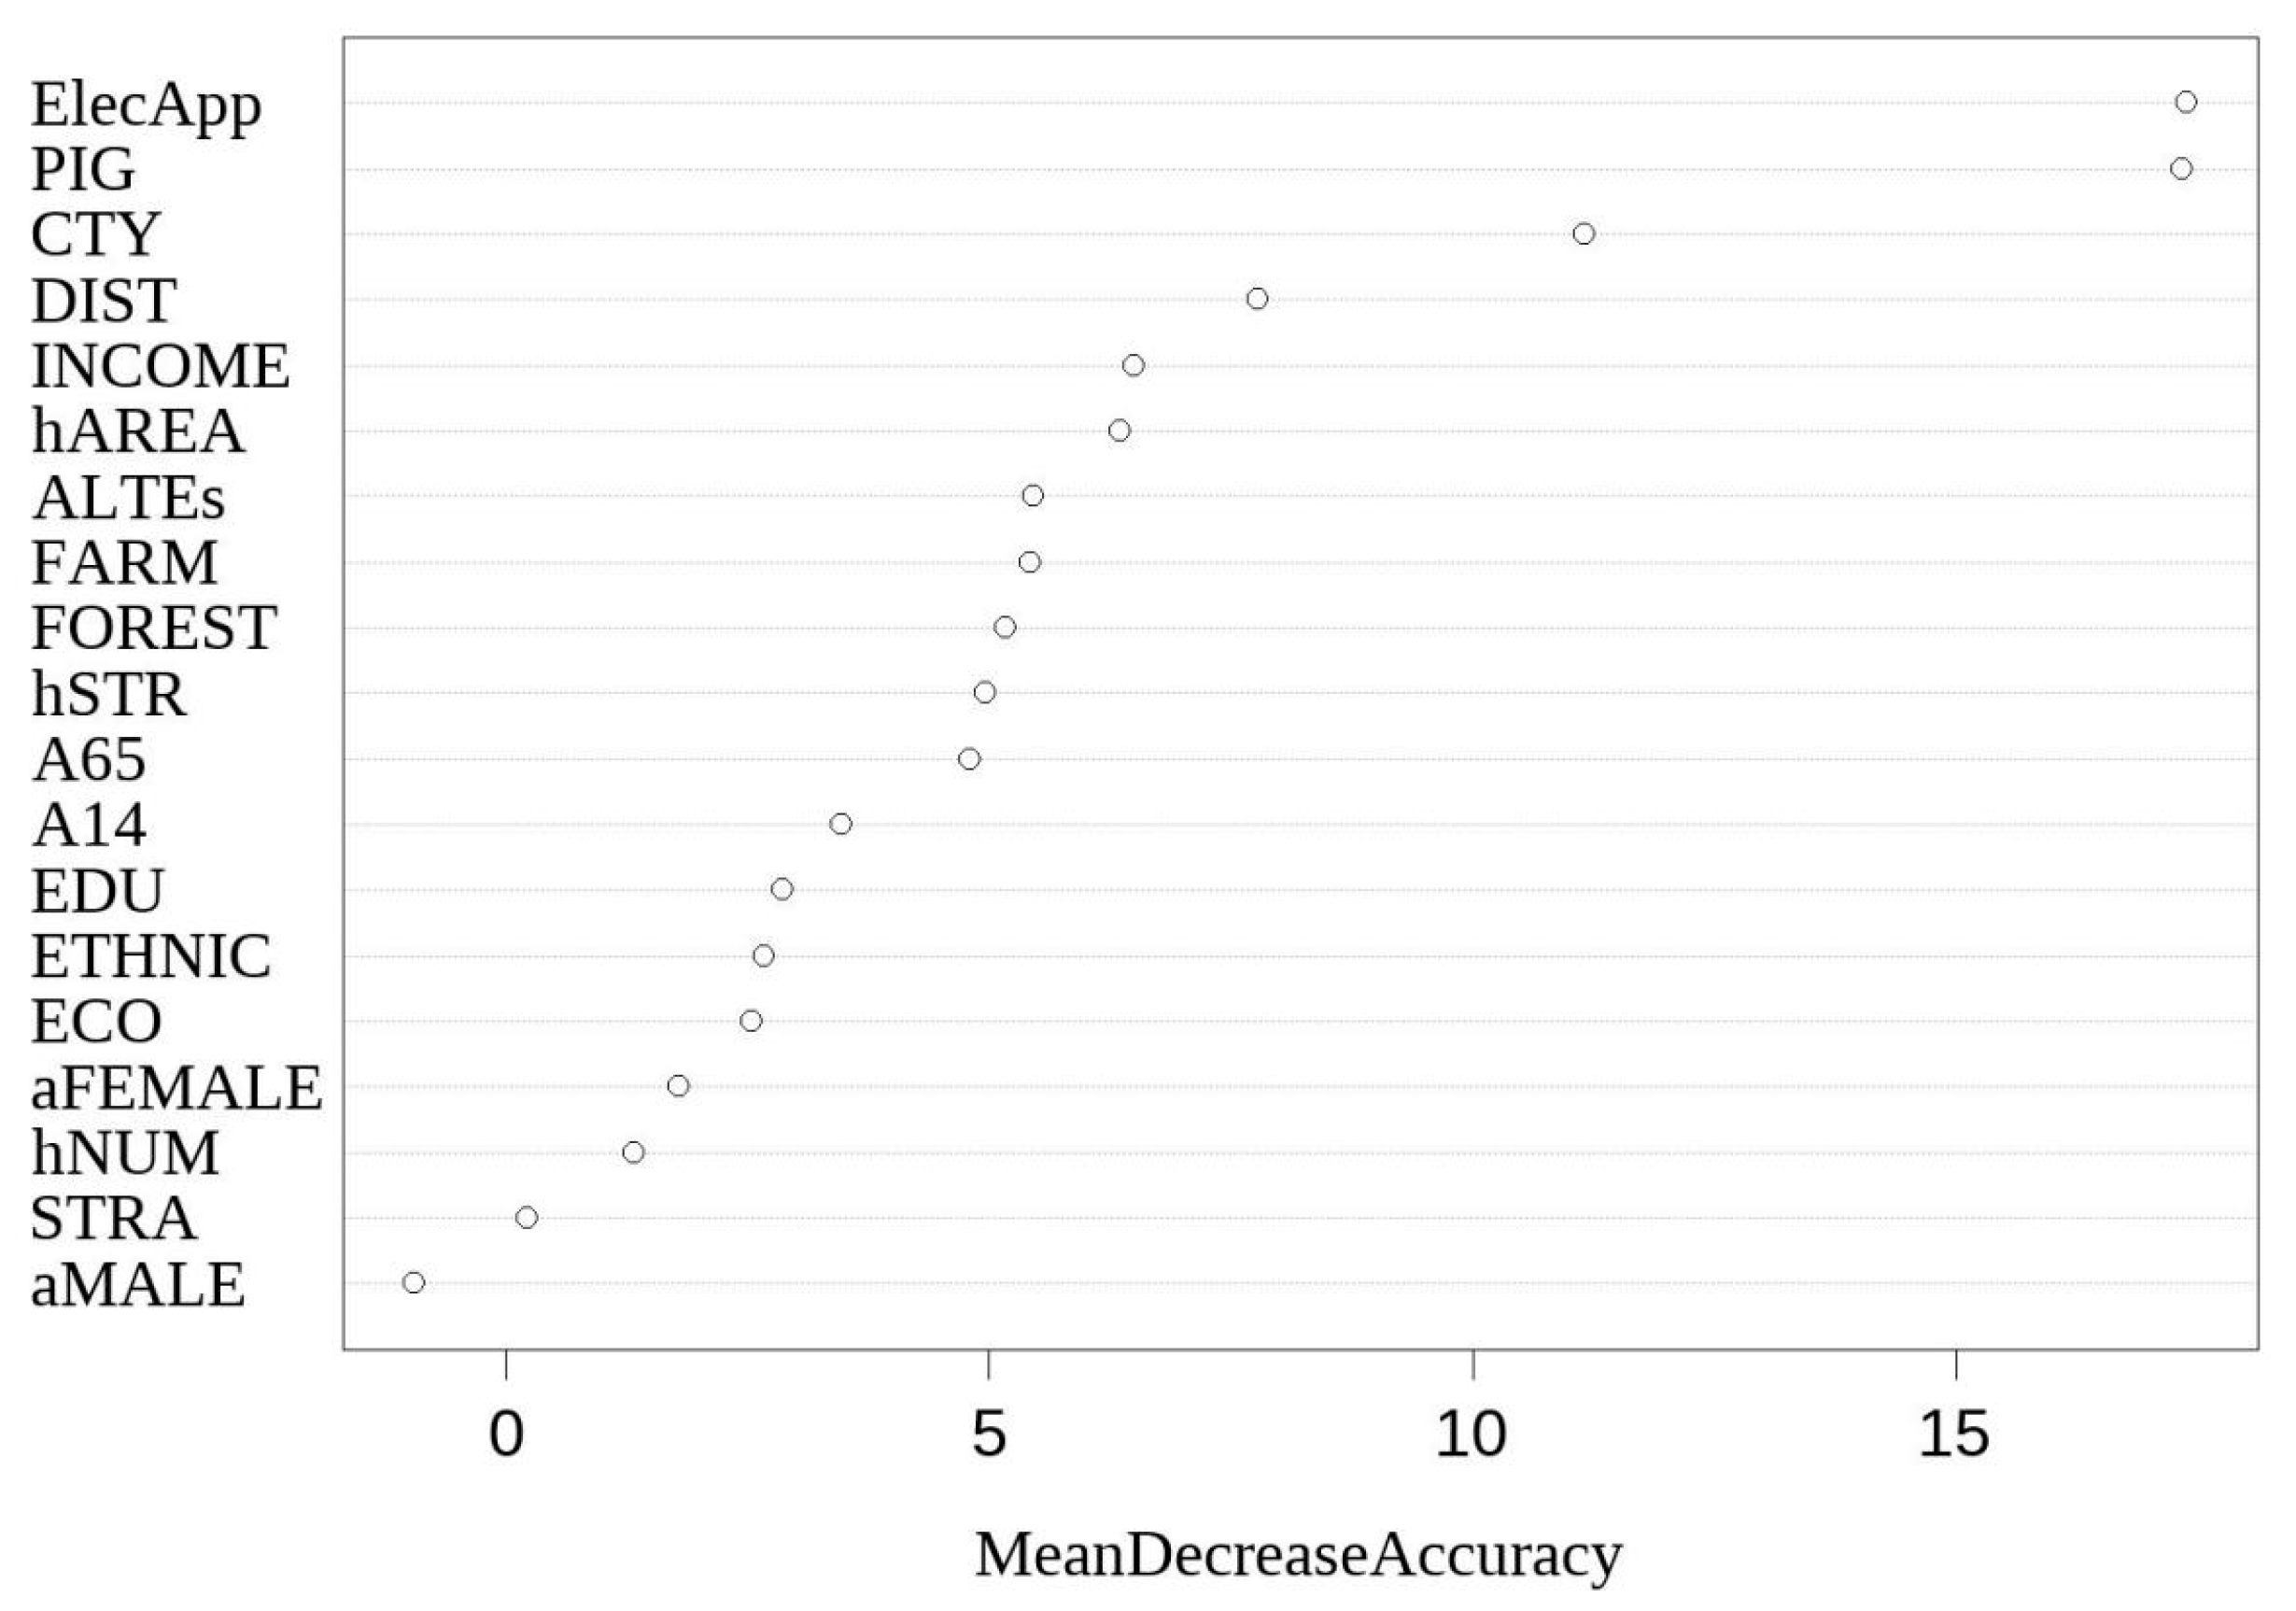
Nineteen potential impact factors of household energy use including ethnicity are examined in this study according to the random forest analysis. Figure 3 shows the contribution of these variables to the family categorization. In Figure 3, the mean decrease in accuracy represents the importance of each variable to the classification. Variables are ranked from top to bottom according to their importance. However, only the top two variables ElecApp and PIG were screened as important to household energy use pattern. The OOB error rate of these two variables is 24.57%. In this study, the OOB error rate of the model with variable ElecApp and PIG is the lowest and is equal to the model that all variables were included, which means that the two variables have the same explanatory power with all variable and the error level is reasonable [24].
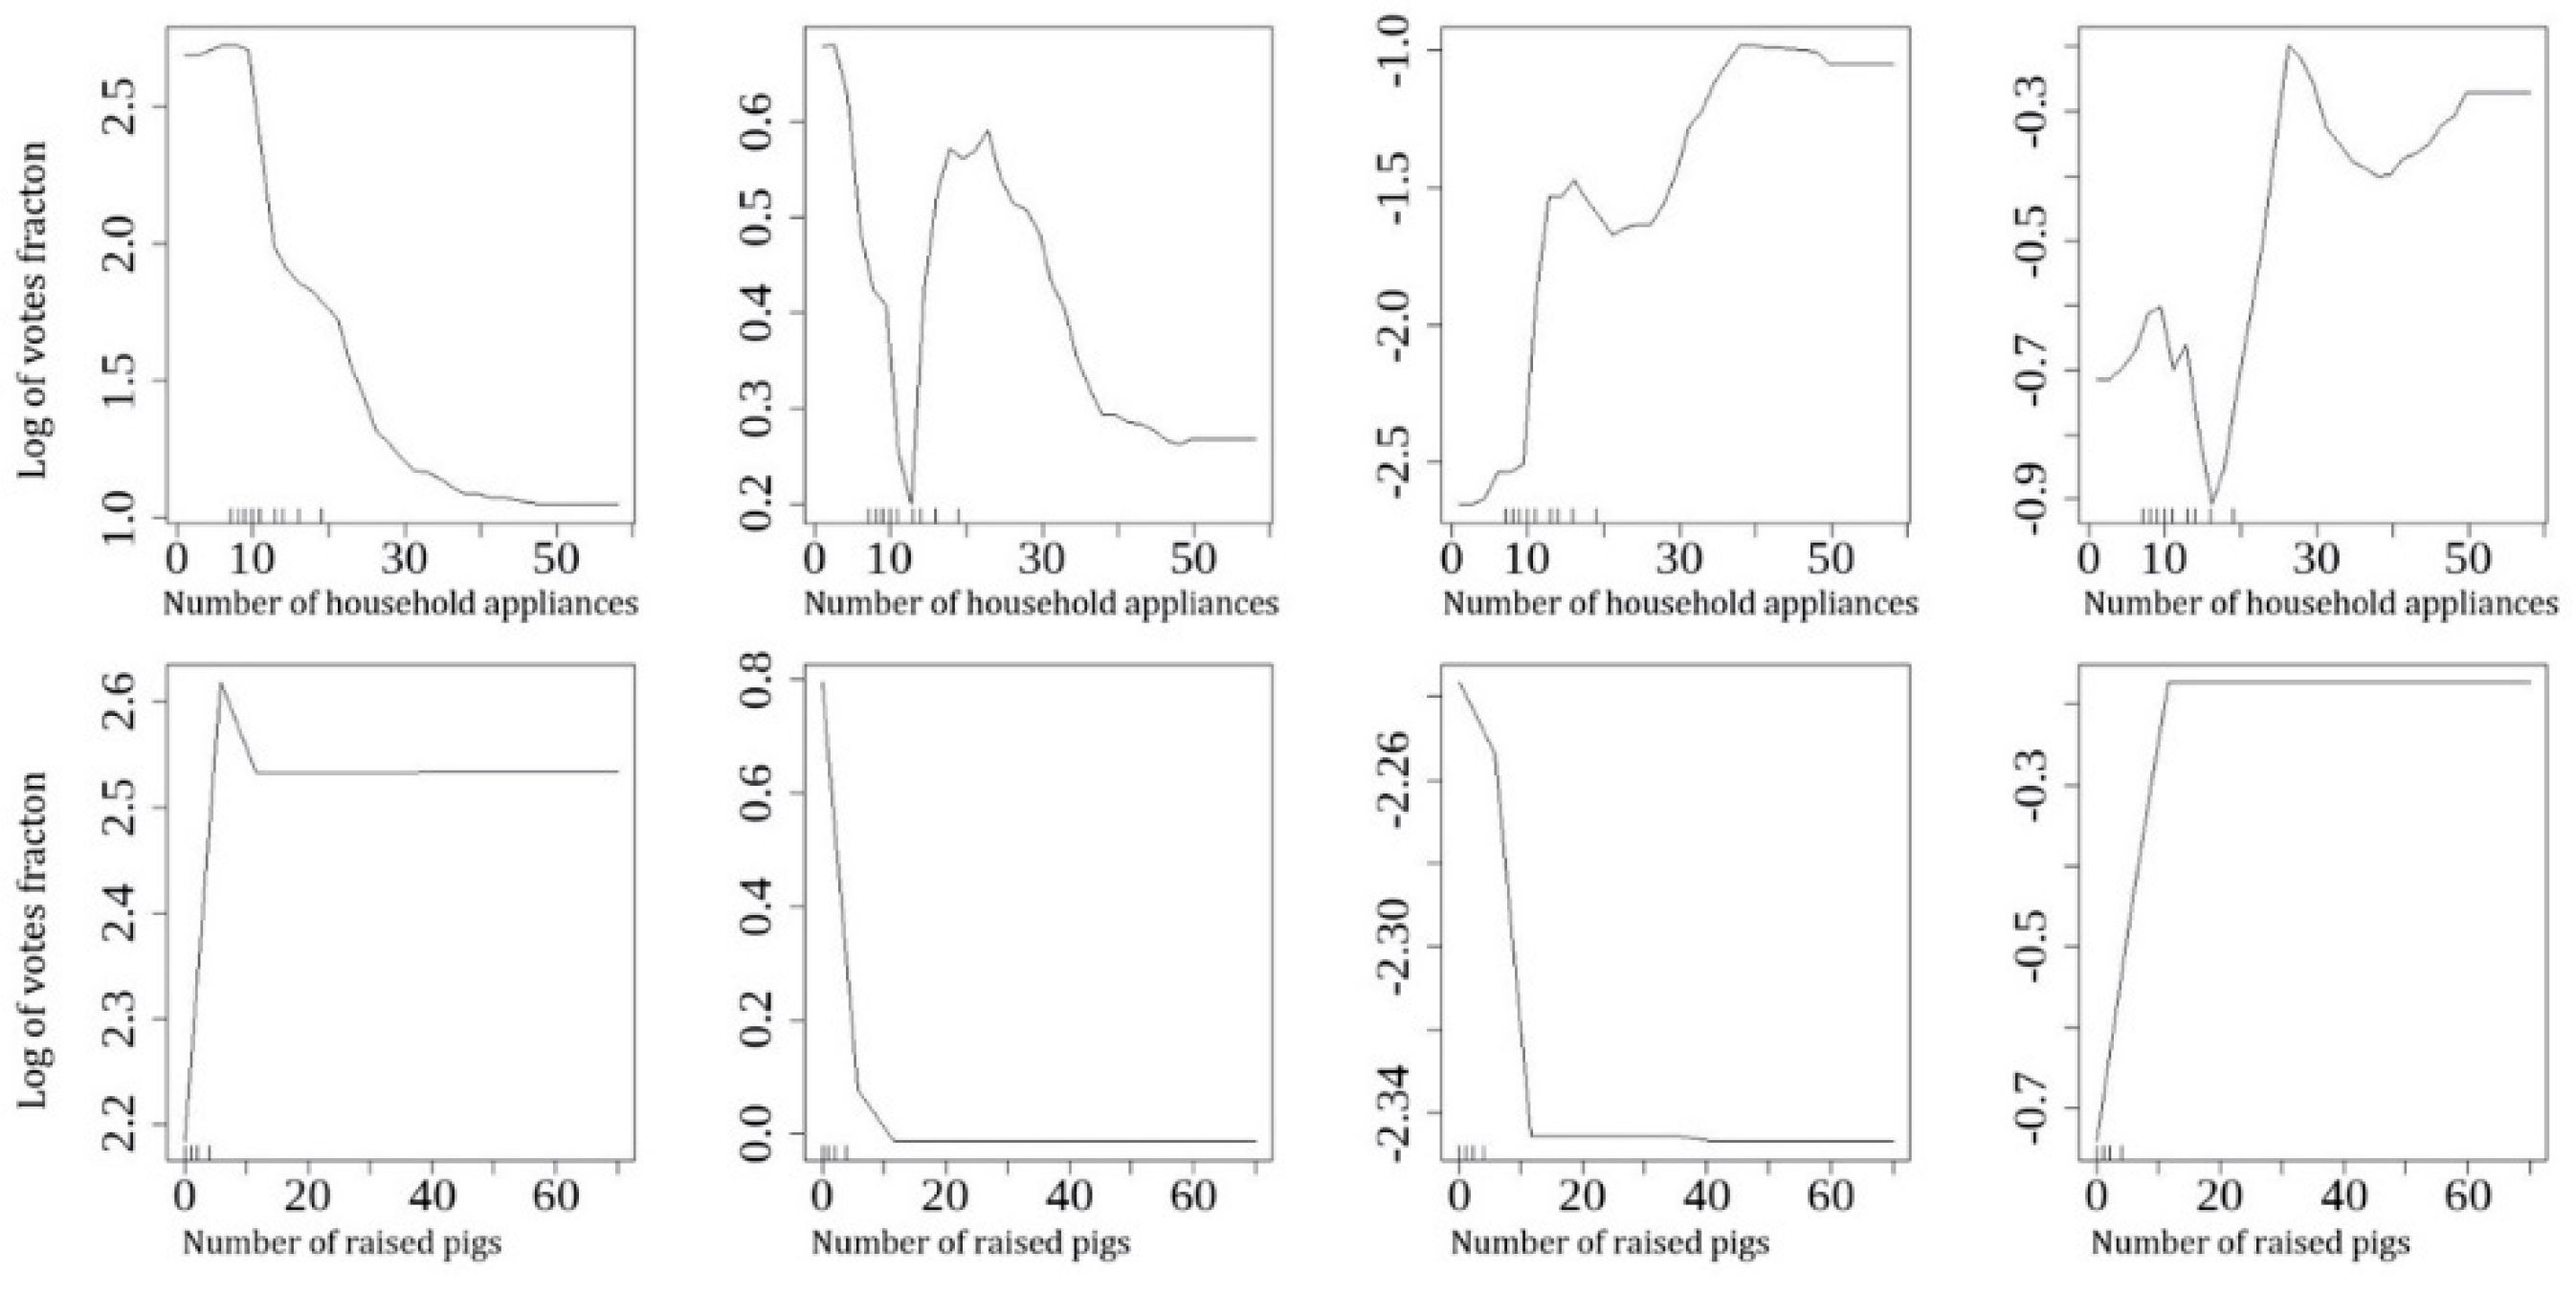
Figure 4 shows the results of partial correlation analysis of selected variables based on partial dependence plot for categorical features under random forest method [25]. The matrix in Table 3 summarizes the results of Figure 4 and points out the main factors that distinguished each energy pattern type. The results show that Type I households have a few electrical appliances and keep a large number of pigs. The characteristic energy of this type of household is firewood. Cooking pig food is a traditional breeding method for rural families in Chongqing, China. More pig breeding means more consumption of firewood for cooking pig food. Due to the low efficiency of burning firewood, feeding pigs would lead to a high total energy consumption (4635 kgce). Type II households are characterized by electricity. Although they keep more appliances than Type I households, they raised the least pigs. Thus, their firewood energy consumption is very low, resulting in the lowest total energy consumption (1887 kgce). Different production lifestyles have caused differences in the ways in which households use energy. Type III households with coal as the characteristic energy and Type IV households with gasoline as the characteristic energy also maintain a high number of electrical appliances, but the Type IV family group raises more pigs than Type III households. Therefore, the household energy consumption of the Type IV household (8322 kgce) is much larger than that of the Type III household (3622 kgce).

4. Discussion

4.1. Using Characteristic Energy to Study Energy Use Patterns of Different Families

Using characteristic energy to represent household energy use pattern facilitates the explanation of energy transition with income, as well as the understanding of energy patterns within a group of households with arbitrary attributes (such as ethnic and region). Together with energy use diversity analysis, this method helps to the understanding of household energy consumption in depth.
Taking income for example, although it was not been selected as the main factors impact household energy use pattern in this study, characteristic energy and energy diversity help to the description and discovery of household energy use patterns characteristics at different income levels (Section 3.2). As results show, Type I energy use pattern, whose characteristic energy is firewood, plays an important role in all income levels and its proportion decreases with the increase of income. It is consistent with general analyses that traditional energy is still an important energy source in rural households in China [26]. The other three types with characteristic energy sources of electricity, coal, and gasoline increase with income increase. This result visualizes the transition progress of the energy structure with income increase in study area (Figure 2). The diversity of energy consumption structure can be used to measure the equilibrium degree of a group’s energy consumption structure. For a set of families, the diversity could be calculated by its composition of energy use pattern Equation (4). With higher income, the energy use pattern of family groups is more diverse and the proportion that various energy use pattern takes is more even. In the study area, the household energy consumption has not shifted to higher-order electricity as income increases, as in the energy ladder hypothesis [27]. To be precise, the number of households characterized by electricity is increasing. Combining the internal energy use structure (V15, V16, and V22) of Type IV households (Figure 1), it can be found that these households use multiple energy sources instead of single electricity. The diversity index of the highest-income family group also shows that such households have a high degree of energy diversity (H (High income) = 0.63). To test the validity of the Shannon-Weiner index, we calculated another commonly used diversity index, the Simpson diversity index (D) of family groups with different energy use patterns and income levels [22]. The results show similar trend of diversity within family groups in both energy use pattern (D(Type I) = 0.35, D(Type II) = 0.37, D(Type III) = 0.43, D(Type IV) = 0.44) and income level (D(Low income) = 0.31, D(Relative low income) = 0.38, D(Middle income) = 0.39, D(High income) = 0.38).
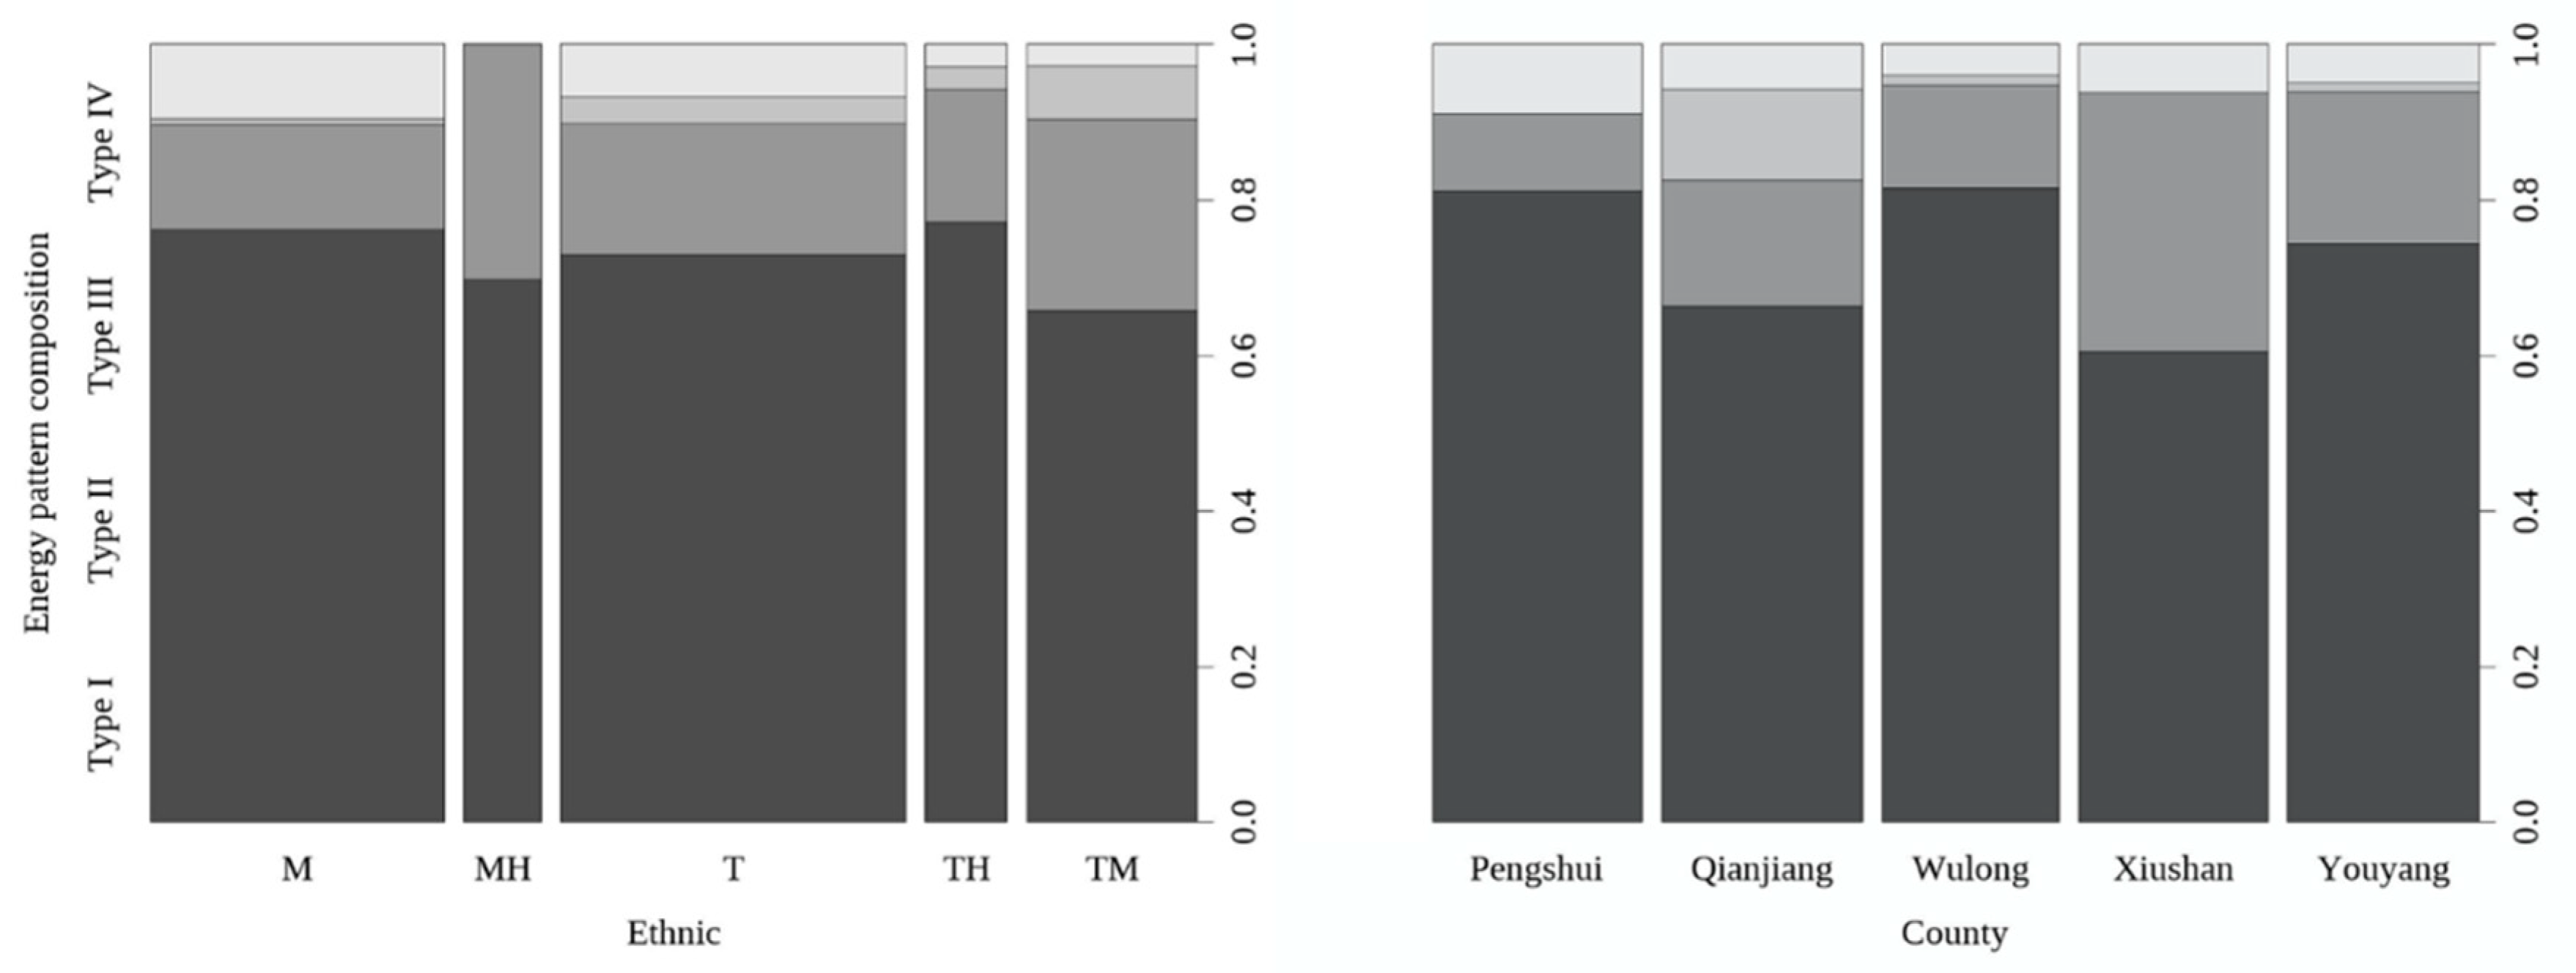
Figure 5 shows the energy use patterns of different ethnic families (left) and families in different counties (right). As results show, the energy use pattern of the Miao-Han families is the simplest, and they chose only Type I and Type II energy use pattern. The proportion of households with Type III energy use pattern in Tu-Miao families is higher than in other families. The random forest analysis did not screen ethnic and regional factors as impact factors of energy use pattern, implying that difference among energy patterns of different ethnic groups or regions is not significant. It may be attributed to the increasing intermarriage among ethnic groups [28].
For counties, there is no Type III energy use pattern in Pengshui County and Xiushan County families. Families in Wulong County and Liyang County share similar household use pattern. Type III energy use pattern takes the highest proportion in Qianjiang County among studied counties. The proportion of households using Type III energy is in line with the coal distribution in Chongqing.

4.2. Using Characteristic Energy to Study Impact Factors of Household Energy Consumption

Household energy choices are constrained by the nature of energy sources, the environment in which the family is located, and the internal circumstances, including demographic factors of the family. It is generally believed that energy accessibility [29], local climate conditions [30], energy policies [31], costs, and the extent to which energy-saving technologies [32] are promoted are important external factors affecting household energy choices; while income levels, age structure, member occupations, and behavioral preferences are the main internal factors [17]. Recently, the influence of micro-factors on household energy consumption has drawn an increasing amount of attention [33]. However, studies have pointed out that income has been overestimated in the analysis of impact factors on household energy structure [34]. In this study, the results of random forests analysis indicate that the amount of livestock and electrical appliances are main impact factors of energy use pattern; the importance of income ranked fifth (Figure 3), after CTY and DIST. Income was not screened into the sub-model, which means it was not the main impact factor of household energy use pattern in this study. Traditional biomass energy has an absolute advantage in researched households, and the accessibility of modern energy is often restricted by energy supply facilities based on regions rather than incomes. It may explain why income has a limited impact on household energy use pattern in rural areas. The main factors affecting traditional biomass energy are resource accessibility, labor, land and livestock raising [34]. The study provides a case support for the claim that income is overestimated in the study of household energy consumption.
In this study, the major factors affecting household energy pattern are ElecApp and PIG. Different combinations of the two factors represent different production and life styles, for example, high pig rearing–low ElecApp (Type I) indicates that the family maintains the traditional farming-oriented lifestyle, and low pig rearing–high ElecApp (Type III) implies families have entered a more modern lifestyle and standard of living. The family lifestyle has a decisive role in household energy use pattern. Production and lifestyle determine the energy consumption structure of specific household, which leads to different total energy consumption amount. As income levels increase, household energy use diversity increases, indicating that although income is not statistically a determining factor of household energy use pattern, higher incomes may provide more energy choices for households. In addition, the diversity of household energy use is also affected by factors such as energy accessibility.

4.3. Management Suggestions Based on Characteristic Energy

It is of great significance to put forward corresponding management countermeasures for different household energy use pattern for the formulation of refined energy conservation and emission reduction policies. The research method based on characteristic energy proposed in this study is helpful to identify the energy use pattern of different ethnics, regions or income groups, which is the premise of refined local energy management. For families whose characteristic energy is firewood, guiding households to use modern cookers, reducing pig breeding, and formulating appropriate policies to compensate for the cost of retrofitting cookware and reducing pig breeding are the main ways to reduce the energy consumption of this type of household. As households characterized by electricity have the least total energy consumption, they are not the focus of local energy conservation policies. For these types of households, encouraging the use of energy-efficient products can help further reduce energy consumption. The energy use pattern characterized by coal is closely related to local coal supply. For this type of household, the reform of the local energy supply structure will effectively reduce household energy consumption. Households with gasoline as the characteristic energy source consume the most energy. Encouraging the use of energy-efficient cars and improving fuel efficiency will reduce the total energy consumption of this type of household. Additionally, encouraging rural households to replace gasoline-powered vehicles with electric vehicles under the context of increasing mature energy storage technologies [35], such as lead-acid and lithium-ion batteries, is a possible approach to reduce regional energy consumption and carbon emission [36]. Guiding households to reduce pig breeding also helps energy saving in this type of household. Policymakers should take full consideration of the composition of regional household energy use patterns and make different energy-saving and emission reduction policies.
Based on characteristic energy, the research represents the energy consumption characteristics of rural households with different incomes, ethnic groups and in different regions, indicating that the transition of rural household energy is not the transition of single energy, but a change in energy use pattern. The method helps policy makers fully understand the diversity of rural household energy use. Using characteristic energy will simplify household energy use structures into energy use types, facilitate impact factors analysis of household energy use and provide new ideas for related research. The method of researching household energy use patterns based on characteristic energy has the following advantages: (1) Although large-scale studies sometimes take factors affecting household energy use that small-scale studies could not include into consideration, they can also easily obscure household-scale impact factors [27]. The actual impact factors of poor rural households is easily obscured by large industrial patterns [7]. As applicable to household-scale study, the method based on characteristic energy can better reflect the actual characteristics and impact factors of household energy use. (2) The origin data required in the study are simple and easy to obtain. (3) Combined with a diversity analysis of energy patterns, the study provides an effective supplement to the energy stack theory. As an empirical study, the study proposes methods and cases for studying energy use patterns in practical. However, the energy use status of rural areas in the Chongqing ethnic minority area, the case study area, does not cover the spectrum of energy use in the conceptual model. A wider range of investigations will increase the cover range of spectrum of energy use models and provide stronger support for policymaking.

5. Conclusions

In summary, we proposed the concept and research method of characteristic energy to depict major characteristics of household energy use patterns in this study. Families with similar energy consumption structure were clustered into a group based on energy proportion data, and different groups have different energy consumption structures. Families in the research area were clustered into four groups with different characteristic energy sources: firewood, electricity, coal and gasoline. The main impact factors of rural household energy use patterns are the number of household electrical appliances and raised pig, indicating that household production and lifestyle play a decisive role in household energy use patterns. Although income was not selected as main impact factor, household energy use pattern presents certain characteristics with changes in income. With the increase of income, the proportion of energy consumption types characterized by firewood decreases, and other three energy use types increase accordingly. The average total energy consumption of households in the study area first increased and then decreased with the increase of income, as well as the diversity based on energy use types. Using characteristic energy to represent household energy patterns can not only facilitate the explanation of energy transition with income, but also the understanding of energy patterns within a group of households with arbitrary attributes (such as region and ethnicity). Proposing corresponding management countermeasures for different energy use pattern helps to formulate refined energy saving and emission reduction policies.

Supplementary Materials

The following are available online at https://www.mdpi.com/2071-1050/12/17/6898/s1, Table S1: Conversion factors from physical unit to coal equivalent, Table S2: Family characteristics, Table S3: Overall situation of rural household energy consumption.

Author Contributions

Conceptualization, M.T. and H.Z.; formal analysis, S.M.; investigation, S.M., S.Q. and T.L.; writing—original draft preparation, S.M.; writing—review and editing, M.T., H.D. and H.Z. All authors have read and agreed to the published version of the manuscript.

Funding

This work was supported by Ministry of Science and Technology of the People’s Republic of China, grant number 2016YFC0502106.

Acknowledgments

We thank Helen Lee for language polishing. Feng Liu provided invaluable help during the whole investigation; we also thank Shanlin Li, Xinhong Zuo, Jiaxin Lai, Jin Hu, Yong Wang, Linhui Sun, Zhouyu Long, Lanting Li, Qiaoqiao Cao, Can Hou, Shizhu Xiong and Maoxia Wu for help with this investigation.

Conflicts of Interest

The authors declare no conflict of interest.

References

  1. Department of Energy Statistics of China. China Energy Statistical Yearbook 2014; China Statistics Press: Beijing, China, 2015.
  2. Pachauri, S.; Jiang, L. The household energy transition in India and China. Energy Policy 2008, 36, 4022–4035. [Google Scholar] [CrossRef] [Green Version]
  3. Wilhite, H.; Nakagami, H.; Masuda, T.; Yamaga, Y.; Haneda, H. A cross-cultural analysis of household energy use behaviour in Japan and Norway. Energy Policy 1996, 24, 795–803. [Google Scholar] [CrossRef]
  4. Baiyegunhi, L.J.S.; Hassan, M.B. Rural household fuel energy transition: Evidence from Giwa LGA Kaduna State, Nigeria. Energy Sustain. Dev. 2014, 20, 30–35. [Google Scholar] [CrossRef]
  5. Macht, C.; Axinn, W.G.; Ghimire, D. Household Energy Consumption: Community Context and the Fuelwood Transition; Population Studies Center Research Report; Population Studies Center: Ann Arbor, MI, USA, 2007; Volume 07-629. [Google Scholar]
  6. Hosier, R.H.; Dowd, J. Household fuel choice in Zimbabwe. Resour. Energy 1987, 9, 347–361. [Google Scholar] [CrossRef]
  7. Elias, R.J.; Victor, D.G. Energy Transitions in Developing Countries: A Review of Concepts and Literature; Program on Energy and Sustainable Development, Working Paper; Stanford University: Stanford, CA, USA, 2005. [Google Scholar]
  8. Paudel, U.; Khatri, U.; Pant, K.P. Understanding the determinants of household cooking fuel choice in Afghanistan: A multinomial logit estimation. Energy 2018, 156, 55–62. [Google Scholar] [CrossRef]
  9. Masera, O.R.; Saatkamp, B.D.; Kammen, D.M. From linear fuel switching to multiple cooking strategies: A critique and alternative to the Energy ladder model. World Dev. 2000, 28, 2083–2103. [Google Scholar] [CrossRef]
  10. van der Kroon, B.; Brouwer, R.; van Beukering, P.J.H. The energy ladder: Theoretical myth or empirical truth? Results from a meta-analysis. Renew. Sustain. Energy Rev. 2013, 20, 504–513. [Google Scholar] [CrossRef]
  11. Xiaohua, W.; Kunquan, L.; Hua, L.; Di, B.; Jingru, L. Research on China’s rural household energy consumption—Household investigation of typical counties in 8 economic zones. Renew. Sustain. Energy Rev. 2017, 68, 28–32. [Google Scholar] [CrossRef]
  12. Li, J.; Chen, C.; Liu, H. Transition from non-commercial to commercial energy in rural China: Insights from the accessibility and affordability. Energy Policy 2019, 127, 392–403. [Google Scholar] [CrossRef]
  13. Chen, Q.; Yang, H.; Liu, T.; Zhang, L. Household biomass energy choice and its policy implications on improving rural livelihoods in Sichuan, China. Energy Policy 2016, 93, 291–302. [Google Scholar] [CrossRef]
  14. Lee, J.W. Long-run dynamics of renewable energy consumption on carbon emissions and economic growth in the European union. Int. J. Sustain. Dev. World Ecol. 2019, 26, 69–78. [Google Scholar] [CrossRef]
  15. Xiong, W.Q.; Yong, G. Strategies and Suggestions to Utilize Biomass Energy in Rural Areas of Chongqing. Adv. Mater. Res. 2012, 488–489, 975–979. [Google Scholar] [CrossRef]
  16. Xiao, Y.; Xiao, Q. Identifying key areas of ecosystem services potential to improve ecological management in Chongqing City, southwest China. Environ. Monit. Assess. 2018, 190, 258. [Google Scholar] [CrossRef] [PubMed]
  17. Fan, J.; Liang, Y.; Tao, A.; Sheng, K.; Ma, H.-L.; Xu, Y.; Wang, C.-S.; Sun, W. Energy policies for sustainable livelihoods and sustainable development of poor areas in China. Energy Policy 2011, 39, 1200–1212. [Google Scholar] [CrossRef]
  18. Lai, C.S.; Tao, Y.; Xu, F.; Ng, W.W.Y.; Jia, Y.; Yuan, H.; Huang, C.; Lai, L.L.; Xu, Z.; Locatelli, G. A robust correlation analysis framework for imbalanced and dichotomous data with uncertainty. Inf. Sci. 2019, 470, 58–77. [Google Scholar] [CrossRef] [Green Version]
  19. Kohonen, T. Self-Organizing Maps, 3rd ed.; Springer: Berlin/Heidelberg, Germany; New York, NY, USA, 2001; p. 528. [Google Scholar]
  20. Cutler, D.R.; Edwards, T.C., Jr.; Beard, K.H.; Cutler, A.; Hess, K.T.; Gibson, J.; Lawler, J.J. Random forests for classification in ecology. Ecology 2007, 88, 2783–2792. [Google Scholar] [CrossRef]
  21. Dufrêne, M.; Legendre, P. Species assemblages and indicator species: The need for a flexible asymmetrical approach. Ecol. Monogr. 1997, 67, 345–366. [Google Scholar] [CrossRef]
  22. Moreno, C.E.; Calderón-Patrón, J.M.; Martín-Regalado, N.; Martínez-Falcón, A.P.; Ortega-Martínez, I.J.; Rios-Díaz, C.L.; Rosas, F. Measuring species diversity in the tropics: A review of methodological approaches and framework for future studies. Biotropica 2018, 50, 929–941. [Google Scholar] [CrossRef]
  23. R Core Team. R: A Language and Environment for Statistical Computing; R Foundation for Statistical Computing: Vienna, Austria, 2018. [Google Scholar]
  24. Paul, J.; Verleysen, M.; Dupont, P. Identification of statistically significant features from random forests. In Proceedings of the ECML workshop on Solving Complex Machine Learning Problems with Ensemble Methods, Prague, Czech Republic, 27 September 2013. [Google Scholar]
  25. Greenwell, B.M. pdp: An R Package for Constructing Partial Dependence Plots. R J. 2017, 9, 421. [Google Scholar] [CrossRef] [Green Version]
  26. Song, C.; Bilsborrow, R.; Jagger, P.; Zhang, Q.; Chen, X.; Huang, Q. Rural Household Energy Use and Its Determinants in China: How Important Are Influences of Payment for Ecosystem Services vs. Other Factors? Ecol. Econ. 2018, 145, 148–159. [Google Scholar] [CrossRef]
  27. Hiemstra-van der Horst, G.; Hovorka, A.J. Reassessing the “energy ladder”: Household energy use in Maun, Botswana. Energy Policy 2008, 36, 3333–3344. [Google Scholar] [CrossRef]
  28. Jian, Z. The recent trend of ethnic intermarriage in China: An analysis based on the census data. J. Chin. Sociol. 2017, 4, 11. [Google Scholar] [CrossRef]
  29. Pachauri, S.; Spreng, D. Energy use and energy access in relation to poverty. Econ. Political Wkly. 2004, 39, 271–278. [Google Scholar]
  30. Nie, H.; Kemp, R.; Xu, J.; Vasseur, V.; Fan, Y. Drivers of urban and rural residential energy consumption in China from the perspectives of climate and economic effects. J. Clean. Prod. 2018, 172, 2954–2963. [Google Scholar] [CrossRef]
  31. Sheng, C.; Cao, Y.; Xue, B. Residential Energy Sustainability in China and Germany: The Impact of National Energy Policy System. Sustainability 2018, 10, 4535. [Google Scholar] [CrossRef] [Green Version]
  32. Mills, B.; Schleich, J. Residential energy-efficient technology adoption, energy conservation, knowledge, and attitudes: An analysis of European countries. Energy Policy 2012, 49, 616–628. [Google Scholar] [CrossRef]
  33. Ma, X.; Wang, M.; Li, C. A Summary on Research of Household Energy Consumption: A Bibliometric Analysis. Sustainability 2020, 12, 316. [Google Scholar] [CrossRef] [Green Version]
  34. Kowsari, R.; Zerriffi, H. Three dimensional energy profile: A conceptual framework for assessing household energy use. Energy Policy 2011, 39, 7505–7517. [Google Scholar] [CrossRef]
  35. Lai, C.S.; McCulloch, M.D. Levelized cost of electricity for solar photovoltaic and electrical energy storage. Appl. Energy 2017, 190, 191–203. [Google Scholar] [CrossRef]
  36. Lai, T.C.; Tsang, K.F.; Liu, Y.C.; Lai, L.L. A Temperature Prediction Method of Valve-regulated Lead-acid Battery. In Proceedings of the 28th IEEE International Symposium on Industrial Electronics (ISIE 2019), Vancouver, BC, Canada, 12–14 June 2019; Institute of Electrical and Electronics Engineers Inc.: Piscataway Township, NJ, USA, 2019. [Google Scholar]
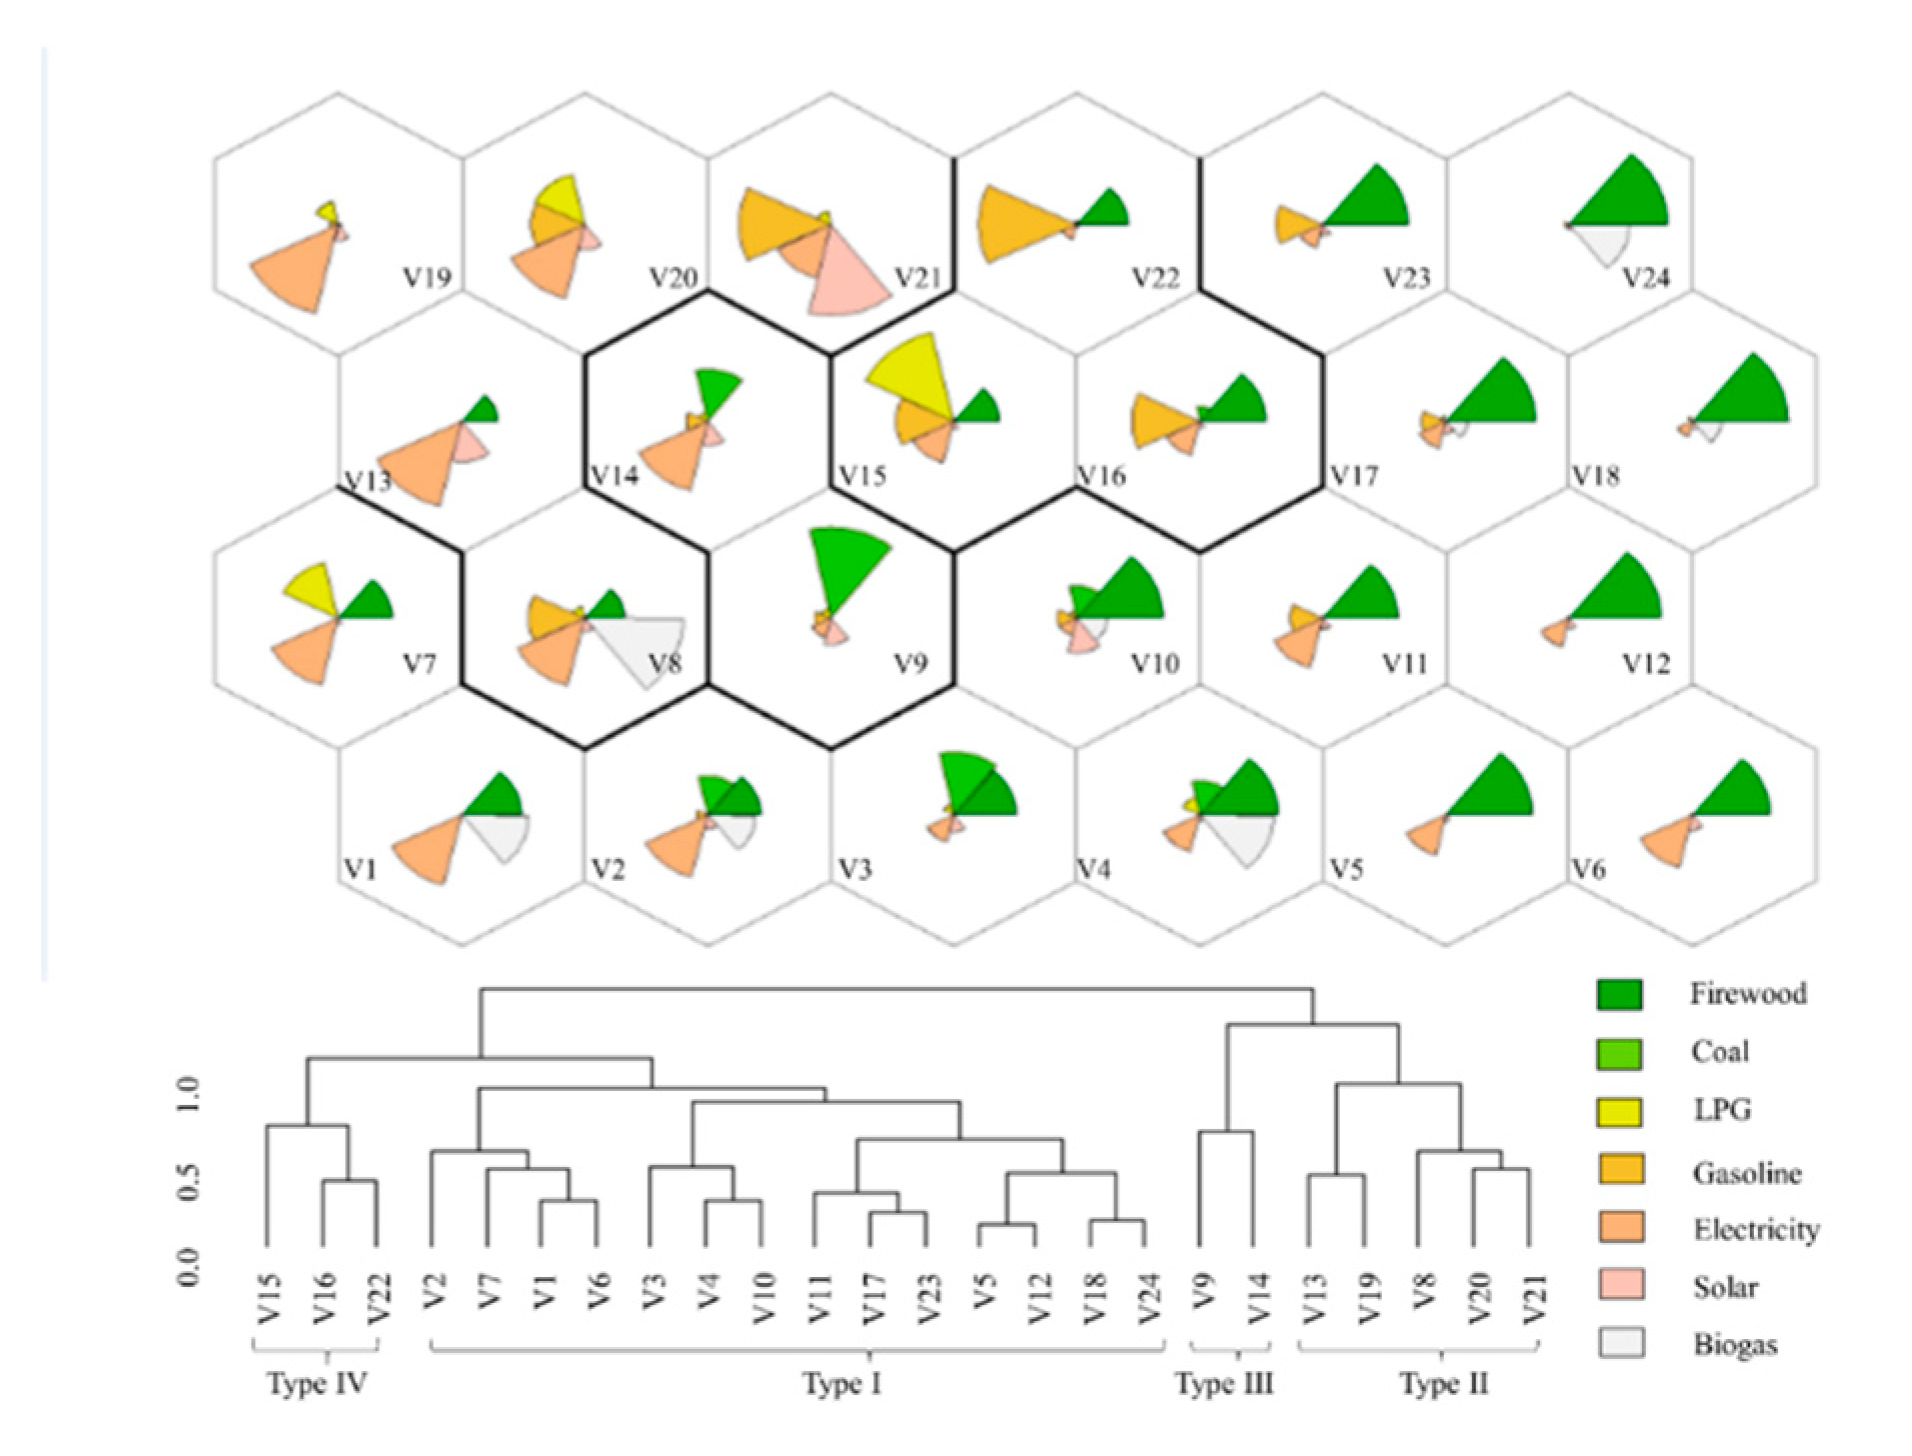
Figure 1. Categorization of household energy use patterns. The 24 SOM output neurons arranged into a two-dimensional lattice (6 * 4). Four clusters that representing four types of household energy use pattern were distinguished with the hierarchical cluster analysis.
Sustainability 12 06898 g001
Figure 2. Household energy use patterns at different income levels. The x-axis indicates different income levels (in group 1-Low, income < 20,000; in group 2-Relative Low, income is CNY 20,000–50,000; in group 3-Middle, income is CNY 50,000–10,000; in group 4-High, income is ≥ CNY 100,000). The width of the bars represents the household number.
Sustainability 12 06898 g002
Figure 3. Contributions of variables to the family categorization in the random forest analysis.
Sustainability 12 06898 g003
Figure 4. Partial effect of major impact factors on household energy use pattern. Log of fraction of votes refers the logit of the probability of presence in energy types; rugs in the x-axis indicate the deciles of variables.
Sustainability 12 06898 g004
Figure 5. Left: energy use patterns of families of different ethnic members; Right: energy use patterns of families in different counties. M-Miao Minority; MH-Miao and Han family; T-Tujia; TH-Tujia and Han; TM-Tujia and Miao family.
Sustainability 12 06898 g005
Table 1. Potential impact factors of household energy consumption pattern.
Categories of FactorsPotential Impact Factors of Household Energy Consumption Pattern
Basic family informationethnic, number of permanent residents (hNUM), household annual income (INCOME), education level of householder (EDU), percentage of members older than 65 years (A65) or less than 14 years old (A14), percentage of adult female members (aFEMALE)
Spatial positiondistance to the county where they belong (DIST), altitude (ALTEs), village name
Household livelihood capitalnumber of household appliances (ElecApp), house area (hAREA), house structure (hSTR), farmland area (FARM), economic forest area (FOREST), ecological forest area (ECOLAND)
Production and lifestylenumber of pigs raised (PIG), diversity of livelihoods, which is the number of occupations that family members have (DIVERSITY), livelihood strategies (STRA)
Table 2. Indicator values (IV) of selected characteristic energy sources for family sets.
Energy StructureHousehold NumberCharacteristic EnergyABIVAverage Total
Energy Kgce
Standard Deviation of Total Energy
Type I302Firewood0.6561.0000.81046355781
Type II76Electricity0.4621.0000.68018871462
Type III12Coal0.8901.0000.94336224101
Type IV25Gasoline0.6711.0000.819832212,832
p-value < 0.005 A refers the specificity of energy form to family groups, while B reflects the fidelity of energy source to family groups. Average total energy is the average of total energy that family consumes in the group.
Table 3. Main factors distinguishing energy types.
Type IIType IIIType IV
Type IPIGElecApp/PIGElecApp
Type II-ElecAppElecApp/PIG
Type III--PIG