Life Cycle Assessment of Variable Rate Fertilizer Application in a Pear Orchard

 ,
, 

 and
and
Abstract
1. Introduction
2. Materials and Methods
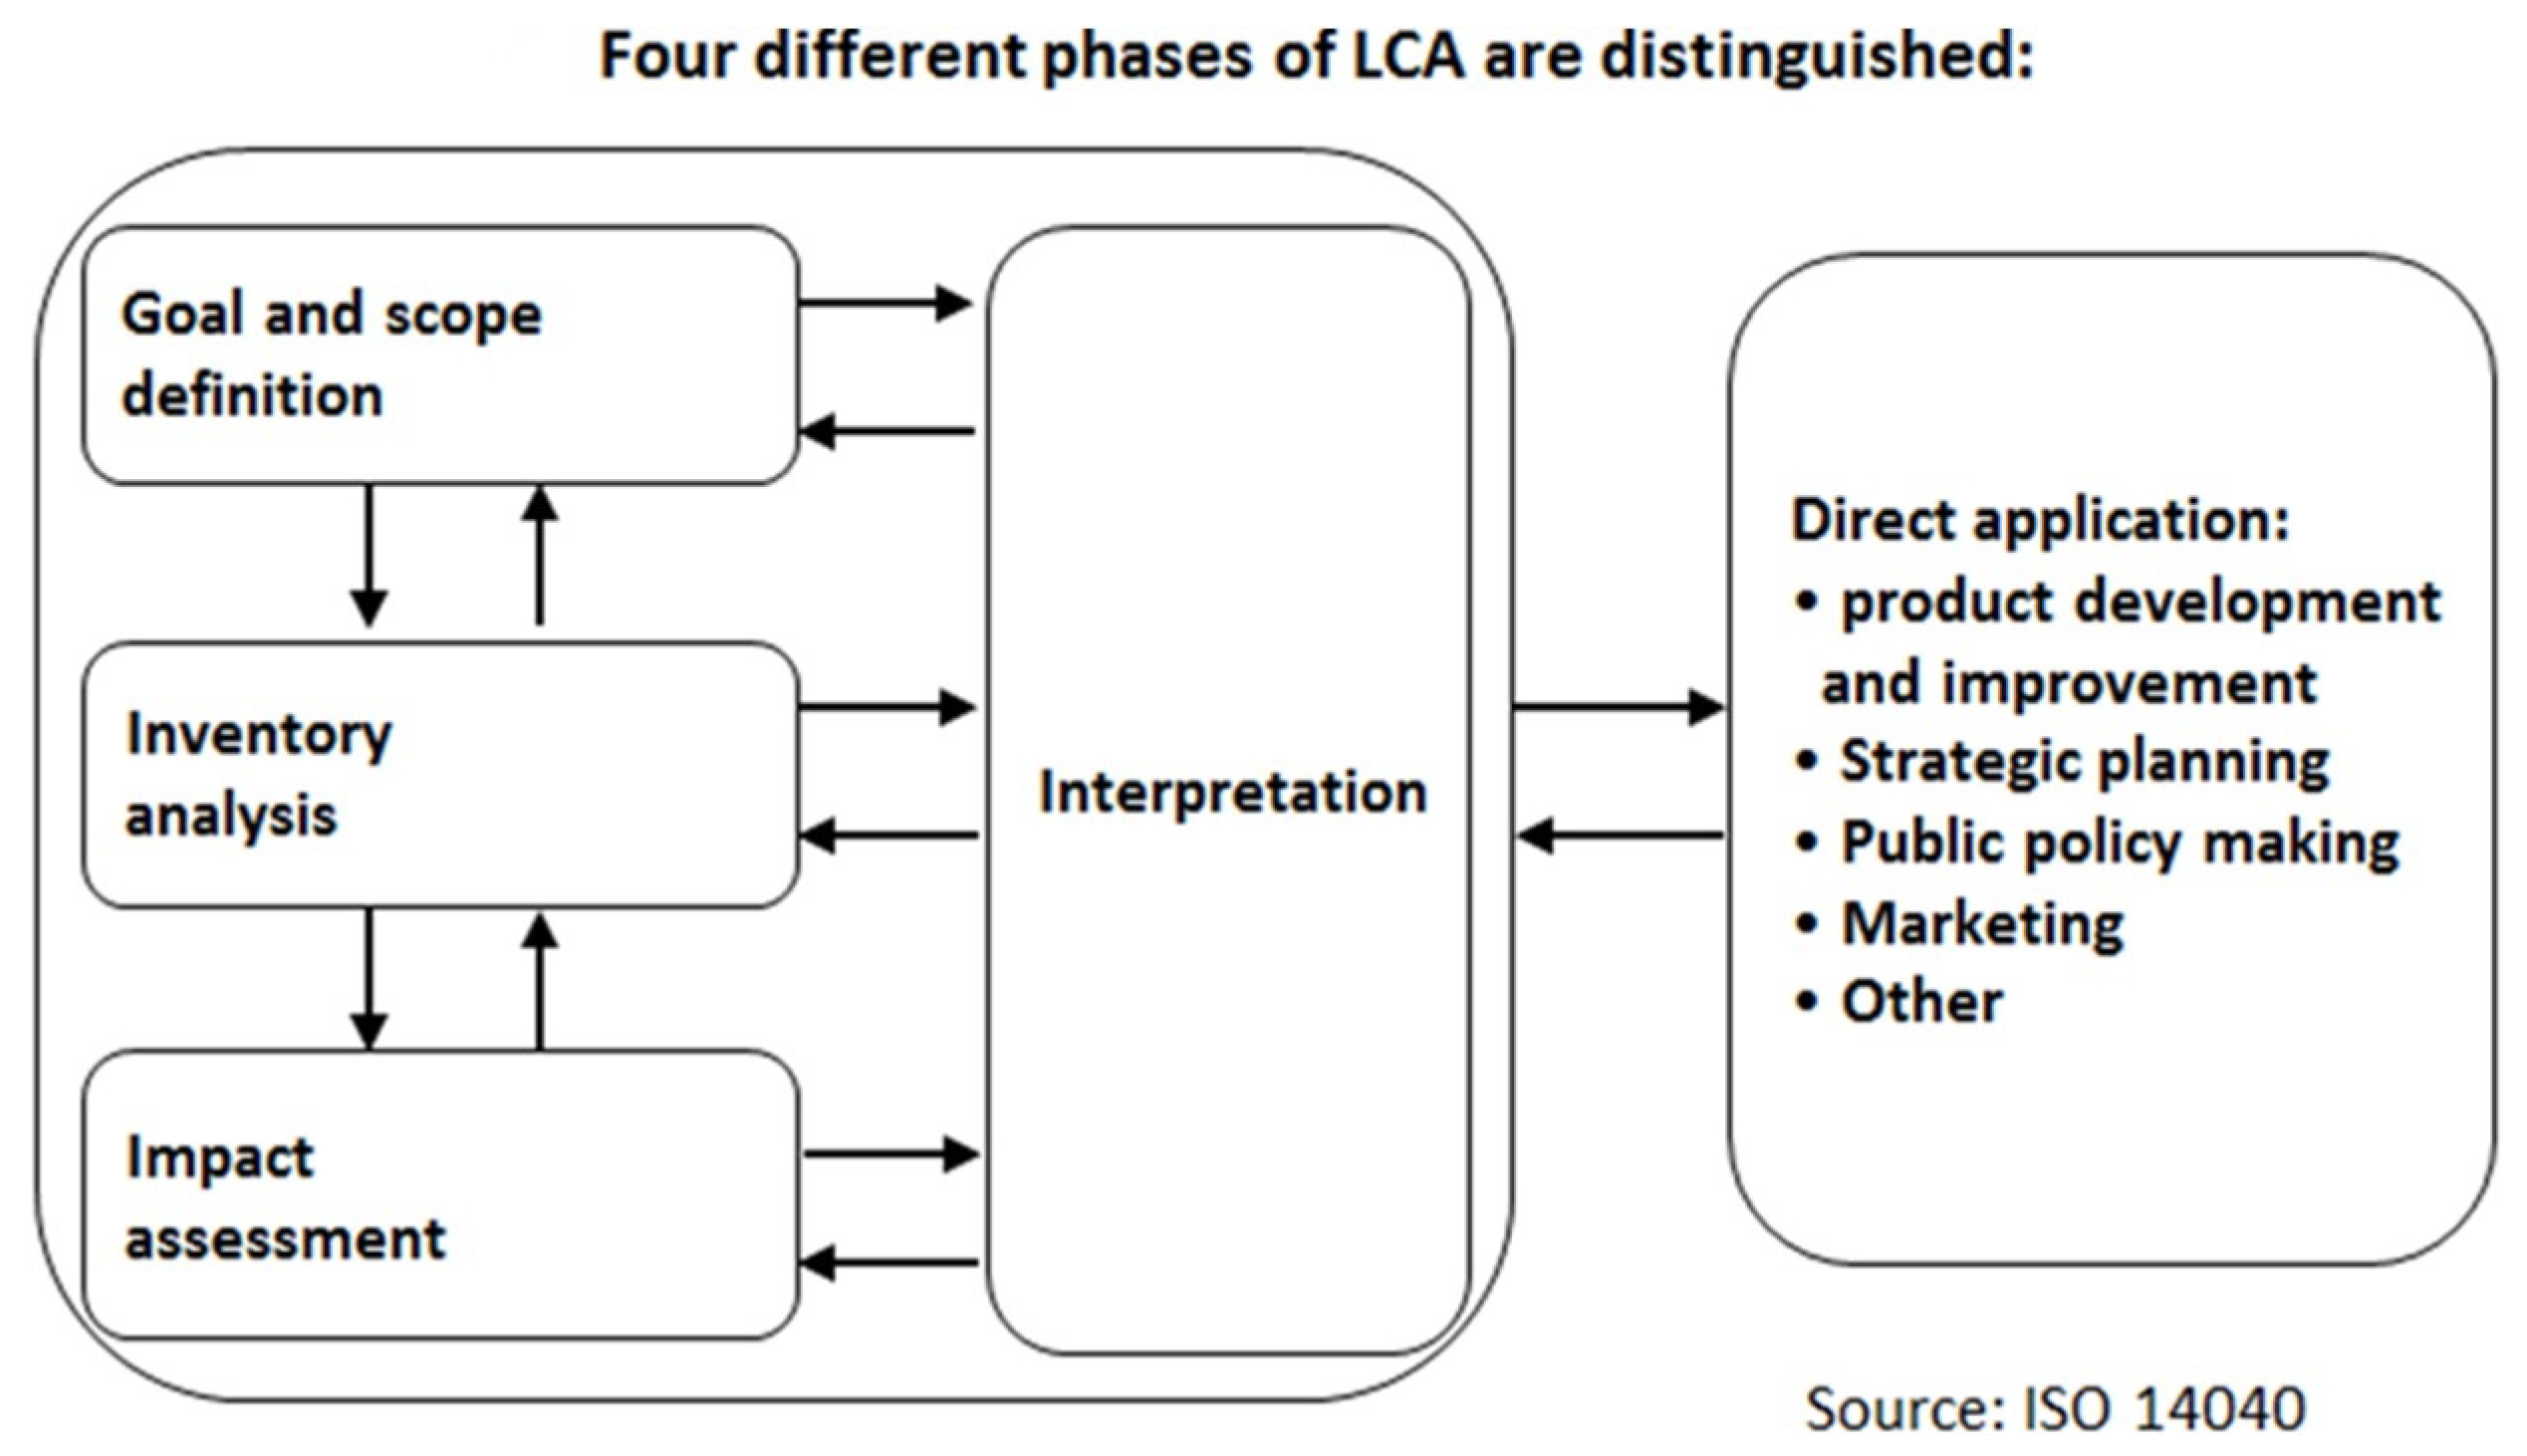
2.1. LCA Methodology
2.2. Goal and Scope
2.2.1. Functional Unit
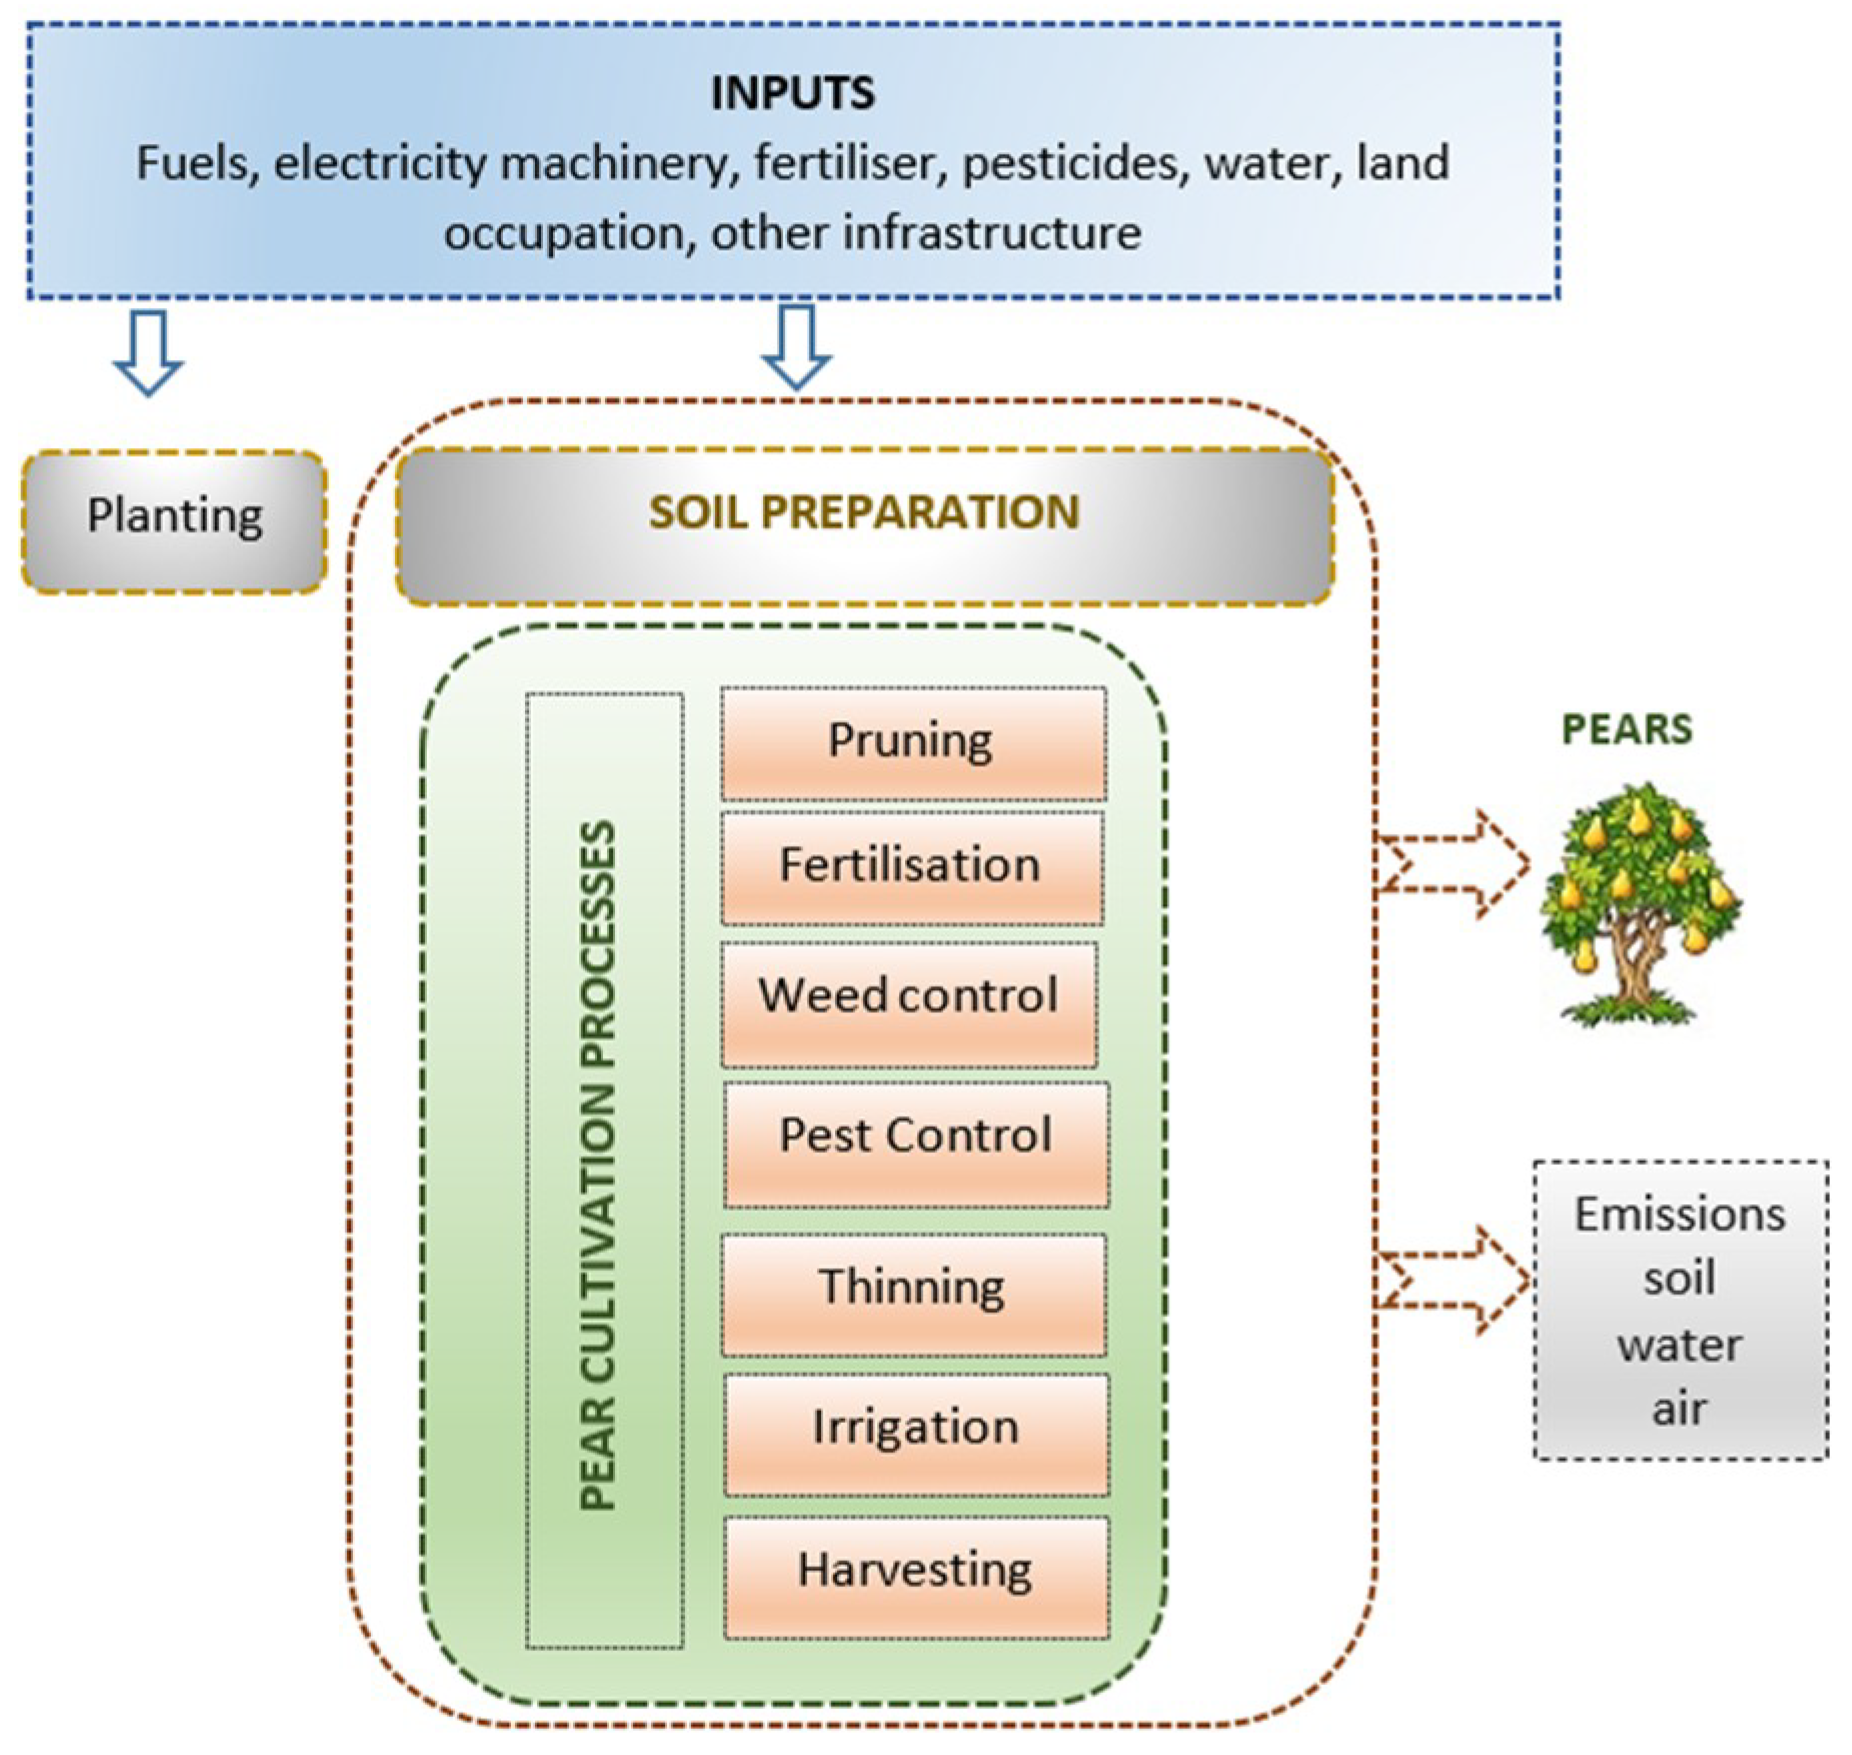
2.2.2. System Boundaries
2.3. Life Cycle Inventory
2.3.1. Data Compilation/Data Quality
2.3.2. Emission Calculation/Outputs
2.3.3. Assumptions
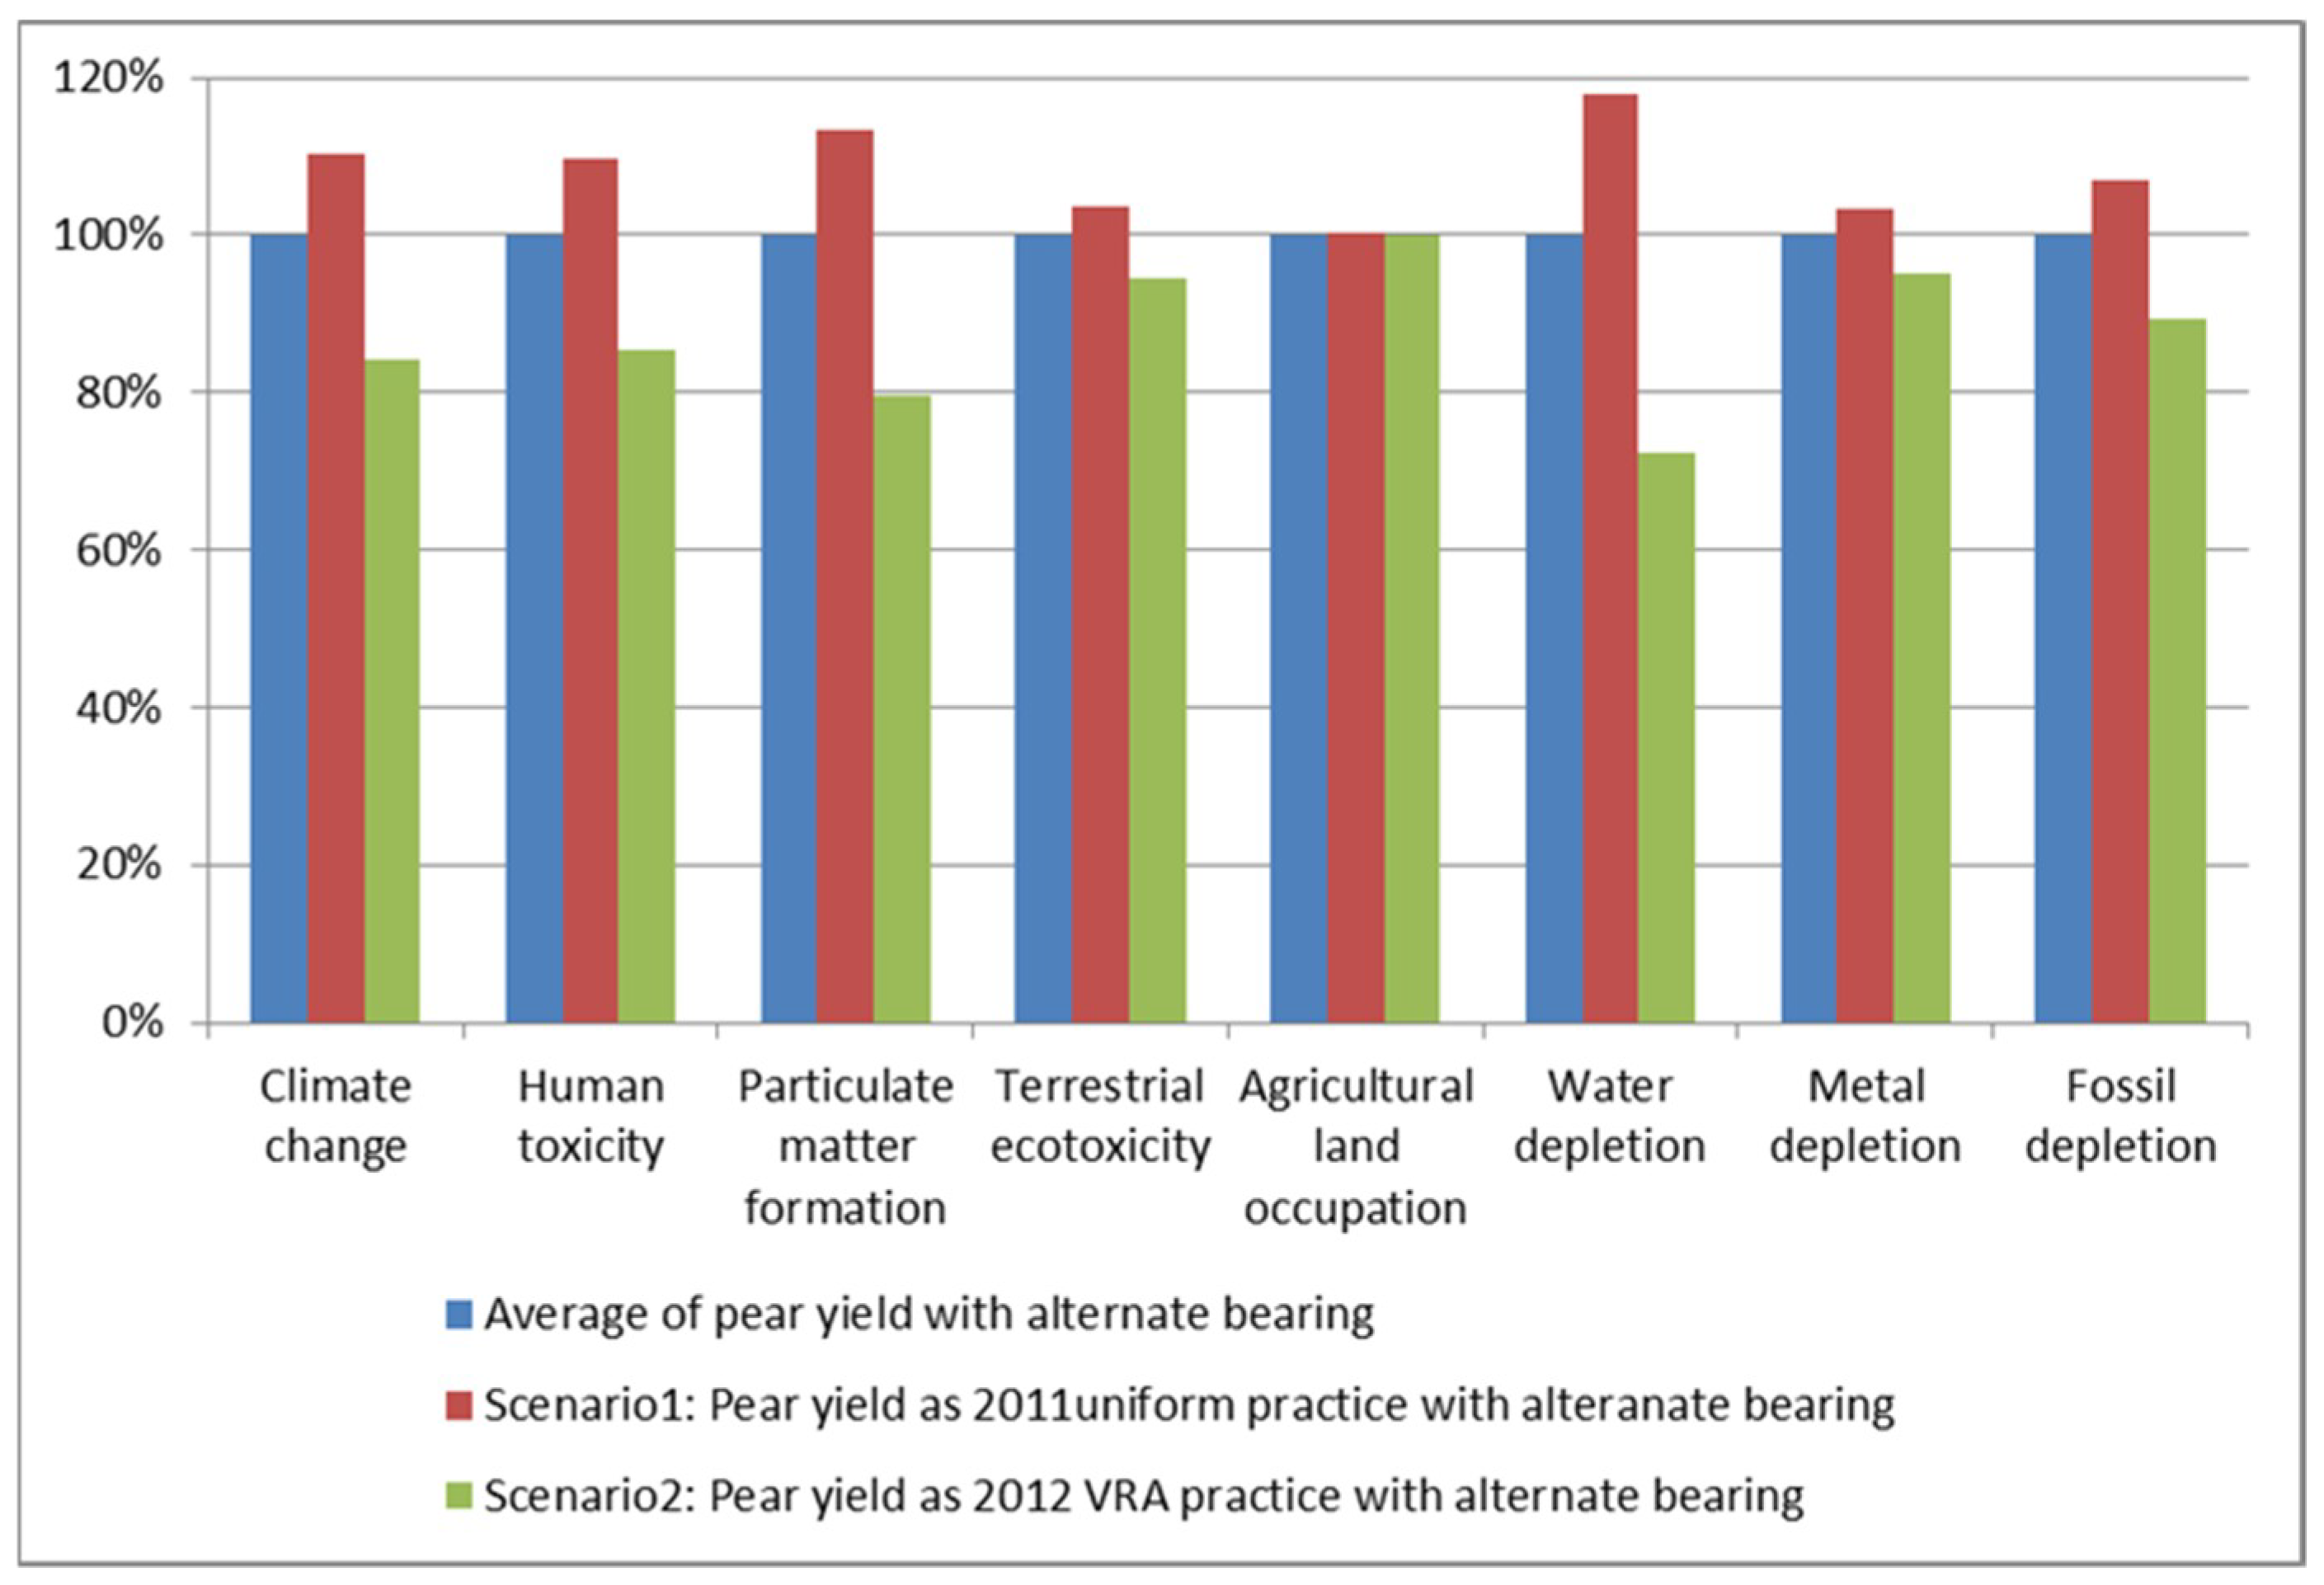
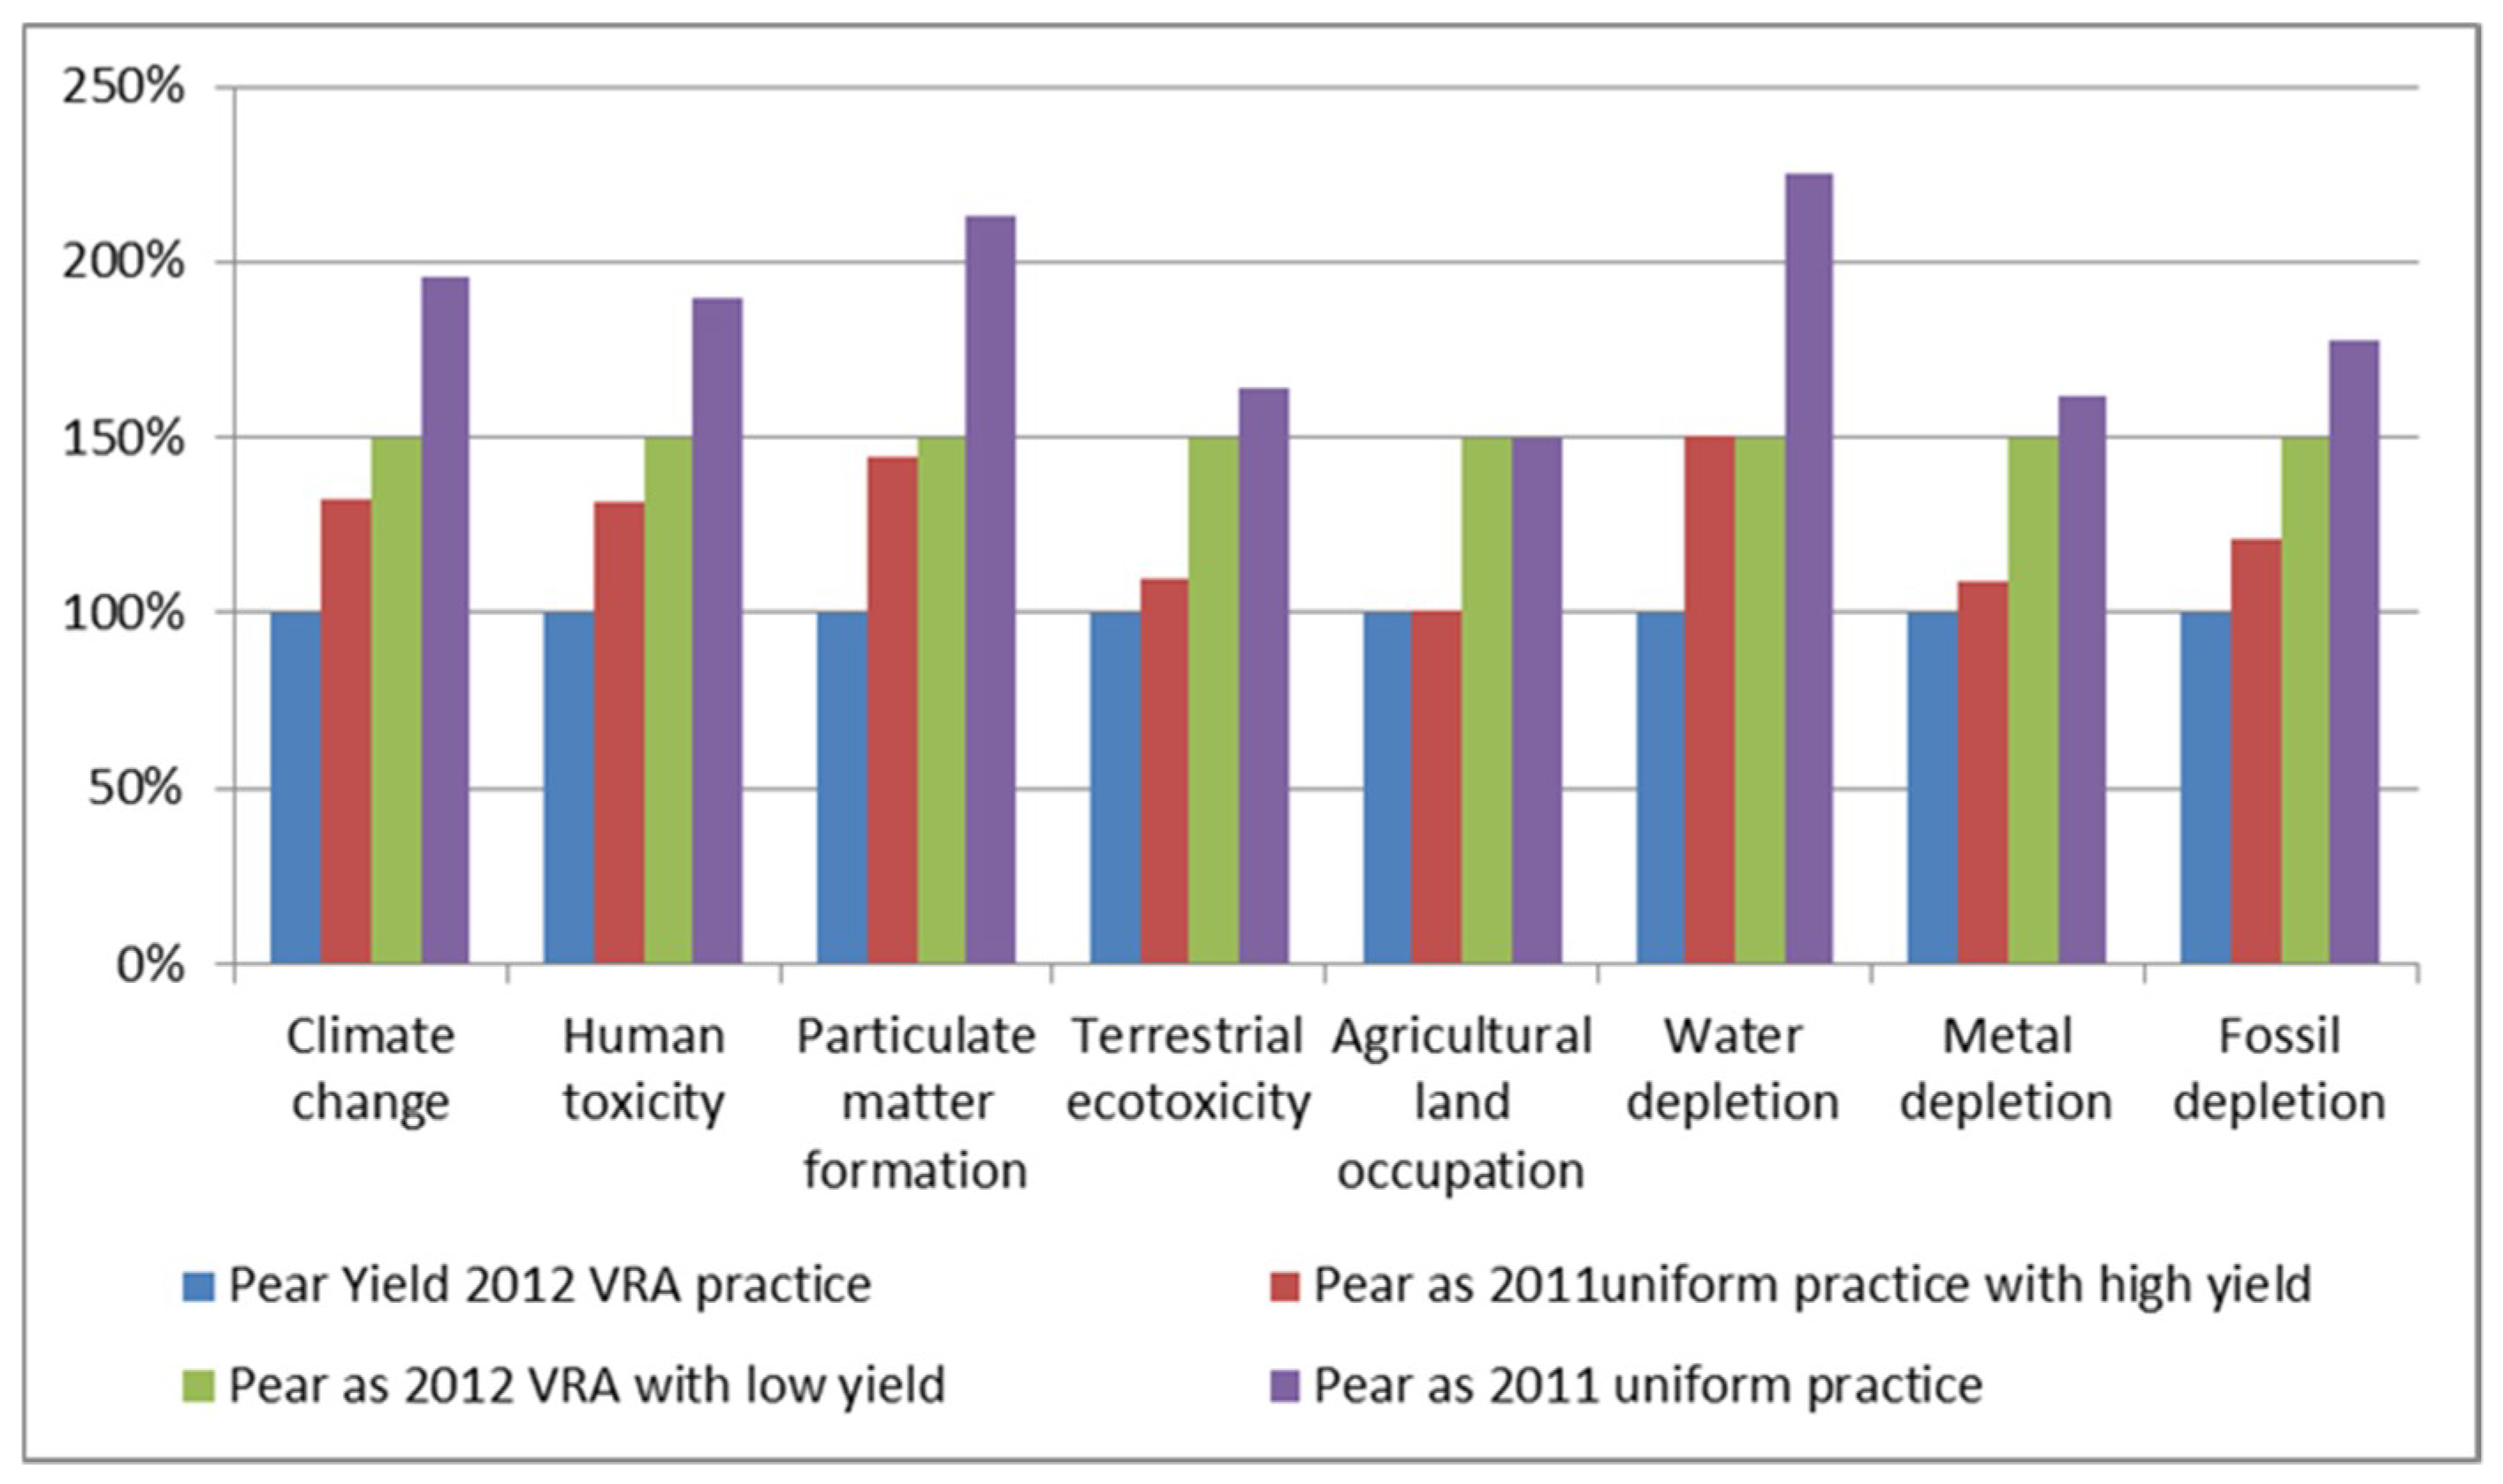
- Scenario 1: Fruit yield as 2011 uniform practice with alternate bearing; including pear orchard in the first three years + four years of low yield + 9 years as 2011 uniform practice with low yield + 10 years as 2011 uniform practice with high yield.
- Scenario 2: Fruit yield as 2012 VRA practice with alternate bearing; including pear orchard in the first three years + four years of low yield + 9 years of low yield with 2012 VRA practice + 10 years of high yield with 2012 VRA practice.
- Average Pear orchard with alternate bearing; including pear orchard in the first three years + four years of low yield + 10 years of high and low yield alternatively as 2011 uniform practice + 9 years of high and low yield alternatively with 2012 VRA practice.
2.3.4. Life Cycle Impact Assessment
Endpoint/Midpoint Methods
Recipe
3. Results
3.1. Endpoint Results
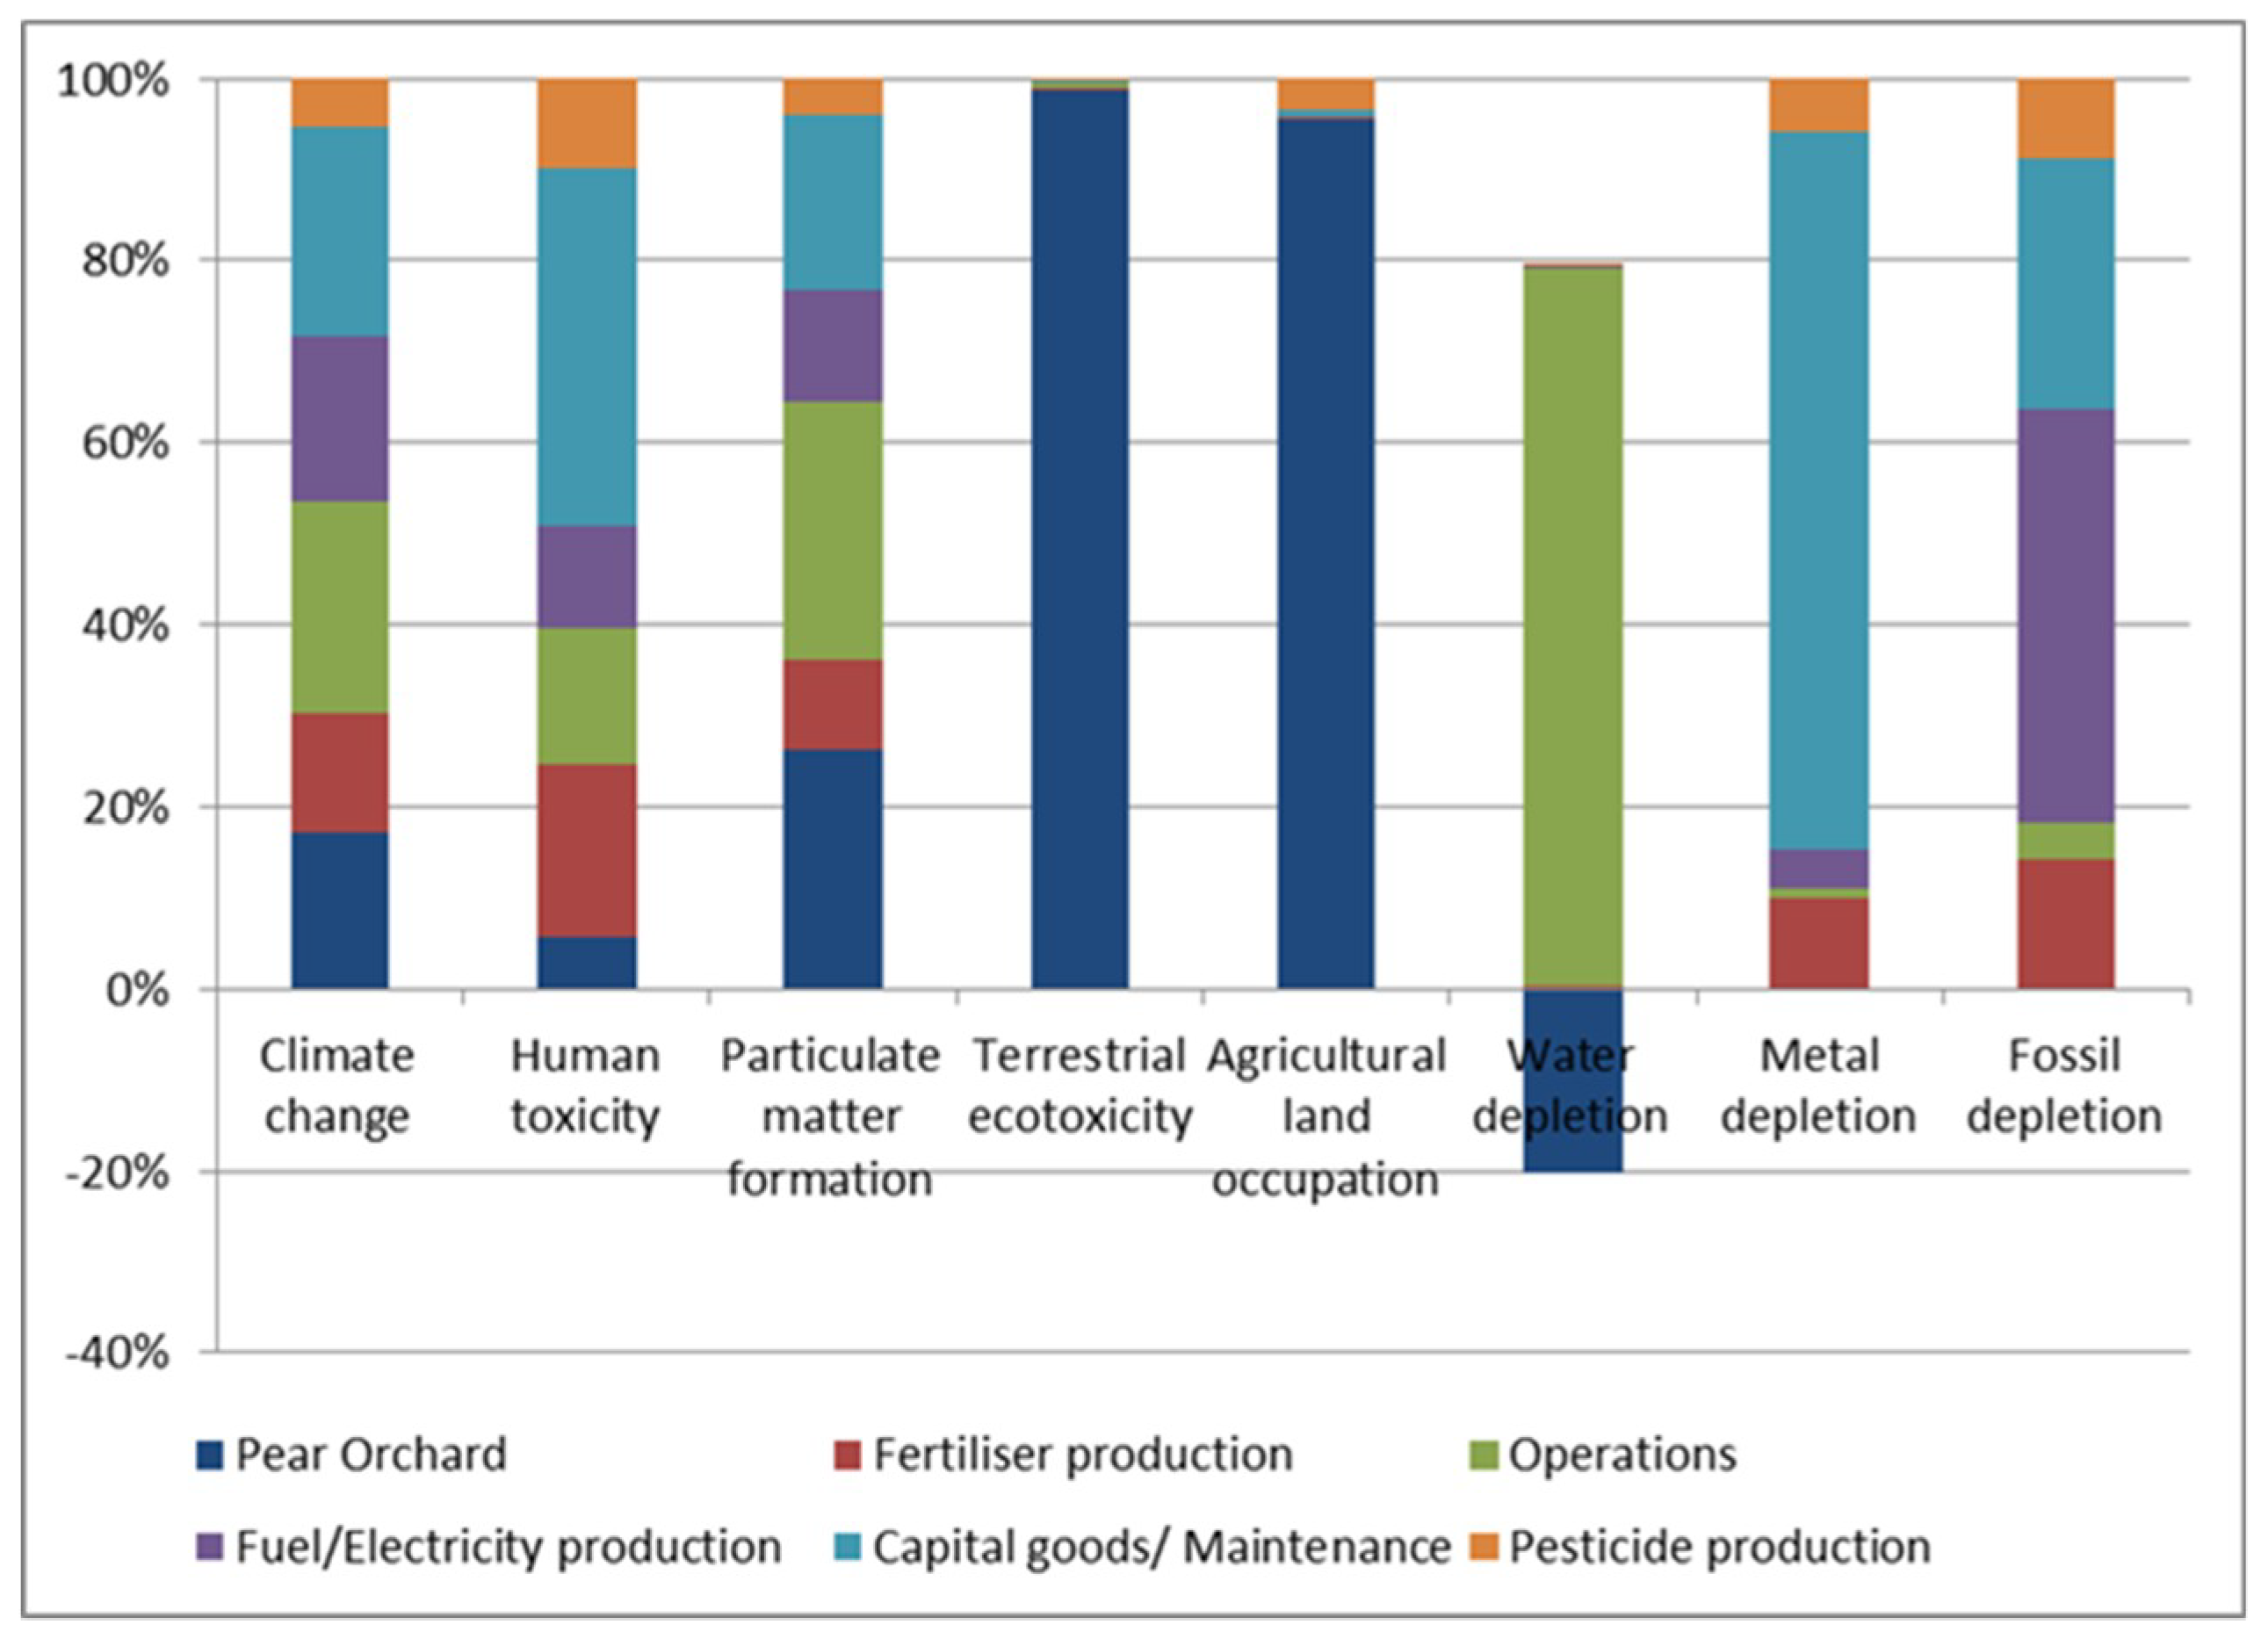
ReCiPe Method Results in Characterization Phase
3.2. Midpoint Results
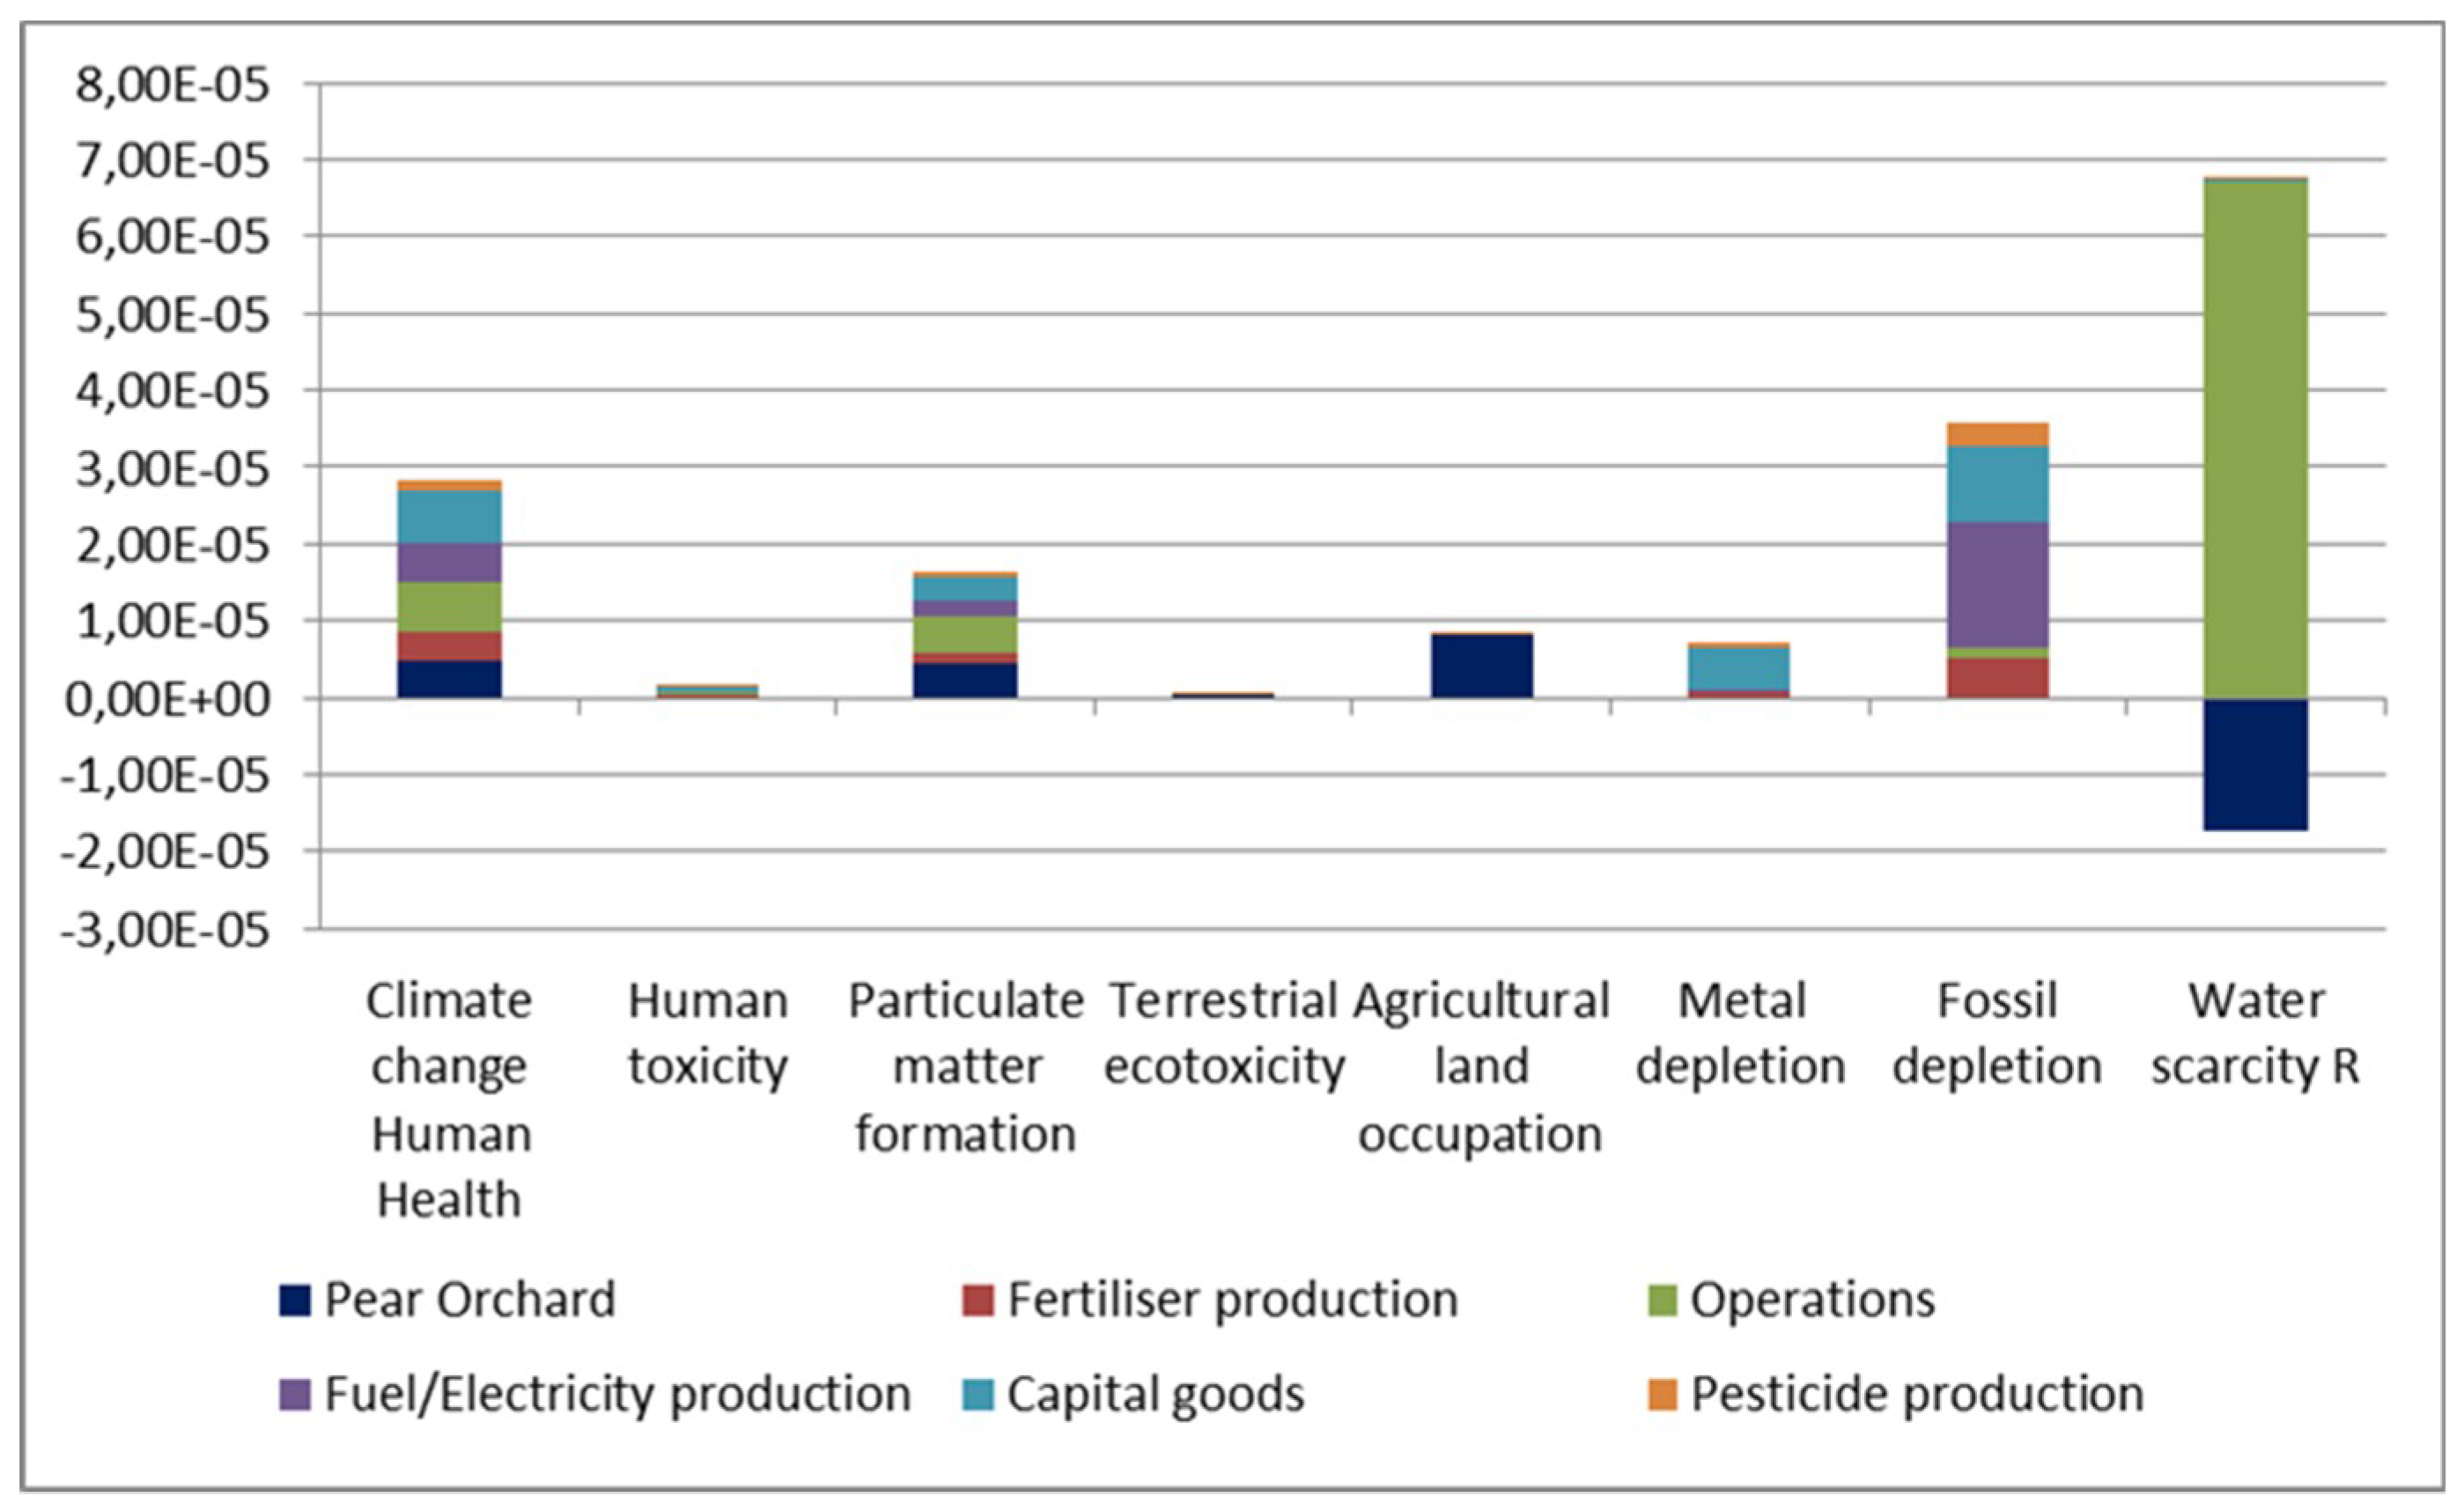
3.3. Normalization
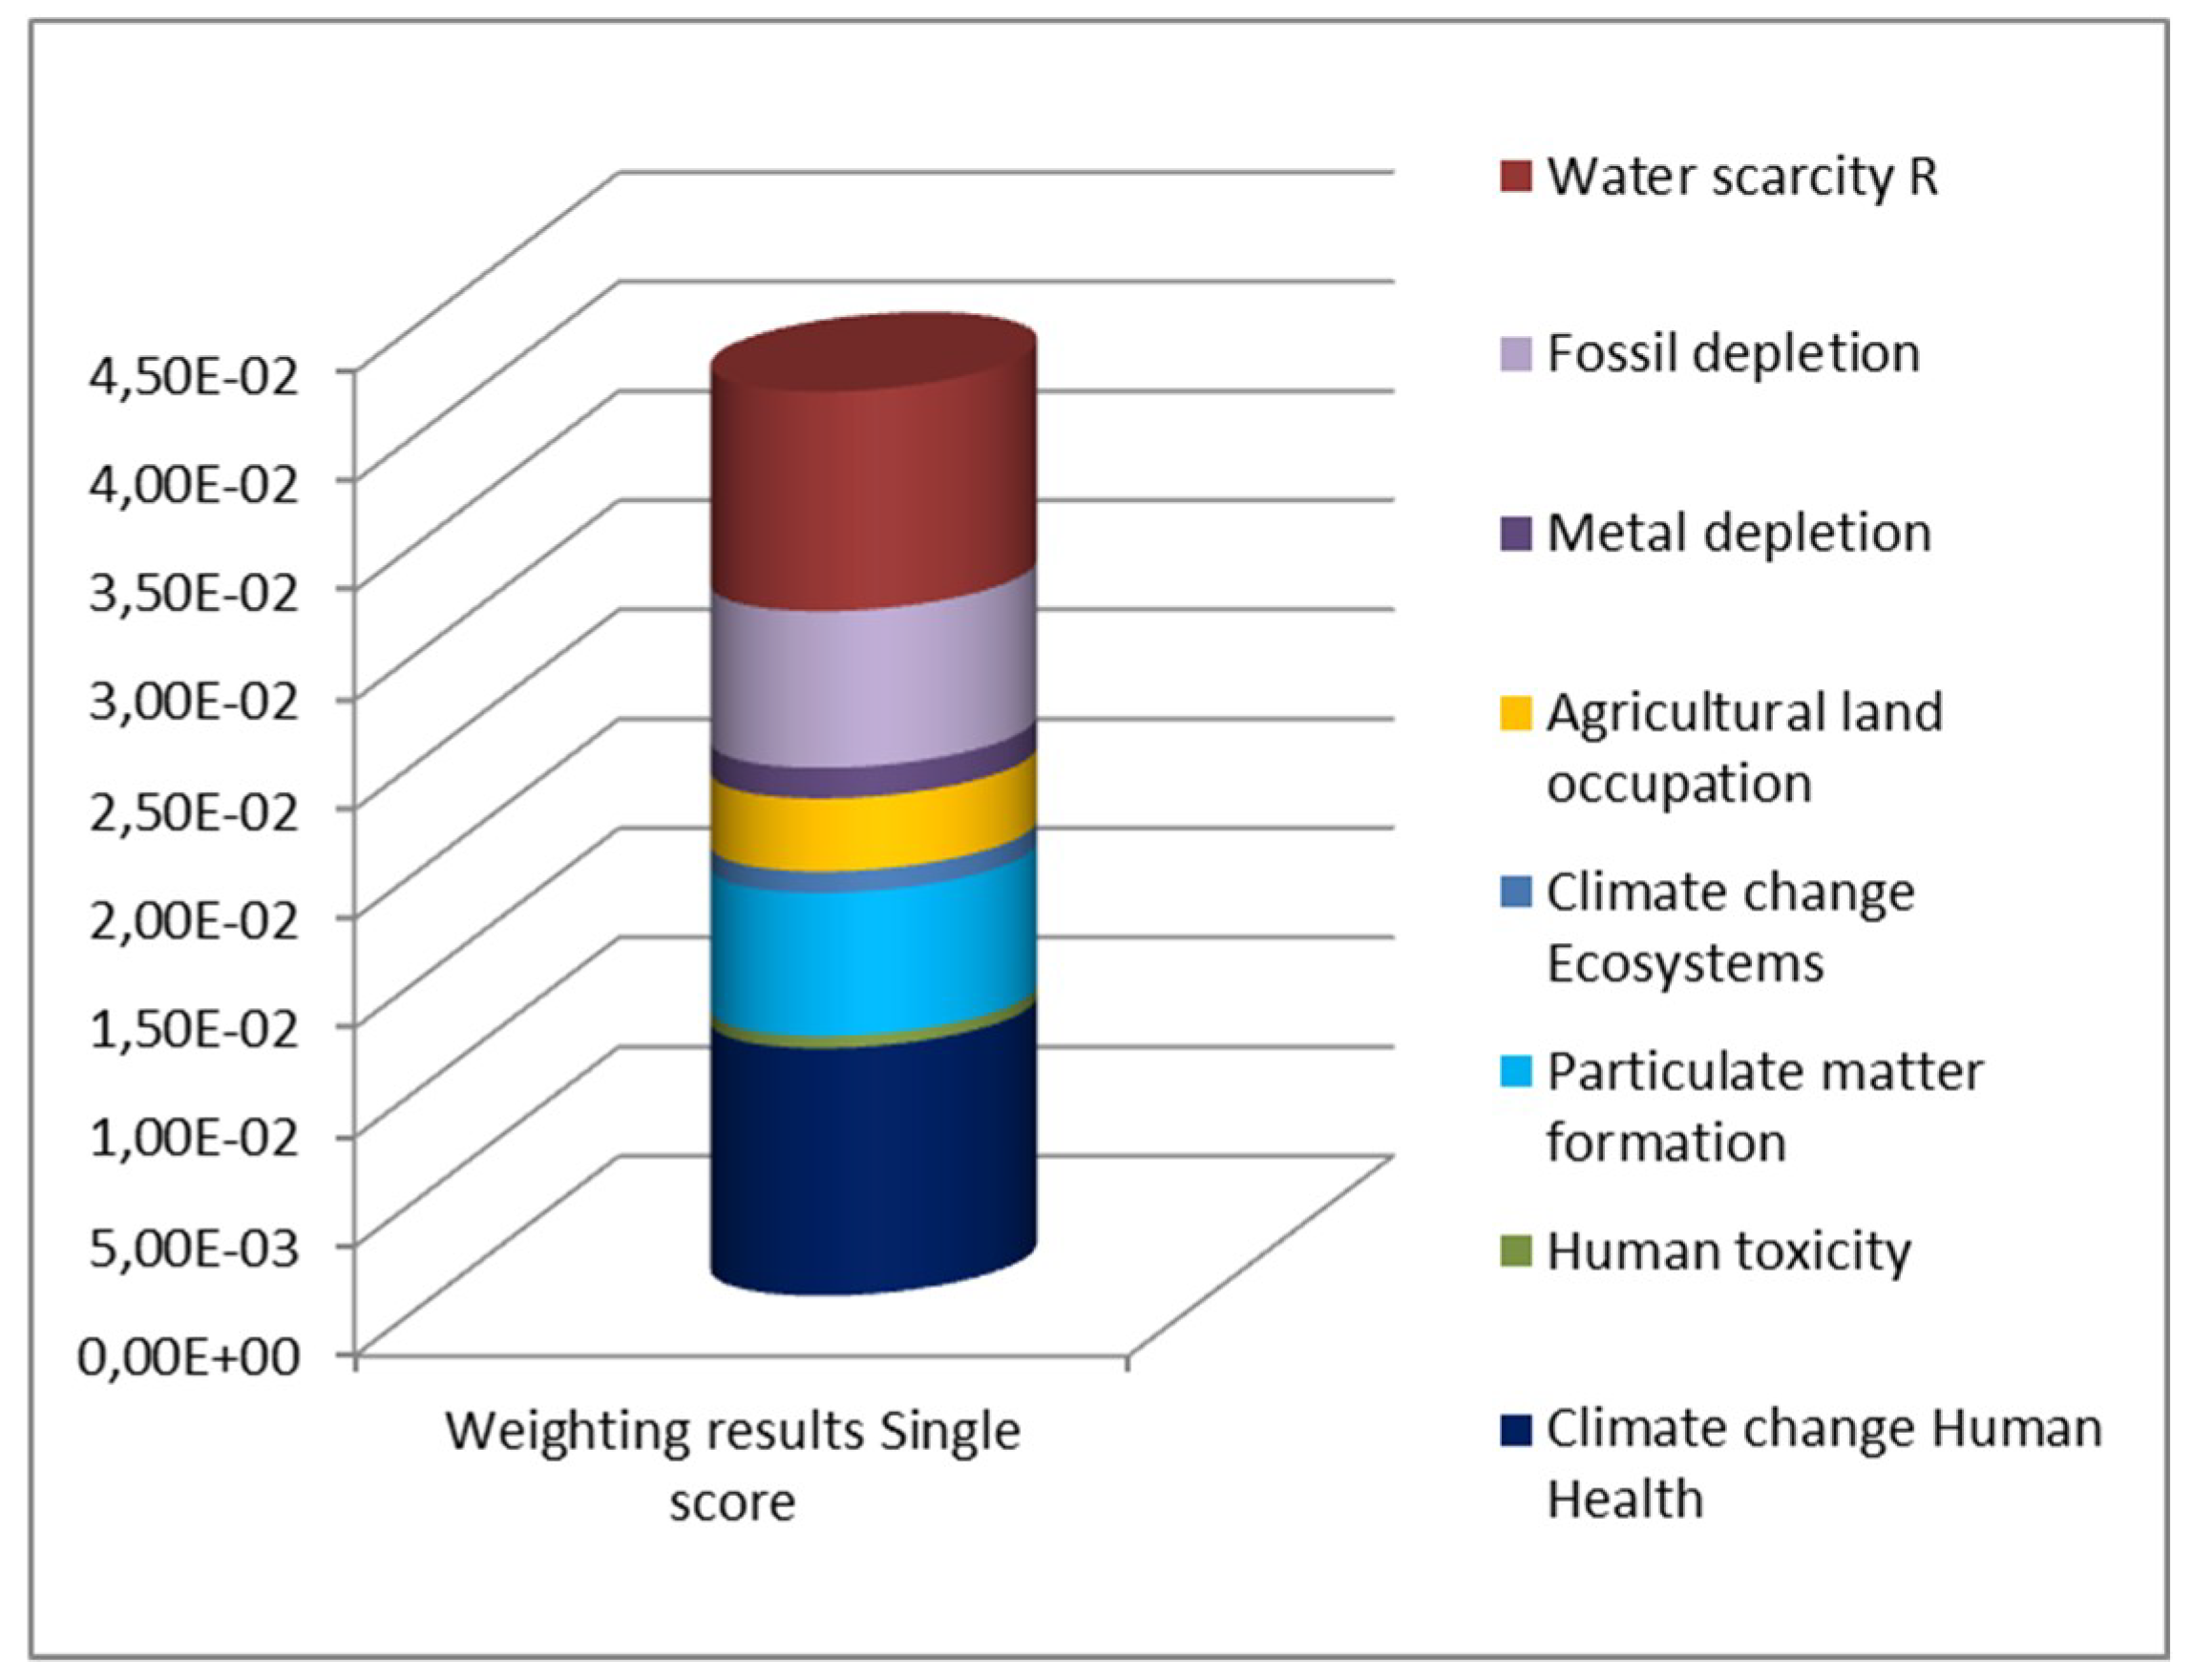
3.4. Weighting
3.5. Uncertainty
3.6. Sensitivity
4. Discussion/Interpretation
5. Conclusions
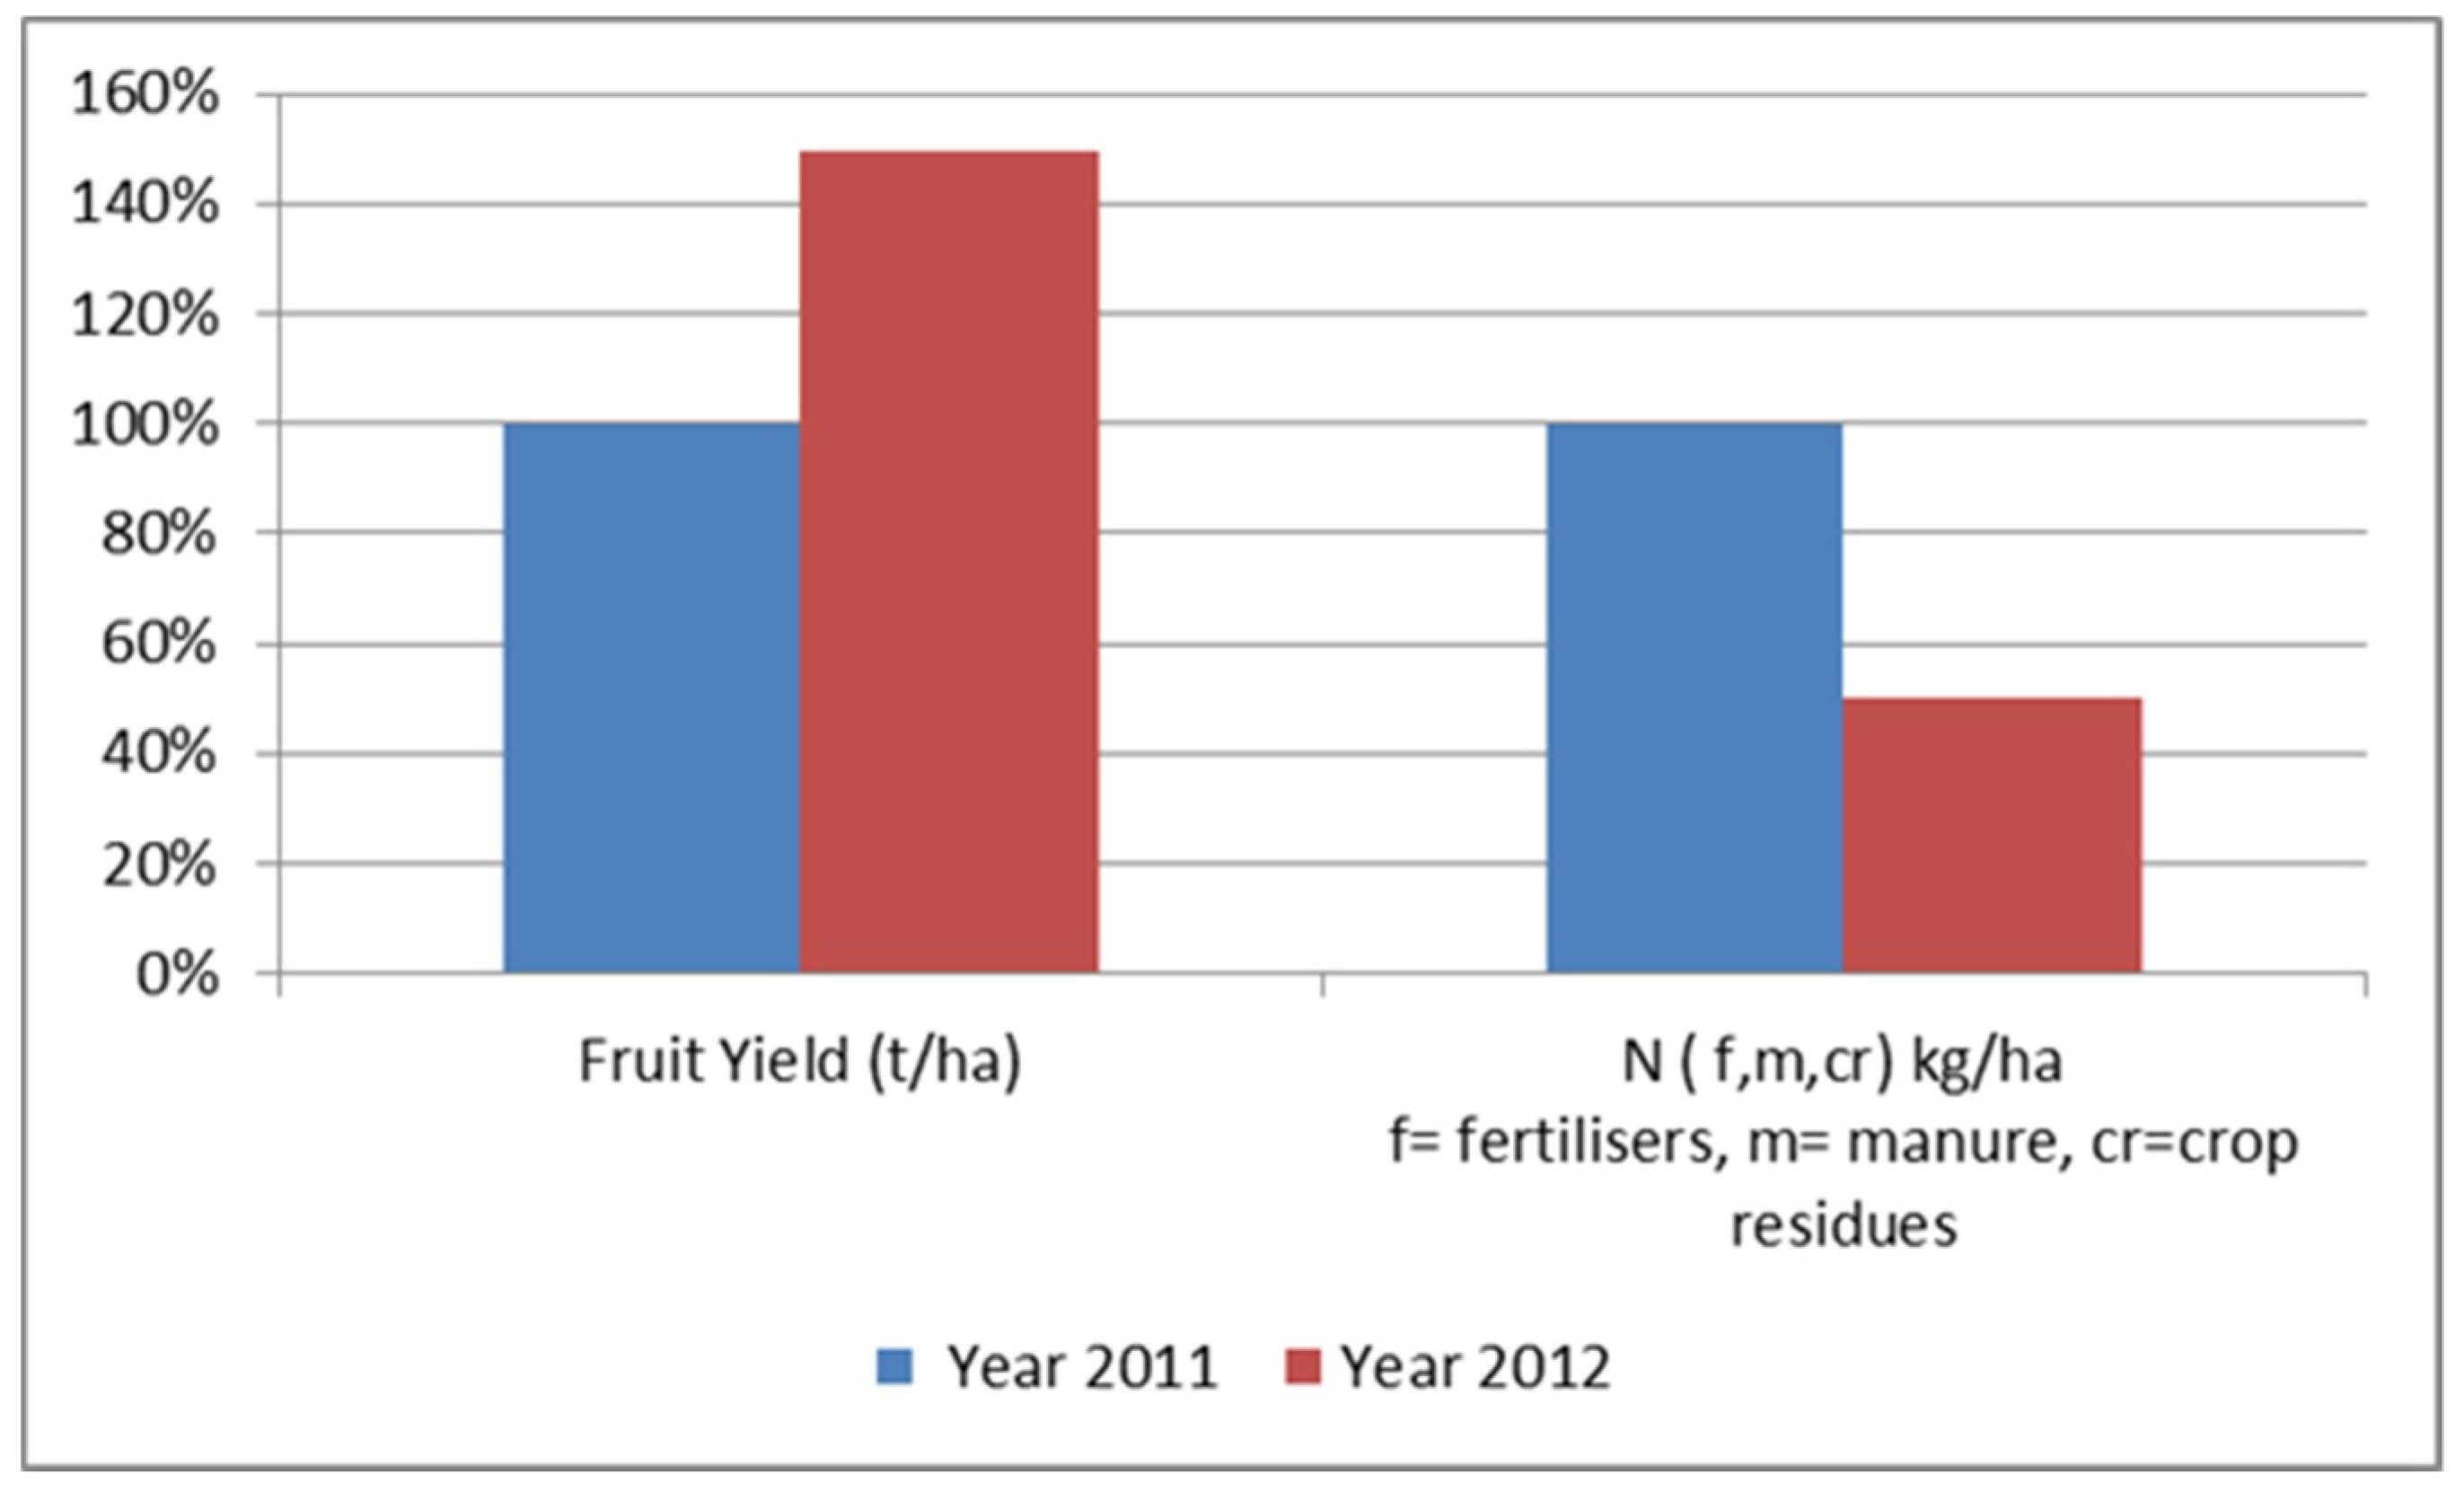
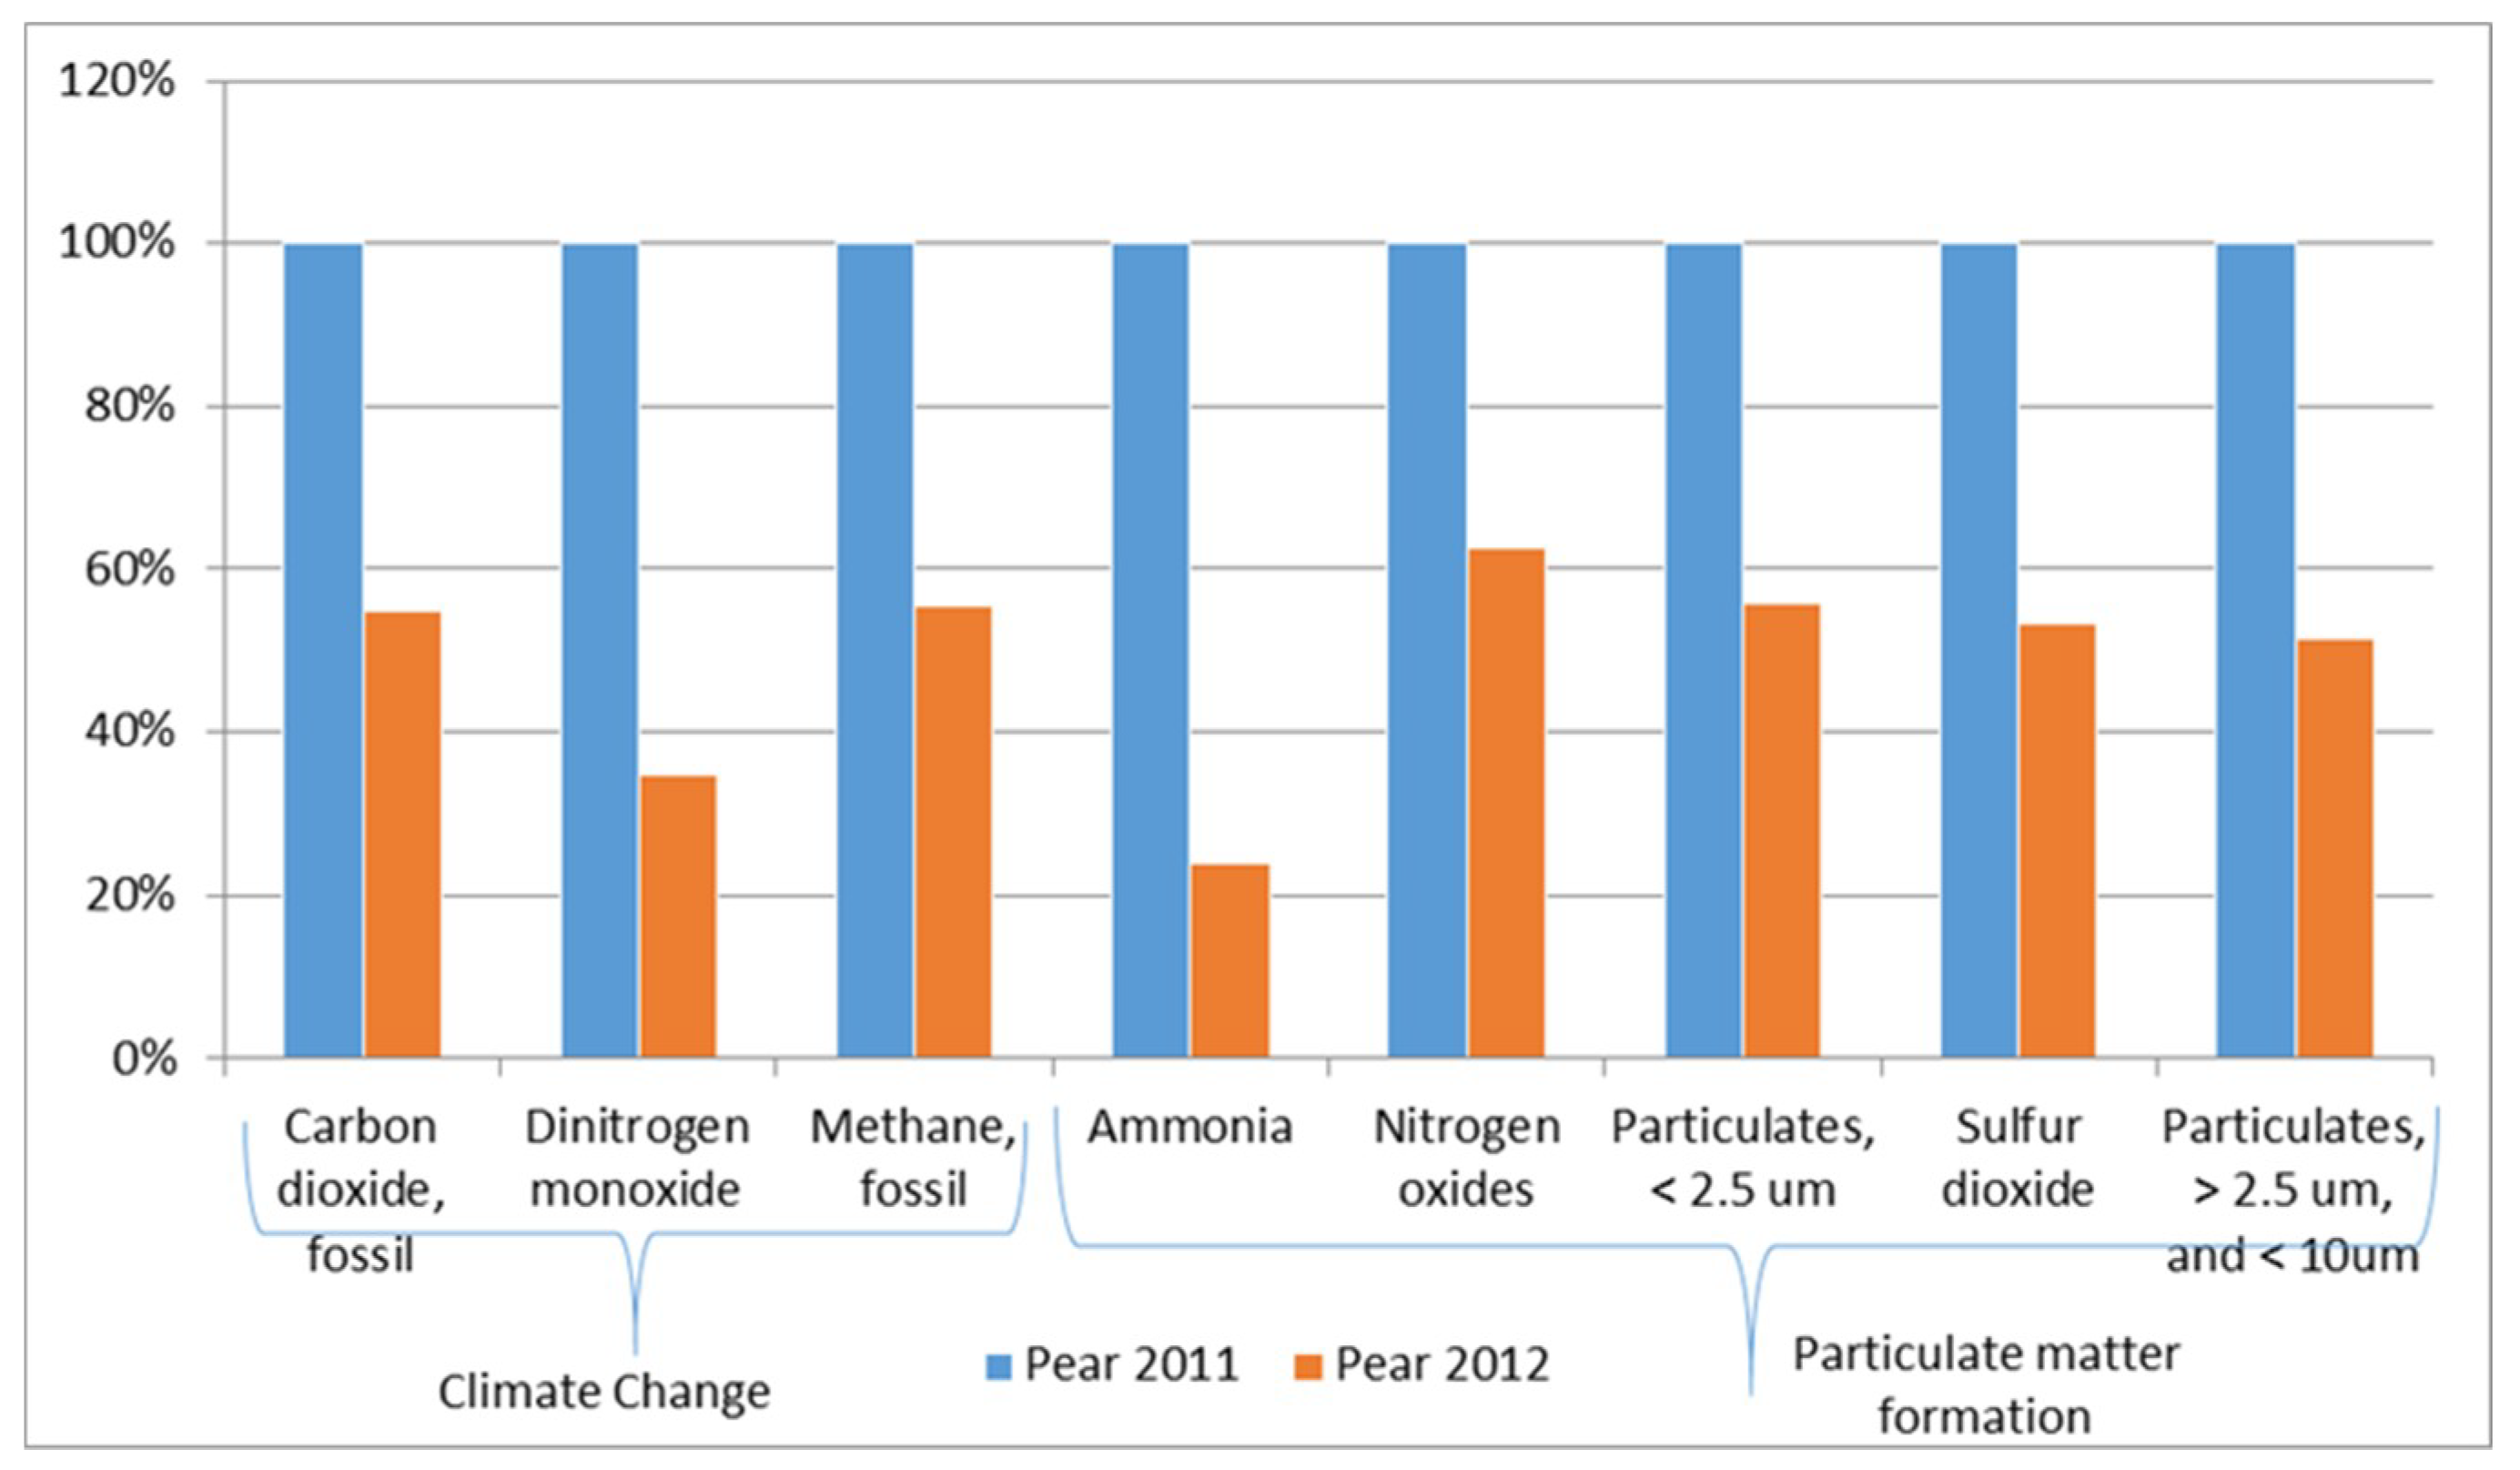
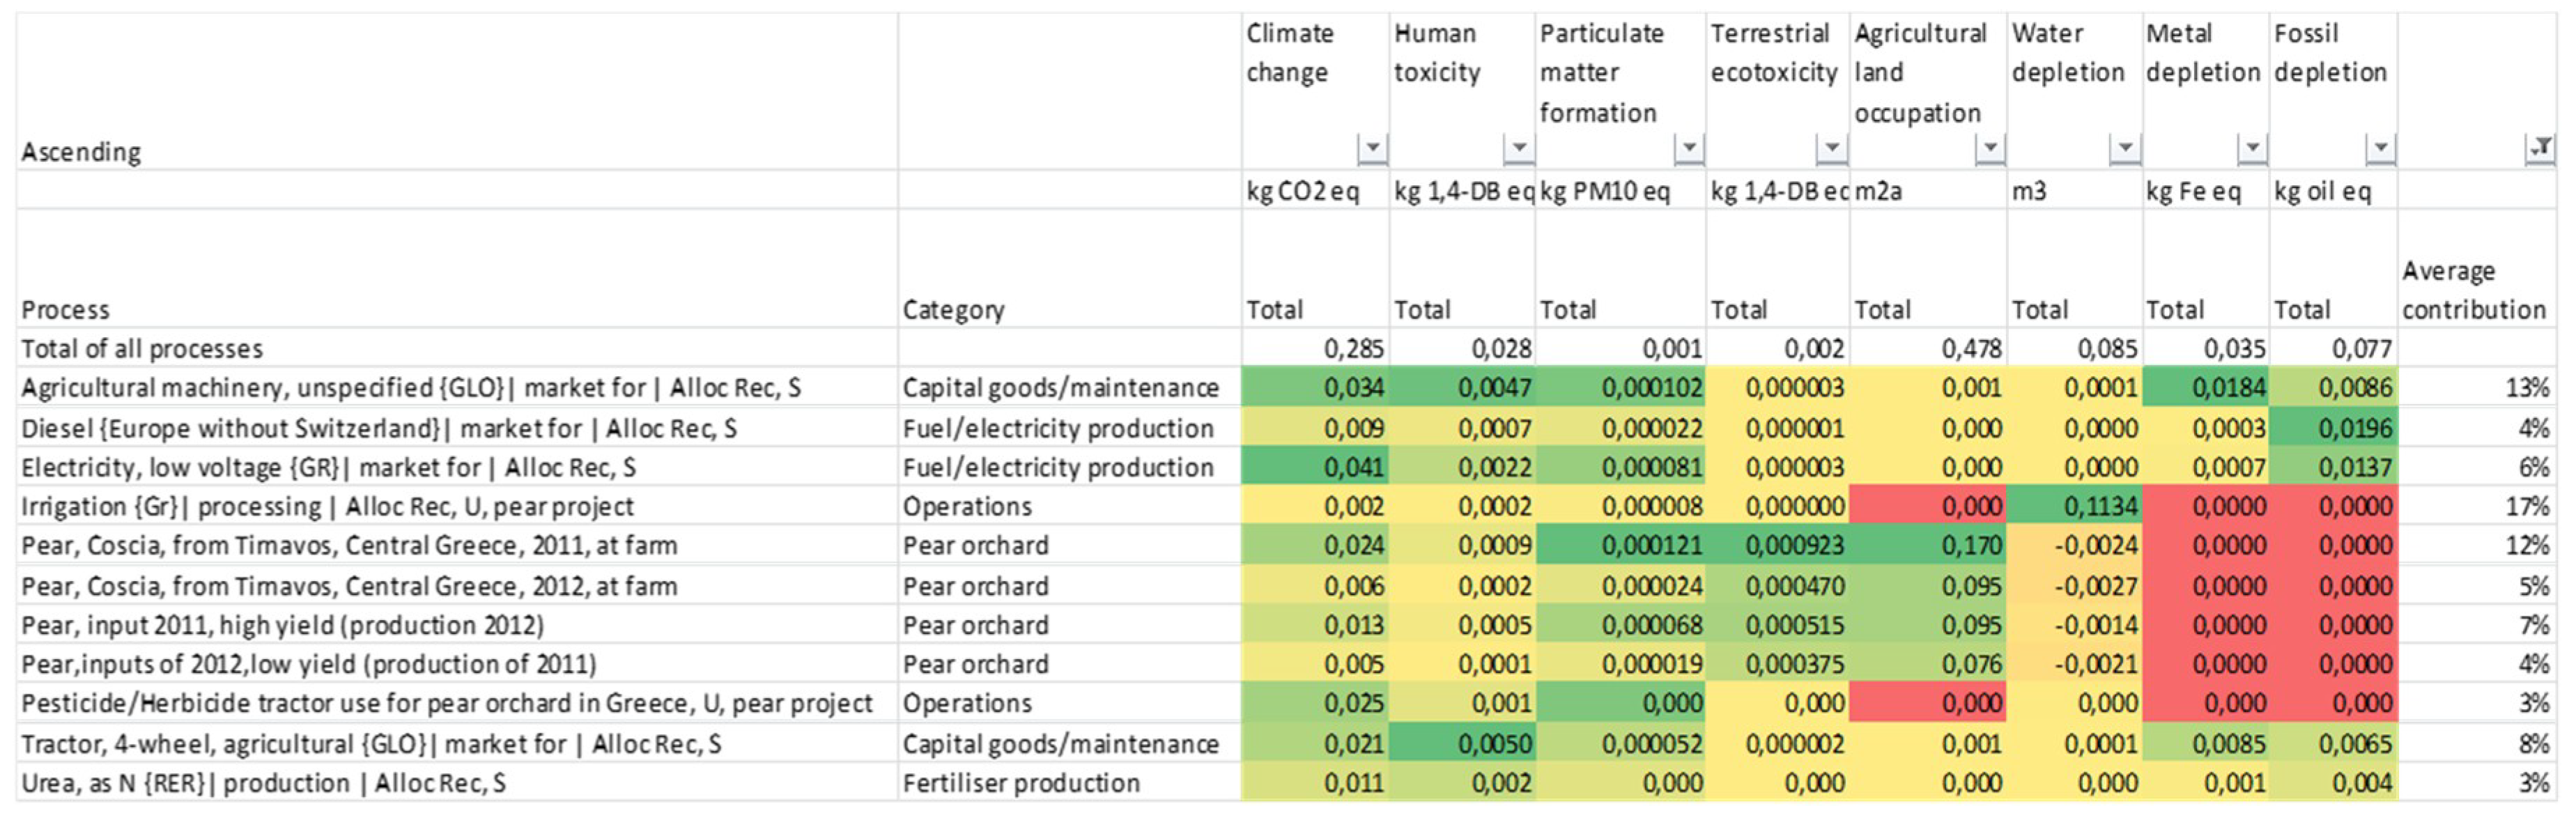
- The LCA analysis of the pear orchard study revealed that although N fertilizer is not dominating, it is still important in the overall environmental impact. High fruit yield was combined with reduced a N fertilization amount, using VRA technique, resulting in the reduction of the important emissions to air coming from the fertilization agricultural practice.
- The irrigation process and specifically the use of electricity affected the environmental impact of the pear study more. Machinery production and pear fruit production in the year 2011 significantly contributed to the environmental impacts of this pear study.
- Maximizing the yield/input ratio, by applying VRA in all impactful inputs like irrigation will improve the environmental profile of the pear orchard. The VRA technique could be used for pesticide application, if it does not negatively affect the productivity per hectare
- N VRA is a practice that can offer considerable reduction of environmental impact when it is combined with high yield. In a low yield year, the VRA technique still presents better environmental behavior compared to uniform application.
- N VRA is a practice that can offer considerable reduction of environmental impacts and should be recommended to farmers as an environmental precision management practice.
Author Contributions
Funding
Conflicts of Interest
Appendix A

| Impact Category | Normalization |
|---|---|
| Climate change Human Health | 2.83 × 10⁻⁵ |
| Ozone depletion | 6.21 × 10⁻⁹ |
| Human toxicity | 1.39 × 10⁻⁶ |
| Photochemical oxidant formation | 4.40 × 10⁻⁹ |
| Particulate matter formation | 1.64 × 10⁻⁵ |
| Ionising radiation | 1.28 × 10⁻⁸ |
| Water scarcity HH | 2.88 × 10⁻⁷ |
| Sub-Total | |
| Climate change Ecosystems | 2.45 × 10⁻⁶ |
| Terrestrial acidification | 2.04 × 10⁻⁸ |
| Freshwater eutrophication | 1.52 × 10⁻⁹ |
| Terrestrial ecotoxicity | 3.78 × 10⁻⁷ |
| Freshwater ecotoxicity | 1.21 × 10⁻⁹ |
| Marine ecotoxicity | 7.28 × 10⁻¹¹ |
| Agricultural land occupation | 8.34 × 10⁻⁶ |
| Urban land occupation | 1.30 × 10⁻⁷ |
| Natural land transformation | 9.21 × 10⁻⁸ |
| Water scarcity EQ | 3.81 × 10⁻⁷ |
| Sub-Total | |
| Metal depletion | 7.02 × 10⁻⁶ |
| Fossil depletion | 3.58 × 10⁻⁵ |
| Water scarcity R | 2.88 × 10⁻⁷ |
| Sub-Total |
| Impact Category | Unit per kg of Pears | Characterisation Results | Importance % | Weighted Results Single Score (Pt) | Importance % | Selection Based on Weighted | Selection Based on Characterized Results |
|---|---|---|---|---|---|---|---|
| Climate change Human Health | DALY * | 4.00 × 10⁻⁷ | 61% | 1.13 × 10⁻² | 27.1% | x | x |
| Ozone depletion | DALY | 8.75 × 10⁻¹¹ | 0% | 2.48 × 10⁻⁶ | 0.0% | ||
| Human toxicity | DALY | 1.95 × 10⁻⁸ | 3% | 5.54 × 10⁻⁴ | 1.3% | x | x |
| Photochemical oxidant formation | DALY | 6.21 × 10⁻¹¹ | 0% | 1.76 × 10⁻⁶ | 0.0% | ||
| Particulate matter formation | DALY | 2.31 × 10⁻⁷ | 35% | 6.55 × 10⁻³ | 15.6% | x | x |
| Ionising radiation | DALY | 1.81 × 10⁻¹⁰ | 0% | 5.14 × 10⁻⁶ | 0.0% | ||
| Climate change Ecosystems | species.yr | 2.26 × 10⁻⁹ | 21% | 9.81 × 10⁻⁴ | 2.3% | x | x |
| Terrestrial acidification | species.yr | 1.88 × 10⁻¹¹ | 0% | 8.14 × 10⁻⁶ | 0.0% | ||
| Freshwater eutrophication | species.yr | 1.41 × 10⁻¹² | 0% | 6.10 × 10⁻⁷ | 0.0% | ||
| Terrestrial ecotoxicity | species.yr | 3.48 × 10⁻¹⁰ | 3% | 1.51 × 10⁻⁴ | 0.4% | x | |
| Freshwater ecotoxicity | species.yr | 1.12 × 10⁻¹² | 0% | 4.84 × 10⁻⁷ | 0.0% | ||
| Marine ecotoxicity | species.yr | 6.71 × 10⁻¹⁴ | 0% | 2.91 × 10⁻⁸ | 0.0% | ||
| Agricultural land occupation | species.yr | 7.69 × 10⁻⁹ | 71% | 3.34 × 10⁻³ | 8.0% | x | x |
| Urban land occupation | species.yr | 1.20 × 10⁻¹⁰ | 1.1% | 5.18 × 10⁻⁵ | 0.1% | ||
| Natural land transformation | species.yr | 8.50 × 10⁻¹¹ | 0.8% | 3.68 × 10⁻⁵ | 0.1% | ||
| Metal depletion | $ | 2.51 × 10⁻³ | 8% | 1.40 × 10⁻³ | 3.4% | x | x |
| Fossil depletion | $ | 1.28 × 10⁻² | 38% | 7.16 × 10⁻³ | 17.1% | x | x |
| Water scarcity HH | DALY | 4.06 × 10⁻⁹ | 0.6% | 1.15 × 10⁻⁴ | 0.3% | ||
| Water scarcity EQ | species.yr | 3.51 × 10⁻¹⁰ | 3.2% | 1.52 × 10⁻⁴ | 0.4% | x | |
| Water scarcity R | $ | 1.79 × 10⁻² | 54% | 1.00 × 10⁻² | 24.0% | x | x |
| Impact Category | Unit | Mean | Median | SD | CV | 2.50% | 97.5% | Std.Err |
|---|---|---|---|---|---|---|---|---|
| Agricultural land occupation | m2a | 0.478 | 0.474 | 0.051 | 11% | 0.386 | 0.586 | 0.001 |
| Climate change | kg CO2 eq | 0.286 | 0.285 | 0.016 | 6% | 0.256 | 0.319 | 0.001 |
| Fossil depletion | kg oil eq | 0.077 | 0.077 | 0.008 | 10% | 0.064 | 0.094 | 0.001 |
| Human toxicity | kg 1.4-DB eq | 0.028 | 0.027 | 0.006 | 21% | 0.017 | 0.040 | 0.002 |
| Metal depletion | kg Fe eq | 0.035 | 0.034 | 0.006 | 18% | 0.025 | 0.049 | 0.002 |
| Particulate matter formation | kg PM10 eq | 0.001 | 0.001 | 0.000 | 6% | 0.001 | 0.001 | 0.001 |
| Terrestrial ecotoxicity | kg 1.4-DB eq | 0.002 | 0.002 | 0.000 | 7% | 0.002 | 0.003 | 0.001 |
| Water depletion | m3 | 0.084 | 0.088 | 0.051 | 60% | −0.027 | 0.176 | 0.006 |
| Substance | Compartment | Unit | Total |
|---|---|---|---|
| Total of all compartments | % | 100.00 | |
| Remaining substances | % | 0.283 | |
| Carbon dioxide, fossil | Air | % | 77.14 |
| Dinitrogen monoxide | Air | % | 18.54 |
| Methane. fossil | Air | % | 4.03 |
| Substance | Compartment | Unit | Total |
|---|---|---|---|
| Total of all compartments | % | 100 | |
| Remaining substances | % | 6.89 | |
| Arsenic | Air | % | 19.83 |
| Lead | Air | % | 18.21 |
| Mercury | Air | % | 11.46 |
| Zinc | Soil | % | 6.68 |
| Antimony | Air | % | 2.93 |
| Arsenic | Water | % | 3.63 |
| Barium | Water | % | 5.00 |
| Cadmium | Air | % | 4.51 |
| Chlorine | Air | % | 2.80 |
| Chlorpyrifos | Soil | % | 3.22 |
| Chlorpyrifos methyl | Soil | % | 2.44 |
| Manganese | Water | % | 2.11 |
| Mercury | Water | % | 1.41 |
| Vanadium | Air | % | 7.82 |
| Zinc | Air | % | 1.07 |
| Substance | Compartment | Unit | Total |
|---|---|---|---|
| Total of all compartments | % | 100.00 | |
| Remaining substances | % | 0.000057 | |
| Nitrogen oxides | Air | % | 28.54 |
| Ammonia | Air | % | 26.97 |
| Particulates, <2.5 μm | Air | % | 18.53 |
| Sulphur dioxide | Air | % | 17.92 |
| Particulates, >2.5 μm and <10 μm | Air | % | 8.04 |

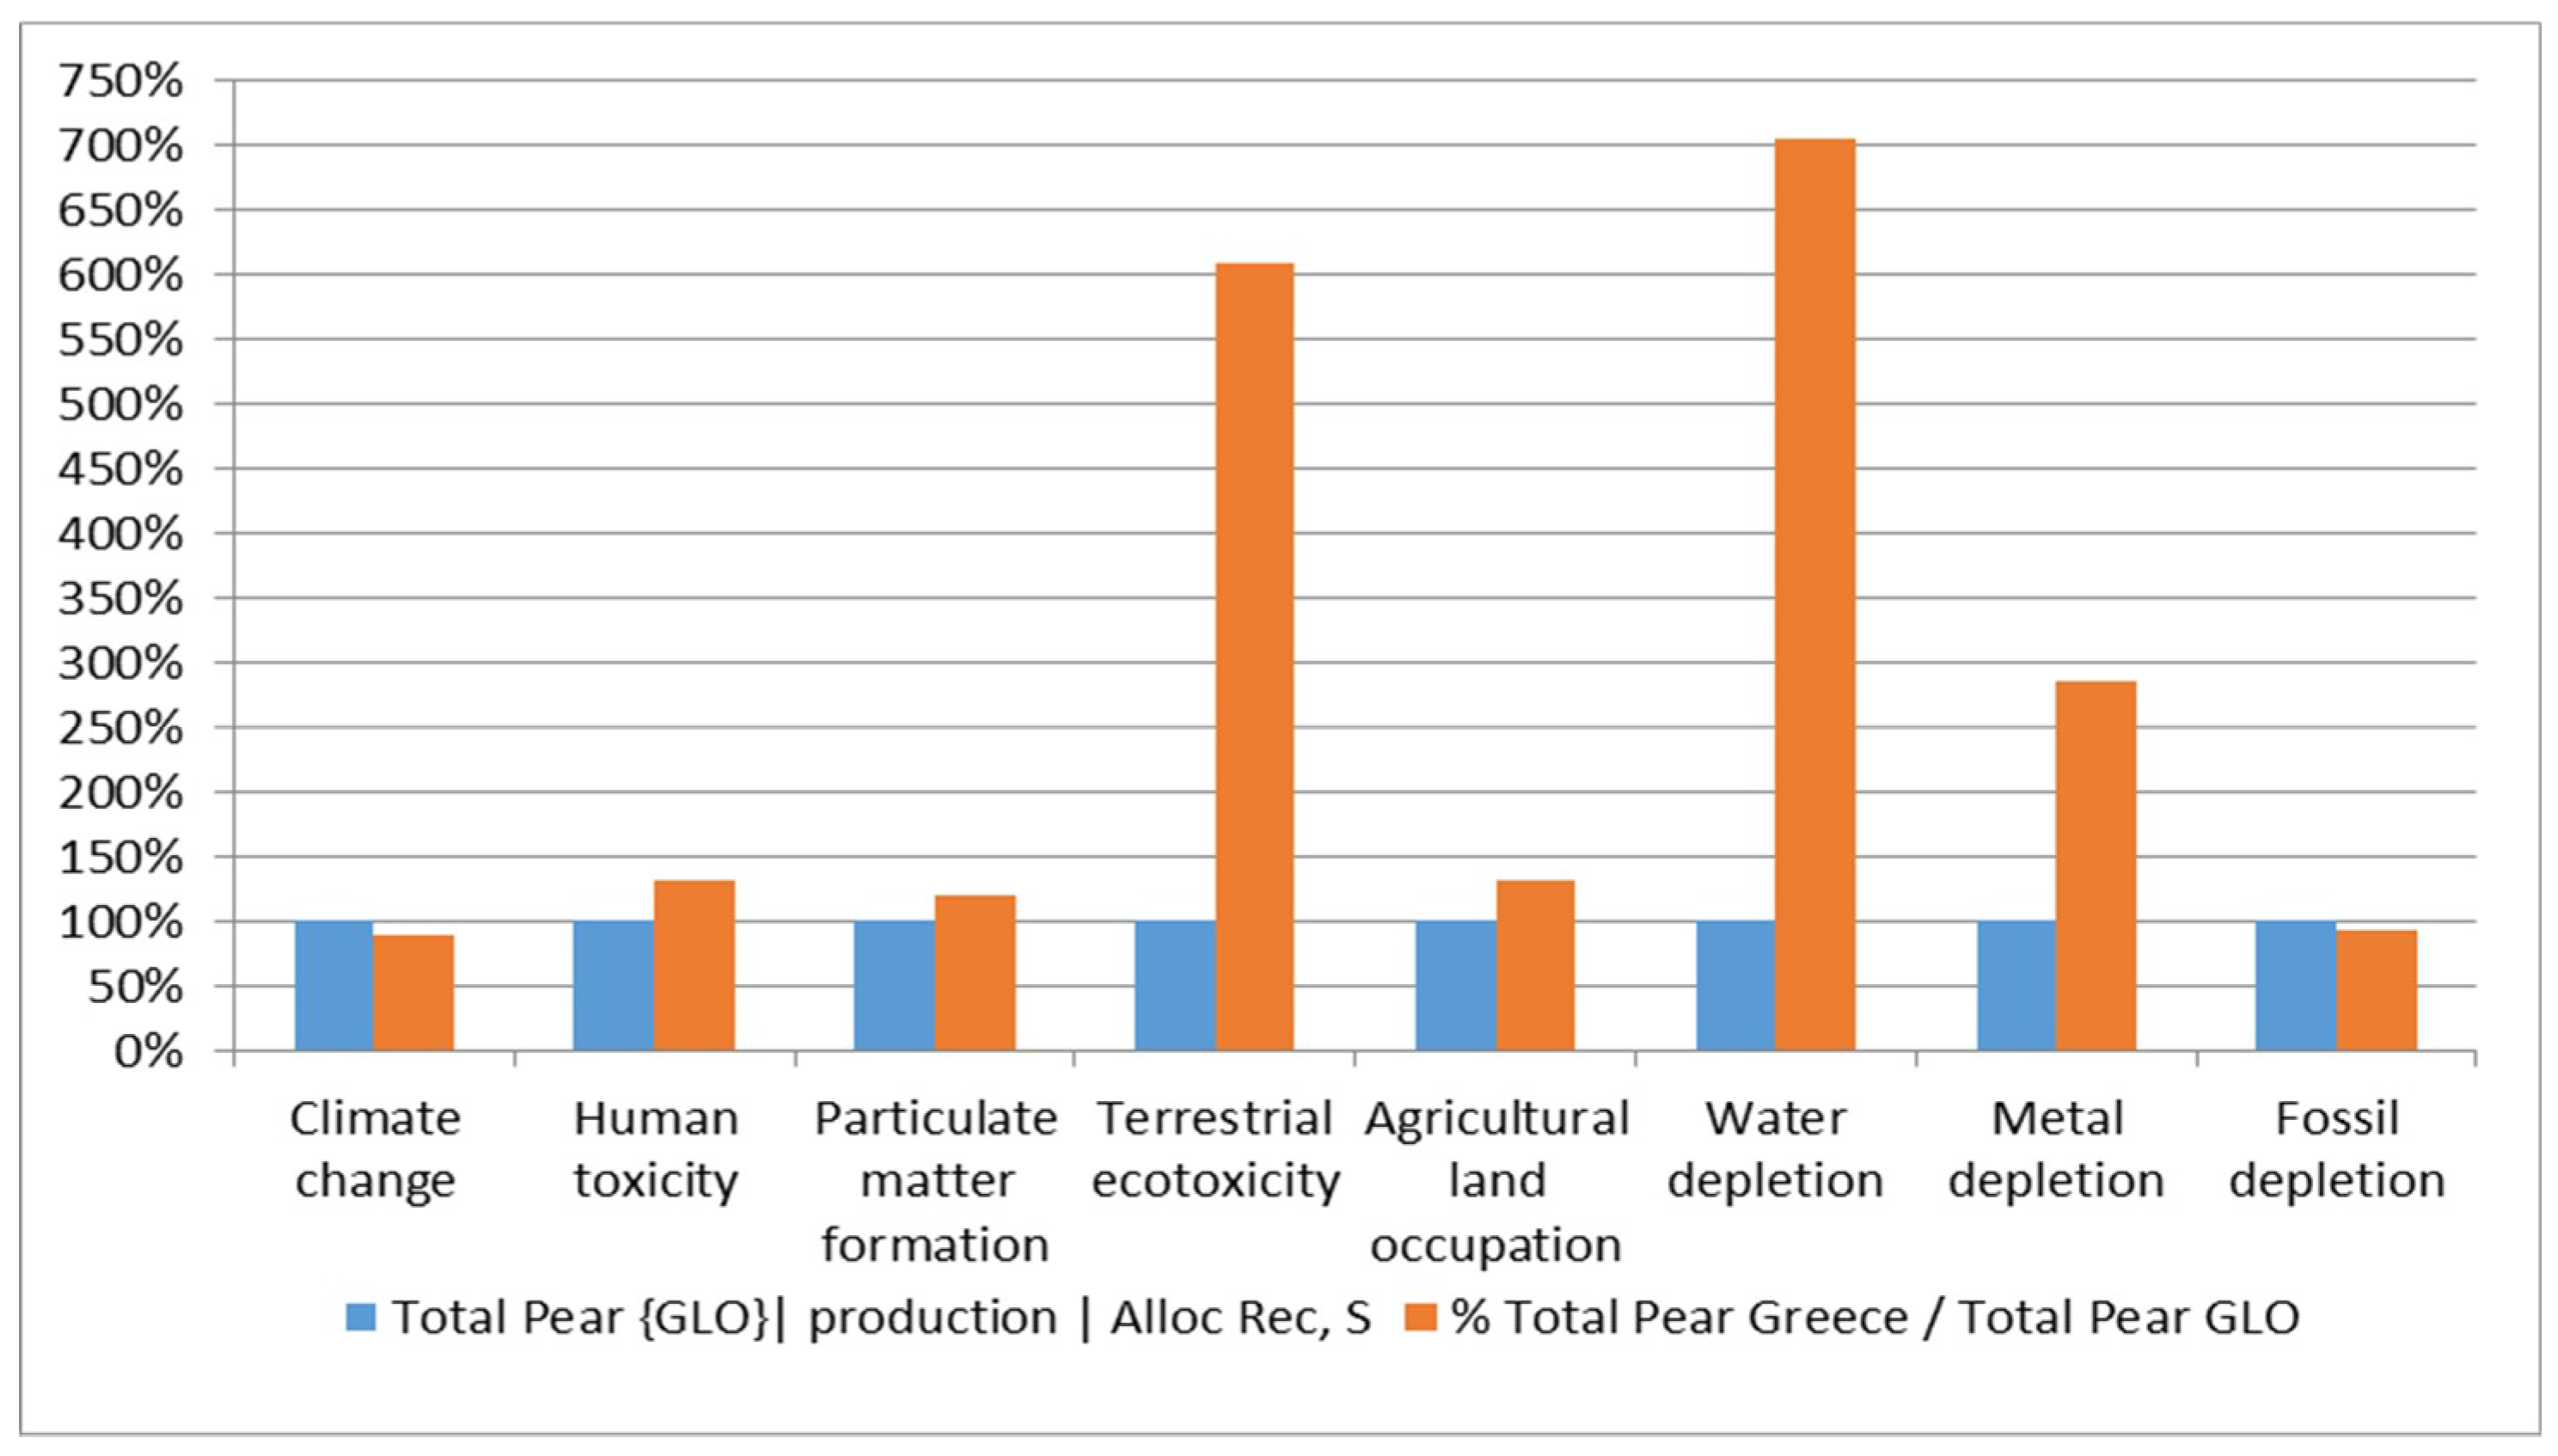
| Impact Category | Unit | Total Pear {GLO}| Production Alloc Rec. S | Total Pear Greece Production | % Total Pear Greece/Total Pear GLO |
|---|---|---|---|---|
| Climate change | kg CO2 eq | 0.3157 | 0.282 | 89% |
| Human toxicity | kg 1.4-DB eq | 0.0198 | 0.026 | 132% |
| Particulate matter formation | kg PM10 eq | 0.0007 | 0.001 | 119% |
| Terrestrial ecotoxicity | kg 1.4-DB eq | 0.0004 | 0.002 | 609% |
| Agricultural land occupation | m2a | 0.3684 | 0.486 | 132% |
| Water depletion | m3 | 0.0123 | 0.087 | 705% |
| Metal depletion | kg Fe eq | 0.0124 | 0.035 | 285% |
| Fossil depletion | kg oil eq | 0.0816 | 0.076 | 93% |
References
- Lal, R. Soil carbon sequestration to mitigate climate change. Geoderma 2004, 123, 1–22. [Google Scholar] [CrossRef]
- de Moraes Sá, J.C.; Lal, R.; Cerri, C.C.; Lorenz, K.; Hungria, M.; de Faccio Carvalho, P.C. Low-carbon agriculture in South America to mitigate global climate change and advance food security. Environ. Int. 2017, 98, 102–112. [Google Scholar] [CrossRef]
- Pimentel, D. Soil erosion: A food and environmental threat. Environ. Dev. Sustain. 2006, 8, 119–137. [Google Scholar] [CrossRef]
- Montgomery, D.R. Soil erosion and agricultural sustainability. Proc. Natl. Acad. Sci. USA 2007, 104, 13268–13272. [Google Scholar] [CrossRef] [PubMed]
- Biddoccu, M.; Guzmán, G.; Capello, G.; Thielke, T.; Strauss, P.; Winter, S.; Zaller, J.G.; Nicolai, A.; Cluzeau, D.; Popescu, D.; et al. Evaluation of soil erosion risk and identification of soil cover and management factor (C) for RUSLE in European vineyards with different soil management. Int. Soil Water Conserv. Res. 2020. [Google Scholar] [CrossRef]
- Morison, J.I.L.; Baker, N.R.; Mullineaux, P.M.; Davies, W.J. Improving water use in crop production. Philos. Trans. R. Soc. B Biol. Sci. 2008, 363. [Google Scholar] [CrossRef]
- Zahoor, S.A.; Ahmad, S.; Ahmad, A.; Wajid, A.; Khaliq, T.; Mubeen, M.; Hussain, S.; Din, M.S.U.; Amin, A.; Awais, M.; et al. Improving water use efficiency in agronomic crop production. In Agronomic Crops; Management Practices; Springer: Singapore, 2019; Volume 2, pp. 13–29. [Google Scholar] [CrossRef]
- Juraske, R.; Sanjuán, N. Life cycle toxicity assessment of pesticides used in integrated and organic production of oranges in the Comunidad Valenciana, Spain. Chemosphere 2011, 82, 956–962. [Google Scholar] [CrossRef]
- Stoate, C.; Báldi, A.; Beja, P.; Boatman, N.D.; Herzon, I.; van Doorn, A.; de Snoo, G.R.; Rakosy, L.; Ramwell, C. Ecological impacts of early 21st century agricultural change in Europe—A review. J. Environ. Manag. 2009, 91, 22–46. [Google Scholar] [CrossRef]
- de Souza, R.M.; Seibert, D.; Quesada, H.B.; de Jesus Bassetti, F.; Fagundes-Klen, M.R.; Bergamasco, R. Occurrence, impacts and general aspects of pesticides in surface water: A review. Process Saf. Environ. Prot. 2020, 135, 22–37. [Google Scholar] [CrossRef]
- Henryson, K.; Kätterer, T.; Tidåker, P.; Sundberg, C. Soil N2O emissions, N leaching and marine eutrophication in life cycle assessment—A comparison of modelling approaches. Sci. Total Environ. 2020, 725, 138332. [Google Scholar] [CrossRef]
- Sarkar, D.; Kar, S.K.; Chattopadhyay, A.; Shikha; Rakshit, A.; Tripathi, V.K.; Dubey, P.K.; Abhilash, P.C. Low input sustainable agriculture: A viable climate-smart option for boosting food production in a warming world. Ecol. Indic. 2020, 115, 106412. [Google Scholar] [CrossRef]
- Tasca, A.L.; Nessi, S.; Rigamonti, L. Environmental sustainability of agri-food supply chains: An LCA comparison between two alternative forms of production and distribution of endive in northern Italy. J. Clean. Prod. 2017, 140, 725–741. [Google Scholar] [CrossRef]
- Kulak, M.; Nemecek, T.; Frossard, E.; Gaillard, G. How eco-efficient are low-input cropping systems in Western Europe, and what can be done to improve their eco-efficiency? Sustainability 2013, 5, 3722–3743. [Google Scholar] [CrossRef]
- Bacenetti, J.; Paleari, L.; Tartarini, S.; Vesely, F.M.; Foi, M.; Movedi, E.; Ravasi, R.A.; Bellopede, V.; Durello, S.; Ceravolo, C.; et al. May smart technologies reduce the environmental impact of nitrogen fertilization? A case study for paddy rice. Sci. Total Environ. 2020, 715, 136956. [Google Scholar] [CrossRef]
- Zude-Sasse, M.; Fountas, S.; Gemtos, T.A.; Abu-Khalaf, N. Applications of precision agriculture in horticultural crops. Eur. J. Hortic. Sci. 2016, 81, 78–90. [Google Scholar] [CrossRef]
- Zaman, Q.U.; Schumann, A.W.; Miller, W.M. Variable rate nitrogen application in Florida citrus based on ultrasonically-sensed tree size. Appl. Eng. Agric. 2005, 21, 331–335. [Google Scholar] [CrossRef]
- Li, A.; Duval, B.D.; Anex, R.; Scharf, P.; Ashtekar, J.M.; Owens, R.P.; Ellis, C. A Case Study of Environmental Benefits of Sensor-Based Nitrogen Application in Corn. J. Environ. Qual. 2016, 45, 675–683. [Google Scholar] [CrossRef]
- Vatsanidou, A.; Nanos, G.D.; Fountas, S.; Baras, J.; Castrignano, A.; Gemtos, T.A. Nitrogen replenishment using variable rate application technique in a small hand-harvested pear orchard. Span. J. Agric. Res. 2017, 15, e0209. [Google Scholar] [CrossRef]
- Liakos, V.; Smith, E.; Fountas, S.; Nanos, G.; Kalfountzos, D.; Gemtos, T. On-Farm Evaluation of Variable Rate Fertiliser Applications Using Yield-Based Mathematical Formulae in a Greek Apple Orchard. Int. J. Fruit Sci. 2020, 1–18. [Google Scholar] [CrossRef]
- Johnson, C.K.; Mortensen, D.A.; Wienhold, B.J.; Shanahan, J.F.; Doran, J.W. Site-specific management zones based on soil electrical conductivity in a semiarid cropping system. Agron. J. 2003, 95, 303–315. [Google Scholar] [CrossRef]
- Heege, H.J. Precision in Crop Farming: Site Specific Concepts and Sensing Methods: Applications and Results; Springer Science and Business Media: Dordrecht, The Netherlands, 2013. [Google Scholar] [CrossRef]
- Basso, B.; Dumont, B.; Cammarano, D.; Pezzuolo, A.; Marinello, F.; Sartori, L. Environmental and economic benefits of variable rate nitrogen fertilization in a nitrate vulnerable zone. Sci. Total Environ. 2016, 545–546, 227–235. [Google Scholar] [CrossRef] [PubMed]
- van Evert, F.K.; Gaitán-Cremaschi, D.; Fountas, S.; Kempenaar, C. Can precision agriculture increase the profitability and sustainability of the production of potatoes and olives? Sustainability 2017, 9, 1863. [Google Scholar] [CrossRef]
- Bongiovanni, R.; Lowenberg-Deboer, L. Precision Agriculture and Sustainability. Prec. Agric. 2004, 5, 359–387. [Google Scholar] [CrossRef]
- English, C.B.; Mahajanashetti, S.B.; Roberts, R.K. Economic and Environmental Benefit of Variable Rate Application of Nitrogen to Corn Fields: Role of Variability and Weather. Selected Paper. In Proceedings of the American Agricultural Economics Association Meeting, Nashville, TN, USA, 8–11 August 1999. [Google Scholar]
- Kholsa, R.; Shaver, T.M.; Reich, R.M.; Gangloff, W.J. Evaluating Management Zones for Variable Rate Nitrogen Management in Corn. In Proceedings of the Third International Conference on Geospatial Information in Agriculture and Forestry, Denver, CO, USA, 5–7 November 2001. [Google Scholar]
- Roberts, R.; English, B.; Mahajanashetti, S. Environmental and economic effects of spatial variability and weather. In Proceedings of the 3rd European Conference on Precision Agriculture, Montpellier, France, 18–20 June 2001; pp. 545–550. [Google Scholar]
- Basso, B.; Sartori, L.; Cammarano, D.; Fiorentino, C.; Grace, R.P.; Fountas, S.; Sorensen, A.C. Environmental and economic evaluation of N fertiliser rates in a maize crop in Italy: A spatial and temporal analysis using crop models. Biosyst. Eng. 2012, 113, 103–111. [Google Scholar] [CrossRef]
- Balafoutis, A.T.; Koundouras, S.; Anastasiou, E.; Fountas, S.; Arvanitis, K. Life cycle assessment of two vineyards after the application of precision viticulture techniques: A case study. Sustainability 2017, 9, 1997. [Google Scholar] [CrossRef]
- Guinée, J.B. Handbook on life cycle assessment operational guide to the ISO standards. Int. J. Life Cycle Assess. 2002, 7, 311–313. [Google Scholar] [CrossRef]
- Ponsioen, T.C.; Van Der Werf, H.M.G. Five propositions to harmonize environmental footprints of food and beverages. J. Clean. Prod. 2017, 153, 457–464. [Google Scholar] [CrossRef]
- Mila i Canals, L.; Burni, G.M.; Cowell, S.J. Evaluation of the environmental impacts of apple production using Life Cycle Assessment (LCA): Case study in New Zealand. Agric. Ecosyst. Environ. 2006, 114, 226–238. [Google Scholar] [CrossRef]
- Beccali, M.; Cellura, M.; Iudicello, M.; Mistretta, M. Resources consumption and environmental impacts of the agro-food sector. Life cycle assessment of Italian citrus based products. J. Environ. Manag. 2009, 43, 707–724. [Google Scholar] [CrossRef]
- Ingwersen, W.W. Life cycle assessment of fresh pineapple from Costa Rica. J. Clean. Prod. 2012, 35, 152–163. [Google Scholar] [CrossRef]
- Ingrao, C.; Matarazzo, A.; Tricase, C.; Clasadonte, M.T.; Huisingh, D. Life Cycle Assessment for highlighting environmental hotspots in Sicilian peach production systems. J. Clean. Prod. 2015, 92, 109–120. [Google Scholar] [CrossRef]
- Vinyes, E.; Gasol, C.M.; Asin, L.; Alegre, S.; Muñoz, P. Life Cycle Assessment of multiyear peach production. J. Clean. Prod. 2015, 104, 68–79. [Google Scholar] [CrossRef]
- Liu, Y.; Langer, V.; Høgh-Jensen, H.; Egelyng, H. Life Cycle Assessment of fossil energy use and greenhouse gas emissions in Chinese pear production. J. Clean. Prod. 2010, 18, 1423–1430. [Google Scholar] [CrossRef]
- ISO 14040. Environmental Management—LCA—Principles and Framework; International Organization for Standardization: Geneva, Switzerland, 2006. [Google Scholar]
- ISO 14044. Environmental Management—LCA—Requirements and Guidelines; International Organization for Standardization: Geneva, Switzerland, 2006. [Google Scholar]
- SimaPro, version 8.0.4.30; Consultants software; PRé: Amersfoort, The Netherlands, 2016.
- USDA-NRCS. Keys to Soil Taxonomy, 8th ed.; USDA-Natural Resources Conservation Service: Washington, DC, USA, 1998.
- Yusoff, S.; Hansen, S.B. Feasibility study of performing a life cycle assessment on crude palm oil production in Malaysia. Int. J. Life Cycle Assess. 2007, 12, 50–58. [Google Scholar]
- Rocco, M. Accounting for human labour in LCA: A novel Input-Output approach. In Life Cycle Thinking, Sostenibilità ed Economia Circolare, Proceedings of the V Conference of the Italian LCA Network, Ravenna, Italy, 23–24 June 2016; Loprieno, A.D., Scalbi, S., Righi, S., Eds.; ENEA: Rome, Italy, 2016. [Google Scholar]
- Cerruti, A.K.; Bagliani, M.; Beccaro, G.L.; Bounous, G. Application of ecological footprint analysis on nectarine production: Methodological issues and results from a case study in Italy. J. Clean. Prod. 2010, 18, 771–776. [Google Scholar] [CrossRef]
- Ecoinvent Database. Ecoinvent Data v3.1, Life Cycle Inventory Database. Available online: https://www.ecoinvent.org/database/older-versions/ecoinvent-31/ecoinvent-31.html/. (accessed on 21 July 2020).
- Weidema, B.P.; Meeusen, M.J.G. Agricultural Data for Life Cycle Assessments; Report 2.00.01; Agricultural Economics Research Institute (LEI): The Hague, The Netherlands, 1999; ISBN 90-5242-563-9. [Google Scholar]
- Nemecek, T.; Bengoa, X.; Lansche, J.; Mouron, P.; Rossi, V.; Humbert, S. Methodological Guidelines for the Life Cycle Inventory of Agricultural Products; Version 2.0.; World Food LCA Database (WFLDB) Quantis and Agroscope: Lausanne/Zurich, Switzerland, 2014. [Google Scholar]
- IPCC Revised Good Practice Guidelines for Greenhouse Gas Inventories. Available online: https://www.ipcc-nggip.iges.or.jp/public/2006gl/vol4.html (accessed on 21 July 2020).
- Nemecek, T.J.; Schnetzer, J.; Reinhard, J. Updated and harmonised greenhouse gas emissions for crop inventories. Int. J. Life Cycle Assess. 2014, 21, 1361–1378. [Google Scholar] [CrossRef]
- Nemecek, T.; Schnetzer, J. Methods of Assessment of Direct Field Emissions for LCIs of Agricultural Production Systems, Data v3.0; Agroscope, ART CH-8046; Reckenholz-Tänikon Research Station: Zurich, Switzerland, 2012. [Google Scholar]
- Vatsanidou, A. Environmental Assessment of New Technologies: Two Case Studies, in Pear Orchard and in Energy Crops. Ph.D. Thesis, University of Thessaly, Volos, Greece, 2017. [Google Scholar]
- Goedkoop, M.; Huijbregts, M. Characterisation. In ReCiPe 2008; VROM: The Hague, The Netherlands, 2013; pp. 4–20. [Google Scholar]
- Pfister, S.; Saner, D.; Koehler, A. The environmental relevance of freshwater consumption in global power production. Int. J. Life Cycle Assess. 2011, 16, 580–591. [Google Scholar] [CrossRef]
- Stoessel, F.; Juraske, R.; Pfister, S.; Hellweg, S. Life Cycle Inventory and Carbon and Water Food Print of Fruits and Vegetables: Application to a Swiss Retailer. Environ. Sci. Technol. 2012, 46, 3253–3262. [Google Scholar] [CrossRef]
- Webster, A.D. Factors influencing the flowering, fruit set and fruit growth of European pears. Acta Horticult. 2002, 596, 699–709. [Google Scholar] [CrossRef]


| Pear Production | Conventional | Variable Rate Application | |
|---|---|---|---|
| Inputs | First 3 Years | Year 2011 | Year 2012 |
| Recourses | |||
| Precipitation (m3/ha) | 18,350 | 4050 | 6090 |
| Land use (ha) | 1 | 1 | 1 |
| Material/Processes | |||
| Tillage ploughing/diesel consumption (kg) | 25.06 | no | no |
| Irrigation (m3) | 4353 | 3870 | 2830 |
| Fertiliser tractor use/diesel consumption (kg) | no | 29.74 | 11.65 |
| Fertilisers | |||
| a. N (kg) all sources (manure, crop residues) | no | 251.42 | 126.58 |
| b. P2O5 (kg) | no | 100.86 | 11.24 |
| c. K2O (kg) | no | 128.1 | 134.91 |
| d. H3BO3 (kg) | no | 0.826 | no |
| e. CaO (kg) | no | no | 18.18 |
| Herbicides weed control/Mower tractor use/diesel consumption (kg) | no | 91.52 | 93.17 |
| Herbicide (kg) | no | 10.66 | 10.66 |
| Pesticide tractor use/diesel consumption (kg) | no | 137.38 | 151.42 |
| Pesticides (kg) | 4.85 | 12.65 | 10.88 |
| Thinning tractor use/diesel consumption (kg) | no | 24.42 | 24.86 |
| Pruning tractor use/diesel consumption (kg) | no | 33.57 | 34.18 |
| Harvesting tractor use/diesel consumption (kg) | no | 57.95 | 74.58 |
| Transportation/petrol (kg) consumption (inputs/pear transport to retail) | 0.89 | 24.58 | 24.74 |
| Transportation (tkm) inputs to agriculture stores | 14.55 | 1979 | 1254 |
| Outputs | |||
| Pear production (t) | 0.909 | 18.81 | 28.11 |
| Emission to air, water and soil | |||
| Flow | Reliability of Source | Representativeness/Completeness | Temporal Correlation | Geographical Correlation | Further Technological Correlation |
|---|---|---|---|---|---|
| Inorganic Fertilisers | 1 | 1 | 2 | 1 | 1 |
| Manure | 1 | 2 | 2 | 1 | 2 |
| Fertiliser application | 1 | 2 | 2 | 1 | 2 |
| Pesticides | 1 | 1 | 2 | 1 | 1 |
| Pesticide application | 1 | 2 | 2 | 1 | 2 |
| Irrigation | 1 | 4 | 4 | 1 | 1 |
| Mower use | 1 | 2 | 2 | 1 | 2 |
| Thinning/Pruning | 1 | 2 | 2 | 1 | 2 |
| Harvesting | 1 | 2 | 2 | 1 | 2 |
| Transport inputs to field | 1 | 2 | 2 | 1 | 2 |
| Transport of inputs to agri-stores | 1 | 1 | 4 | 5 | 4 |
| Emissions to air | 1 | 1 | 2 | 1 | 1 |
| Emissions to water | 1 | 1 | 2 | 1 | 1 |
| Emissions to soil | 1 | 1 | 2 | 1 | 1 |
| Pear Production | |||||
|---|---|---|---|---|---|
| Outputs: Emissions | First 3 Years | Year 2011 | Year 2012 | Emission Factor (EF)/Parameters | Equations Used |
| a. Emission to air | |||||
| Water m3 | 7402 | 7620 | 8625 | ETc = ETo × Kc | |
| Ammonia (kg) NH3 | no | 21.4 | 7.7 | NPK-N = 0.04 kgNH3-N/kgN AS-N = 0.08 kgNH3-N/kgN Urea-N = 0.15 kgNH3-N/kgN Manure-N = 0.0275 kgNH3-N/kgN Conversion NH3-N to NH3 = 1.21 kgNH3/kg NH3-N | Basic equation: kgN (f + m) × EF × 1.21 Manure equation: NH3-N = TAN × (er + c_app) × cx. (Nemeck and Schnetzer 2012) f = fertiliser, m = manure |
| Nitrous oxide or Dinitrogen monoxide N2O (kg) | no | 4.3 | 2.1 | NH3 EF = 0.01 kg N2O-N/kg NH3-N NO3-N EF = 0.0075 kg N2O-N/kg NO3-N N2O EF = 0.01 kg N2O-N/kg N Conversion N2O-N to N2O = 1.57 kg N2O/kg N2O-N | Basic equation: 1.57 × kg N (f + m + c) × (direct EF N2O + indirect EF NH3 × NH3-N+ indirect EF NO3- × NO3-N), (IPCC, 2006) f = fertiliser, m = manure, c = crop residues |
| Nitrogen oxides, NOx | no | 0.9 | 0.4 | Nox EF = 0.21 kg NOx/kg N2O | Basic equation: 0.21 × kg N2O |
| CO2 fossil (kg) | no | 134.6 | 26.3 | 1 kg of Urea-N = 1.57 kg CO2 | Basic equation: kg Urea-N × 1.57 |
| b. Emission to water | |||||
| water m3 | 15,301 | 200 | 395 | (Irrig + precipit) − ETc = Ground Water | |
| Phosphate (PO43−) (kg) | no | 0.07 | 0.07 | Constant value of PO43− for a land use category = 0.07 kg/ha/a | Pgw = Pgwl × Fgw (Nemeck and Schnetzer 2012 Pgwl = average P leached to ground water, Fgw = correction factor for fertilisation by slurry |
| Nitrate NO3− (kg) (leaching) | no | 24.4 | 13.8 | NO3− in irrigation water = 122 ppm (2011) NO3− in irrigation water = 35 ppm (2012) | Basic equation: water leached × NO3− in water irrigation |
| Nitrate NO3− (kg) (extracted) | no | −475 | −99.1 | NO3− in irrigation water = 122 ppm (2011) NO3− in irrigation water = 35 ppm (2012) | Basic equation: water irrigated × NO3− in water irrigation |
| c. Emission to soil | |||||
| Pesticides (kg) | 4.85 | 12.65 | 10.88 | Pesticides end up as emissions | |
| Impact Category | Unit Per Kg of Pears | Total | Importance |
|---|---|---|---|
| Climate change Human Health | DALY * | 4.00 × 10⁻⁷ | 61% |
| Ozone depletion | DALY | 8.75 × 10⁻¹¹ | 0% |
| Human toxicity | DALY | 1.95 × 10⁻⁸ | 3% |
| Photochemical oxidant formation | DALY | 6.21 × 10⁻¹¹ | 0% |
| Particulate matter formation | DALY | 2.31 × 10⁻⁷ | 35% |
| Ionising radiation | DALY | 1.81 × 10⁻¹⁰ | 0% |
| Water scarcity HH | DALY | 4.06 × 10⁻⁹ | <1% |
| Sub-Total | DALY | 6.55 × 10⁻⁷ | 100% |
| Climate change Ecosystems | species.yr | 2.26 × 10⁻⁹ | 21% |
| Terrestrial acidification | species.yr | 1.88 × 10⁻¹¹ | 0% |
| Freshwater eutrophication | species.yr | 1.41 × 10⁻¹² | 0% |
| Terrestrial ecotoxicity | species.yr | 3.48 × 10⁻¹⁰ | 3% |
| Freshwater ecotoxicity | species.yr | 1.12 × 10⁻¹² | 0% |
| Marine ecotoxicity | species.yr | 6.71 × 10⁻¹⁴ | 0% |
| Agricultural land occupation | species.yr | 7.69 × 10⁻⁹ | 71% |
| Urban land occupation | species.yr | 1.2 × 10⁻¹⁰ | <1% |
| Natural land transformation | species.yr | 8.50 × 10⁻¹¹ | <1% |
| Water scarcity EQ | species.yr | 3.51 × 10⁻¹⁰ | 3% |
| Sub-Total | species.yr | 1.09 × 10⁻⁸ | 100% |
| Metal depletion | USD | 2.51 × 10⁻³ | 8% |
| Fossil depletion | USD | 1.28 × 10⁻² | 38% |
| Water scarcity R | USD | 1.79 × 10⁻² | 54% |
| Sub-Total | USD | 3.32 × 10⁻² | 100% |
| Impact Category | Unit Per Kg of Pears | Total |
|---|---|---|
| Climate change | kg CO2 eq | 0.285 |
| Human toxicity | kg 1.4-DB eq | 0.028 |
| Particulate matter formation | kg PM10 eq | 0.001 |
| Terrestrial ecotoxicity | kg 1.4-DB eq | 0.002 |
| Agricultural land occupation | m2a | 0.478 |
| Water depletion | m3 | 0.085 |
| Metal depletion | kg Fe eq | 0.035 |
| Fossil depletion | kg oil eq | 0.077 |
© 2020 by the authors. Licensee MDPI, Basel, Switzerland. This article is an open access article distributed under the terms and conditions of the Creative Commons Attribution (CC BY) license (http://creativecommons.org/licenses/by/4.0/).
Share and Cite
Vatsanidou, A.; Fountas, S.; Liakos, V.; Nanos, G.; Katsoulas, N.; Gemtos, T. Life Cycle Assessment of Variable Rate Fertilizer Application in a Pear Orchard. Sustainability 2020, 12, 6893. https://doi.org/10.3390/su12176893
Vatsanidou A, Fountas S, Liakos V, Nanos G, Katsoulas N, Gemtos T. Life Cycle Assessment of Variable Rate Fertilizer Application in a Pear Orchard. Sustainability. 2020; 12(17):6893. https://doi.org/10.3390/su12176893
Chicago/Turabian StyleVatsanidou, Anna, Spyros Fountas, Vasileios Liakos, George Nanos, Nikolaos Katsoulas, and Theofanis Gemtos. 2020. "Life Cycle Assessment of Variable Rate Fertilizer Application in a Pear Orchard" Sustainability 12, no. 17: 6893. https://doi.org/10.3390/su12176893
APA StyleVatsanidou, A., Fountas, S., Liakos, V., Nanos, G., Katsoulas, N., & Gemtos, T. (2020). Life Cycle Assessment of Variable Rate Fertilizer Application in a Pear Orchard. Sustainability, 12(17), 6893. https://doi.org/10.3390/su12176893