Article

The Reuse of Sediments Dredged from Artificial Reservoirs for Beach Nourishment: Technical and Economic Feasibility

1
Department of Legal and Political Sciences, “Guglielmo Marconi” University, 00193 Rome, Italy
2
School of Engineering, University of Basilicata, 85100 Potenza, Italy
3
Department of Agricultural, Environmental and Food Science, University of Molise, 86100 Campobasso, Italy
4
Department of Bioscience and Territory, University of Molise, 86090 Isernia, Italy
*
Author to whom correspondence should be addressed.
Sustainability 2020, 12(17), 6820; https://doi.org/10.3390/su12176820
Submission received: 8 July 2020 / Revised: 17 August 2020 / Accepted: 18 August 2020 / Published: 22 August 2020
(This article belongs to the Section Resources and Sustainable Utilization)

Abstract

:
Sedimentation has significant impacts on the useful capacity of an artificial reservoir, a resource to preserve. Interventions of dredging are therefore often unavoidable, even because decommissioning of dams is often impossible in many contexts and entails high costs. Dredging generates an undesired accumulation of materials that represent an environmental cost, but that could be used as intermediate products in other processes, such as beach nourishment. The study develops a method for the evaluation of the feasibility of an investment aimed at coastal nourishment with sediments dredged from artificial reservoirs. The method considers the set of technical conditions that make such use possible. The presence of economies of scope, with environmental diseconomies utilized as joint product, modifies the evaluation approach. The results of the approach show a possible environmental and economic sustainability of the proposed investment even in the presence of highly unfavorable scenarios. The study applies the feasibility appraisal to the case of the Guardialfiera reservoir in Molise, Italy.

1. Introduction

Artificial reservoirs are created by the construction of dams, which allow the supply of water for several objectives (human consumption, irrigation, industrial use, energy production) and can regime floodwaters. A dam causes a decrease in flow velocities; this affects sediment transport [1,2,3,4,5,6] and, therefore, induces sediment deposition over the years in the upstream reservoir. As a consequence, damaging effects on structures, such as water intakes and bottom outlets, occur [7,8]. Moreover, because of sediment being trapped in the reservoir, the stream morphology downstream from the dam can be dramatically affected by erosion [9,10,11,12,13,14], which can induce impact on the infrastructures and ecology of the regulated river. In addition, reservoirs could cause or accelerate coastal erosion [15,16,17,18,19,20], especially for short dam-coastline distances, as they decrease the amount of sediments reaching the coastline and generate an alteration of coastal sediment balance. Finally, and above all, reservoir sedimentation causes loss of storage capacity, which can affect water supply.
Several methods can be applied to prevent and reduce sedimentation in reservoirs [21,22,23,24]. In order to recover storage capacity of silted-up reservoirs, the most efficient methods are sediment flushing [25,26,27], hydro-suction technique [28] and sluicing operations. An alternative to these methods is the dredging of deposited material. Obviously, the removed sediment can be conferred to appropriate confined sites or used for various purposes, such as the amendment of agricultural soils, the production of concrete and new materials and the nourishment of nearby eroding beaches [1,29,30,31].
It is well known that beach erosion is the result of complex processes, in which natural factors and human activities in river catchments are involved. Coastal erosion leads to the loss of areas with economic value, biodiversity and natural defenses of the coast [32]. There are several options for the management of beach erosion, including beach nourishment [33,34,35], which consists of replacing sand eroded by the sea with other sand from outside sources, mainly marine caves.
Recently, the use under certain conditions of reservoir sediments for coastal nourishment has been hypothetically taken under consideration [1]. This permits the recovery of the reservoir’s water storage capacity, as well as restoring the sediment balance of the river–coast–sea system. From a technical point of view, the use of sediments dredged from a reservoir for coastal nourishment requires at least the quantification of volumes available, the assessment of granulometric and mineralogical-petrographic compatibility between the reservoir and coastal sediments and the valuation of qualitative (bio-chemical) suitability, as defined by regulations. The abovementioned authors recently proposed a methodology that identifies all steps that allow for a sustainable reuse of sediments deposited on a reservoir bottom for the nourishment of eroding coastlines. In absence of a standardized approach for bio-chemical characterization at EU level, the authors proposed to use procedures suggested by the Italian Legislative Decree 173/2016 [36], which regulates the reuse of submarine deposits for beach nourishment.
The methodology was tested in the case of the sediments of the Guardialfiera Reservoir (Molise, Italy), calculating the volume of sediment stored, considering both shoreline evolution at the Mouth of the Biferno River, and the results of granulometric analysis that show the compatibility between reservoir sediments and coastal sand. The authors conclude that coastal nourishment with reservoir sediments is sustainable from a technical and environmental point of view, especially for short distance dam–coast, but that “a deep cost—benefit analysis should be carried out” to verify if such a process is sustainable also from an economic point of view [1].
From a socio-economic point of view, the question is highly complex, especially because the joint process of dredging and beach nourishment is different from the single ones by relevant aspects, mainly transport and environment impact, which, in turn, involve both technical and economic problems.
Under a historical point of view, cost benefit analysis (CBA) is the main socio-economical tool used to justify the construction of dams [37,38]. From its introduction this tool had to face a number of problems [39], among which the same problem of sedimentation, that shortens the economic life of dams and generates “new” costs, which have not been taken into consideration in the traditional CBA.
This problem has also led to the development of specific tools for its management, like the RESCON (REServoir CONservation) model [40], with the shift from CBA to models, such as optimal control models, in which time horizon is not exogenous, but is a result of a sustainable approach aimed at allowing for “the retainment of the usefulness of a reservoir as long as possible” [41]. Recent studies underline the growth of demand for freshwater resources for human use [42], and for all sectors of production [43], while at the same time, the construction of new dams appears increasingly difficult both for environmental and social problems.
In socio-economic terms, the justification of beach nourishment is mainly based on the risk of damage reduction and on the recreational functions of the beach [44], as well as on the impact that the latter have on touristic activities [45,46] and on property values [47]. In other words, beach nourishment can be seen as a significant social investment [48,49], and the decision to nourish can be considered a dynamic capital accumulation problem [50]. There is a large amount of the literature dealing with the benefits and costs of beach nourishment [51], not only in the American case [52,53]. The potential and critical aspects of the CBA approach in case of coastal risk management investments are widely explored (see [54]).
In brief, both for dams (considering sedimentation) and for beach nourishment, the economic point of view is widely considered, including cost-benefit analysis. On the contrary, even if there are some first attempts [1,55], an in-depth analysis of the joint process use of reservoir sediments and beach nourishment from a socio-economic point of view does not exist.
From the theoretical perspective the rational of the joint process can be analyzed through the concept of economies of scope [56], i.e., “efficiencies wrought by variety, not volume” [57]. From an empirical point of view, the justification could be obtained through CBA, considering the joint process as a “new” investment, where “traditional” CBA may be applied with the introduction of an optimization mechanism.
The work deals with the conditions that guarantee the environmental and economic sustainability of the process of using dredged sediment in beach nourishment. For this purpose, it was necessary to:
  • Identify the aspects to be considered from a theoretical, technical, and economic point of view;
  • Define the measurement parameters, their measurement systems and their orders of magnitude;
  • Build a theoretical background through which understand the role played by the joint product in the context of the feasibility appraisal;
  • Define a methodology that allows us to determine the general conditions under which the investment aimed to improving coastal areas sustainability is feasible;
  • Determine a variable on the basis of which the competent authority may or may not decide the management of the joint product.
The proposed approach has been tested in the case of the Guardialfiera Reservoir in Molise, Italy.

2. Methods and Materials

From the point of view of the economic analysis, restoring storage capacity, through dredging, as in the case dealt with in this paper, or through other methods of sediment extraction, can reasonably be considered a necessary investment, to be made irrespective of the destination of the extracted sediment. However, dredging causes the generation of external diseconomies consisting in the accumulation of dredged material. To some extent, this material could be suitably used as raw material in the production function of investments in various types of goods: beach nourishment, environmental conversion of quarries or landfills, road construction, etc.
The evaluation question is: should we proceed with separate investments or should we make a joint investment and, in the latter case, which of the possible joint investments is the most socially useful?
The joint implementation of the two investments generates economies of scope with effects that could be positive for both investments.
We indicate with D (Dredging) the first type of investment, we define with I the set of the other (K) investments being i ϵ I, for i = 1…K, where i = N (nourishment) is the investment object of this work and we identify the joint investment with J.
Taken the investments separately and using the language of CBA, dredging has net (positive or negative) effects (NBD), given by the difference between the benefits of not reducing water supply (BD) and the costs of excavation (CD), plus the environmental costs of material storage (ED), with ED ≥ 0.
Investments in I, in turn, have net effects (NBi) given by the difference between the benefits associated with the production of the public good (Bi) and the costs of extraction (Cei) and positioning (Cpi) of the material plus the environmental costs of extraction (Ei).
In the case of beach nourishment (with i = N), for example by extraction of sand from the sea, the costs of extraction (Cei) will be determined by the cost of dredging the seabed and transporting the extracted sand to the beach. The costs of positioning (Cpi) will concern the arrangement of the dredged material on the beach. The environmental costs (Ei) will consist of any damage to the marine ecosystem caused by dredging activity.
Therefore, for the dredging from an artificial reservoir, it will be:
NBD = BD − (CD + ED)
and for the i-th investment in I it will be:
NBi = Bi − (Cei + Cpi + Ei)
In a joint management, the use of the accumulated material at the reservoir site eliminates in (1) the presence of external diseconomies and therefore the related environmental cost (ED). The net effect will be equal to:
NBJD = BDCD
Similarly, the realization of the i-th investment with the joint use of the material extracted from the reservoir implies a variation of (2). The value of the net effect will include the benefits and costs of dredging the reservoir and the elimination of the related external diseconomies becomes an environmental benefit:
NBJi = (BD + Bi) − (CD + Ct,Ji+ Cpi + Et,Ji) + ED
where: (i) NBJD are the net benefits of dredging under joint management; and (ii) NBJi are the net benefits of the i-th investment in joint management, Ct,Ji the costs of transporting the material from the dam and Et,Ji the environmental transport costs.
It is clear that the social profitability of the dredging investment is higher in a joint management hypothesis, since NBJD > NBD.
If the investment in dredging is considered mandatory, becoming a component of the scenario “without” investment, the expected net effects for joint management will be obtained by subtracting the (3) from the (4) with NCBJi equal to the net counterfactual benefit:
NCBJi = Bi − (Ct,Ji + Cpi + Et,Ji) + ED
Subtracting (5) from (2), the economy of scope and the social feasibility of the joint investment will be achieved when NCBJi—NBi > 0, i.e., when:
(Ct,Ji + Et,Ji) − (Cei + Ei) < ED
If NCBJi—NBi > 0, as it is always NBJD > NBD, investment in joint management is preferable to decoupled investments.
The presence of economies of scope substantially changes the consolidated approach to valuation. The cost-benefit assessment is reduced to a comparison between the value of the positive externality (ED) and the difference between the transport costs of the joint investment and the extraction costs of the i-th investment.
However, the assessment of (6) does not exclude the possibility that the joint investment could not be socially feasible. Its internal rate of return could be lower than the social discount rate or even negative.
The assessment of social profitability through (5) is therefore the first necessary step, before estimating the expected net effect of the presence of economies of scope.
In the following paragraphs, this first step will be developed by placing i = N and assessing the economic feasibility of a joint investment aimed at beach nourishment. Only if (5) meets the economic feasibility requirements in an additional contribution will condition (6) be verified.
The assessment of (5) is independent of the specific type of the i-th disjointed investment. In the present case, where the objective is beach nourishment (i = N), (5) is not influenced by the form taken by the production function in (2).
The numerous alternatives for finding material for beach nourishment, from the seabed, port excavation, etc. (for further details, see [58]), will be considered only at the moment of the evaluation of (6).

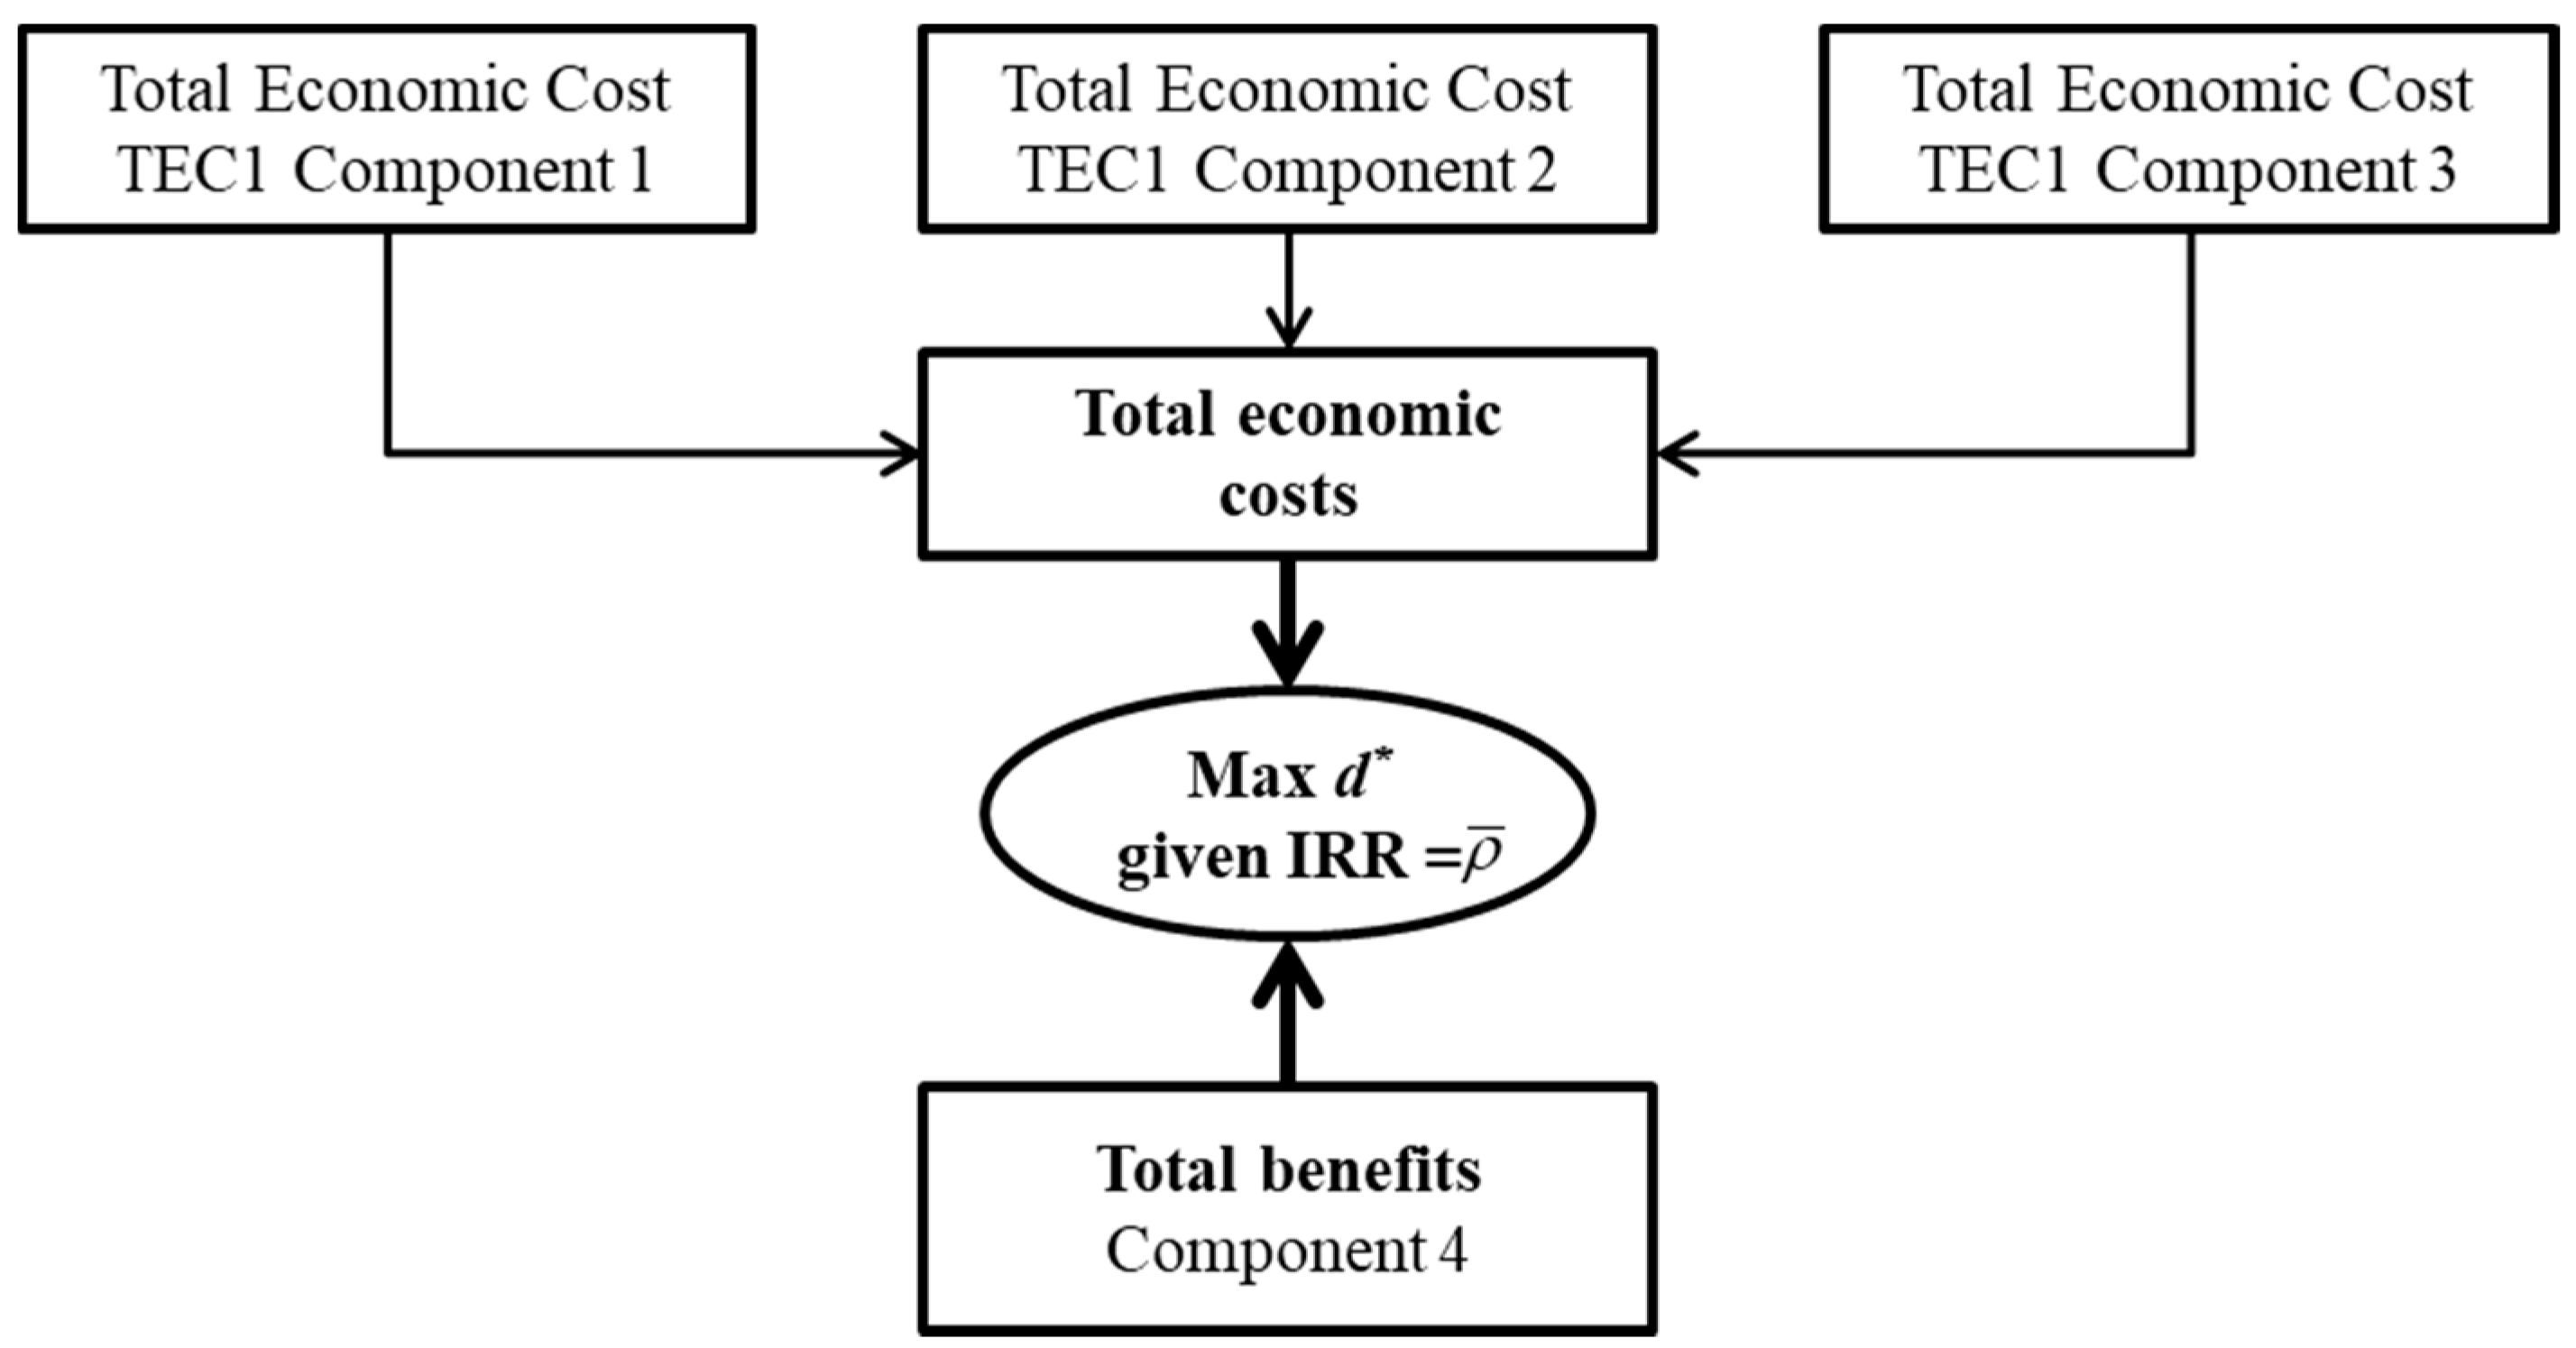
2.1. The Conceptual Framework of the Cost-Benefit Approach

The evaluation of (5) requires a cost-benefit analysis through which to estimate the maximum value of the distance between the dredging site and the beach nourishment site, in order to satisfy a given rate of return considered socially acceptable.
Following the consolidated theoretical and empirical literature, the cost-benefit analysis is based on net incremental and differential cash flows discounted in the time interval considered at the rate π and with an internal rate of return ρ, which, in this formulation, is predetermined and equal to ρ ¯ (in the proposed simulation ρ ¯ = 7%).
In the cost-benefit analysis, an investment is deemed feasible if NPV > 0 is realized. A non-dimensional indicator is the internal rate of return (IRR) which is defined as the rate that makes the sum of the present values of net benefits equal to zero. In this case, the investment is feasible if the IRR is higher than the average social discount rate.
The general CBA model responds to the following logic. Given the well-known formulation of the net present value (NPV):
t = 1 n n c f t ( 1 + π ) t = N P V
where
ncf = g(d, X)
and
d = f(π)
This model will maximize the distance d between dredging area and beach nourishment area under the constraints:
π = ρ = ρ ¯
and
t = 1 n n c f t * ( 1 + ρ ¯ ) t = 0
with
ncf * = g ( d max * , X )   and   d max * = f ( ρ ¯ )
where ncf = net cash flows, d = distance, d*max maximum achievable distance under the constraints, X = other variables matrix and t = time (years).
In this model, if d*max > δ then the investment will be feasible, where δ measures the actual distance in the real case.
The cash flows are incremental, because the values of the variables to the time t0 are assumed to be equal to zero (zero-based hypothesis), and they are differential because expressed as the difference between with and without intervention (counterfactual hypothesis).
Therefore, the flows are net since differences exist between cash inflows and outflows net of counterfactual effects.
In this a priori approach, where the expected value of the IRR (internal rate of return) is predetermined ( ρ = ρ ¯ ), the key variable for the investment decision becomes the distance d between the place of extraction (dredging) and the beach nourishment area, which must be greater than or equal to the distance δ.
Expression (8) establishes that the net cash flows produced by the investment are in function of the distance d, decisional variable in the model, and of a set of other variables (X), representing the remaining costs (financial and economic) and the benefits of the investment.
The X matrix of cost-benefit variables consists of four components, three cost components and one benefit component:
  • Component 1—Dredging and nourishment costs
  • Component 2—Transport costs
  • Component 3—External costs
  • Component 4—Benefits.
The four components allow for the definition of a general conceptual framework (Figure 1):
For each component, a logical framework has been built at the base of the CBA model.

2.1.1. Component 1—Reservoir Dredging and Beach Nourishment Costs

The first component is composed of two cost elements: The reservoir dredging (DR) and the beach nourishment (BN), but only the second will be accounted for in the cost benefit analysis.
In fact, reservoir dredging is a cost that will have to be sustained in any case to maintain the water capacity of the basin unchanged and, therefore, represents an item to be accounted for both in the absence of investment and in case of its realization.
The non-recognition of this cost item is possible only by assuming the contemporaneity of the investment in the two hypotheses (with and without).
In all other cases, the net cash flow will show a cash outflow in year t = 1 when the life of the investment begins and a cash inflow, of equal value, in year t = k with k > 1 when, in the absence of intervention, the loss of capacity in the basin is expected to make dredging essential. In this second hypothesis the difference in cash flow will be estimated in:
D t = k ( 1 + π ) D t = 1 ( 1 + π ) k ( 1 + π ) + ( 1 + π ) k
and since
D t = k ( 1 + π ) D t = 1 ( 1 + π ) k > 0
a positive dredging cost in the time period t = 1 to t = k will be generated.
In the empirical simulation proposed at the end of this work, the simplifying hypothesis of contemporaneity of the investment in dredging has been assumed, with the consequent complete exclusion of the related financial and economic costs from the CBA.
The second cost element is the beach nourishment (BN). The financial estimation of this cost will depend on four variables: the compatibility of the sediment with the beach, the specific coastal characteristic, the quantity of beach to be nourished (in square meters) and the cost per square meter of beach nourished.
It should be noted that the quantity of beach to be nourished is the fundamental dimensional variable for estimating the benefits.
However, the dredging activity becomes important, because it establishes the maximum quantity of available sediments (AS) in cubic meters: AS = Sθ, S being the total extracted and θ the amount of compatible sediment that can be obtained from an extracted sediment unit, whose value depends on the characteristics of the extracted material. An appropriate coefficient (μ), depending on the specific coastal characteristic, allows for the transformation of AS from m3 to m2 of the new nourished beach (NNB), so that NNB = Sθ μ.
The NNB variable is linked closely to the degree of annual coastal erosion (Ect), with t = 1…T, and the amount of coastline affected by erosion (H).

2.1.2. Component 2—Transport Costs

The collected compatible sediment must be transported to the beach with the appropriate heavy vehicles. The second cost component is thus generated and this component, which causes pollution, is also at the origin of the third cost component, the environmental one.
Sediment handling could cause congestion along the roads used by heavy vehicles, the generation of congestion costs will depend on the route characteristics and the number of daily units needed to complete the transport. In the empirical simulation, the hypothesis of no congestion costs has been assumed.
This second component consists of three elements: the vehicles’ operating cost (VOC), the quantity of sediment to be moved (SQ) and the distance they have to travel (d).
The VOC is closely linked to the type of vehicle used and its transport capacity in tons (ton/V), and it can be expressed as a cost per km per tons:
V O C = K m 1 V V t o n
The amount of sediment to be transported, expressed in cubic meters, is one of the results obtained in the first cost component. The passage from cubic meters to tons is obtained with the sediment density (α), and this allows us to obtain an operating cost per cubic meter directly usable in the analysis:
V O C m c = K m 1 V V t o n α = K m 1 m 3
with α = t o n m 3 .
The last element, the distance d, is expressed in km per vehicle per year and must be calculated for round trips.

2.1.3. Component 3—External Costs

According to the literature in this field, the approach adopts nine voices of external environmental costs (EC): noise, congestion, accidents, air pollution, climate change, up/down stream, nature and landscape, soil and water pollution and maintenance.
The values of each item can be deduced from the available literature and are expressed in EUR of cost per vehicle/km.

2.1.4. Component 4—Benefits

The literature on the benefits generated by tourism, even just beach tourism, is quite extensive [32,44,59]. The literature on the economic value of beaches [45,46,47,60,61] and methods of estimating the benefits of tourism [58,62,63,64] is almost as extensive.
The proposed approach provides for a single type of benefit: the increase in the availability of beach usable for tourism purposes. Of course, other benefits may also arise, such as, for example, environmental benefits, protection of real estate value, territorial and infrastructure conservation and so on. There are at least four main methods of benefit estimation used in cost-benefit analyses:
  • Travel cost;
  • Contingent valuation;
  • Hedonic price;
  • Choice modelling.
We adopted a simplified version of the travel cost approach with an estimate of the willingness to pay net of the costs of tourist transfer from the place of residence to the place of tourism. The benefit, therefore, is assessed in terms of:
  • Costs for the use of beach equipment, estimated on the basis of direct investigations;
  • Expenditure on catering and accommodation, estimated using multipliers calculated in similar studies;
  • Other expenses usually associated with beach tourism consumption, also estimated on the basis of the existing literature.
The monetary value of the benefit is expressed in the consumer’s willingness to pay per square meter of beach, a cumulative variable for the years of investment life.
It is worth noting that the investment reduces or cancels the loss of useful beach, so the benefits here are due to the lack of loss of tourists, and not to the generation of incremental tourism. Since these are changes in consumer rents due to shifts in the demand curve, the value of the willingness to pay will have to be fully accounted given that there are no conditions for the application of the so-called "rule of half". Theoretically, the effect on demand (tourism) may be immediate, but the existence of a function of adapting the tourists’ flow to the new conditions of beach supply could be more likely. In the latter case, the adoption of a logistical progression curve, instead of a linear cumulative progression, could be a good representation of the real processes. The logistic curve for estimating the benefits would have a structure of the type:
B ( t ) = T B 0 e r t T + B 0 ( e r t 1 )
where B(t) is the flow of benefits over time; B0 is the benefits at start of period; T is the asymptotic term; r is the accumulation rate; and t is years.
In the case study presented at the end of this work, both application scenarios were taken into account.
In the estimation of the total amount of benefits, different items have to be taken into account:
  • The value in euro per square meter of new beach available, including the volume of consumption expenditure induced by each tourist;
  • The value of the multiplicative effects (λ), determined by the regional I/O matrix;
  • The length of the tourist season;
  • The degree of utilization of the tourist facilities during the season.
A sensitivity analysis was carried out on each of these items in order to verify the degree of stability of the assessment.

2.1.5. From Financial to Economic Values
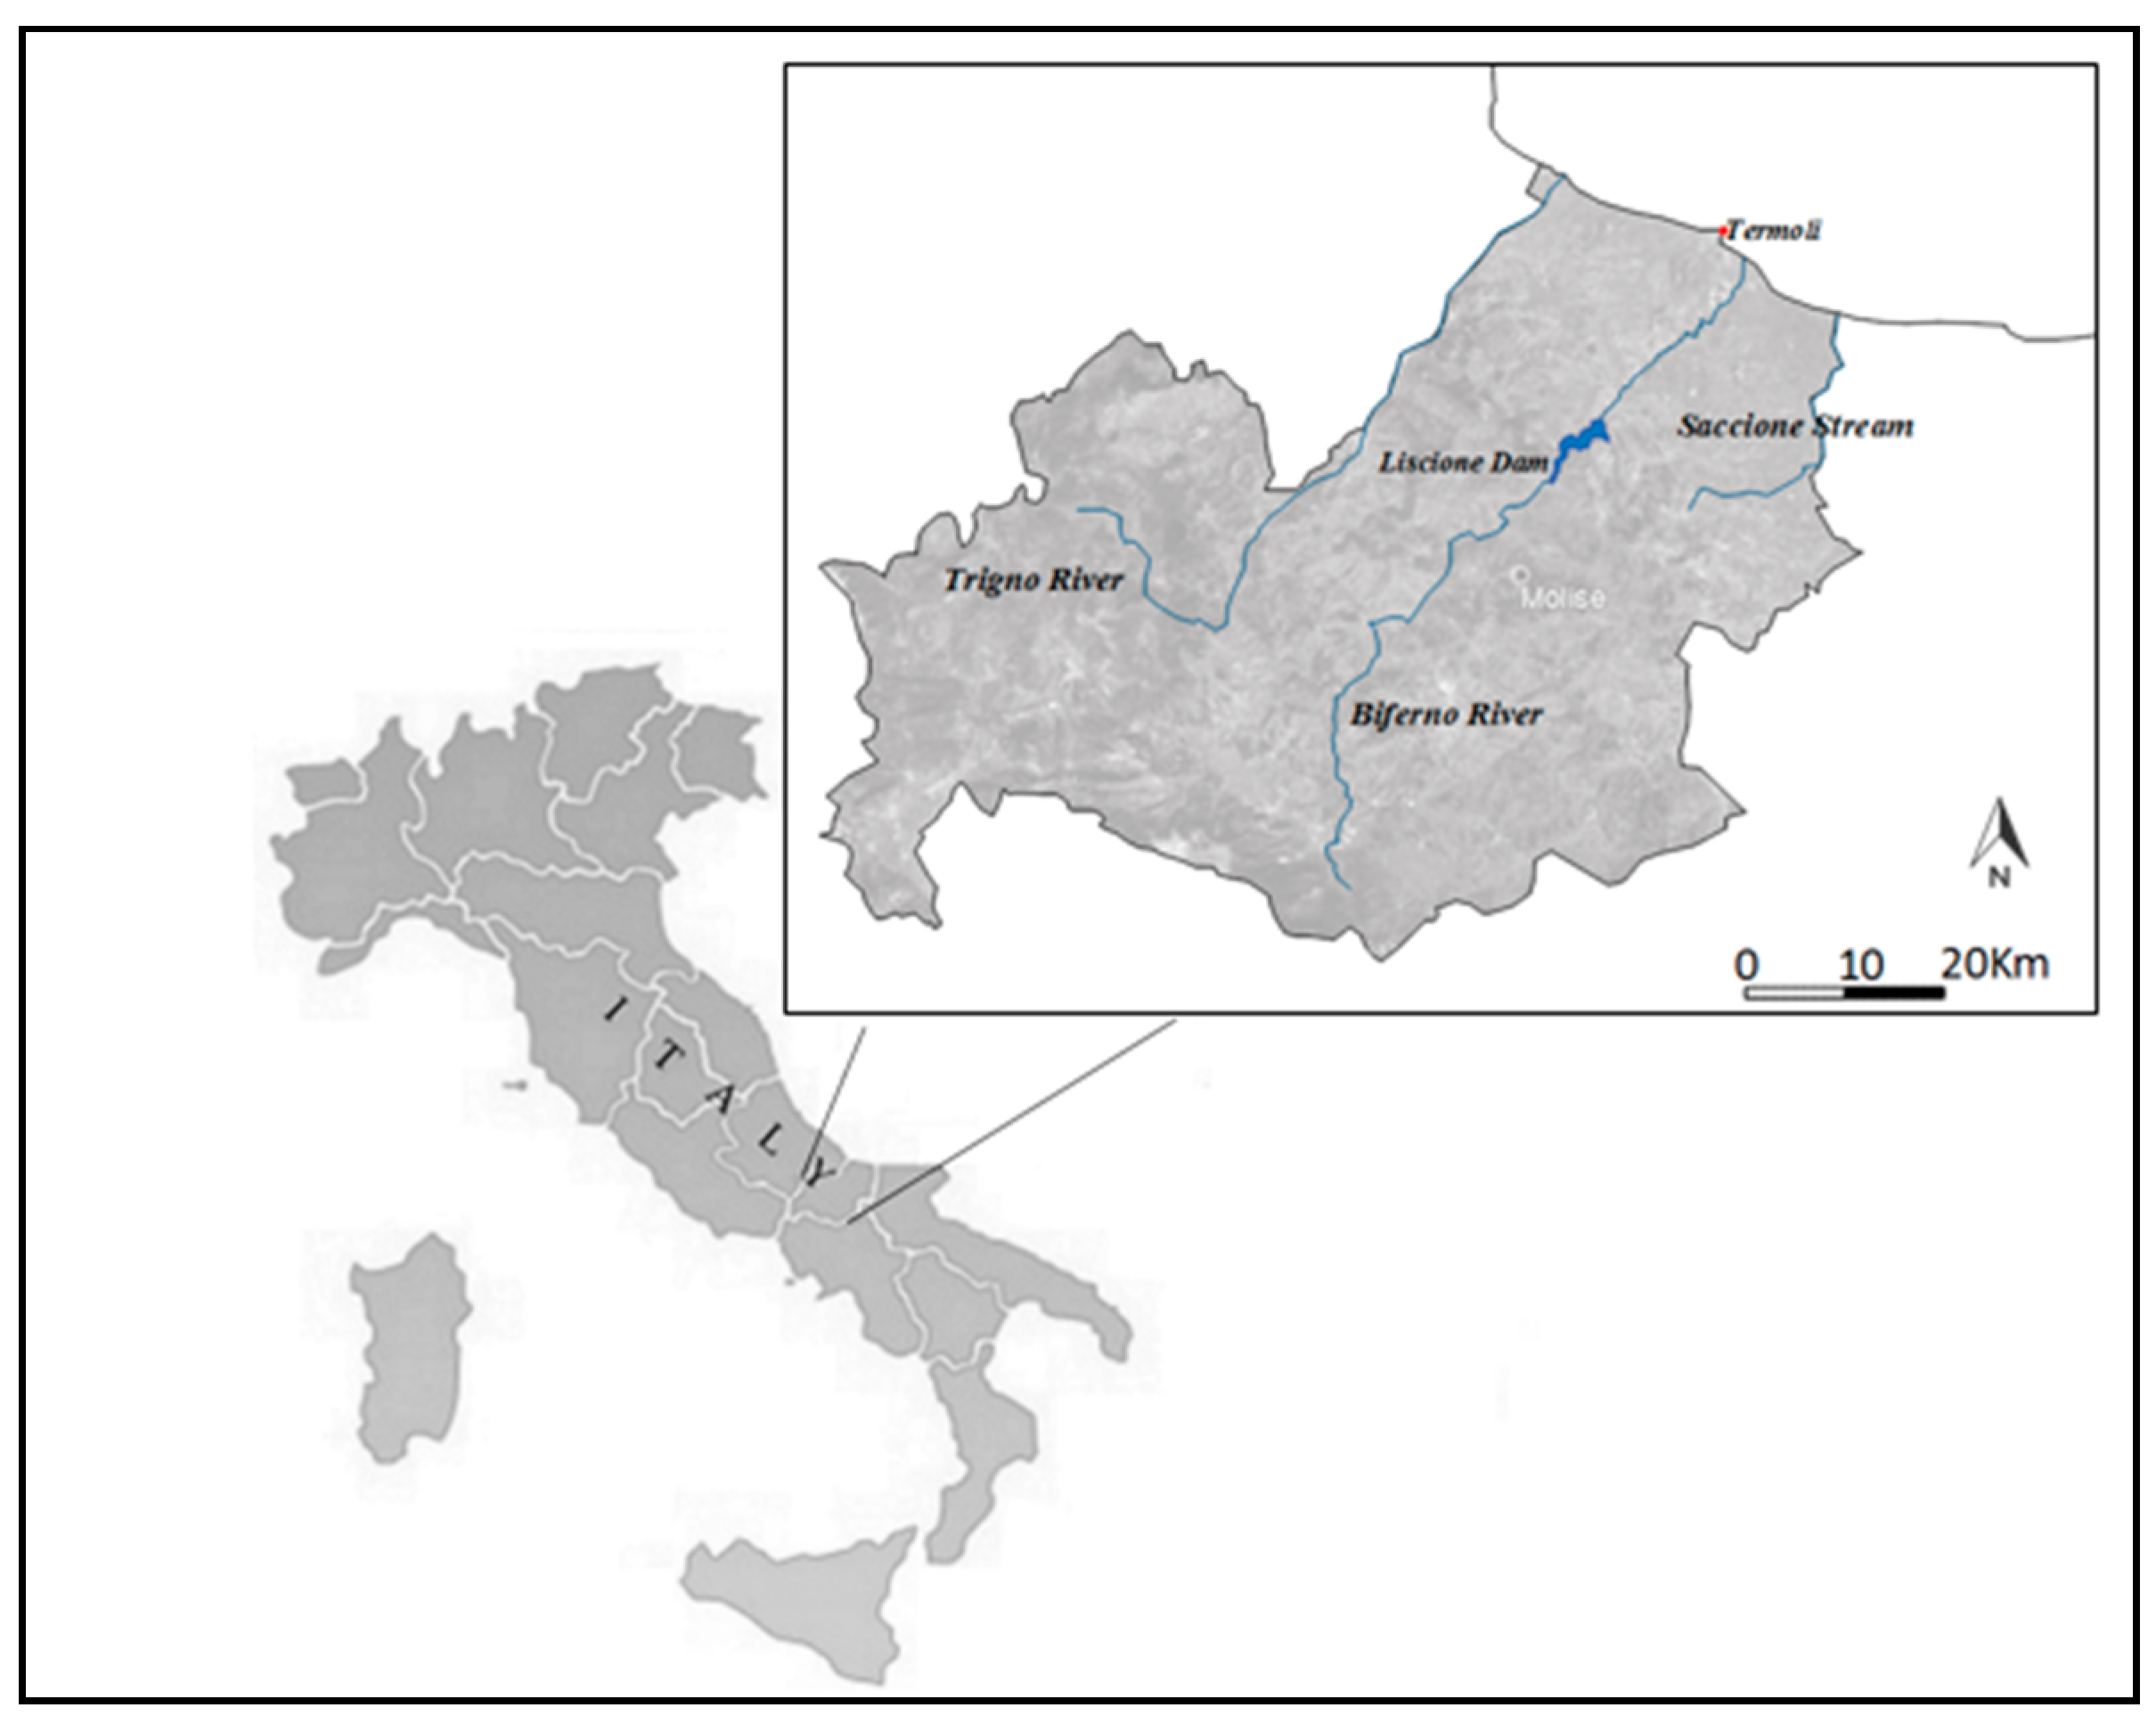
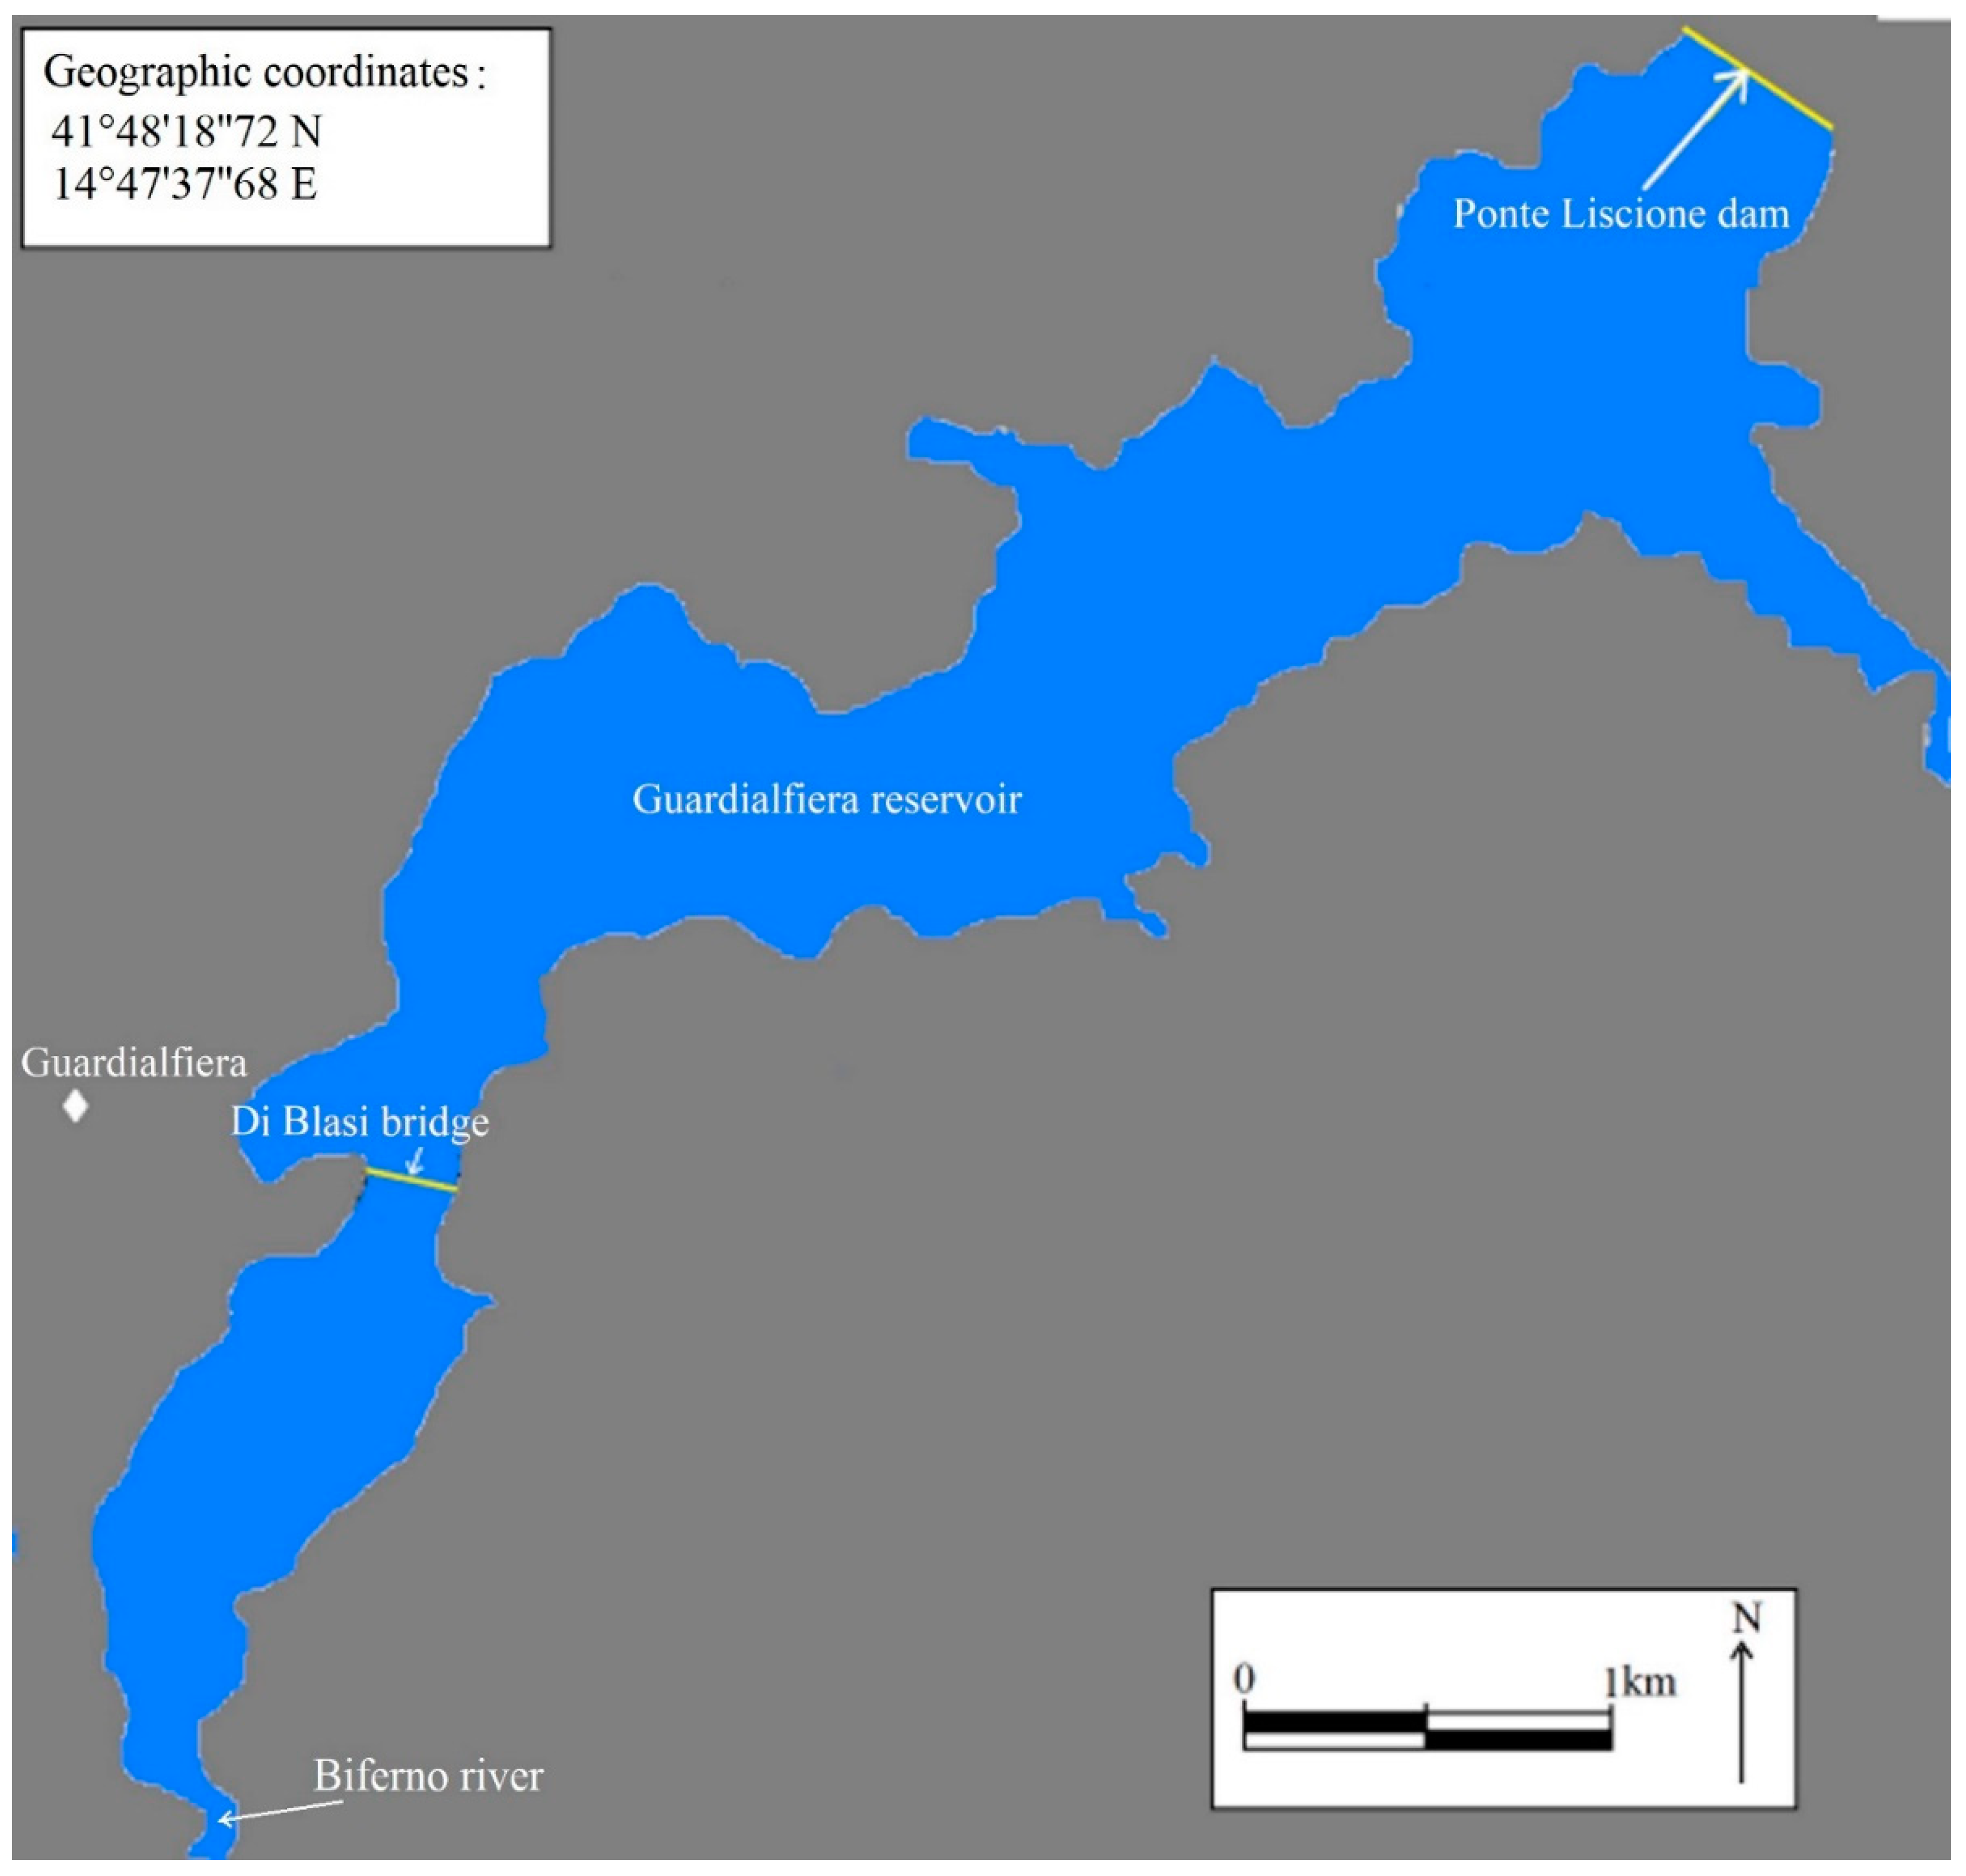
The values in the three cost components are expressed in financial terms (CF), calculated by applying market prices (pM). For the purpose of the cost-benefit analysis financial values should be transformed into economic values (CE) by applying the appropriate conversion factors (CF) defined as the ratios between shadow prices (pS) and market prices (pM):
C E , k = c ( C F , c × C F c )   with   C F c = p S , c p M , c
where c = 1…3 represents the k-th cost component, and C1 = DR + BN, C2 = (VOC + SQ)d, C3 = EC.
The fourth component calculates the benefits in terms of willingness to pay, so it is already expressed in economic values.
Below (Table 1), the acronyms used throughout the paper are summarized.

2.2. Study Case

The study case deals with the use of sediments of the Guardialfiera Reservoir (Liscione Dam) (Molise, Italy) for the nourishment of the Molise coast which is eroding in many zones [65].
The Guardialfiera Reservoir was created through the construction of the Liscione dam on the Biferno River, in the Molise Region, Southern Italy (Figure 2 and Figure 3), for water supply, power generation, irrigation and flood prevention purposes. The main characteristics of the reservoir are summarized in [1,8]. Starting from the dam closure, which occurred in 1965, the reservoir has experienced a sedimentation phenomenon over time, with an average annual rate of 105 × 103 m3/year, which involves fine sediments (sand, silt and clay). The analysis of sedimentation rates and spatial dislocation of the deposit volumes, performed according to the methodology described in [8] has shown that about 70% of the total sediment volume is localized at the entrance to the reservoir, where an aggradation phenomenon in the upstream fluvial reach has been induced, with an average reduction in bed slope of 0.21%.
Therefore, the authors highlighted that a removal of the sediments from the channel and the reservoir portion upstream of the bridge would be necessary in order to limit flooding risk in the anthropized adjacent areas [1]. Moreover, they proposed the mechanical removal of sediments deposited in the aforesaid area, which is easily accessible, especially during autumn in virtue of climatic conditions, and was found to have a greater availability of sediments. According to that study, the volume of sand potentially available every year for beach nourishment is approximately 93 × 103 m3/year, due to the percentage of sand (about 88.4%) present in sediments deposited in the Guardialfiera reservoir.
The shoreline evolution of the Molise coast, performed by [63], has evidenced that approximately a 5 km long stretch of the Molise coast at Biferno river mouth has been suffering from a severe erosional trend, at a rate of −2.12 m/year. From this value, a long-term sand coastal deficit of about 89 × 103 m3/year has been estimated by [1] as a function of the height of beach berm, the seaward limit of the coastal sediment transport and the local wave height. This value is close to the amount of the aforesaid volume of sand deposited upstream the dam, indicating the dramatic effect of the dam construction on the coastal sediment budget.
In order to analyze granulometric compatibility of Guardialfiera Reservoir’s sediments and materials of the Molise coast, a statistical grain size distribution analysis has performed by comparing mean and standard deviation of the measured grain size ds (expressed in ‘ϕ units’, with Φ = −log2 ds) of sediment samples taken in the Guardialfiera Reservoir and sand samples collected along the coastline located nearby the mouth of the Biferno River. Details of measured data and their statistical elaboration can be found in [1,8]. The statistical analysis has shown that reservoir sediments and coastal sand have quite similar values of mean and standard deviations and, thus, they are compatible in grain size. In this way, beach nourishment can be achieved using only the reservoir dredged sediment, which do not need to be mixed with other sediments. In cases in which the percentage of reservoir sand is less than that required for the beach nourishment, an addition of sediments taken from other sources would be necessary. Consequently, different economic evaluations would be needed. Finally, mean and standard deviation of the measured data of grain size allowed also the evaluation of the overfill factor, which is the volume of borrow material (reservoir sediment) required to produce a stable unit of usable fill material. The analysis, performed by the abacus of Krumbein and James as described in [1], has shown that only a volume of sand equal to 88 × 103 m3/year of the potentially available 93 × 103 m3/year could be stable on the destination beach and, therefore, actually suitable annually for beach nourishment purposes of the Molise coast. A beach nourishment with most of the volume of sand that yearly stocks upstream of the bridge will return its natural fluvial sediment supply to the coast. As a result, the coast would remain stable (without erosion), and the reservoir would preserve its current useful capacity indefinitely over time. Consequently, it is a highly sustainable solution from a technical, environmental and social point of view.

2.3. Main Parameters and Sources

The implementation of the methodology described above requires the estimation of a large number of parameters, through field surveys or official statistics.
Below (Table 2), in summary form, we report the values of the main parameters adopted for the realization of the case study, with the related sources.

3. Results and Discussions

The work has made it possible to identify the conditions that guarantee the technical and economic sustainability of the use of dredged sediment for beach nourishment. This sustainability depends on the distance between the dredging area and the beach nourishment area, under the constraint of a certain socially acceptable internal rate of return (IRR).
The rate of return in turn depends on several variables and parameters which, within the framework of the CBA, identify the investment made by the joint implementation of the two processes. Some of these parameters are engineering in nature, while others are economic in nature.
All parameters entered are measurable. The methodology used the cost-benefit analysis, with some specificities compared to the classical model, due to the interdisciplinary characteristics of the problem faced.
In any context in which the problem of sediment reuse for beach nourishment may exist, it is possible to identify the feasibility of sediment reuse, as shown below in the case of Guardialfiera, where it was estimated the economic costs, benefits and net benefits deriving from the realization of the investment over a period of fifty years.
The study is part of the extensive literature on the evaluation of the effects of interventions on coastal areas at different sites [32,44,45,46,47,58,59,60,61,62,63,64].
The results of the analysis are summarized in Figure 4a–d below.
As we can see in Figure 4a, transport is the largest cost component and the estimated value for beach nourishment costs is slightly lower. Transport cost depends on sediment density, which changes with the function and operation of the reservoir. Sediment density indeed depends on their time of exposure, which is very long in a reservoir used for flood control, where water is stored temporarily, and quite short in a reservoir for power generation, where water head is maintained practically constant, and exposure and the resulting sediment shrinkage do not take place. As a result, the functional and operational features of the reservoir affect water content of sediments.
In the specific case of Guardialfiera reservoir, the measured density of the wet sand-silt-clay mixture (88.4% of sand) of sediment changes in the 2300–2600 kg/m3 range, as shown in [8]. A 2000 kg/m3 sediment density was chosen because beach nourishment involves only sand (with a density very similar to that of the mixture) that in the operational sequence “dredging-temporary storage-transport-beach nourishment” will remain only partially wet, due to the temporary storage and the necessary technical times. External costs are particularly low, because they are exclusively due to external effects connected with transport of sediment.
On the benefits side, the total value is the result of the sum of benefits from the coastal tourism sector (BS) and the benefits of the multiplicative effects (λ), determined by the regional I/O matrix.
The absolute value of the benefits and their variation over time largely depend on the conditions of the context in which the investment is made. In a context with a strong tourist vocation, the benefits will depend largely on the recreational use of the beach and the economic multiplier effects generated by such use.
With regards to the calculation methods, it is relevant to highlight the following two aspects:
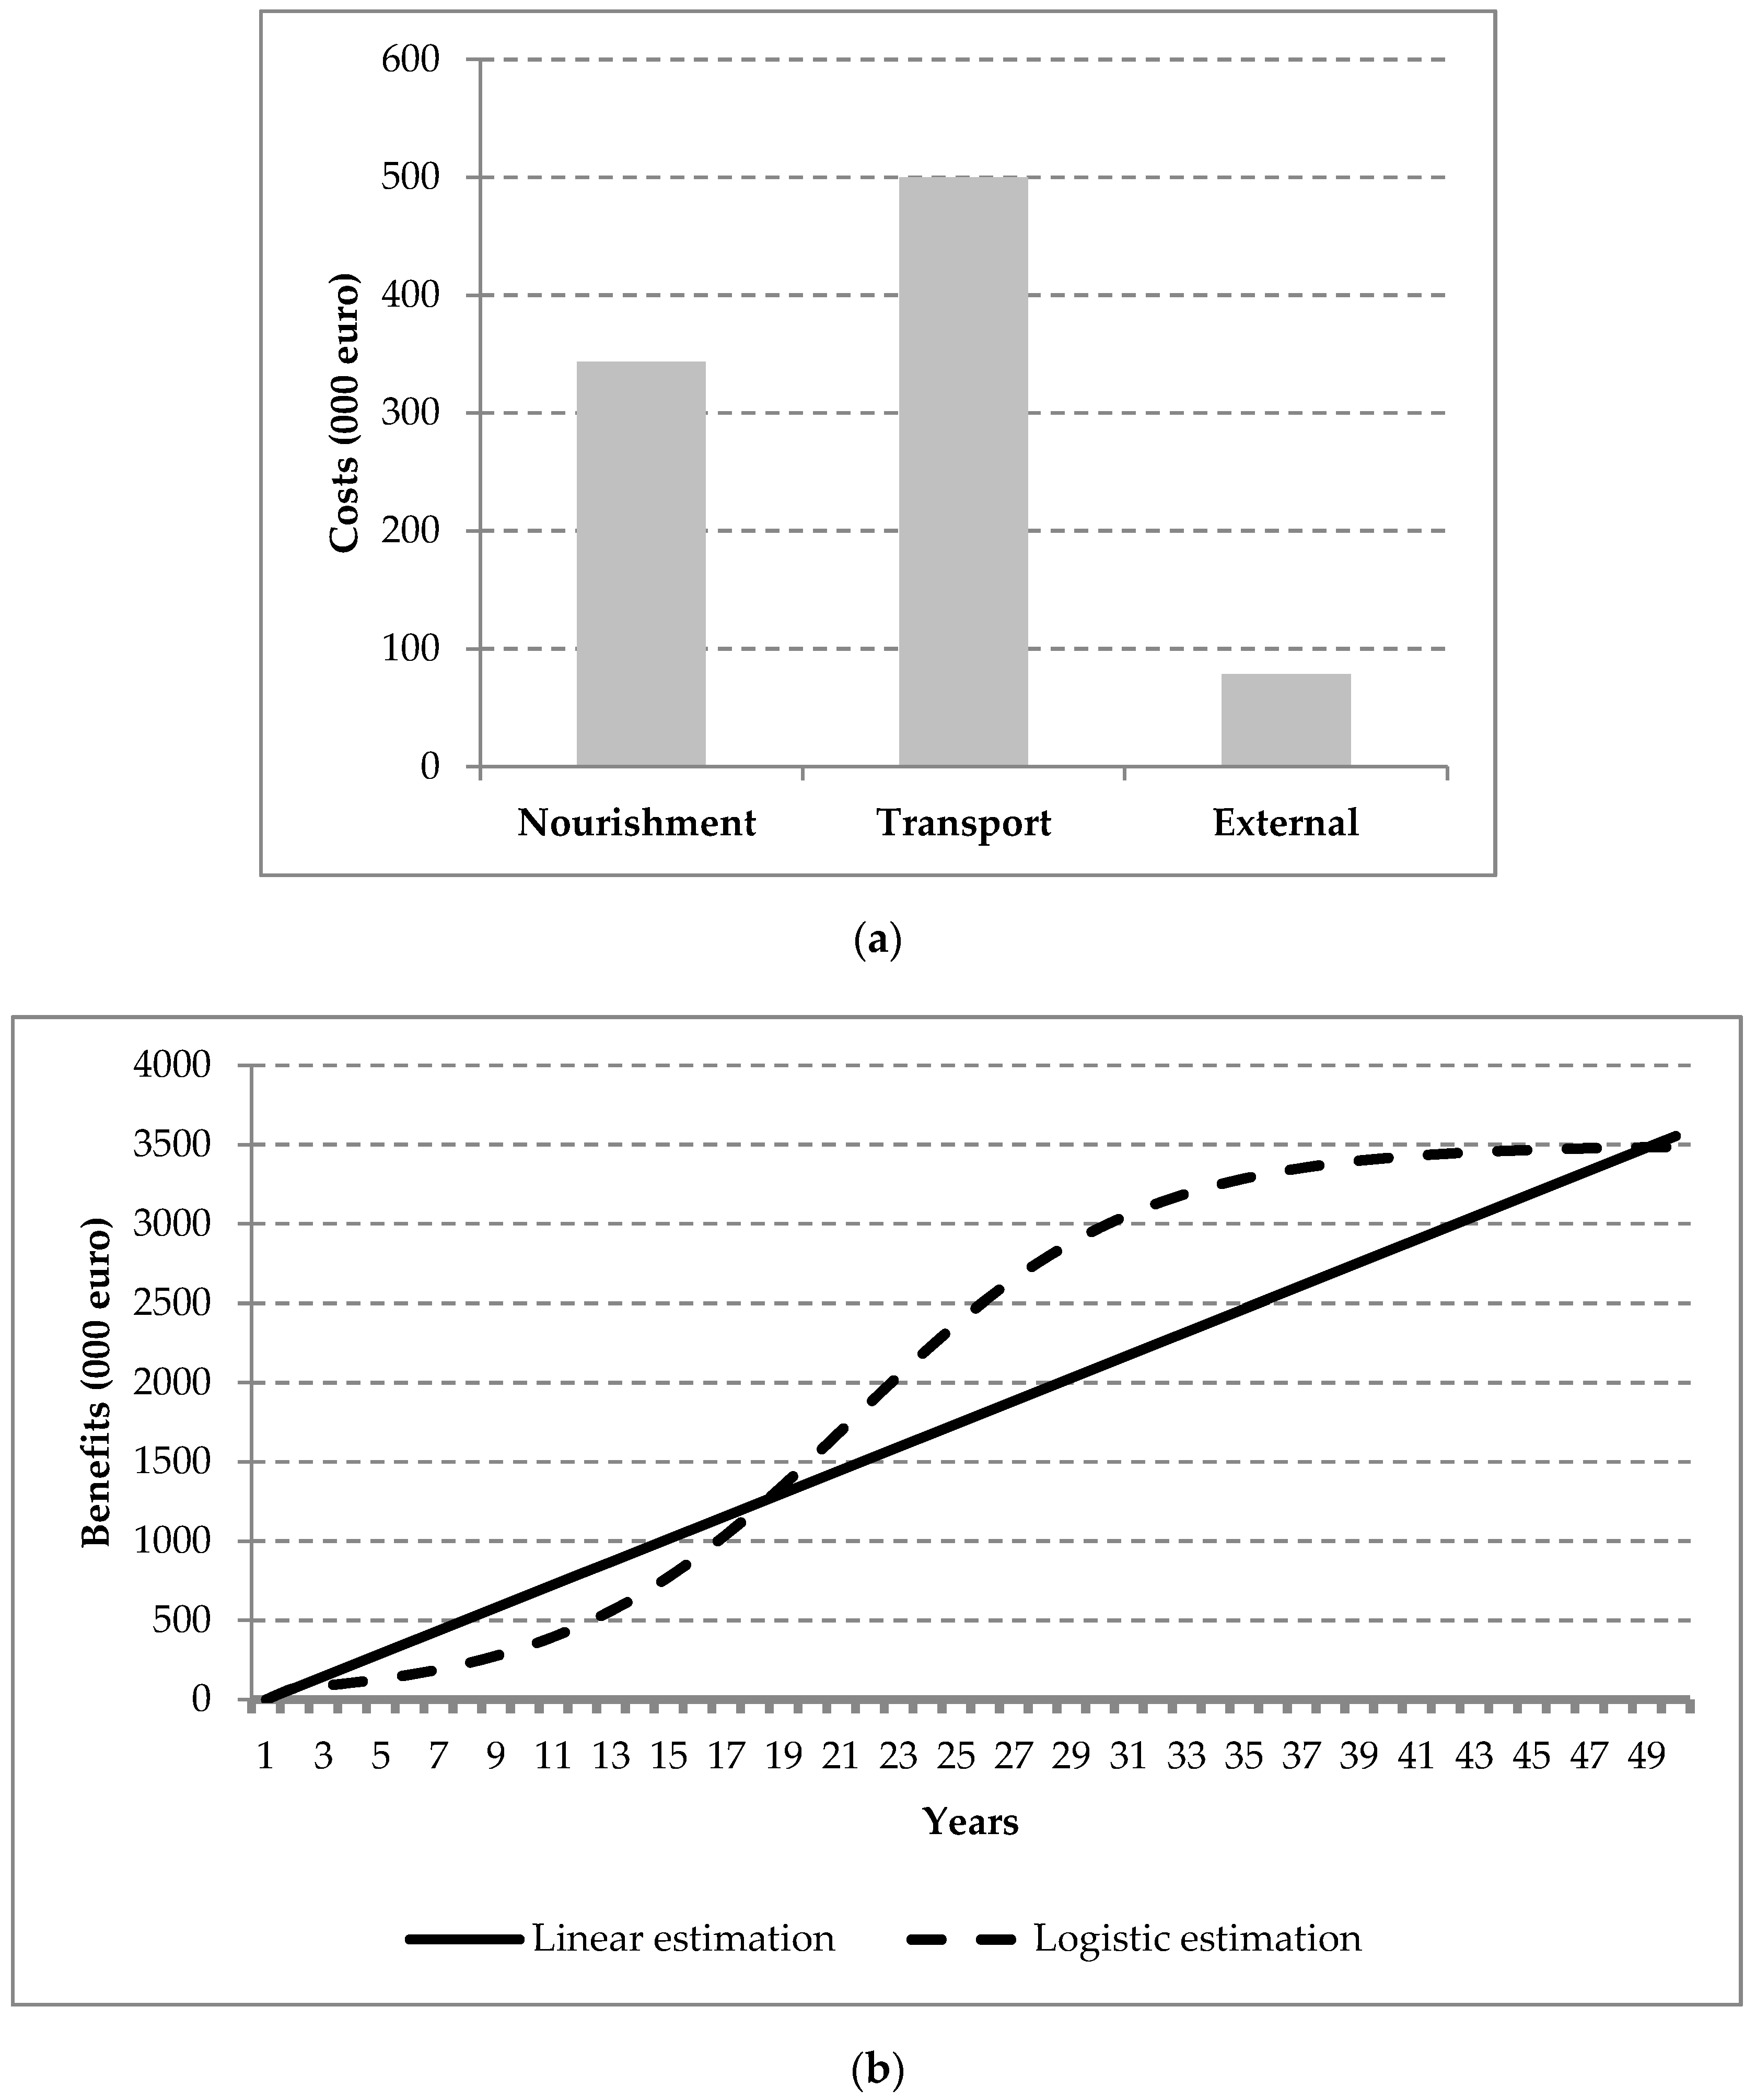
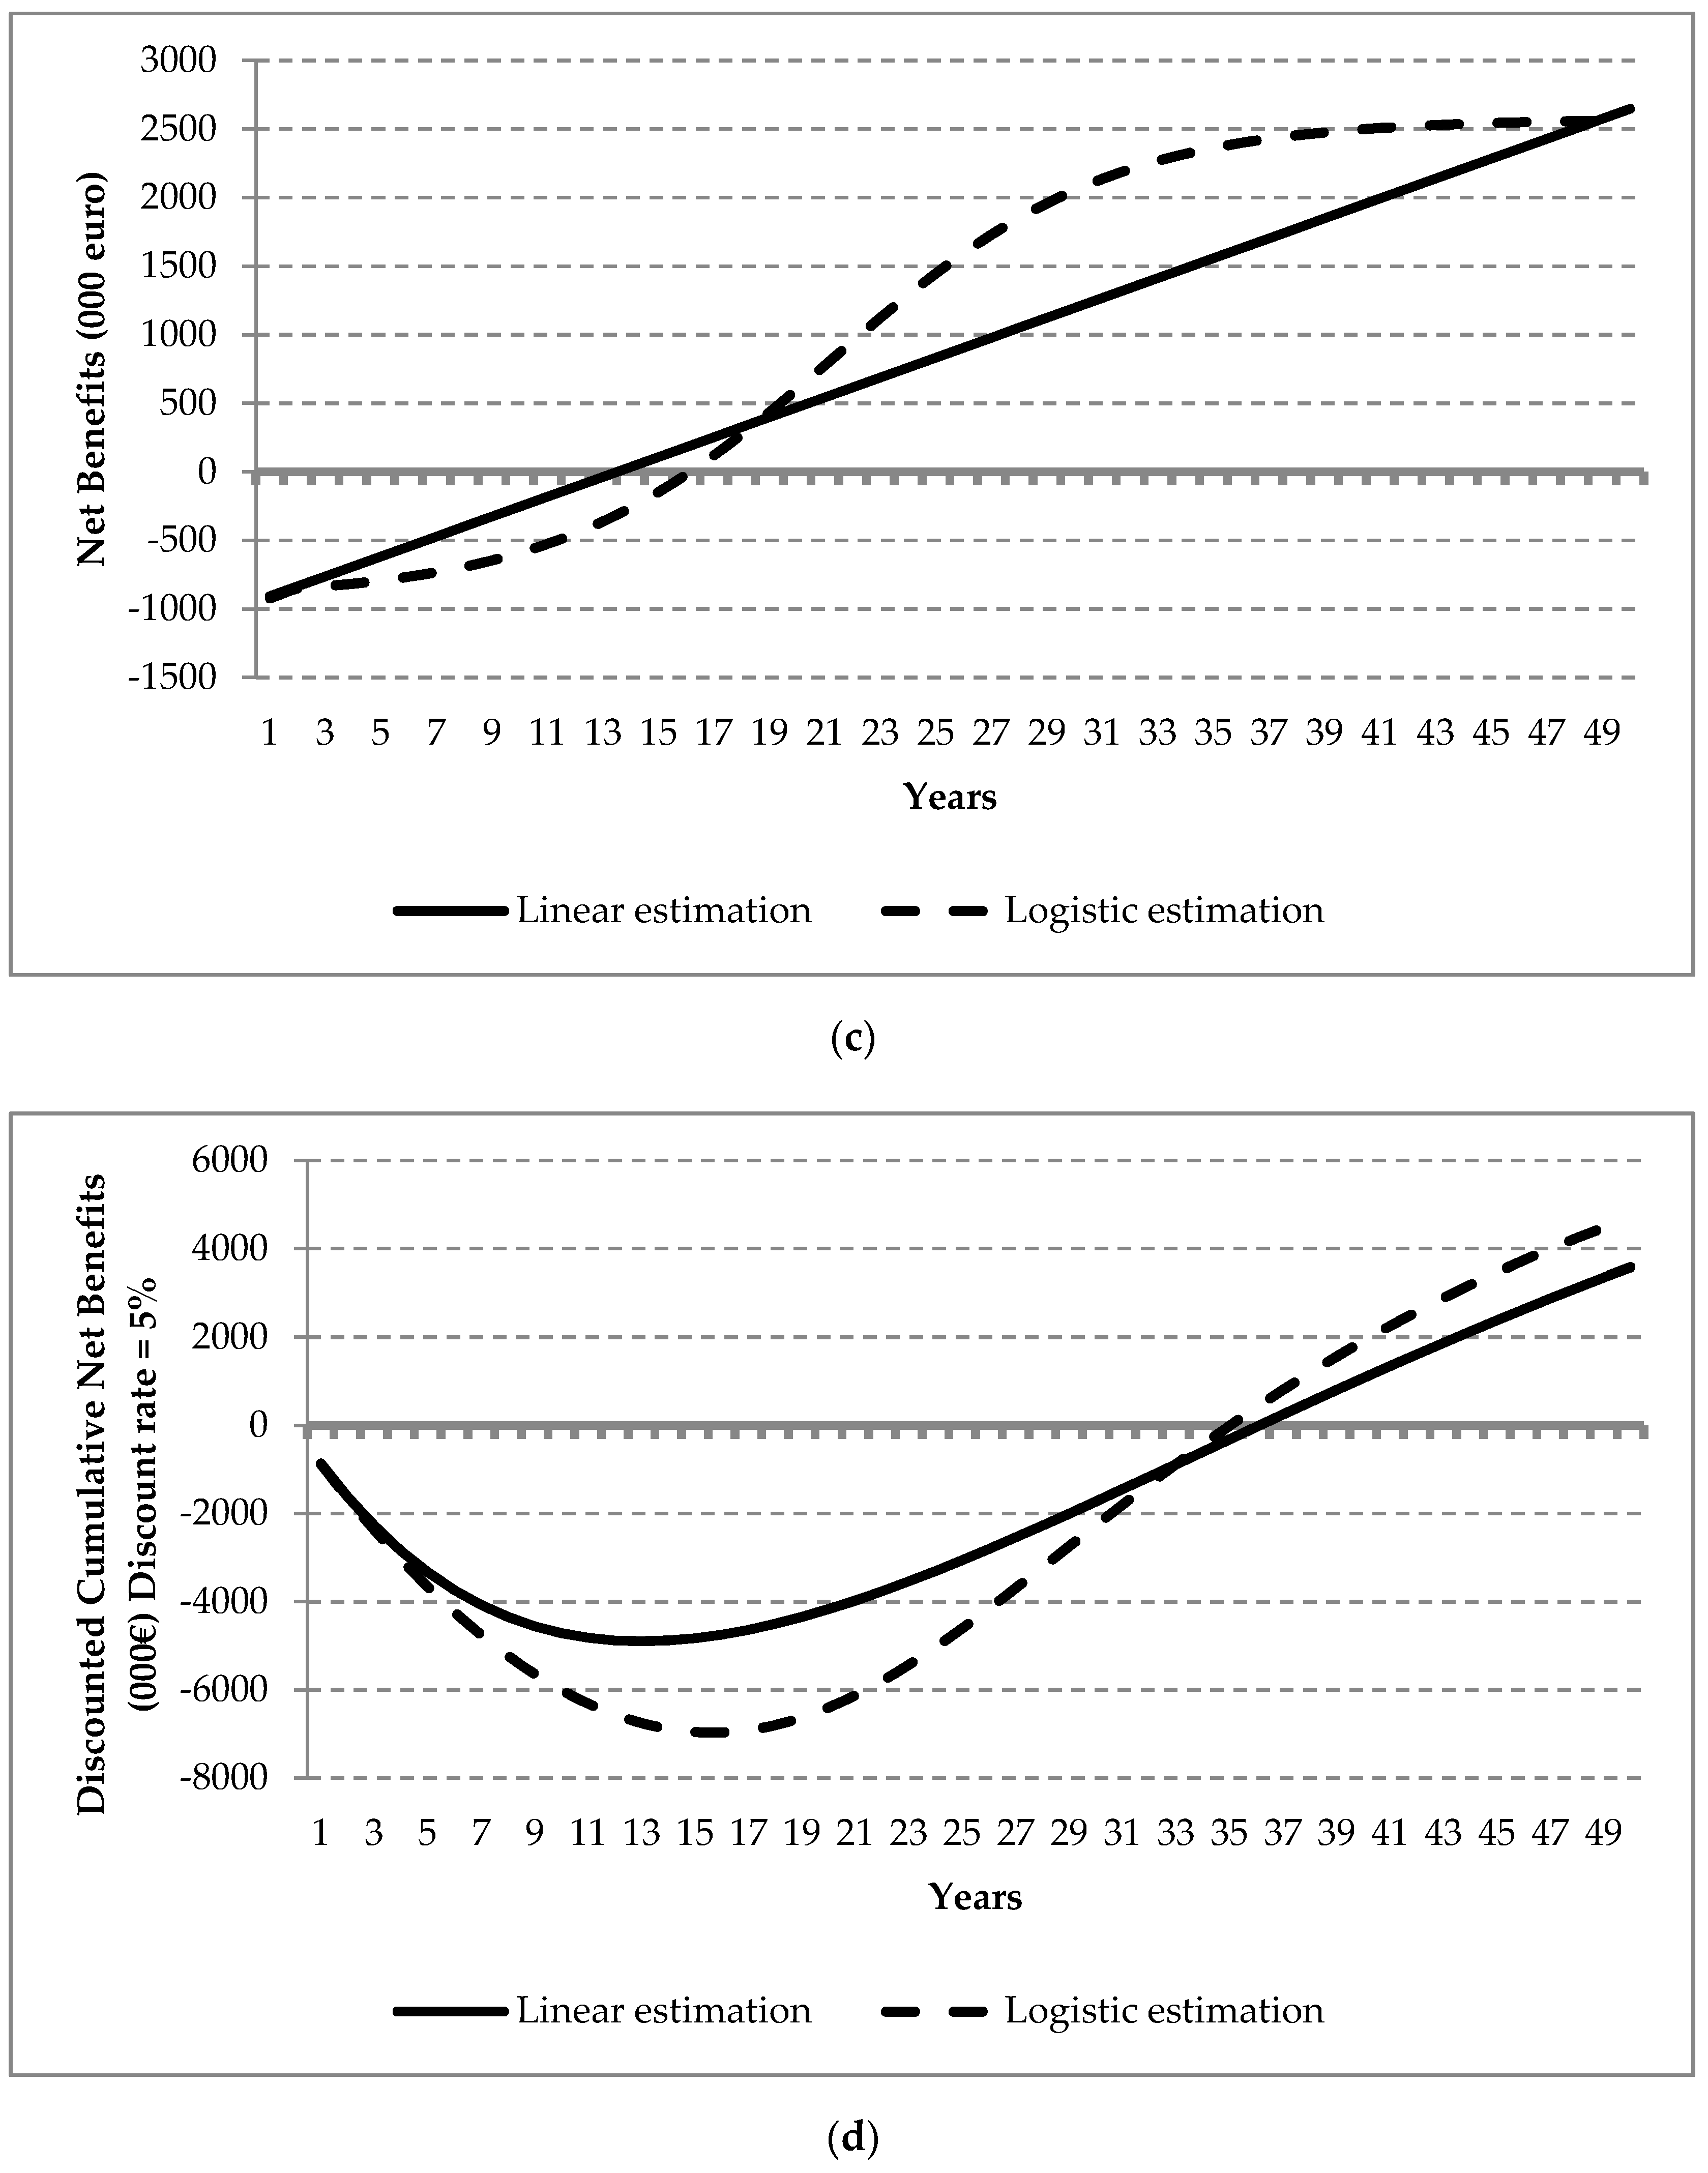
  • The benefits are differential (assumption with intervention minus assumption without intervention);
  • The benefits are expressed by the change in coastal tourism value added;
  • The benefits have been estimated over 50 years, with both a linear and a logistic function.
Formally, the total benefits (BT) are represented by the following sequence:
  • BT = BS × (1 + λ)
  • BS = BS1/BS2 × BS3 × BS4 × BS5 × BS6
where:
  • BS1 = daily price for a beach lot (EUR/day). The evaluation assumed an average beach area (lot) per tourist unit. In this simplified hypothesis, the tourist unit’s willingness to pay per lot corresponds to an average value that includes all the expenses incurred by the tourist unit and is independent from the number of tourists using the lot. A more accurate analysis would require an estimate of the number of tourists per lot and an evaluation of the expenditure per item;
  • BS2 = lot of new beach available for rent to single tourist (m2);
  • BS3 = number of days of the tourist season (days);
  • BS4 = rate of coverage of the tourist facility (%days);
  • BS5 = share of value added in turnover (%EUR);
  • BS5 = total of new beach available annually (m2).
Figure 4b,c respectively show the trends of total and net benefits in both estimation assumptions (linear and logistic). Figure 4d shows the net benefits flow discounted at the rate of 5%.
In summary, the maximization model, with an IRR constrained at 7%, proposes a maximum feasible distance of 53.8 km when using a linear demand model and 55 km when using a logistic demand model.
In Table 3 the main estimation results are shown.
In the presence of external diseconomies and incomplete markets, as in this case, the use of dynamic prices forecast could introduce undesirable degrees of uncertainty in the evaluation of the investment profitability. For this reason, the cost-benefit analysis has been conducted at constant prices [59], and is accompanied by a sensitivity analysis on ten variables, one of which concerns possible beach-use price changes.
However, it is important to bear in mind that uncertainty does exist and in the case of competitive or quasi-competitive markets, the dynamics of relative prices is one of the components of the CBA.
In these cases, the management of the uncertainty must necessarily become part of the evaluation process [66,67].
In the present case, the sensitivity analysis was limited to calculating the IRR average elasticity, compared to changes in the variables’ value (or parameters’ value) in the range of ± 10%. The results are shown in Figure 5.
In absolute value, the elasticity is higher than 1 only for variations in benefits (positive elasticity equal to 1606) and variations in beach availability (negative elasticity equal to −1171).
The elasticities calculated on the different components of the transport cost vary, in absolute value between 0.9 (parameter relative to the tons per vehicle) and 0.7 (parameter relative to the transport cost in EUR/Km).
The remaining elasticities calculated on the value of the multiplier (0.136), the unit cost of beach nourishment (−0.476) and external costs (−0.116), appear to be very low.
The economic feasibility of the investment looks particularly robust. In the case of unfavorable variations in the two variables with the highest elasticity values, with a 10% decrease in benefits and a 10% increase in lot size (beach availability in m2), it is still d*max = 35.7 > δ for a IRR = 7%.
Since this is a case study developed as a first step in an evaluation process characterized by investments in joint products, the evaluation shows some limitations that are highlighted below.
A first limitation concerns the type of benefits, which in this case study was limited to tourism-related benefits only. A second limitation is inherent in the technique used to assess the risks. In this exercise, a simplified approach based on simulations through sensitivity has been adopted. Indeed, it would have been necessary to analyze each cost and benefit component, and to establish the probability of abnormal values occurring on the basis of the observed variability.
A final limitation concerns the relative conciseness of the analysis of the results achieved, which is partly due to the fact that the assessment of the case in question is not a central part of the ongoing work.

4. Conclusions

Sediment removal from reservoirs and its innovative application for beach nourishment projects contribute to a circular economy philosophy by transforming sediments from waste into by-product resources.
Many infrastructure investments generate environmental diseconomies, in some cases these diseconomies can become joint products for other production processes, leading to probable economies of scope that affect the feasibility of the investment using the joint product.
The paper analyzed the consequences, in terms of technical-economic assessment, of introducing an environmental diseconomy used as a joint product in an investment to improve the environmental sustainability of coastal areas.
When the environmental diseconomy resulting from an infrastructure investment can be used as an input into another production process, the presence of any economies of scope changes the consolidated approach to valuation.
In the present case, the cost-benefit assessment is reduced to a comparison between the value of the positive externality and the difference between the transport costs of the joint investment and the extraction costs of the i-th investment.
In particular, the work in hand led to the following main conclusions:
  • The solution to the problem of sediment accumulation in reservoirs can be considered a mandatory choice of the policy maker, at least in the long term, given the difficulty, both economic and environmental, of creating new reservoirs;
  • Investments that are targeted at solving the accumulation problem, are characterized by the possible existence of scope economies;
  • The use of the sediments for the beach nourishment of coastlines subject to erosion is certainly a case in which scope economies are present;
  • In the case of scope economies, the investment decision must be made following the assessment of all alternatives, which are directed to alternative productions, taking advantage of the same scope economies;
  • The cost-benefit assessment is reduced to a comparison between the value of the positive externality and the difference between the transport costs of the joint investment and the extraction costs of the i-th investment;
  • The results of the cost-benefit analysis carried out only on the initial comparison between ‘with’ and ‘without’ assumptions, show a possible sustainability of the proposed investment, even in the presence of highly unfavorable scenarios;
  • The proposed investment is economically feasible for a relatively short distance dam-coastline. In the study case a maximum feasible distance (53.8 km with a linear demand model, 55 km with a logistic demand model, 35.7 km in presence of highly unfavorable scenarios) greater than the real distance (35 km) was obtained;
  • The method applied to the case study is transferable to any scenario of beach nourishment project with sediments dredged from an artificial reservoir once the compatibility and the availability of suitable volumes of sediment has been verified.
The evaluation carried out in the case study is only the first step in a longer and more complex process at the end of which it will be possible to establish whether and to what extent the hypothesis being evaluated is actually sustainable from both an economic and social point of view.

Author Contributions

Conceptualization, A.D.V., M.B., B.M. and C.I.; methodology, M.B., C.I.; writing, A.D.V., M.B, and C.I.; supervision: B.M. All authors have read and agreed to the published version of the manuscript.

Funding

This research received no external funding.

Acknowledgments

In this section you can acknowledge any support given which is not covered by the author contribution or funding sections. This may include administrative and technical support, or donations in kind (e.g., materials used for experiments).

Conflicts of Interest

The authors declare no conflict of interest.

References

  1. De Vincenzo, A.; Covelli, C.; Molino, A.J.; Pannone, M.; Ciccaglione, M.; Molino, B. Long-Term Management Policies of Reservoirs: Possible Re-Use of Dredged Sediments for Coastal Nourishment. Water 2019, 11, 15. [Google Scholar] [CrossRef] [Green Version]
  2. Pannone, M.; De Vincenzo, A. Stochastic numerical analysis of anomalous longitudinal dispersion and dilution in shallow decelerating stream flows. Stoch. Environ. Res. Risk Assess. 2015, 29, 2087–2100. [Google Scholar] [CrossRef]
  3. De Vincenzo, A.; Brancati, F.; Pannone, M. An experimental analysis of bed load transport in gravel-bed braided rivers with high grain Reynolds numbers. Adv. Water Resour. 2016, 94, 160–173. [Google Scholar] [CrossRef]
  4. Mirauda, D.; De Vincenzo, A.; Pannone, M. Statistical characterization of flow field structure in evolving braided gravel beds. Spat. Stat. 2019, 34, 100268. [Google Scholar] [CrossRef]
  5. Ezz-Aldeen, M.; Hassan, R.; Ali, A.; Al-Ansari, N.; Knutsson, S. Watershed Sediment and Its Effect on Storage Capacity: Case Study of Dokan Dam Reservoir. Water 2018, 10, 858. [Google Scholar] [CrossRef] [Green Version]
  6. Ali, M.; Sterk, G.; Seeger, M.; Boersema, M.; Peters, P. Effect of hydraulic parameters on sediment transport capacity in overland flow over erodible beds. Hydrol. Earth Syst. Sci. 2012, 16, 591–601. [Google Scholar] [CrossRef] [Green Version]
  7. ICOLD. Sedimentation and Sustainable Use of Reservoirs and River Systems. 2009. Available online: https://www.icold-cigb.org/userfiles/files/CIRCULAR/CL1793Annex.pdf (accessed on 7 May 2020).
  8. De Vincenzo, A.; Molino, A.J.; Molino, B.; Scorpio, V. Reservoir rehabilitation: The new methodological approach of Economic Environmental Defence. Int. J. Sediment Res. 2017, 32, 288–294. [Google Scholar] [CrossRef]
  9. Brandt, S.A. Classification of geomorphological effects downstream of dams. Catena 2000, 40, 375–401. [Google Scholar] [CrossRef]
  10. Carling, P. The concept of dominant discharge applied to two gravel-bed streams in relation to channel stability thresholds. Earth Surf. Process. Landforms 1998, 13, 355–367. [Google Scholar] [CrossRef]
  11. Grant, G.E.; Schmidt, J.C.; Lewis, S.L. A Geological Framework for Interpreting Downstream Effects of Dams on Rivers. In A Peculiar River: Geology, Geomorphology, and Hydrology of the Deschutes River, Oregon; O’Connor, J.E., Grant, G.E., Eds.; American Geophysical Union (AGU): Washington, DC, USA, 2003. [Google Scholar]
  12. Graf, W.L. Downstream hydrologic and geomorphic effects of large dams on American rivers. Geomorphology 2006, 79, 336–360. [Google Scholar] [CrossRef]
  13. Morris, G.L.; Fan, J. Reservoir Sedimentation Handbook, Design and Management of Dams, Reservoirs and Watersheds for Sustainable Use; McGraw-Hill: New York, NY, USA, 1998. [Google Scholar]
  14. Williams, G.P.; Wolman, M.G. Downstream Effects of Dams on Alluvial Rivers; U.S. Geological Survey Professional Paper 1286; U.S. Geological Survey: Reston, VA, USA, 1984. [CrossRef] [Green Version]
  15. Andredaki, M.; Georgoulas, A.; Hrissanthou, V.; Kotsovinos, N. Assessment of reservoir sedimentation effect on coastal erosion in the case of Nestos River, Greece. Int. J. Sediment Res. 2014, 29, 34–48. [Google Scholar] [CrossRef] [Green Version]
  16. Kondolf, G.M. PROFILE: Hungry Water: Effects of Dams and Gravel Mining on River Channels. Environ. Manag. 1997, 21, 533–551. [Google Scholar] [CrossRef] [PubMed]
  17. Willis, C.M.; Griggs, G.B. Reductions in Fluvial Sediment Discharge by Coastal Dams in California and Implications for Beach Sustainability. J. Geol. 2003, 111, 167–182. [Google Scholar] [CrossRef]
  18. Hsu, T.-W.; Lin, T.-Y.; Tseng, I.-F. Human Impact on Coastal Erosion in Taiwan. J. Coast. Res. 2007, 234, 961–973. [Google Scholar] [CrossRef]
  19. Syvitski, J.P.M.; Vörösmarty, C.J.; Kettner, A.J.; Green, P.A. Impact of Humans on the Flux of Terrestrial Sediment to the Global Coastal Ocean. Science 2005, 308, 376–380. [Google Scholar] [CrossRef]
  20. Bergillos, R.J.; Rodríguez-Delgado, C.; Millares, A.; Ortega-Sánchez, M.; Losada, M.A. Impact of river regulation on a Mediterranean delta: Assessment of managed versus unmanaged scenarios. Water Resour. Res. 2016, 52, 5132–5148. [Google Scholar] [CrossRef]
  21. Molino, B.; Viparelli, R.; De Vincenzo, A. Effects of river network works and soil conservation measures on reservoir silting-up. Int. J. Sediment Res. 2007, 22, 273–281. [Google Scholar]
  22. De Vincenzo, A.; Molino, B.; Viparelli, R.; Caramuscio, P. A methodological approach for estimating turbidity in a river. Int. J. Sediment Res. 2011, 26, 112–119. [Google Scholar] [CrossRef]
  23. Carone, M.T.; Greco, M.; Molino, B. A sediment-filter ecosystem for reservoir rehabilitation. Ecol. Eng. 2006, 26, 182–189. [Google Scholar] [CrossRef]
  24. Covelli, C.; Cimorelli, L.; Pagliuca, D.N.; Molino, B.; Pianese, D. Assessment of Erosion in River Basins: A Distributed Model to Estimate the Sediment Production over Watersheds by a 3-Dimensional LS Factor in RUSLE Model. Hydrology 2020, 7, 13. [Google Scholar] [CrossRef] [Green Version]
  25. Scheuerlein, H. Downstream effects of dam construction and reservoir operation. In Proceedings of the 6th International Symposium on River Sedimentation, Management of Sediment: Philosophy, Aims, and Techniques, New Delhi, India, 7–11 November 1995; Balkema Rotterdam: Rotterdam, The Netherlands, 1995; pp. 1101–1108. [Google Scholar]
  26. Lai, J.S. Shen HW Flushing sediment through reservoirs. J. Hydraul. Res. 1996, 34, 237–255. [Google Scholar] [CrossRef]
  27. Chang, F.-J.; Lai, J.-S.; Kao, L.-S. Optimization of operation rule curves and flushing schedule in a reservoir. Hydrol. Process. 2003, 17, 1623–1640. [Google Scholar] [CrossRef]
  28. Hotchkiss, R.H.; Huang, X. Hydrosuction Sediment-Removal Systems (HSRS): Principles and Field Test. J. Hydraul. Eng. 1995, 121, 479–489. [Google Scholar] [CrossRef]
  29. Molino, B.; De Vincenzo, A.; Ferone, C.; Messina, F.; Colangelo, F.; Cioffi, R. Recycling of Clay Sediments for Geopolymer Binder Production. A New Perspective for Reservoir Management in the Framework of Italian Legislation: The Occhito Reservoir Case Study. Materials 2014, 7, 5603–5616. [Google Scholar] [CrossRef]
  30. Messina, F.; Ferone, C.; Molino, A.; Roviello, G.; Colangelo, F.; Molino, B.; Cioffi, R. Synergistic recycling of calcined clayey sediments and water potabilization sludge as geopolymer precursors: Upscaling from binders to precast paving cement-free bricks. Constr. Build. Mater. 2017, 133, 14–26. [Google Scholar] [CrossRef]
  31. Molino, B.; Bufalo, G.; De Vincenzo, A.; Ambrosone, L. Semiempirical Model for Assessing Dewatering Process by Flocculation of Dredged Sludge in an Artificial Reservoir. Appl. Sci. 2020, 10, 3051. [Google Scholar] [CrossRef]
  32. Alexandrakis, G.; Manasakis, C.; Kampanis, N.A. Valuating the effects of beach erosion to tourism revenue. A management perspective. Ocean Coast. Manag. 2015, 111, 1–11. [Google Scholar] [CrossRef]
  33. Post, J.C.; Lundin, C.G. Guidelines for Integrated Coastal Zone Management; World Bank: Washington, DC, USA, 1996. [Google Scholar] [CrossRef]
  34. Hernández-Delgado, E.A.; Rosado-Matías, B.J. Long-Lasting Impacts of Beach Renourishment on Near shore Urban Coral Reefs: A Glimpse of Future Impacts of Shoreline Erosion, Climate Change and Sea Level Rise. Ann. Mar. Biol. Res. 2017, 4, 1021. [Google Scholar]
  35. Peterson, C.H.; Bishop, M.J. Assessing the Environmental Impacts of Beach Nourishment. Bioscience 2005, 55, 887. [Google Scholar] [CrossRef] [Green Version]
  36. Ministero dell’Ambiente e Della Tutela del Territorio e del Mare; Legislative Decree No. 173; Gazzetta Ufficiale della Repubblica Italiana: Rome, Italy, 2016.
  37. Mishan, E.J. Cost-Benefit Analysis; Allen and Unwin: London, UK, 1971. [Google Scholar]
  38. Dasgupta, A.K.; Pearce, D.W. Cost-Benefit Analysis; Springer: Cham, Switzerland, 1972. [Google Scholar]
  39. Hufschmidt, M.M. Benefit-Cost Analysis: 1933–1985. J. Contemp Water Res. Educ. 2000, 116, 42–49. [Google Scholar]
  40. Palmieri, A.; Shah, F.; Annandale, G.; Dinar, A. Reservoir Conservation Volume I: The RESCON Approach; World Bank: Washington, DC, USA, 2003; Available online: http://documents.worldbank.org/curated/en/819541468138875126/pdf/349540v10Reservoir0conservation0RESCON.pdf (accessed on 7 May 2020).
  41. Kawashima, S. Conserving reservoir water storage: An economic appraisal. Water Resour. Res. 2007, 43, w05417. [Google Scholar] [CrossRef]
  42. WWAP (United Nations World Water Assessment Programme). The United Nations World Water Development Report 2014: Water and Energy; UNESCO: Paris, France, 2014. [Google Scholar]
  43. WWAP (World Water Assessment Programme). The United Nations World Water Development Report 4: Managing Water under Uncertainty and Risk; UNESCO: Paris, France, 2012. [Google Scholar]
  44. Dean, R.G. Realistic economic benefits from beach nourishment. Coast. Eng. Proc. 1988, 1, 116. [Google Scholar] [CrossRef] [Green Version]
  45. Houston, J.R. The Economic Value of Beaches—A 2013 update. Shore Beach 2013, 81, 3–11. [Google Scholar]
  46. Blackwell, B.D. The Value of a Recreational Beach Visit: An Application to Mooloolaba Beach and Comparisons with Other Outdoor Recreation Sites **This paper does not necessarily reflect the views of the NCME or AMC. Econ. Anal. Policy 2007, 37, 77–98. [Google Scholar] [CrossRef]
  47. Gopalakrishnan, S.; Smith, M.D.; Slott, J.M.; Murray, A.B. The value of disappearing beaches: A hedonic pricing model with endogenous beach width. J. Environ. Econ. Manag. 2011, 61, 297–310. [Google Scholar] [CrossRef] [Green Version]
  48. Finkl, C.W. What Might Happen to America’s Shorelines if Artificial Beach Replenishment is Curtailed: A Prognosis for Southeastern Florida and Other Sandy Regions Along Regressive Coasts. J. Coast Res. 1996, 12, III–IX. [Google Scholar]
  49. NOAA Coastal Services Center Institute for Water Resources, U.S. Army Corps of Engineers Economic and Social Effects of Changing Shorelines in the North Atlantic Region Final Report 2010, June 30. Available online: https://www.google.com.tw/url?sa=t&rct=j&q=&esrc=s&source=web&cd=&ved=2ahUKEwj976HTsK7rAhVXfSsKHb_BAA0QFjAAegQIBBAB&url=ftp%3A%2F%2Fftp.coast.noaa.gov%2Fpub%2Fsocioeconomic%2FNSMS%2FNorth%2520Atlantic%2FFinal%2520Coastal%2520Erosion%2520Report%2520June%252030.pdf&usg=AOvVaw25ioy2QzSiaaQZL7N8tYNE (accessed on 7 May 2020).
  50. Smith, M.D.; Slott, J.M.; McNamara, D.E.; Murray, A.B. Beach nourishment as a dynamic capital accumulation problem. J. Environ. Econ. Manag. 2009, 58, 58–71. [Google Scholar] [CrossRef]
  51. Lent, L.K. Economics of the Shoreline, An Annotated Bibliography for the National Shoreline Management Study; IWR Report 04-NSMS-5; USACE: Washington, DC, USA, 2004.
  52. Lupino, P.; Riccardi, C.; Scaloni, P.; Cost-Benefit Analysis for Beach Nourishment Work. Osservatorio Regionale dei Litorali Laziali Report 2005. Available online: https://pdfs.semanticscholar.org/6cfe/ec17dd18de03521dce0d54af85dc999ef408.pdf (accessed on 7 May 2020).
  53. Chrysalis Consulting Inc. The Economic Effects of a Five Year Nourishment Program for the Ocean Beaches of Delaware, Updated, research conducted for Delaware’s Department of Natural Resources and Environmental Control. 2007. Available online: http://www.dnrec.delaware.gov/swc/Shoreline/Documents/2007%20The%20Economic%20Effects%20of%20a%20Five%20Year%20Nourishment%20Program.pdf (accessed on 7 May 2020).
  54. NRC (National Research Council). Reducing Coastal Risk on the East and Gulf Coasts; The National Academies Press: Washington, DC, USA, 2014. [Google Scholar] [CrossRef] [Green Version]
  55. Zoppi, C.; Zanuttigh, B. Analisi preliminare dell’utilizzo delle sabbie dragate dal fiume Po per il ripascimento di spiagge del litorale emiliano-romagnolo. In Proceedings of the XXXIII Convegno Nazionale di Idraulica e Costruzioni Idrauliche, University of Brescia, Brescia, Italy, 10–15 September 2012. (In Italian). [Google Scholar]
  56. Panzar, J.C. Willig RD Economies of Scope. Am. Econ. Rev. 1981, 71, 268–272. [Google Scholar]
  57. Goldhar, J.D.; Jelinek, M. Plan for Economies of Scope. Harv. Bus. Rev. 1983, 61, 141–148. [Google Scholar]
  58. King, P.G. The Economics of Regional Sediment Management in Ventura and Santa Barbara Counties: A Pilot Study. Interim Report to the Coastal Sediment Management Workgroup, San Francisco, 2006. Available online: https://calisphere.org/item/ark:/86086/n2s181fq/ (accessed on 17 August 2020).
  59. Momsen, J.H.; Sinclair, M.T.; Stabler, M. The Economics of Tourism. Econ. Geogr. 1999, 75, 211. [Google Scholar] [CrossRef]
  60. Antonelli, U.; Paltrinieri, D.; Viglione, M. Marine Sand Deposit, Nourishment Projects and Economic Value of Beaches in Italy—A New Policy Approach for Coastal Protection and Suitable Tourism. In Proceedings of the National Conference on Beach Preservation Technology, Sarasota, FL, USA, 1–3 February 2006. [Google Scholar]
  61. Committee on Beach Nourishment and Protection, Marine Board, Commission on Engineering and Technical Systems; National Research Council. Beach Nourishment and Protection; The National Academies Press: Washington, DC, USA, 1995. [Google Scholar]
  62. European Commission. Guide to Cost-Benefit Analysis in Investment Projects; Directorate-General for Regional and Urban Policy: Brussels, Belgium, 2015. [Google Scholar]
  63. McConnell, K.E. Congestion and Willingness to Pay: A Study of Beach Use. Land Econ. 1977, 53, 185. [Google Scholar] [CrossRef]
  64. Massiani, J. How to Value the Benefits of a Recreational Area? A Cost-Benefit Analysis of the Conversion of a Brownfield to a Public Beach in Muggia (Italy). Rev. Econ. Anal. 2013, 5, 86–102. [Google Scholar]
  65. Rosskopf, C.M.; Di Paola, G.; Atkinson, D.E.; Rodríguez, G.; Walker, I.J. Recent shoreline evolution and beach erosion along the central Adriatic coast of Italy: The case of Molise region. J. Coast. Conserv. 2017, 22, 879–895. [Google Scholar] [CrossRef]
  66. Herman, J.D.; Reed, P.; Zeff, H.B.; Characklis, G.W. How Should Robustness Be Defined for Water Systems Planning under Change? J. Water Resour. Plan. Manag. 2015, 141, 04015012. [Google Scholar] [CrossRef]
  67. Kwakkel, J.; Pruyt, E. Exploratory Modeling and Analysis, an approach for model-based foresight under deep uncertainty. Technol. Forecast. Soc. Chang. 2013, 80, 419–431. [Google Scholar] [CrossRef]
Figure 1. The general conceptual framework.
Sustainability 12 06820 g001
Figure 2. Map of the Molise Region and Guardialfiera reservoir location.
Sustainability 12 06820 g002
Figure 3. Guardialfiera reservoir location.
Sustainability 12 06820 g003
Figure 4. (a) Average value of cost components (EUR). (b) Total benefits trend (EUR). (c) Net benefits trend (EUR). (d) Discounted cumulative net benefits (EUR).
Sustainability 12 06820 g004aSustainability 12 06820 g004b
Figure 5. Internal rate of return (IRR) average elasticity (Δ variables’ value ± 10%).
Sustainability 12 06820 g005
Table 1. List of acronyms.
AcronymsKey VariableUnit
CBACost Benefit Analysis
RESCONREServoir CONservation
NPVNet Present Value
IRRInternal Rate of Return%
TECTotal Economic Cost
CFConversion Factors
DRDRedging cost
BNBeach Nourishment cost
ASAvailable Sedimentton
NNBNew Nourished Beachm2
VOCVehicles Operating Cost
SQQuantity of Sediment to be movedm3
ECEnvironmental Costs
Table 2. Model parameters and their values in the study case.
ParameterDescriptionValuesSource
δ
(km)
actual distance from the coast and Liscione Dam35field study
dmax (km)maximum achievable distance under the constraints53.7–55.4model
θamount of compatible sediment from sediment unit0.7field study
μm3 to m2 of new nourished beach15field study
α
(ton/m3)
density2.0Field study
€/Kmunit cost per kilometer (€)2.58**
ton/Vtransport capacity in tons per vehicle40standard
€/m2value in euro per square meter of new beach available per day1.39field study
share of value added in turnover0.5I/O matrix *
λvalue of the multiplicative effects3.0I/O matrix *
dayslength of the tourist season 90field study
degree of facilities utilization during the season0.7field study
* See 57 and 62. ** Law 133/2008 “Operating Costs of the Road Transport Companies”.
Table 3. Main parameters of the solution.
ParametersDemand
LinearLogistic
πDiscount rate5%5%
ρ ¯ IRR7.0%7.0%
NPV3,602,1244,705,241
d max * Max distance (km)53.755.40
δReal distance (km)3535
d max * >δConditionYESYES

